1. Introduction
A time series (or dynamic series) refers to a series of values of the same statistical index arranged in order of their occurrence time. The main purpose of time series analysis is to predict the future based on the existing historical data. Time series analysis is based on the continuity of the objective development of the law, the use of historical data in the past, to further speculate the future development trend. Sequential pattern mining (SPM) refers to the mining of high frequency patterns in relative time, which is mainly applied to discrete sequences [
1]. Time series contains both the data points and the time information of the data points. The characteristics of time series appropriately satisfy the data attributes required by SPM. Therefore, SPM is an effective and important data mining method for analyzing time series.
The existing SPM algorithms are mainly applied to structured data, and cannot be applied directly to unstructured data. Text data is a kind of typical unstructured data. In industrial, commercial and other fields, a large amount of text data has not been fully utilized. There are two main differences between textual data and numerical data: (1) textual data is unstructured and requires considerable memory, occupying larger storage than numerical data. Unstructured data structures are irregular or incomplete, without predefined data models, and cannot be represented by two-dimensional logical tables; (2) expression forms are numerous. The same object can be expressed in many forms. SPM is an effective way to mine text records with time stamps, however, the traditional SPM method considers the object to be completely different, and the relationship between the two objects is only the same and different. This makes it difficult for the text data to be applied to SPM. Because of the nature of the language, there are many ways to express the same event. This leads to few frequent projects and it is difficult to find sequence patterns. Therefore, we proposed an SPM algorithm based on text similarity measurement. This study uses a text similarity measurement model to measure the similarity of text data, classifying items of the same meaning but different expressions into one category.
Short texts are often the main application data of SPM. At present, the text similarity measurement model is not very effective in short texts. We proposed a text similarity measure method based on the word embedding distance model. The word2vec model has attracted much attention in recent years, and has been widely applied in natural language processing (NLP), achieving good results. However, word2vec is primarily used for the word embedding of words. We used word2vec to obtain the word embedding of words to calculate the Euclidean distance between words. Then, through the distance between words we obtained the distance between texts, which represents text similarity. This paper compared and analyzed the classical method of text similarity measurement. Compared with other methods, our model achieves better results in short text similarity measure.
On the basis of text similarity measurement, we established a sequential pattern mining algorithm with an event window. The initial sequence pattern mining only considers the sequence formed by two adjacent events. In fact, this hard constraint is not practical, because events that have an interval between them also have a sequential relationship in time. We proposed the concept of an event window, which refers to the number of events between two events. SPM with event windows can uncover more sequential patterns. The sequence support degree is a standard for judging whether a sequence can become a pattern. Because mining objects become text data, this paper proposed a new method for computing the sequence support degree.
Finally, we used the fault text records of a certain aircraft to test our algorithm. Many fault text records have been accumulated for aircraft maintenance support. Through the algorithm proposed in this paper, many fault sequence patterns have been mined. These fault sequential patterns have important guiding significance for predicting aircraft failures, performing inspections and taking preventive measures. The experiment shows that the algorithm is effective in mining sequential patterns in text and has good robustness.
The algorithm proposed in this paper has wide applicability. It can be used in text mining in many fields to discover sequential patterns. That is to say, our SPM algorithm based on text analysis can be applied to text time series data in many fields such as industry, business, finance, auditing and so on.
The other chapters of this paper are arranged below:
Section 2 is literature review, including the development and application of the SPM algorithm, text similarity measurement method and text data-based SPM algorithm.
Section 3 is the establishment of the text similarity measurement model based on the word embedding distance model, including the introduction of other similarity measurement methods and their shortcomings.
Section 4 is the establishment of SPM algorithm based on text data.
Section 5 is the experimental part, including the validation of the algorithm effectiveness and robustness, and the impact of different threshold levels on mining results.
Section 6 is a discussion; the first part is to compare the existing text-based SPM algorithm, the second part is to discuss the application of the proposed method in business activities and decision.
Section 7 is the conclusion.
2. Literature Review
2.1. Sequential Pattern Mining Algorithm
Agrawal and Srikant [
1] first proposed the concept of sequential pattern mining (SPM) and proposed the aprioriall, apriorisome and Generalized Sequential Pattern (GSP) algorithms. The aprioriall algorithm is an algorithm based on a priori property. It uses a layer-by-layer search algorithm to mine patterns, and uses the concept of support degree to discover frequent patterns. The apriorisome algorithm can be seen as an improvement on the aprioriall algorithm. For lower support and longer sequences, the apriorisome algorithm is better [
2]. Compared with the aprioriall algorithm, the GSP algorithm does not need to pre-compute frequent sets in data transformation process [
3]. Zaki [
4] proposed the SPADE algorithm based on a vertical data storage format; SPADE is an improvement on the GSP algorithm. In the process of mining, it only needs to traverse the database in turn, which saves computing time greatly. Han et al. [
5] transformed the sequential database into a projection database to effectively compress the data and proposed the freespan algorithm. Pei et al. [
6] improved this algorithm, conducted frequent prefix projection, reduced the scale of the projection database and proposed the prefixspan algorithm. Yan et al. [
7] used the mapreduce programming model to propose a parallel mining algorithm called PACFP that is based on constrained frequent patterns. Xiao et al. [
8,
9,
10] proposed an algorithm of association rules with time windows and used this algorithm to mine strong rules.
SPM was first applied to supermarket shopping data to determine the buying rules of customers. Subsequently, it was developed in many other fields, such as natural disaster prediction, Web access pattern prediction, disease diagnosis, etc. In addition, SPM has been widely used in practical problems. Aloysius and Binu [
11] proposed a method to mine user purchase patterns using the PrefixSpan algorithm, and placed products on shelves according to the order of purchase patterns. Wright et al. [
12] used sequential pattern mining to automatically deduce the time relationship between drugs and generate rules to predict the next drug used by patients. For a library user borrowing transaction database, Fu [
13] used sequence pattern mining to realize the analysis of user borrowing behavior, which has a certain reference significance for personalized book recommendations and library purchasing arrangements. Liu [
14] used the sequential pattern mining method to analyze the influence of driving environment factors and driver behavior factors on traffic accident results, and realized the prediction and analysis of traffic accident severity.
2.2. Text Mining and Similarity Measurement
At present, there are many studies on Chinese text mining. Through text mining, Wang [
15] discovered that weather is the main factor causing turnout failures and established a failure prediction method based on a Bayesian network. According to the aviation maintenance database, Fan [
16] established the trend map of the maintenance data curve using the rough set and the time series similarity method, and realized the prediction function of the future failure rate of the aircraft components. Runze et al. [
17] proposed a defect text classification method based on the k-nearest neighbors (KNN) algorithm, adding historical defective text information in the circuit breaker state evaluation to make a comprehensive evaluation.
It is very important to measure the similarity of text accurately regarding document retrieval, news classification and clustering [
18,
19,
20] and multilingual document matching [
21]. Salton and Buckley [
22] first proposed a combination method based on word frequency weight, word standardization and corpus statistics. Term frequency-inverse document frequency (TF-IDF) can convert the text into a high-dimensional and sparse word matrix, and use cosine similarity to calculate the text similarity; however, it does not consider the synonym and semantic relation between words, and it easily undergoes “dimension disaster”. Blei et al. [
23] proposed the implicit de Lickley distribution model (latent Dirichlet allocation, LDA), and established a three-layer Bayesian probability model structure composed of documents, topics and words. LDA can uncover potential themes in the corpus; however, it does not consider the order relation between words. Hinton [
24] first proposed the concept of word embedding and used it to solve the problem of “dimension disaster”. Mikolov et al. and Pennington et al. [
25,
26] proposed the word2vec model, and established the continuous bag-of-words model and the skip-gram model. Based on the word2vec model, Le and Mikolov [
27] added the paragraph features to the input layer of the neural network; thus, the doc2vec model was proposed, and the word embedding of each text can be obtained by training. Kenter and Rijke [
28] combined the word embedding and BM25 algorithms to calculate the similarity of short texts.
2.3. Sequential Pattern Mining for Text Data
Sakurai and Ueno. [
29] proposed a method for mining sequential patterns in text data. The method first extracts events from text mining. The method of extracting events is as follows. First, a dictionary of key concepts is constructed. If the key concepts are matched in the text, the content described in the text is identified as the key concepts. On this basis, they use frequent sequential pattern mining algorithm to complete the mining work. They used this method in daily business report analysis.
Wong et al. [
30] studied sequential pattern mining for discovering knowledge hidden in text data. Similar to the methods used by Sakurai et al., Wong first determined the events described in the text by topic extraction. Topic extraction is done by identifying keywords. Through topic extraction, the events described in the text are determined, and then sequential pattern mining is carried out.
3. Text Similarity Measurement Based on Word Embedding Distance Model
Before measuring text similarity, the text must be expressed mathematically. First, the common text representation models and their shortcomings are introduced, including the bag-of-words model, topic model and doc2vec model. The above models are tested by text data to prove their defects. Then, a word embedding distance model is proposed. Through text data validation, the superior effectiveness of the proposed model over the traditional model is demonstrated.
This section is divided by subheadings. It should provide a concise and precise description of the experimental results, their interpretation, as well as the experimental conclusions that can be drawn.
3.1. Text Data Preprocessing
The existing text mining models are based on words. In English text, there is an empty septum between words; however, for Chinese text, there is no clear delimiter in the text. It is necessary to complete the work of the segmentation before the text is expressed.
At present, the common Chinese word segmentation system primarily includes Jieba participle, the Chinese Academy of Sciences (CAS) segmentation system, smallseg and snailseg. Their functions are compared in
Table 1.
After comprehensive consideration, we decided to use the Jieba segmentation tool. According to the actual situation of text data, the specialized words in the data can be added to the dictionary. First, the text data is segmented, then, the segmentation situation is analyzed, correcting the incorrect words segmentation and adding them to the dictionary.
In the result of the segmentation, there are some prepositions, conjunctions, punctuation and so on. To better measure the similarity of the text, it is necessary to consider the stop words. Various stop words vocabularies are used to remove stop words after segmentation.
3.2. Analysis of the Classical Text Similarity Measurement Model
3.2.1. Measurement of Text Similarity Based on the Bag-of-Words Model
The expression of words in the bag-of-words model is a discrete representation, also known as the one-hot representation. In this method, each word is represented as a vector of a dimension equal to the number of words in the vocabulary. In this vector, only one dimension has a value of 1, and all other elements are 0. This dimension represents the current word. For example: if there are three words in the corpus, e.g., oil, milk and beer, the vector representations of these three words are [1,0,0], [0,1,0] and [0,0,1]. That is to say, the vector dimension of the word is the sum of different words in a corpus. This model can easily cause dimension disaster. If there are 1000 different words in the corpus, the dimension of the word vector is 1000. The importance of different words in a sentence is different for measuring similarity. TF-IDF values are usually used to weight each element in the vector. In the TF-IDF model, the term frequency (
tfi,j) refers to the number of times (
ti) a word appears in a given text (
dj). The inverse document frequency (
idfi) calculation formula is as follows:
where
is the total number of texts in the corpus and
is the number of texts containing
ti in the corpus.
The TF-IDF values calculation formula is as follows:
The next step was to measure text similarity after the text is represented by the bag-of-words model. The cosine similarity was used to measure the similarity of texts. The formula is as follows:
where
Ai and
Bi represent the components of vector
A and
B, respectively.
The following two texts were used to verify the effect of the model: (1): “1号发动机散热器渗油” (Oil is seeping from the engine 1 radiator), (2): “左发滑油散热器出现漏油” (There is an oil spill in the left hair oil radiator).
Table 2 shows the results of the two text segmentations.
Based on the words appearing in the above two texts, a dictionary containing eight words is established as follows: {“1号发动机”, “的”, “散热器”, “渗油”, “左发”, “滑油散热器”, “出现”, “漏油”}, (“engine 1”, ” ’s”, ” radiator”, ”oil seepage”, “left hair”, “oil radiator”, “happen”, ”oil spill”). Thus, each text can be represented by an eight-dimensional vector: text1: [1,1,1,1,0,0,0,0], text2: [0,0,0,0,1,1,1,1]. It is ckear that these two texts are very similar; however, by this model, the similarity value between the two texts is 0.
To summarize, the bag-of-words model is disadvantageous in two aspects: (1) the dimension of the vector increases with the number of words in the text, where eventually a “dimension explosion” occurs; (2) in this model, any two words will be isolated, and it cannot reflect the semantic relationship between words or be applied to most situations.
3.2.2. Measurement of Text Similarity Based on the Topic Model
Latent semantic indexing (LSI) is a typical topic model. Its main idea is to reduce the dimension using singular value decomposition (SVD) in the concurrence matrix of word and document, so that the similarity of text can be measured by the cosine similarity of two low-dimensional vectors. The process is as follows:
where
m represents the number of words,
n represents the number of documents and
represents the co-occurrence matrix of the word documents. Matrices
and
satisfy
, in which the column vector of
U represents the left singular vector of
, and the column vector of
V represents the right singular vector of
. The singular values arranged from largest to smallest constitute the elements on the diagonal in matrix
; the off-diagonal elements in matrix
are 0, and the rank of matrix
is equal to the number of non-zero singular values.
For dimensionality reduction, the largest
k singular value is obtained, and the formula is changed as follows:
where each row in matrix
represents a word, each dimension of matrix
represents the mapping of the word in the topic and the columns in matrix
are orthogonal to each other. Each row in matrix
represents a document and each dimension of matrix
represents the mapping of a document in the topic. Through vector
, obtained from the bag-of-words model, the corresponding low-dimensional vector
is obtained.
The model was tested for similarity measurement on several texts. The model parameters were selected as follows: LSIModel (corpus_tfidf, id2word = dictionary, num_topics = 200). The result of the LSI model was worse than that of the bag-of-words model.
The LSI model has several shortcomings: (1) the interpretability of the new generation matrix is poor because the singular value decomposition is only a mathematical transformation and cannot correspond to the actual concept; (2) the LSI model is not a probabilistic model in the strict sense and is defective to a certain degree, for example, the negative number appearing in the representation cannot be explained in a practical sense. It is impossible to capture the phenomenon of polysemy; (3) this model has a worse effect when evaluating short text, which constitutes most of the text data in sequential pattern mining. Other topic models, such as latent Dirichlet allocation (LDA), did not provide better results.
3.3. Word Embedding Distance Model
3.3.1. Model Building
The word2vec model can express a word in vector form quickly and effectively through the optimized training model according to the given corpus. Word2vec provides two training models, namely, the continuous bag-of-words model (CBOW) and skip-gram. Combined with the optimization technology of hierarchical softmax and negative sampling, word2vec can capture the semantic features between words. The word2vec model and its applications have attracted much attention in recent years and have been widely applied in natural language processing (NLP), achieving good results.
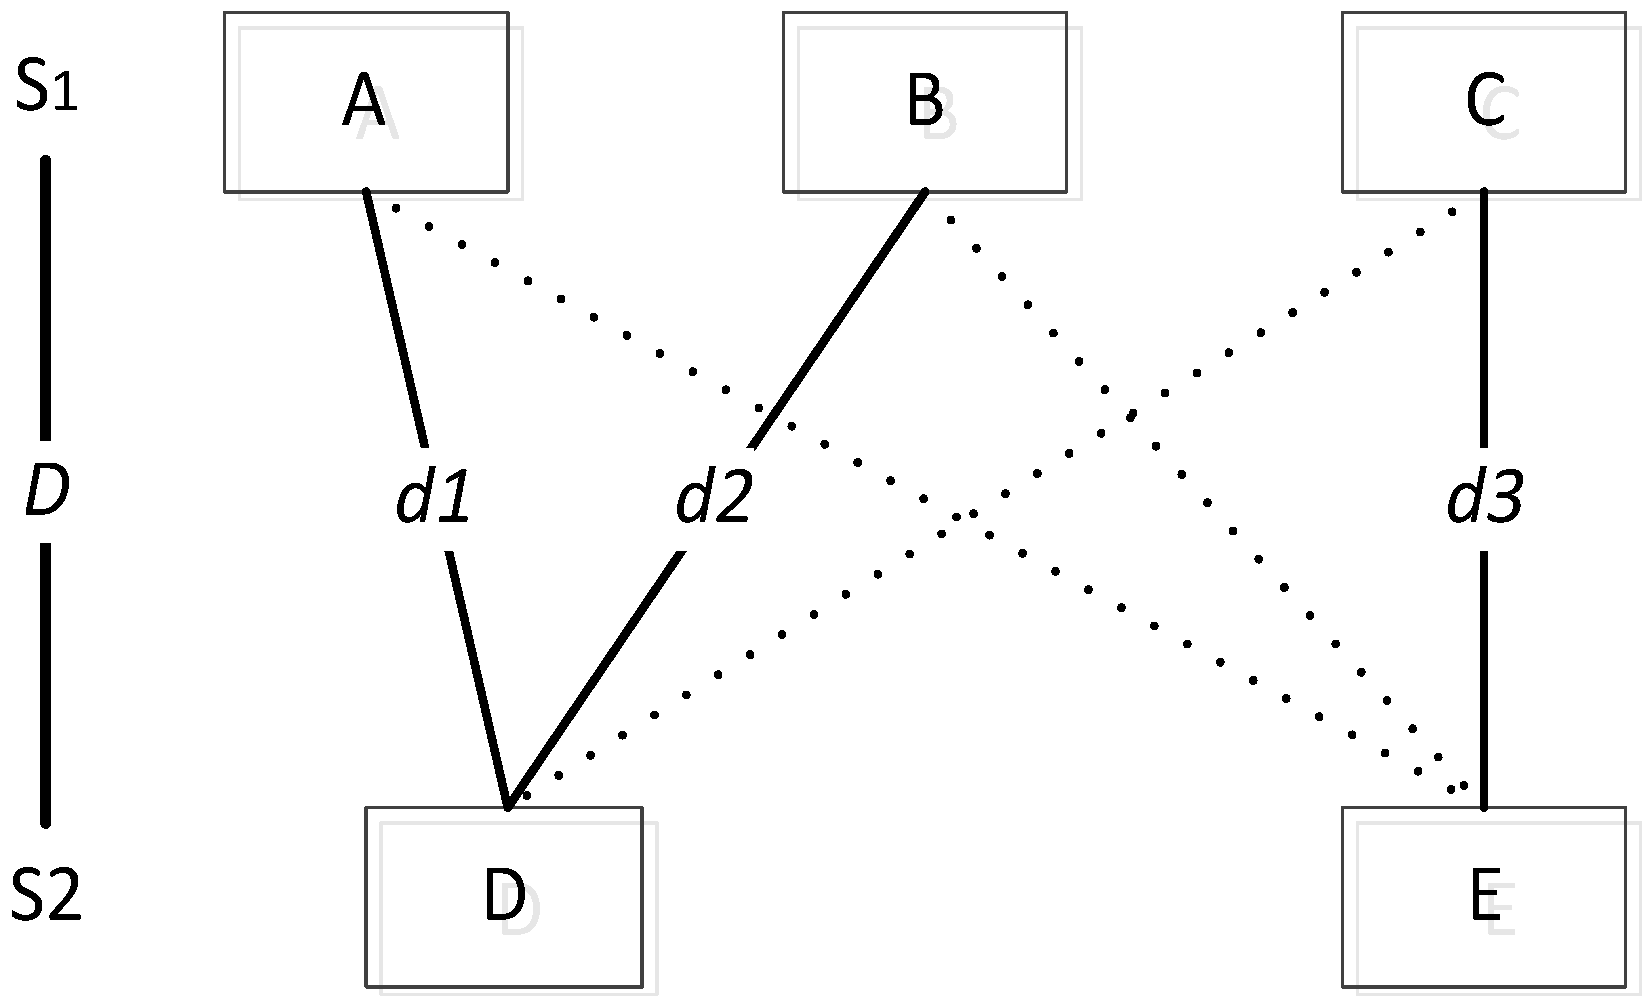
First, for a text S that has been cut by a word segmentation system, word2vec is used to obtain the word embedding matrix, , where N means that there are N words in the dictionary, and d represents the dimension of the word embedding. Therefore, the column i in the matrix represents the vector of word wi. Then, the similarity between texts can be measured. We want to use the distance between words to measure text similarity. It is obviously unreasonable to simply use the sum of the distances between the corresponding words as the text distance.
We propose the word embedding distance model: for a word
wi in text
S1, there is a corresponding word
wj in the text
S2; the distance
dij between
wi and
wj is the minimum distance between
wi and other words in
S2. Hence,
wi and
wj are called the minimum distance pair. Practically speaking, it means that one needs to calculate the distance between
wi and all the words in
S2, and pick out the minimum distance pair (
wi,
wj). All minimum distance pairs between text
S1 and
S2 need to be determined, and the distance between all pairs is accumulated as the distance between the two texts
S1 and
S2. We will illustrate this process with an example. Assume that
S1 contains the words A, B and C, and
S2 contains D and E. The distances between A and D as well as A and E are compared, and the smaller distance
d1 is obtained. Similarly,
d2 and
d3 are obtained. The sum of
d1,
d2,
d3 is the distance between
S1 and
S2 (shown in
Figure 1).
We use a linear model to describe the process:
Subject to:
where
S1 and
S2 represent dictionaries formed after the segmentation of the two texts,
d represents the distance between words,
xij is a 0–1 variable and
M is a big number.
Using this model, the distance between texts can be obtained, and the objective function value in the model is this distance. The smaller the text’s distance is, the higher the text’s similarity is. Then, the text distance is transformed into text similarity using Formula (9):
where
DMax and
DMin represent the maximum and minimum text distances in the data sets, respectively.
The computational procedures of the model are as follows:
- (1)
Obtain the word embedding matrix of texts S1 and S2 using the word2vec model, , ;
- (2)
Calculate the Euclidean distance between words to obtain the distance matrix;
- (3)
Use this model to obtain the distance and similarity between S1 and S2.
3.3.2. Model Checking
We selected 1394 text data for an aircraft fault to test our model results. First, using the word2vec model to obtain the word embedding matrix, the model input was the text segmented by the Jieba segmentation system. Then, the model was used to obtain the distance matrix between the texts. Its dimensions are 1394 × 1394 and all its diagonal elements are 0, since they represent the distance between the same word. The distance matrix is as follows:
Taking one of the text from the text data as an example, “4发振动指示器不指示,内部故障” (the fourth vibration indicator does not indicate, internal failure), the five texts closest to it are shown in
Table 3.
Table 3 shows that most of the texts describe failures of vibration indicators. This similarity measurement model provided better results than other models. We chose short text data, as the similarity measurement of short text has always been a difficult and heavily investigate topic in NLP. At the same time, for sequential patterns, short text mining is more meaningful. A good short text similarity measurement model lays the foundation for subsequent sequential pattern mining.
Table 4 shows the advantages of this model compared with other models.
4. Sequential Pattern Mining
Sequential pattern mining usually starts with a transaction database. Any event in the database should contain at least two fields, the event description and the event time (
Table 5). As with traditional algorithms, we needed to transform the database into a vertical list for the next mining (
Table 6). Events are sorted by time and assigned a number. This number represents the order of the events, and the larger the number is, the later the event occurred.
4.1. Concepts and Definitions
Some concepts and symbols are defined to describe the following steps accurately.
Event: recorded as ei, , means that belongs to the events set E.
Event sequence: recorded as , means that occurred before ej.
Events similarity: recorded as , represents the similarity degree between ei and ej.
Minimum similarity threshold: recorded as sim_min, events in similar event set need to satisfy the minimum similarity threshold to ensure that the elements of similar events are sufficiently similar.
Similarity events set: recorded as , means belongs to , any two events in the set satisfy sim_min, and all events are identified as the same type of event.
Support degree: recorded as sup(ei→ej), represents the frequency of the sequence ei→ej in the database.
Event window: refers to the number of events between two events.
Maximum event window threshold: recorded as max_win, the support degree is valid only if this sequence occurred within the maximum event window.
Sequential pattern: sequence ei→ej satisfying sup(ei→ej) min_sup will be seen as a sequential pattern.
4.2. Algorithm Framework for Sequential Pattern Mining
4.2.1. Similar Events Sets Mining
The sequential pattern mining algorithm proposed in this paper has larger differences than the traditional sequential pattern mining algorithm. Events are clearly defined in traditional sequential pattern mining algorithms. In this paper, the mining algorithm is applied to text data, which causes the same meaning events to have many forms of expression. Therefore, we first used the established text similarity model to classify events of the same meaning into one type. In this process, we proposed the concepts of the similarity threshold, similarity events set and so on.
Step1: through the text similarity measurement model, obtain the similarity matrix of events shown in
Table 7:
where Xij represents the similarity between ei and ej. Obviously, when i = j, Xij = 1.
Step2: through Formula (10), obtain the transformation similarity matrix shown in
Table 8:
Matrix element 1 represents two events that are similarity events and belong to the same similarity events. Each row represents a Similarity events set (SES), and from
Table 8, we can obtain
n SESs. Each
SES contains one or more events (
Table 9).
Step3:Table 9 shows that an event (such as
e1,
e3,
e7) may belong to several
SESs. We considered that the events of an SES belonged to the same type of event, and merged these SESs into the s SESs (
Table 10).
4.2.2. Calculation of Support Degree Based on an Event Window and SES
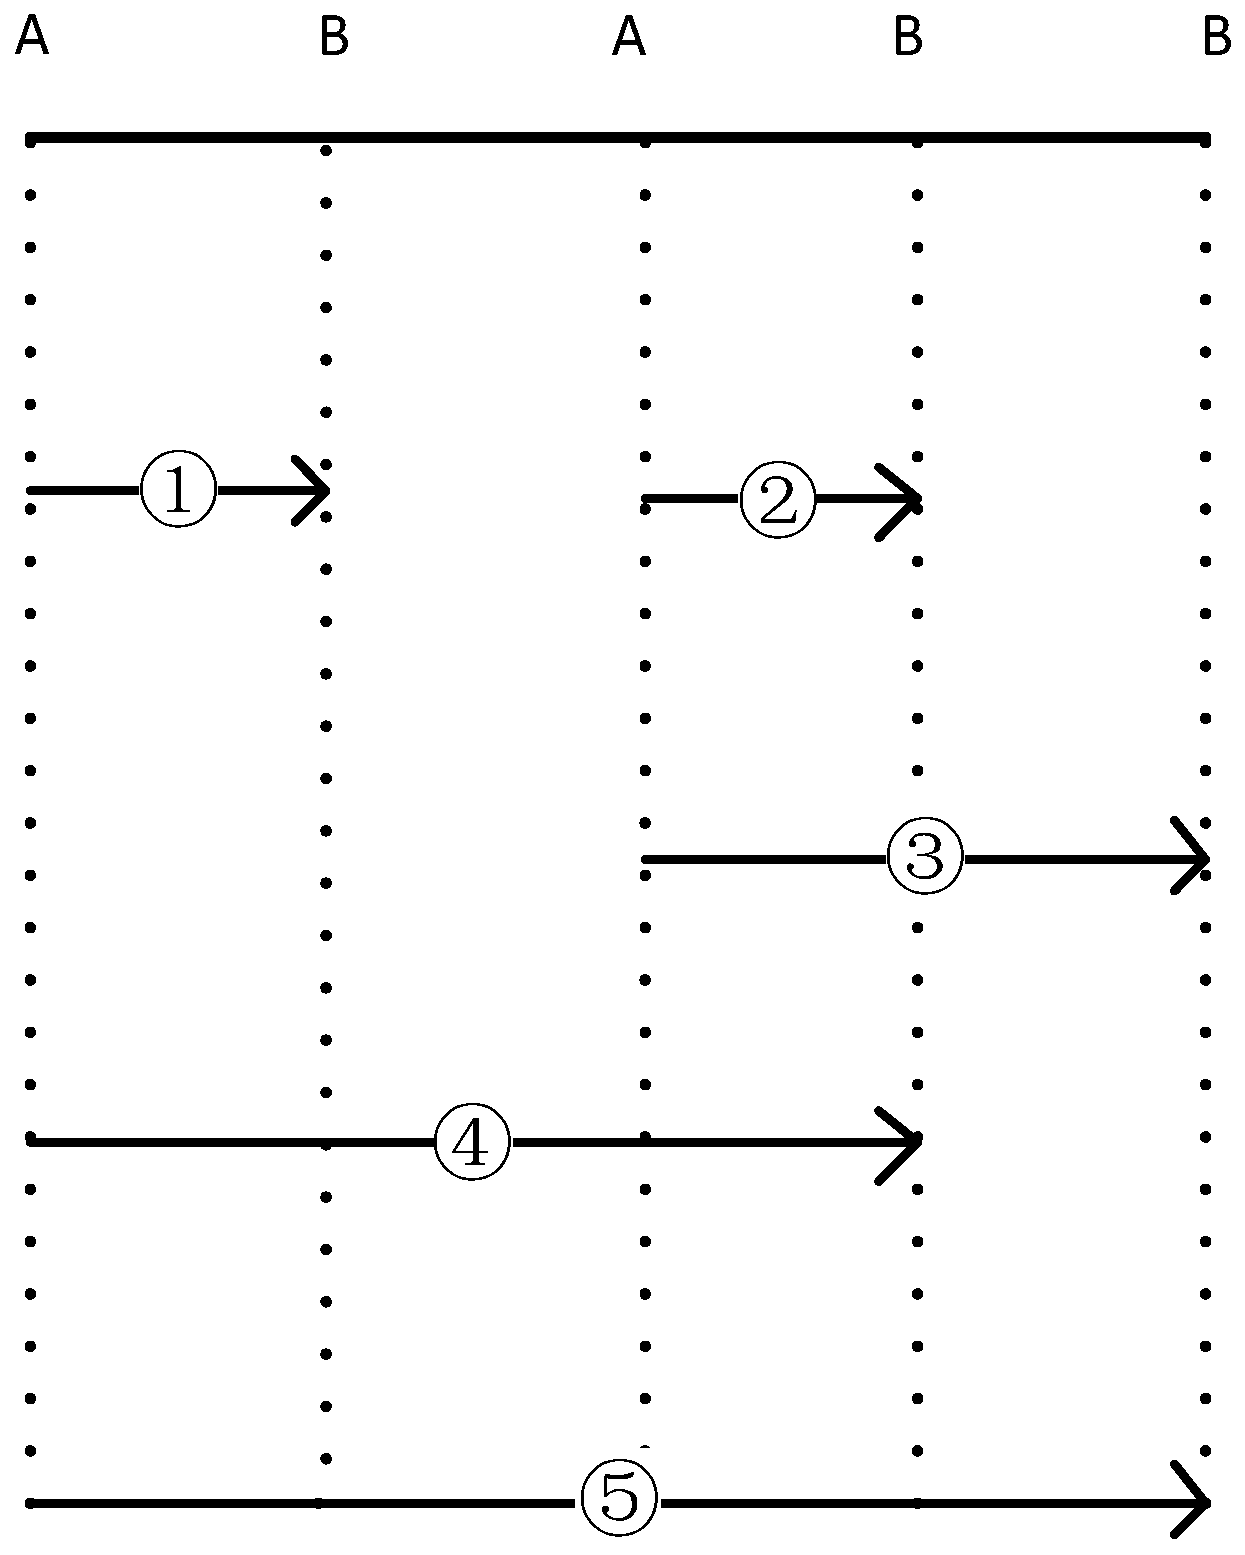
The sequence support degree refers to the frequency of the sequence in the entire sequence database; it is the criterion for determining whether the sequence is the result of mining. The initial sequence pattern mining only considers the sequence formed by two adjacent events. In fact, this hard constraint is not practical, because events that have an interval between them also have a sequential relationship in time. We proposed the concept of an event window, which refers to the number of events between two events. For sequential pattern mining with event windows, the computation of the sequence support will also change.
An example is provided to show the method for calculating the support degree with an event window.
Table 11 is part of a sequence database, and for sequence
A→
B, there are five time points in total (
Figure 2). By selecting a different maximum event window (
max_win), values changes the sequence support degree (
Table 12). In general, the larger the
max_win value is, the higher the support degree is.
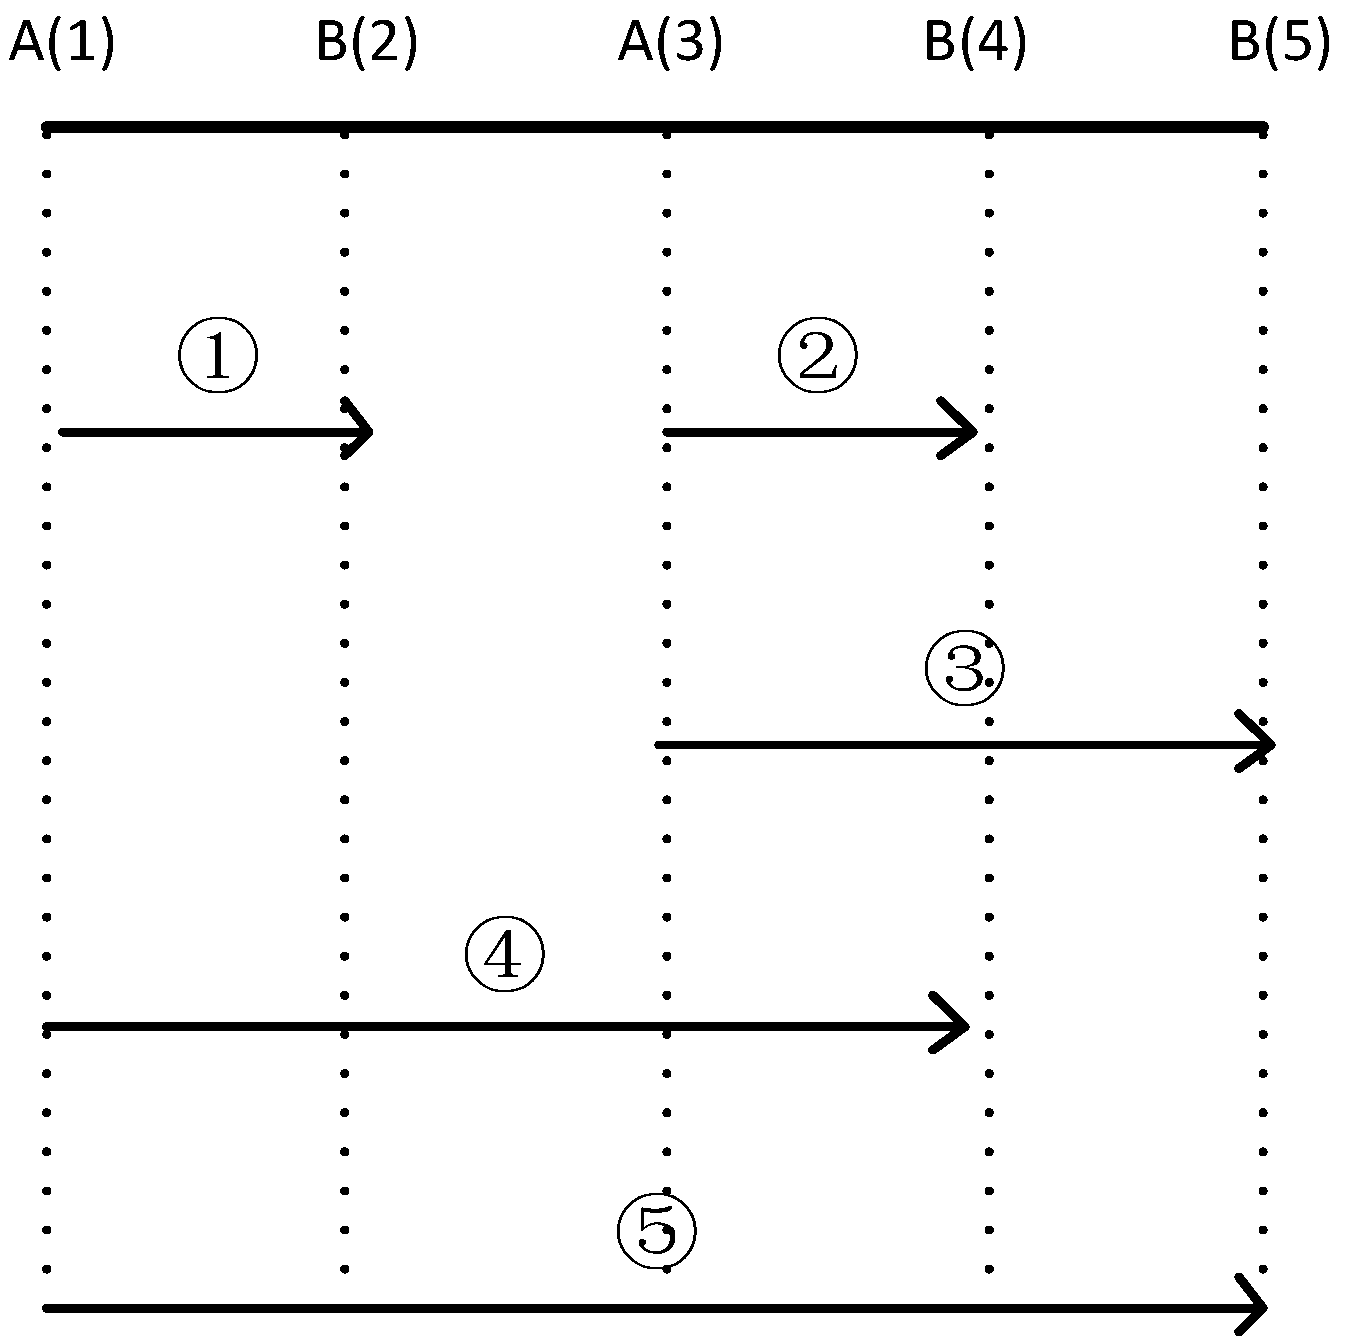
In this paper, the support degree of a sequence was not only measured by itself. As mentioned earlier, events in an SES were considered the same type of event. Suppose that event
e1 belongs to the
SESA[
e1,
e3] and
e2 belongs to
SESB[
e2,
e4,
e5]. If
max_win 3, sequences of the same meaning as
e1e2 are
e3e4,
e3e5,
e1e4,
e1e5 (
Figure 3). Therefore, the support degree of
e1e2 is five.
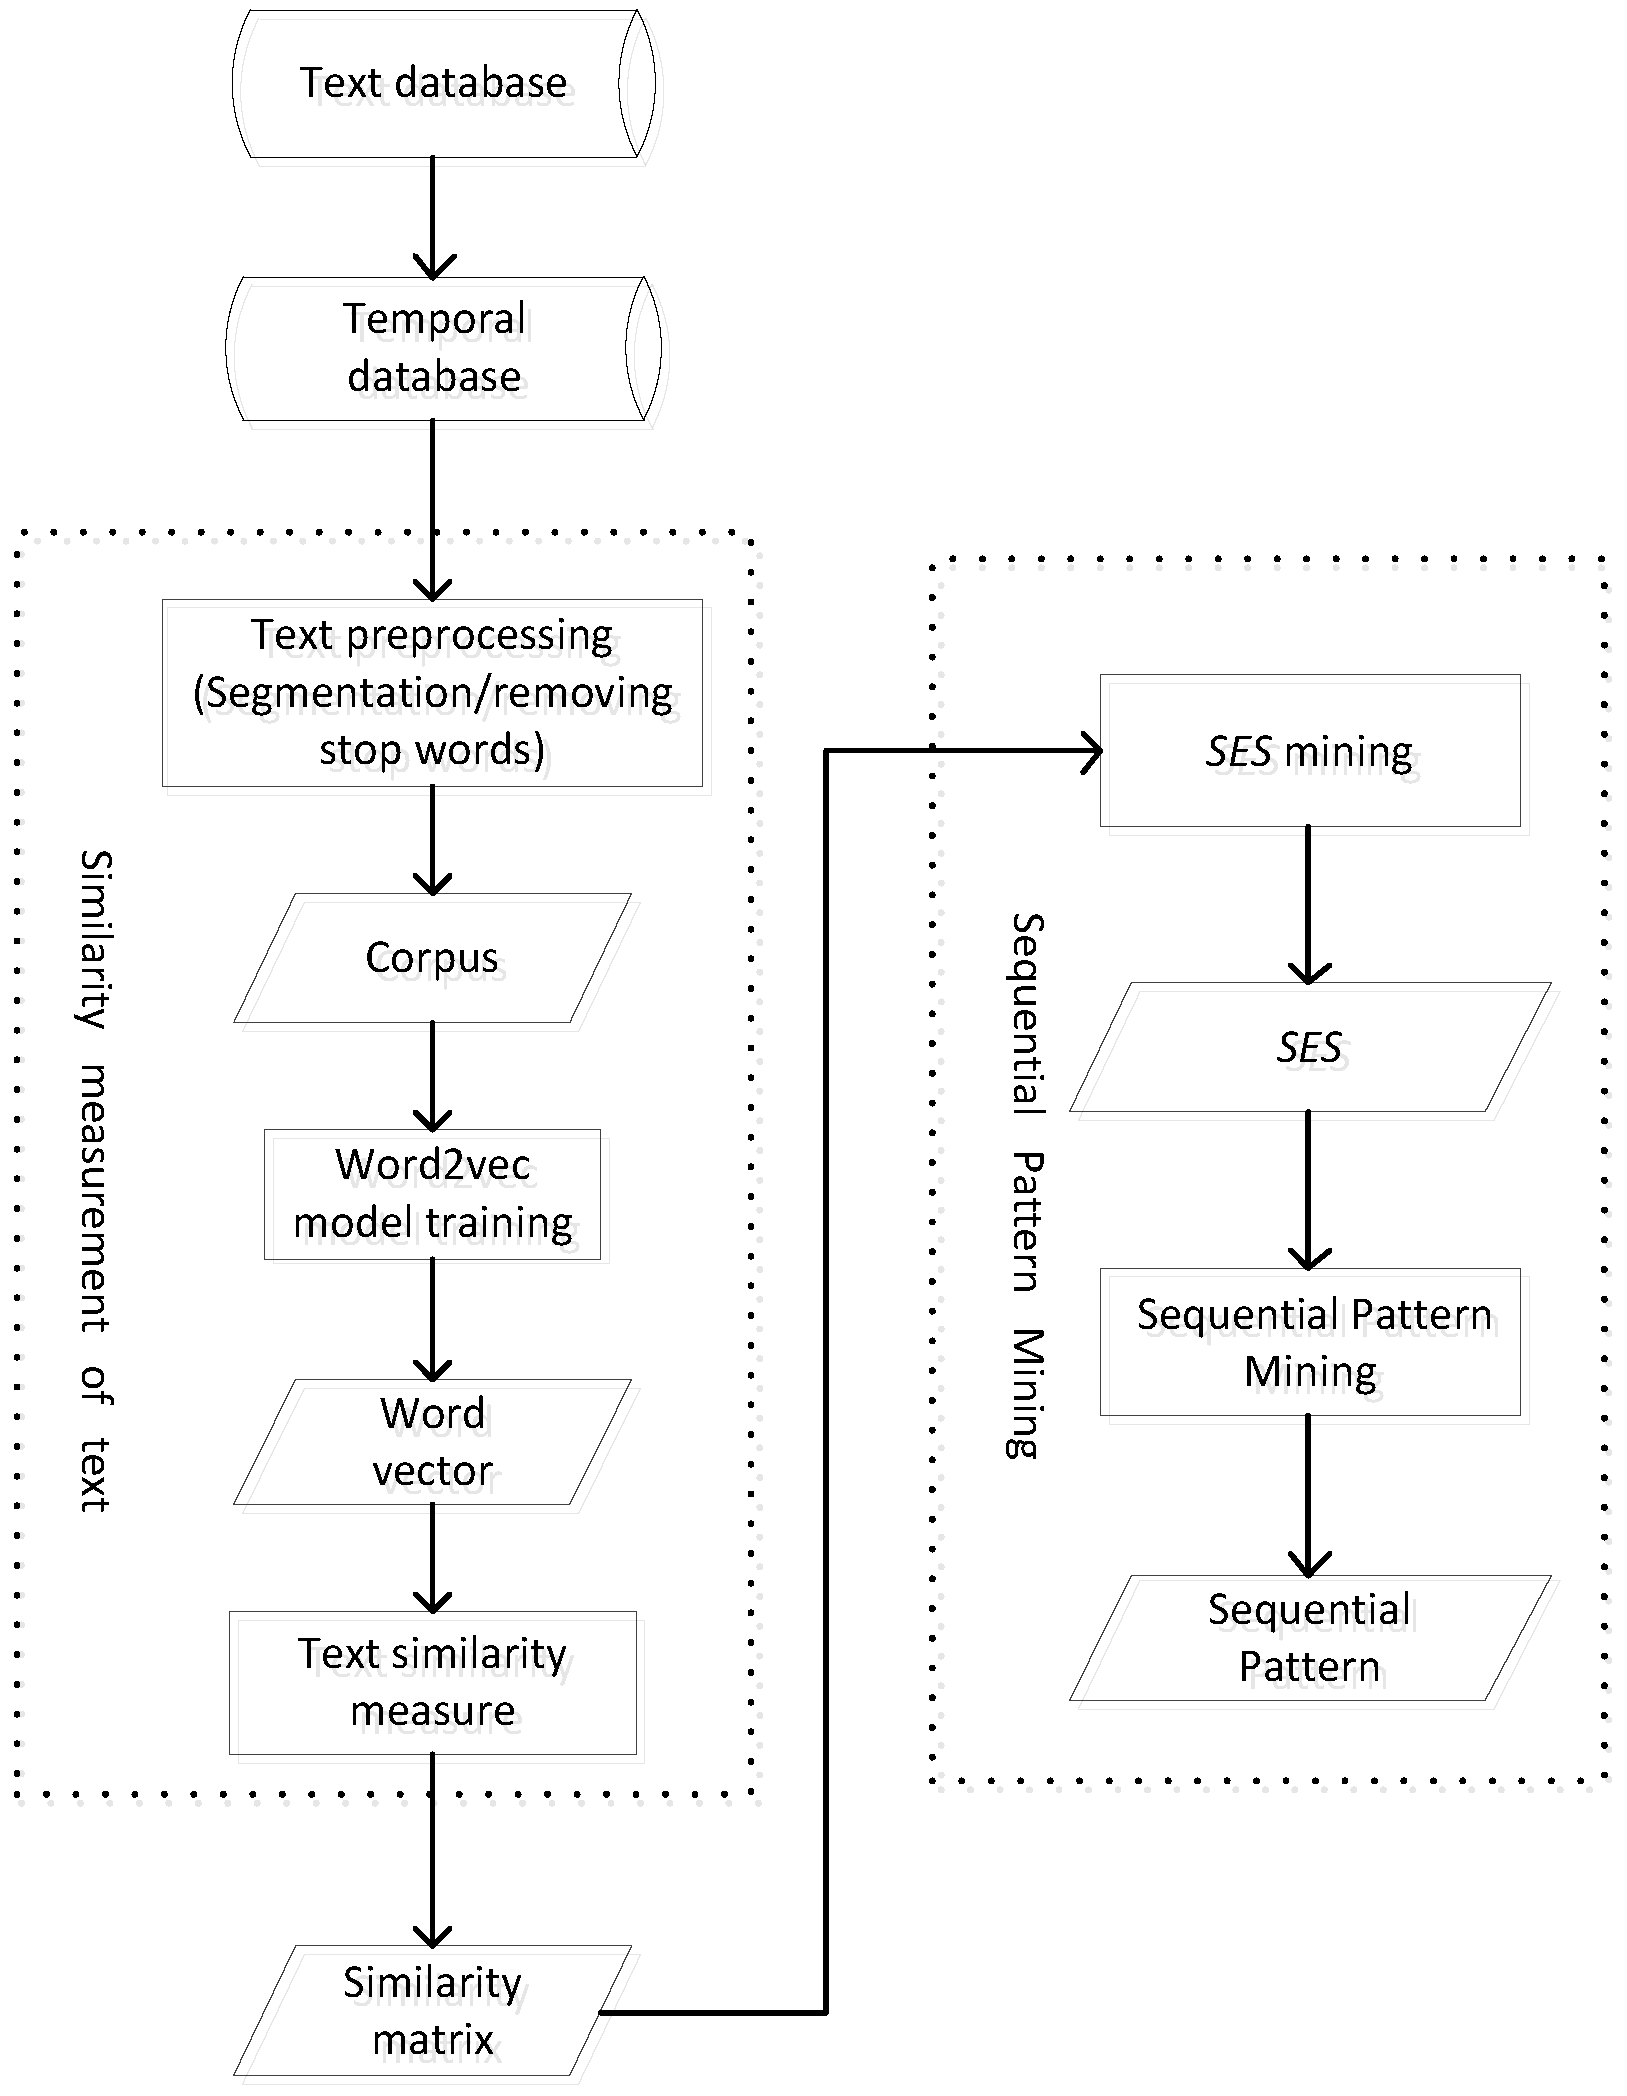
4.2.3. Sequence Pattern Mining Algorithm Process
First, the word embedding distance model was used to evaluate the original text database to obtain the text similarity matrix, and then, the SES mining model is used to obtain all SESs. Finally, the support degrees for all sequences that satisfy the maximum event window threshold were calculated. The sequence that reaches the support degree threshold is the sequential pattern. The specific process is shown in
Figure 4.
5. Experimental Validation and Results
5.1. Experimental Data
The experimental data are derived from the failure text records of a certain type of aircraft. Many fault text records have been accumulated in the maintenance support process of the aircraft. Each text record includes a brief description of the fault and the time of the occurrence of the fault. A total of 1394 text records were selected and sorted according to the time of the occurrence of the faults, as shown in
Table 13. Mining sequential patterns of faults is very meaningful. It helps the maintenance personnel to predict faults and take early measures to prevent them from happening.
5.2. Experimental Results
First, the Jieba segmentation tool was used to segment the text and remove the stop word. The word2vec model was used to train the acquired corpus, and the model parameters were selected as follows:
where parametric meaning:
sentences; corpus,
size: the dimension of the eigenvector;
alpha: the learning rate of initialization;
window: the maximum distance between words;
min_count: ignore words whose frequency is less than that value; sg: the selection of training algorithms;
hs: the choice of training skills;
iter: the number of iterations.
The distributed representation distance model was used to obtain the following text distance matrix, which is a symmetric, 1394
1394 matrix with all diagonal elements equal to 0.
The text similarity matrix is as follows:
Setting the minimum similarity threshold
min_sim = 0.9, the maximum event window threshold
max_win = 20 and the minimum support threshold
min_sup = 4, this algorithm was used to mine 22,436 fault sequence patterns (
FSP), as shown in
Table 14.
5.3. Robustness Evaluation of the Algorithm
For the text similarity measurement, we use the word2vec model to train the corpus. Generally, the distributed representation of words obtained via the word2vec model is not unique in every training, which may affect the final sequence pattern. Therefore, it was necessary to design a test to verify the robustness of the algorithm.
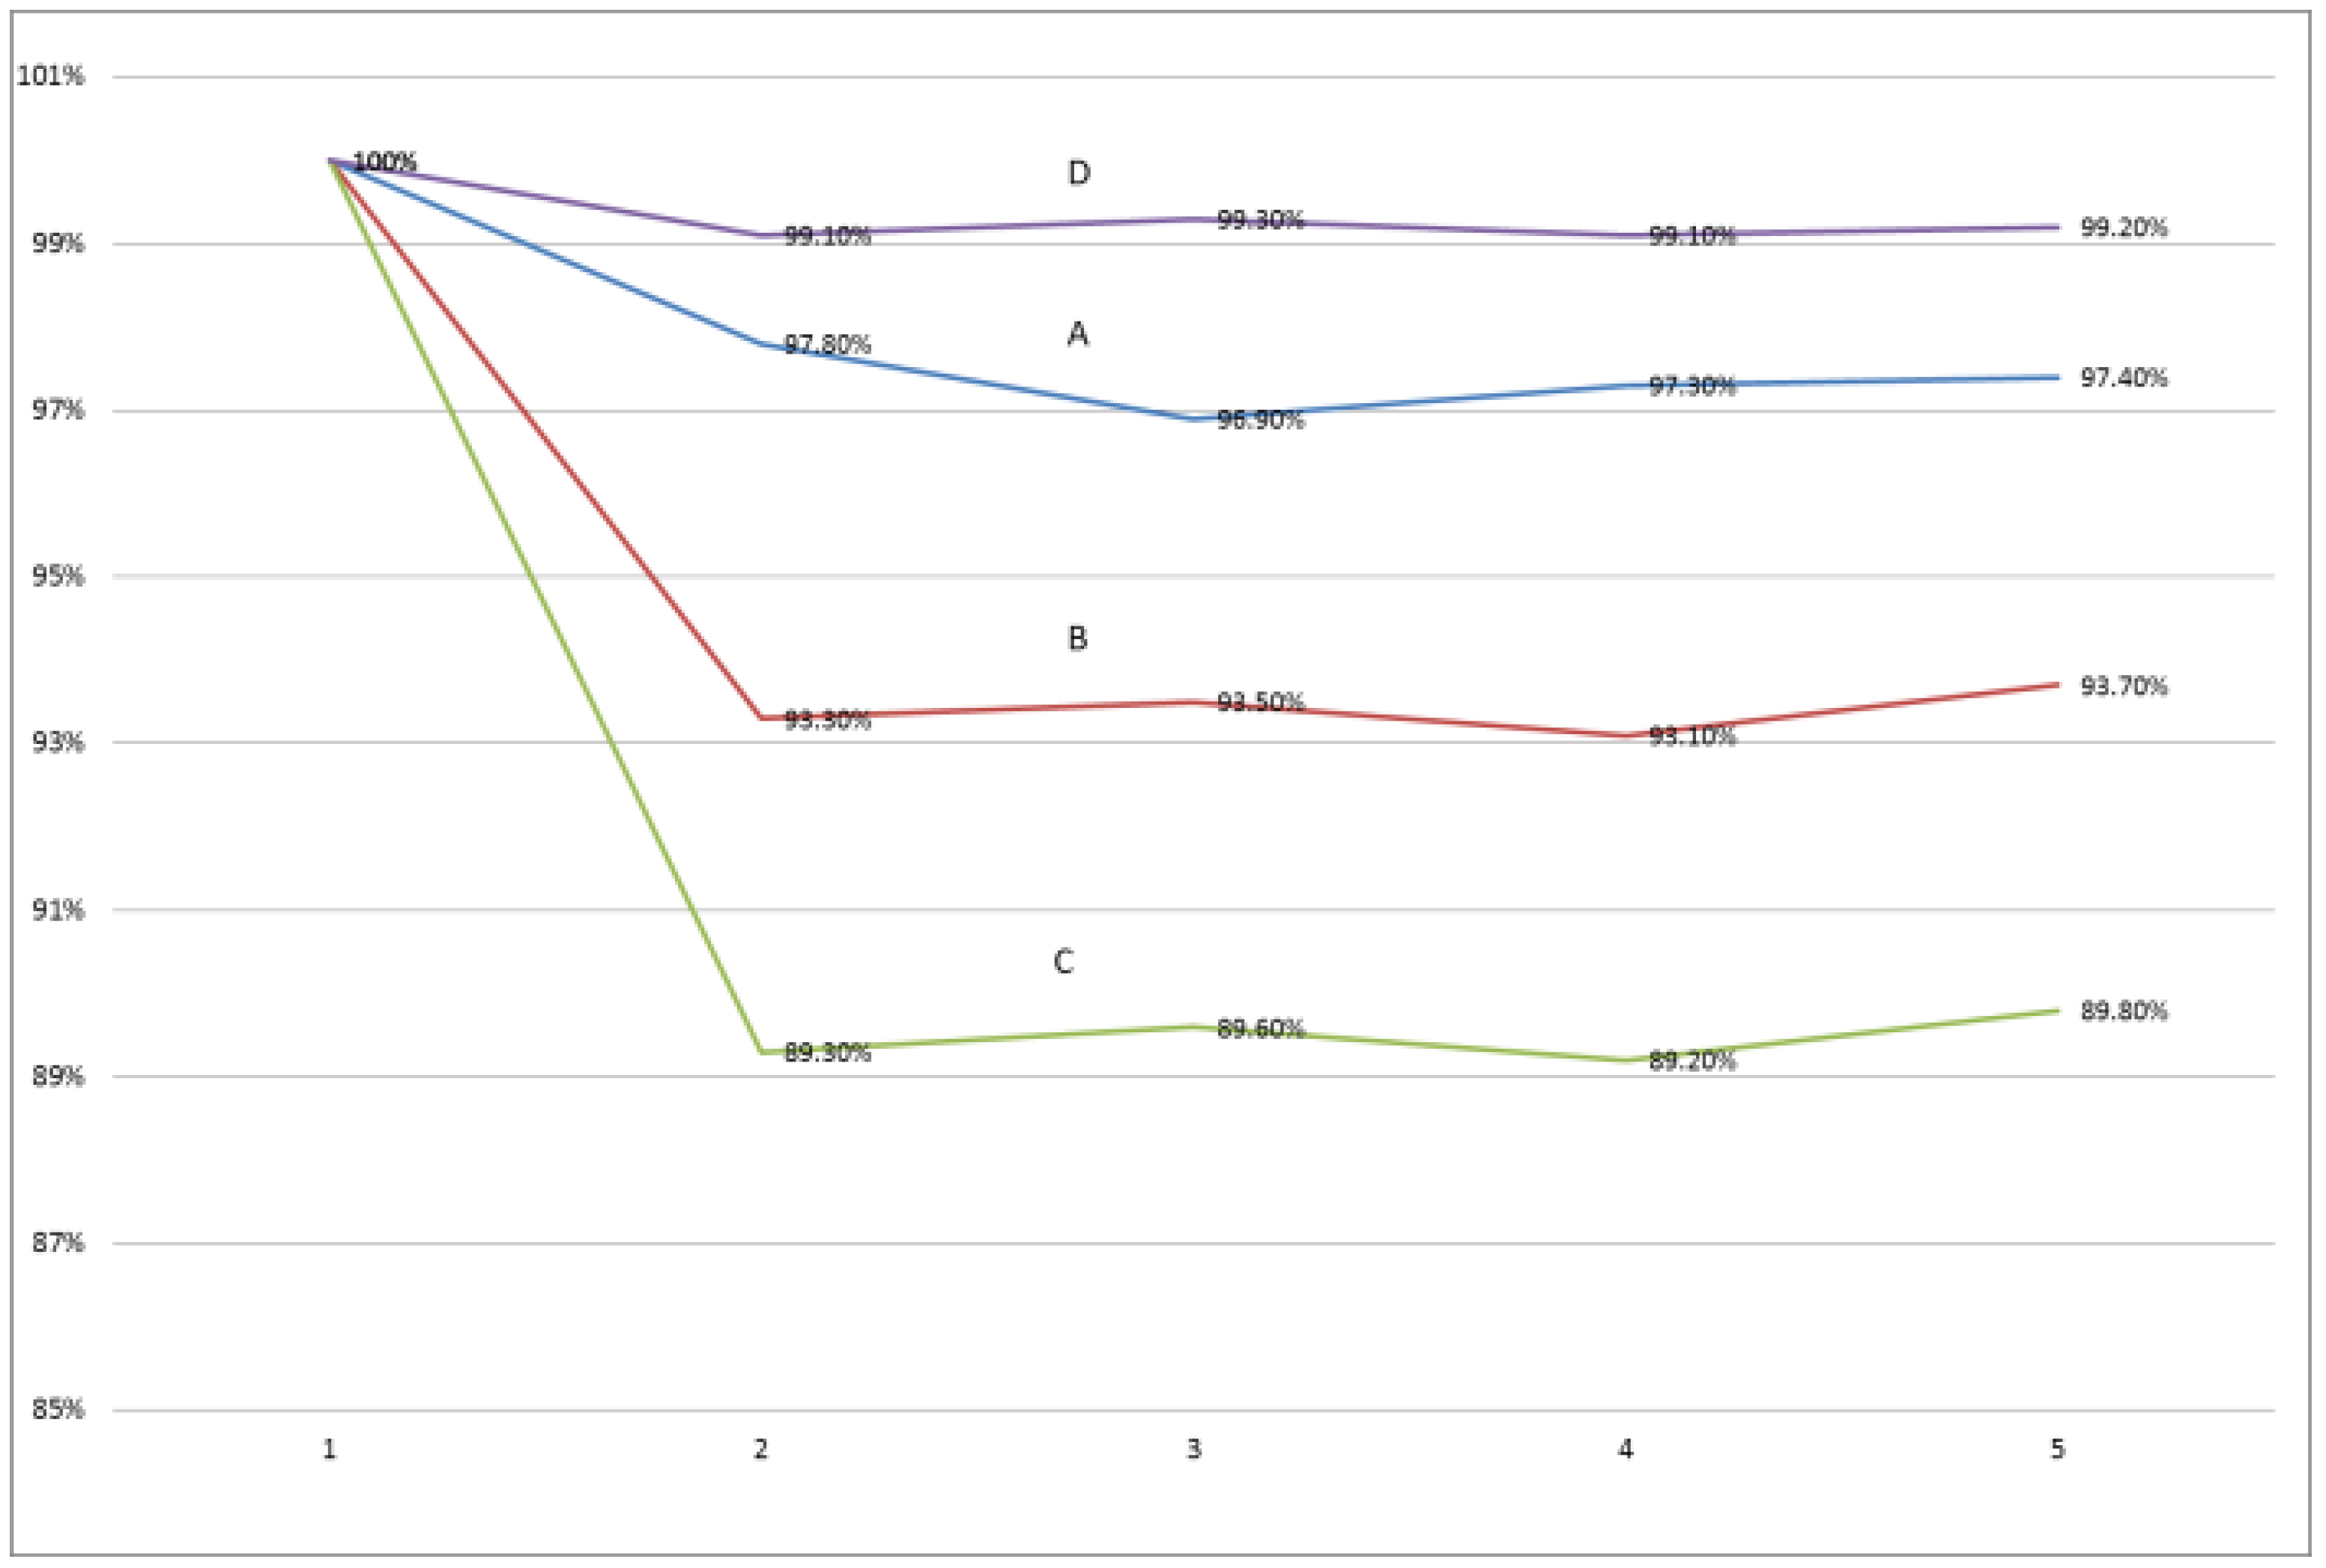
We validated the consistency of each test result under the same parameter combination, with the first test result as the benchmark. Three parameters were involved in the algorithm. We wanted to explore the effect of these three parameters on the robustness of the algorithm. Aiming at these three parameters, we designed four parameter combinations of A, B, C and D.
Table 15 shows the experimental design and experimental results. In accordance with the results in
Table 15, we generated
Figure 5.
As can be seen from
Figure 5, no matter the combination of parameters, the five test results under the same combination fluctuated very little. This proved that the algorithm has good robustness under different parameter combinations. From the experimental results of the two parameters combination of A and B in
Table 15, we can see that the higher the minimum support threshold, the better the robustness of the algorithm. From the experimental results of the two parameters combination of A and C in
Table 15, we can see that the lower the maximum window threshold, the better the robustness of the algorithm. From the experimental results of the two parameters combination of A and D in
Table 15, we can see that the higher the minimum support threshold, the better the robustness of the algorithm.
When min_sim = 0.9, max_win = 20 and min_sup = 8, the similarity between each test result and the first result exceeded 99%. In addition, at the same thresholds level, the experimental results changed slightly. When selecting a higher thresholds level, the algorithm was robust.
5.4. The Effect of Threshold Levels on the Mining Results
We explored the influence of different thresholds levels on the robustness of the algorithm. Different thresholds levels also affected the final mining results. Next, we explored the effect of different thresholds levels on the results and how to select the appropriate threshold level according to needs.
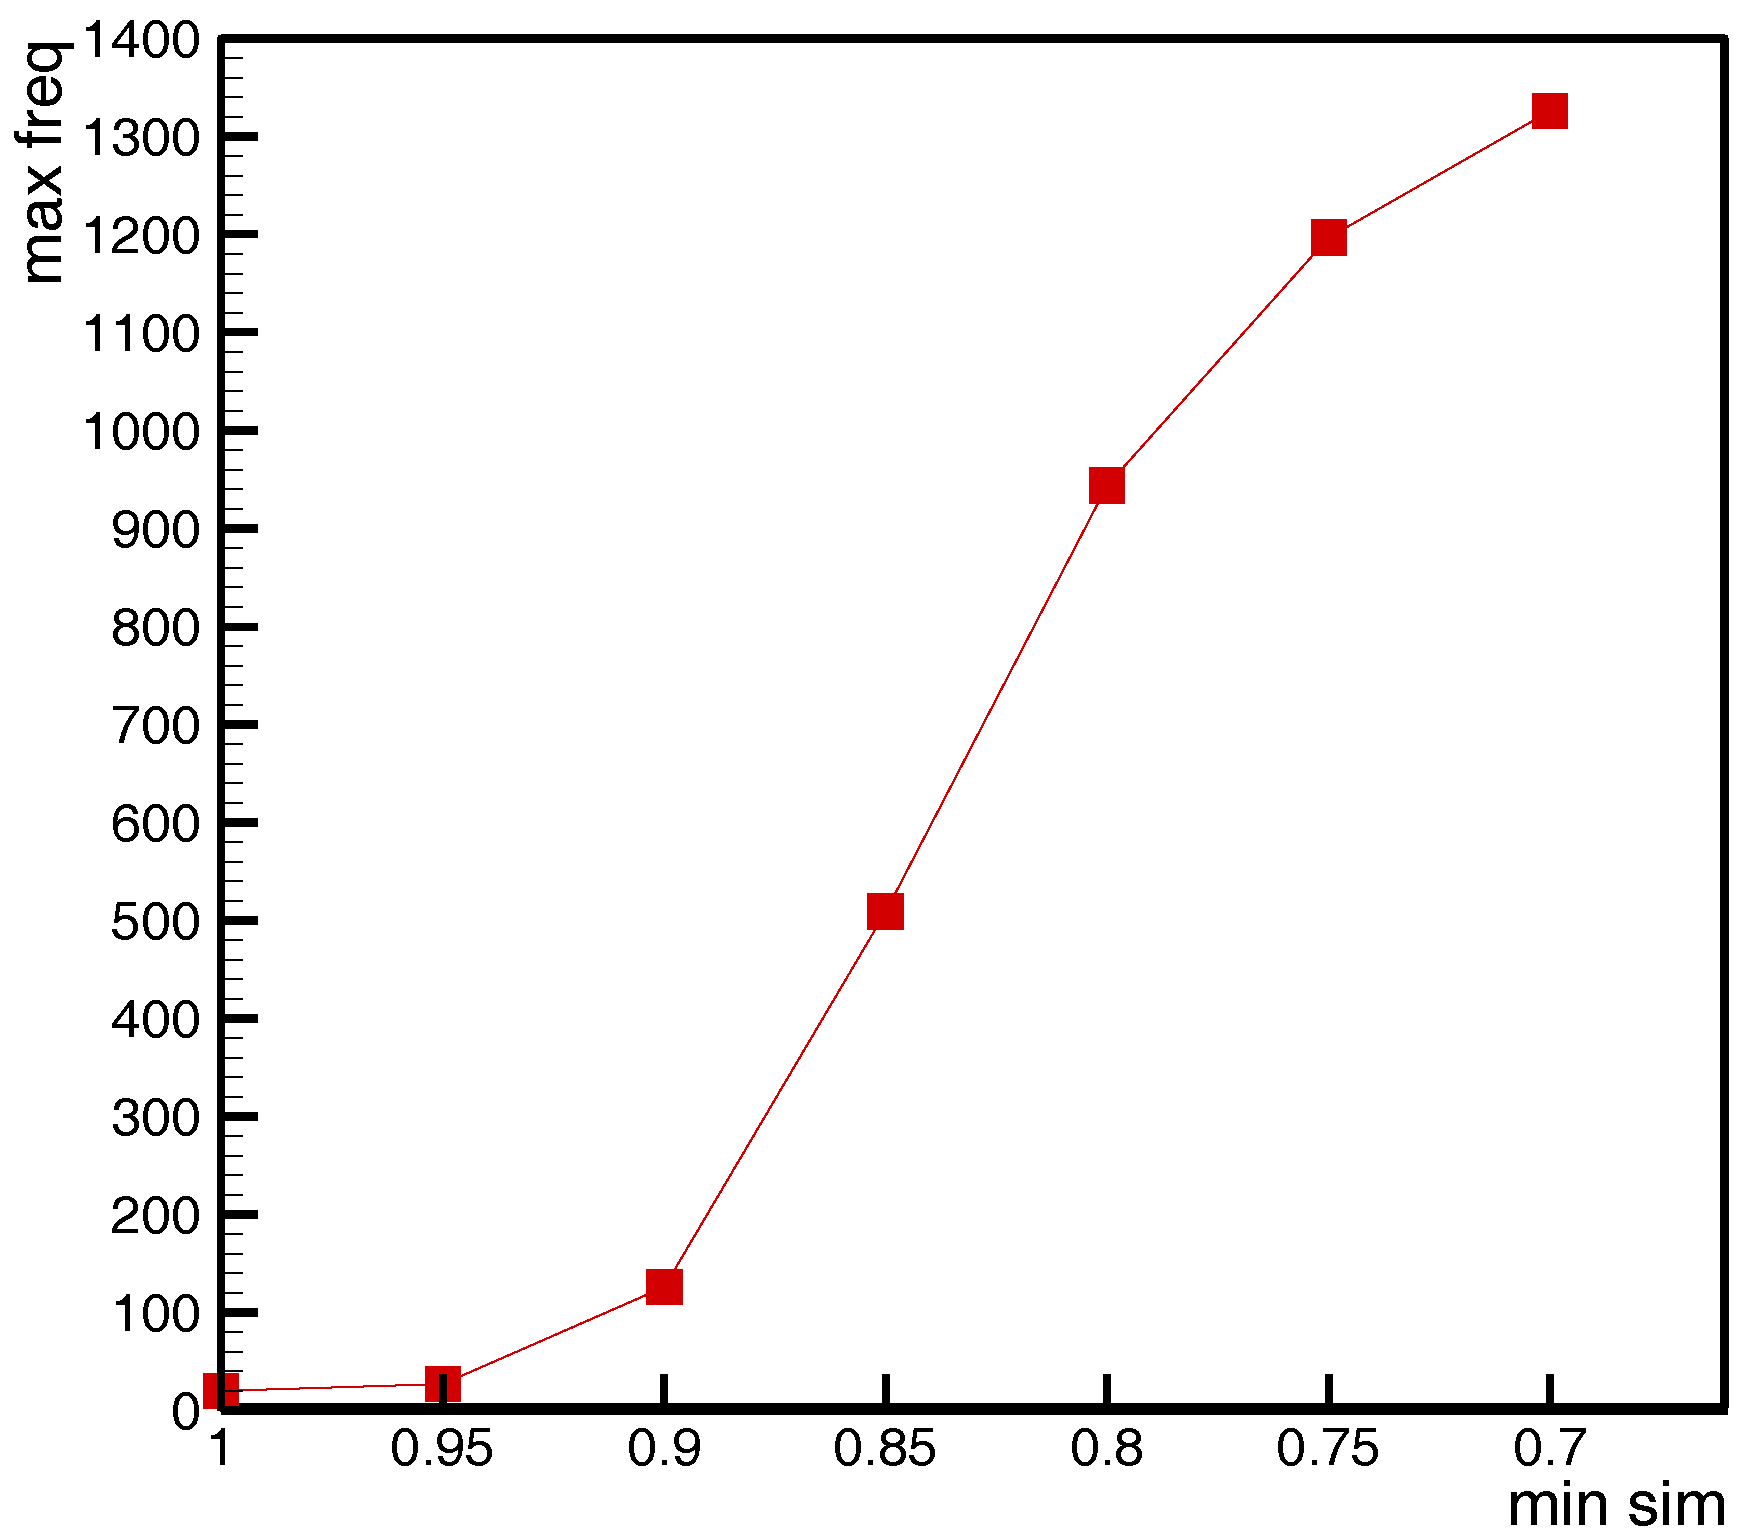
We explored the effect of the minimum similarity threshold (
min_sim) on the number of events contained in similar event sets (SESs). We took the SES with the most events (recorded as
max_freq) as the dependent variable, and explored the effect of
min_sim on the number of events it contains. From
Figure 6, we see that
max_freq increased with decreasing
min_sim. When
min_sim was reduced from 0.95 to 0.7,
max_freq increased from 27 to 1326. The objects in the traditional sequential pattern mining were completely resolved. The object of traditional sequential pattern mining was completely distinguishable, and the relationship between two events was either the same or different. If we take the traditional algorithm, that is,
min_sim = 1 and
max_freq = 20, it was difficult to uncover the sequential pattern. The value of
min-sim depended on the required algorithm accuracy. Obviously, the greater the value of min-sim was, the more accurate the result was; however, the number of sequential patterns will be reduced.
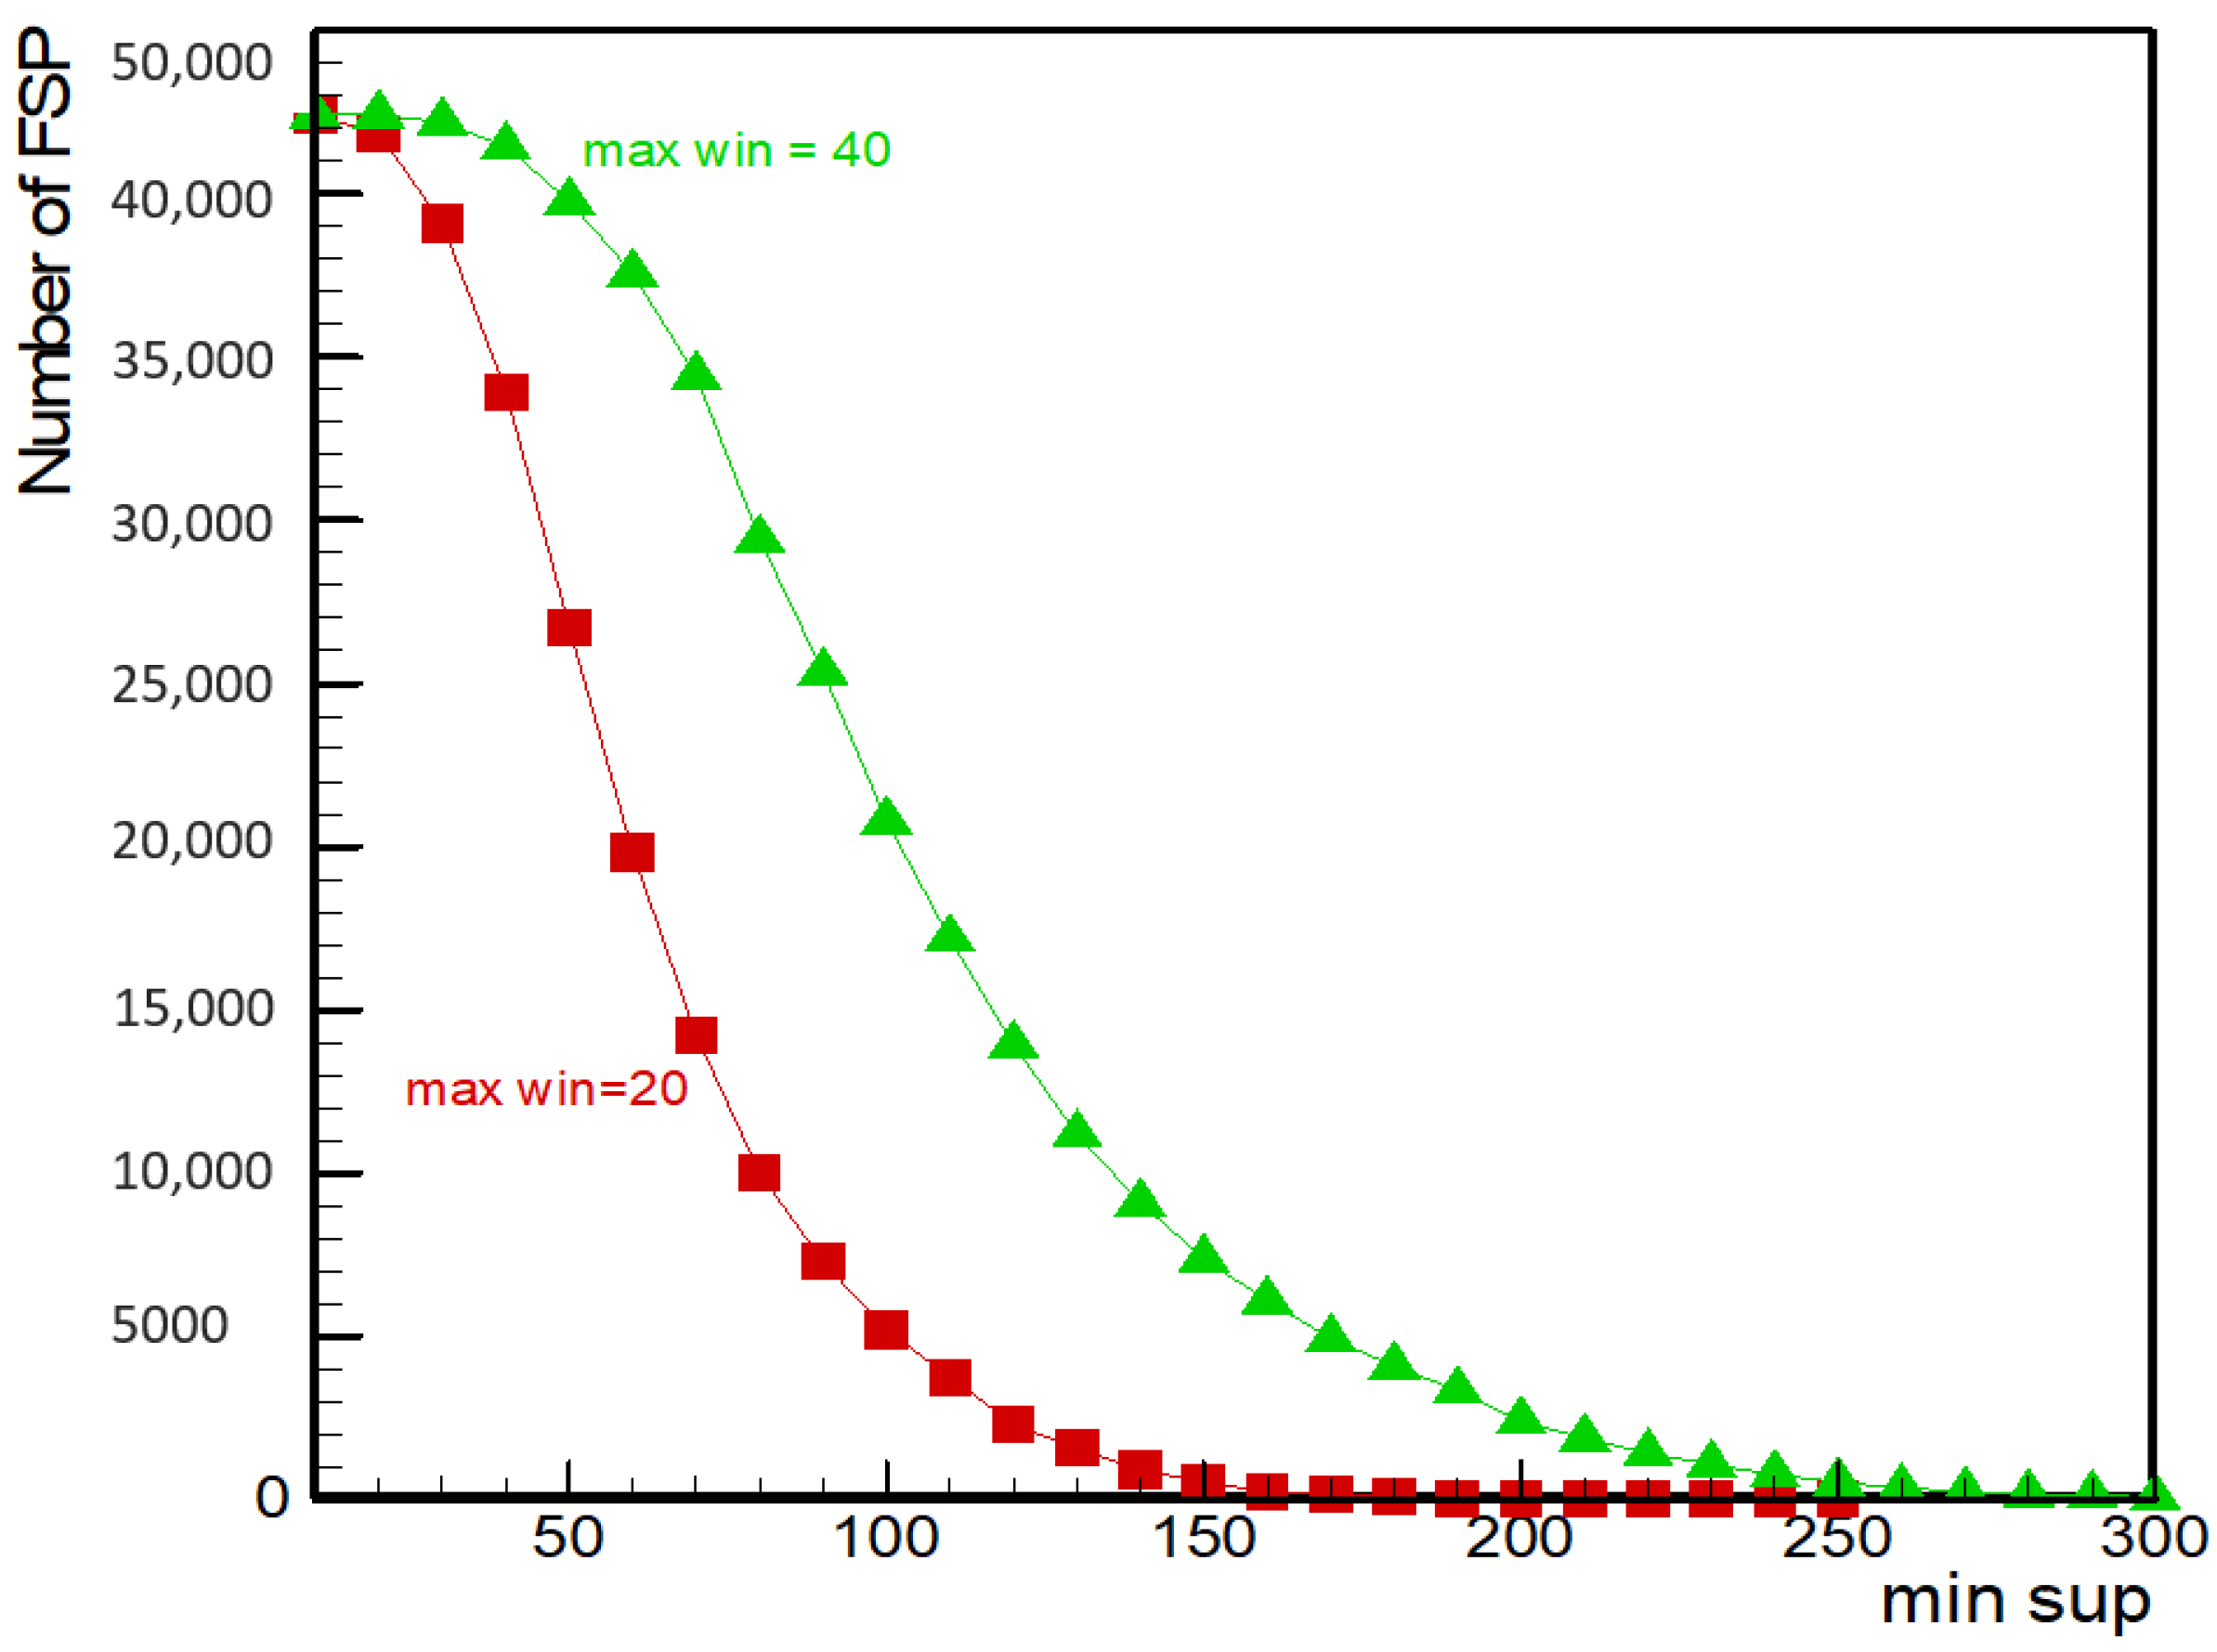
The effect of the minimum sequential pattern (
min_sup) and the maximum window threshold (
max_win) on the number of fault sequence patterns (FSP) was explored. Setting minimum similarity threshold
min_sim = 0.9,
Figure 7 shows that the number of FSP increased with
max_win when
min_sup was fixed. When
max_win was fixed, the number of FSP decreased with an increasing
min_sup. Setting
max_win = 20, when
min_sup increased from 10 to 250, the number of FSP decreased from 42,403 to 1. Setting
max_win = 40, when
min_sup increased from 10 to 300, the number of
FSP in the fault sequence decreased from 42,436 to 65, and the overall decline was slower than for
max_win = 20.
6. Discussion
6.1. Comparison with Existing Works
According to the introduction in
Section 2.3 of this article, in order to solve the difficulty of sequential pattern mining caused by unstructured text data, Sakurai et al. [
29] used key concept dictionary to extract events in text. The so-called key concept dictionary is composed of a series of key words. If there are keywords in the dictionary in the text, the content described in the text is the key concept. It is easy to see that there are many shortcomings in this method. First, they use key concepts to extract events that may cause errors. It is difficult to ensure the content of text description only by keyword matching. This method only considers the matching of words, without considering the influence of similar words and words order. Second, building a key concept dictionary is very subjective and time-consuming. Experts in the application domain need to identify key concepts and determine keywords. Third, the application is not strong. The application of different text data requires the re-establishment of a concept dictionary. The method used by Wong et al. [
30] is similar to Sakurai et al. and is also a keyword-based event extraction. The same problem exists.
The proposed sequential pattern mining algorithm based on text similarity measure overcomes the shortcomings of the above methods. First, in order to solve the problem of unstructured text data, we used the similarity measure method to classify events with the same meaning. The similarity measure method based on word embedding distance model proposed in this paper can calculate the similarity between texts and classify texts effectively and accurately. Second, the method of similarity measurement is objective and efficient. Compared with matching keyword extraction events, accuracy and efficiency are greatly improved. Third, it has wide application. The method proposed in this paper can be applied to many fields. As long as there is text data with timestamps, sequential pattern mining can be carried out by this method.
6.2. Application in Business Activities and Decision
Machinery and equipment in the manufacturing industry will inevitably fail. Reducing the failure rate of machinery and equipment, improving the level of maintenance support and reducing the cost of maintenance support have become issues of great concern to many enterprises. At the same time, a large amount of text data has been accumulated during the maintenance of machinery and equipment. The method proposed in this paper can utilize the text data which is not well used to discover the relationship between faults. The relationship between these failures can effectively help enterprises predict the failure of equipment. This will effectively change the passive maintenance strategy of previous enterprises and update the maintenance support mode.
In addition to updating equipment maintenance support strategy in manufacturing industry, the proposed method can also be applied to other business areas. In the field of marketing, through the analysis of the relationship between customers’ purchasing products through shopping records, it can help enterprises formulate product sales mix strategy. From the point of view of the sales industry, through the analysis of the relationship between the goods purchased by customers, it can help businesses to formulate sales strategies, product location, product inventory strategies and so on. A large number of business reports are generated in enterprises every day, which contain a lot of valuable information. Through the proposed method, the relationship between business behaviors in business reports can be mined.
7. Conlusions
At present, the mining of text data is not sufficient. SPM is a good way to excavate text data; however, when the object is unstructured text data, the traditional sequential pattern mining method is no longer applicable. In light of this problem, this paper proposed a text similarity measure model and an event window sequential pattern mining algorithm. We proposed text similarity measurement based on a word embedding distance model. A text data test showed that this model is better than other models in measuring short text similarity.
We proposed the concept of a similar event set and minimum similarity threshold, which aims to classify events of the same meaning into one category. Compared with the traditional sequential pattern mining method, we proposed the concept of an event window, so that we can extract more sequential patterns by time constraint ambiguity. Due to the appearance of similar event sets and event windows, we proposed a new method for sequence support degree calculation.
Using the fault records of a certain aircraft as the experimental data, we verified that the proposed algorithm is effective and robust. Finally, we discussed the effect of different threshold levels on mining results and provided suggestions on how to select the appropriate threshold.
SPM is an effective way to analyze time series data. The proposed algorithm can be widely applied to text time series data in many fields such as industry, business, finance and so on.
Author Contributions
Conceptualization, X.Y. and W.C.; Methodology, X.Y. and W.C.; Software, X.Y.; Validation, X.Y. and S.Z.; Formal Analysis, X.Y. and S.Z.; Investigation, X.Y.; Resources, W.C.; Data Curation, S.Z.; Writing-Original Draft Preparation, X.Y.; Writing-Review & Editing, S.Z. and Yang Cheng; Visualization, X.Y.; Supervision, S.Z.; Project Administration, W.C.; Funding Acquisition, S.Z.
Funding
This work was supported by the National Natural Science Foundation of China (grant numbers 71871003 & 71501007 & 71672006); the Aviation Science Foundation of China (grant numbers 2017ZG51081); and the Technical Research Foundation (grant numbers JSZL2016601A004).
Conflicts of Interest
The authors declare no conflict of interest.
References
- Agrawal, R.; Srikant, R. Mining Sequential Patterns. In Proceedings of the 11th International Conference on Data Engineering, Taipei, Taiwan, 6–10 March 1995. [Google Scholar]
- Agrawal, R.; Srikant, R. Fast Algorithms for Mining Association Rules. In Proceedings of the International Conference on Very Large Data Bases, Vienna, Austria, 23–27 September 1995; pp. 487–499. [Google Scholar]
- Srikant, R.; Agrawal, R. Mining sequential patterns: Generalizations and performance improvements. In Proceedings of the International Conference on Extending Database Technology, Avignon, France, 25–29 March 1996; pp. 1–17. [Google Scholar]
- Zaki, M.J. Spade: An efficient algorithm for mining frequent sequences. Mach. Learn. 2001, 42, 31–60. [Google Scholar] [CrossRef]
- Han, J.; Pei, J.; Mortazavi-Asl, B.; Chen, Q.; Dayal, U.; Hsu, M.C. FreeSpan: Frequent pattern-projected sequential pattern mining. In Proceedings of the 6th ACM SIGKDD International Conference on Knowledge Discovery and Data Mining, Boston, MA, USA, 20–13 August 2000; pp. 355–359. [Google Scholar]
- Pei, J.; Han, J.; Mortazavi-Asl, B.; Pinto, H.; Chen, Q.; Dayal, U.; Hsu, M.C. Prefixspan: Mining sequential patterns efficiently by prefix-projected pattern growth. In Proceedings of the 17th International Conference on Data Engineering, Heidelberg, Germany, 2–6 April 2001; pp. 215–224. [Google Scholar]
- Yan, X.W.; Zhang, J.F.; Xun, Y.L. A parallel algorithm for mining constrained frequent patterns using MapReduce. Soft Comput. 2017, 9, 2237–2249. [Google Scholar] [CrossRef]
- Xiao, Y.; Zhang, R.; Kaku, I. A new approach of inventory classification based on loss profit. Expert Syst. Appl. 2012, 38, 9382–9391. [Google Scholar] [CrossRef]
- Xiao, Y.; Zhang, R.; Kaku, I. A new framework of mining association rules with time-window on real-time transaction database. Int. J. Innov. Comput. Inf. Control 2011, 7, 3239–3253. [Google Scholar]
- Xiao, Y.; Tian, Y.; Zhao, Q. Optimizing frequent time-window selection for association rules mining in a temporal database using a variable neighbourhood search. Comput. Oper. Res. 2014, 7, 241–250. [Google Scholar] [CrossRef]
- Aloysius, G.; Binu, D. An approach to products placement in supermarkets using PrefixSpan algorithm. J. King Saud Univ. Comput. Inf. Sci. 2013, 1, 77–87. [Google Scholar] [CrossRef]
- Wright, A.; Wright, T.; Mccoy, A. The use of sequential pattern mining to predict next prescribed medications. Biomed. Inform. 2015, 53, 73–80. [Google Scholar] [CrossRef] [PubMed]
- Fu, S. Analysis of library users’ borrowing behavior based on sequential pattern mining. Inf. Stud. Theory Appl. 2014, 6, 103–106. [Google Scholar]
- Liu, X. Study of Road Traffic Accident Sequence Pattern and Severity Prediction Based on Data Mining; Beijing Jiaotong University: Beijing, China, 2016. [Google Scholar]
- Wang, G. Fault Prediction of Railway Turnout Based on Text Data; Beijing Jiaotong University: Beijing, China, 2017. [Google Scholar]
- Fan, Z. Research on the Application of Data Mining in Aeronautical Maintenance; Changchun University of Science and Technology: Changchun, China, 2010. [Google Scholar]
- Ma, R.; Wang, L.; Yu, J. Circllit breakers condition eValuation considering the information in llistorical deflect texts. J. Mech. Electr. Eng. 2015, 10, 1375–1379. [Google Scholar]
- Salton, G. Developments in automatic text retrieval. Science 1991, 253, 974–980. [Google Scholar] [CrossRef] [PubMed]
- Ontrup, J.; Ritter, H. Text Categorization and Semantic Browsing with Self-Organizing Maps on Non-euclidean Spaces. In Proceedings of European Conference on Principles of Data Mining and Knowledge Discovery; Springer: Berlin/Heidelberg, Germany, 2001. [Google Scholar]
- Greene, D.; Cunningham, P. Practical solutions to the problem of diagonal dominance in kernel document clustering. In Proceedings of the 23rd International Conference on Machine Learning, Pittsburgh, PA, USA, 25–29 June 2006; pp. 377–384. [Google Scholar]
- Quadrianto, N.; Song, L.; Smola, A.J.; Tuytelaars, T. Kernelized sorting. IEEE Trans. Pattern Anal. Mach. Intell. 2010, 32, 1809–1821. [Google Scholar] [CrossRef] [PubMed]
- Salton, G.; Buckley, C. Term-weighting approaches in automatic text retrieval. Inf. Process. Manag. Int. J. 1988, 24, 513–523. [Google Scholar] [CrossRef]
- Blei, D.M.; Ng, A.Y.; Jordan, M.I. Latent dirichlet allocation. J. Mach. Learn. Res. 2003, 3, 993–1022. [Google Scholar]
- Hinton, G.E. Learning word embeddings of concepts. In Proceedings of the Eighth Annual Conference of the Cognitive Science Society, Amherst, MA, USA, 15–17 August 1986. [Google Scholar]
- Mikolov, T.; Sutskever, I.; Chen, K. Distributed Representations of Words and Phrases and their Compositionality. Adv. Neural Inform. Proc. Sys. 2013, 26, 3111–3119. [Google Scholar]
- Pennington, J.; Socher, R.; Manning, C. Glove: Global Vectors for Word Representation. In Proceedings of the Conference on Empirical Methods in Natural Language Processing, Doha, Qatar, 25–29 October 2014; pp. 1532–1543. [Google Scholar]
- Le, Q.; Mikolov, T. Word embeddings of sentences and documents. In Proceedings of the 31st International Conference on Machine Learning, Beijing, China, 21–26 June 2014; pp. 1188–1196. [Google Scholar]
- Kenter, T.; Rijke, M. Short Text Similarity with Word Embeddings. In Proceedings of the ACM International on Conference on Information and Knowledge Management, Melbourne, Australia, 18–23 October 2015; pp. 1411–1420. [Google Scholar]
- Sakurai, S.; Ueno, K. Analysis of daily business reports based on sequential text mining method. In Proceedings of the IEEE International Conference on Systems, The Hague, The Netherlands, 10–13 October 2004. [Google Scholar]
- Wong, P.C.; Cowley, W.; Foote, H.; Jurrus, E.; Thomas, J. Visualizing Sequential Patterns for Text Mining. In Proceedings of the IEEE Information Visualization, Salt Lake City, UT, USA, 9–10 October 2000; pp. 105–111. [Google Scholar]
Figure 1.
Example of a word embedding distance model.
Figure 1.
Example of a word embedding distance model.
Figure 2.
Effective sequences AB under different max_win conditions.
Figure 2.
Effective sequences AB under different max_win conditions.
Figure 3.
Sequences of the same meaning as e1→e2.
Figure 3.
Sequences of the same meaning as e1→e2.
Figure 4.
Algorithm process.
Figure 4.
Algorithm process.
Figure 5.
Similarity between the follow-up test results and the first test results.
Figure 5.
Similarity between the follow-up test results and the first test results.
Figure 6.
Relation between min_sim and events number that SES contains.
Figure 6.
Relation between min_sim and events number that SES contains.
Figure 7.
Relationship between min_sup, max_win and the number of the fault sequence patterns (FSP).
Figure 7.
Relationship between min_sup, max_win and the number of the fault sequence patterns (FSP).
Table 1.
Comparison of Chinese word segmentation system.
Table 1.
Comparison of Chinese word segmentation system.
| Segmentation System | Custom Dictionary | Mark Part of Speech | Extract Key Words | Support Traditional Chinese | Support 8-bit Unicode Transformation Format (UTF-8) | Identify New Words |
|---|
| Jieba | | | | | | |
| CAS | | | | | | |
| smallseg | | | | | | |
| snailseg | | | | | | |
Table 2.
Results of segmentation.
Table 2.
Results of segmentation.
| No. | Chinese Text |
|---|
| 1 | [‘1号发动机’// ‘的’// ‘散热器’// ‘渗油’]
(engine 1// ’s// radiator// oil seepage) |
| 2 | [‘左发’// ‘滑油散热器’// ‘出现’// ‘漏油’]
(left hair// oil radiator// happen// oil spill) |
Table 3.
Similar texts and distances.
Table 3.
Similar texts and distances.
| NO. | Text | Distance |
|---|
| 1 | The fourth—hair vibrator ZZG-1 indicates abnormal, internal fault | 0.2302 |
| 2 | The first 1 hair vibrator does not indicate, internal fault | 0.2302 |
| 3 | The fourth torque indicates the maximum pressure, internal fault | 0.2813 |
| 4 | Third vibration amplifier does not indicate, no fault | 0.2991 |
| 5 | s vibration amplifier overload, the indicator light does not shine, no fault | 0.3268 |
Table 4.
Comparison of the advantages and disadvantages of the model.
Table 4.
Comparison of the advantages and disadvantages of the model.
| | Models | Bag-of-Words Model | Topic Model | Word Embedding Distance Model |
|---|
| Functions | |
|---|
| Word embedding | | | |
| Implication semantic relation | | | |
| Suitable for short text | | | |
Table 5.
Example of a transaction database.
Table 5.
Example of a transaction database.
| Event | Time |
|---|
| C | 2 March 2017 |
| B | 11 September 2017 |
| A | 2 May 2017 |
| C | 8 June 2017 |
| |
| B | 6 December 2017 |
Table 6.
Example of an item list.
Table 6.
Example of an item list.
| NO. | Event | Time |
|---|
| 1 | A |  |
| 2 | C |
| 3 | B |
| 4 | A |
| |
| N | C |
Table 7.
Text similarity matrix.
Table 7.
Text similarity matrix.
| Event | 1 | 2 | … | n |
|---|
| 1 | 1 | | … | |
| 2 | | 1 | … | |
| … | … | … | … | … |
| n | | | … | 1 |
Table 8.
Transformation similarity matrix.
Table 8.
Transformation similarity matrix.
| Event | 1 | 2 | … | n |
|---|
| 1 | 1 | 0 or 1 | … | 0 or 1 |
| 2 | 0 or 1 | 1 | … | 0 or 1 |
| … | … | … | … | … |
| n | 0 or 1 | 0 or 1 | … | 1 |
Table 9.
Example of SES mining results.
Table 9.
Example of SES mining results.
| No. | Included Events |
|---|
| SES1 | e1, e3, e7, e15, e27 |
| SES2 | e2, e4 |
| SES3 | e1, e3, e7, e27, e35 |
| SES4 | e2, e4 |
| |
| SESn | e6, e18, e33 |
Table 10.
Example of the final SES mining results.
Table 10.
Example of the final SES mining results.
| No. | Included Events |
|---|
| SES1 | e1, e3, e7, e15, e27, e35 |
| SES2 | e2, e4 |
| |
Table 11.
Example of a sequence database.
Table 11.
Example of a sequence database.
| No | Event | Time |
|---|
| 1 | A |  |
| 2 | B |
| 3 | A |
| 4 | B |
| 5 | B |
Table 12.
Calculation of the support degree under different max_win.
Table 12.
Calculation of the support degree under different max_win.
| Number of Max_Win | Included Sequence | Support Degree |
|---|
| 0 | | 2 |
| 1 | | 3 |
| 2 | | 4 |
| 3 | | 5 |
Table 13.
Part of the fault records.
Table 13.
Part of the fault records.
| No. | Fault Recordings | Time |
|---|
| 1 | The motor is not working (with a gasket), the clutch is bad. | 17 February 2014 |
| 2 | Oil leakage of honeycomb structure of fourth slide oil radiator. | 3 March 2014 |
| 3 | 2nd oil radiator honeycomb hole oil leakage. | 18 March 2014 |
| 4 | 3rd oil radiator honeycomb hole oil leakage. | 27 March 2014 |
| 5 | Small turbine voltage is low, flight vibrations cause poor contact. | 9 April 2014 |
| | |
Table 14.
Part of mining results.
Table 14.
Part of mining results.
| No | The Previous Fault | Subsequent Fault | Support Degree |
|---|
| 1 | The voice of the high frequency part of the antenna azimuth transmission mechanism is abnormal | Search cannot track objects, self-tuning circuits are bad | 224 |
| 2 | R116 break, short circuit | No. 5 caller failed | 223 |
| 3 | The panoramic radar display has failed | Antenna azimuth transmission gear deformation | 221 |
| 4 | The channel tuning is continuous, the high frequency component is bad | Search cannot track objects, self-tuning circuits are bad | 215 |
| 5 | Search cannot track objects; self-tuning circuits are bad | Fault of radio frequency relay J1 | 211 |
| | | |
Table 15.
Similarity between the follow-up test results and the first test results.
Table 15.
Similarity between the follow-up test results and the first test results.
| | Test Order | 1 | 2 | 3 | 4 | 5 |
|---|
| Parameter Combination | |
|---|
| A | Min_sim = 0.9 | 100% | 97.80% | 96.90% | 97.30% | 97.40% |
| Max_win = 20 |
| Min_sup = 4 |
| B | Min_sim = 0.8 | 100% | 93.30% | 93.50% | 93.10% | 93.70% |
| Max_win = 20 |
| Min_sup = 4 |
| C | Min_sim = 0.9 | 100% | 89.30% | 89.60% | 89.20% | 89.80% |
| Max_win = 30 |
| Min_sup = 4 |
| D | Min_sim = 0.9 | 100% | 99.10% | 99.30% | 99.10% | 99.20% |
| Max_win = 20 |
| Min_sup = 8 |
© 2018 by the authors. Licensee MDPI, Basel, Switzerland. This article is an open access article distributed under the terms and conditions of the Creative Commons Attribution (CC BY) license (http://creativecommons.org/licenses/by/4.0/).


