1. Introduction
China is the world’s largest energy consumer and CO
2 emitter; its energy consumption accounts for about one quarter [
1] of the world’s total, and its CO
2 emissions accounted for 28.21% [
2] of the world’s total in 2016. Due to differences in resource endowments, the country energy structure is still dominated by coal, which constituted 62% [
2] of the country’s total energy consumption in 2016. In addition to CO
2, coal combustion emits a large amount of SO
2, NO
x, and PM2.5, causing air pollution problems that led to the deaths of about 1.1 million people in China in 2015 [
3].
China’s industrial sector (including mining, manufacturing, and power industries) made up about one-third of its gross domestic product (GDP) in 2016, while energy consumption and CO
2 accounted for two-thirds of the country’s energy consumption and CO
2 emissions [
2]. In 2015, the total emissions from China’s industrial sector hit 68.5 trillion cubic meters, with SO
2 accounting for 83.73%, NO
x accounting for 63.79%, and soot accounting for 66.59% of the country’s emissions. Therefore, the negative effects of China’s industrial sector on energy efficiency and emission treatment have received great attention from academia, the government, and the whole society.
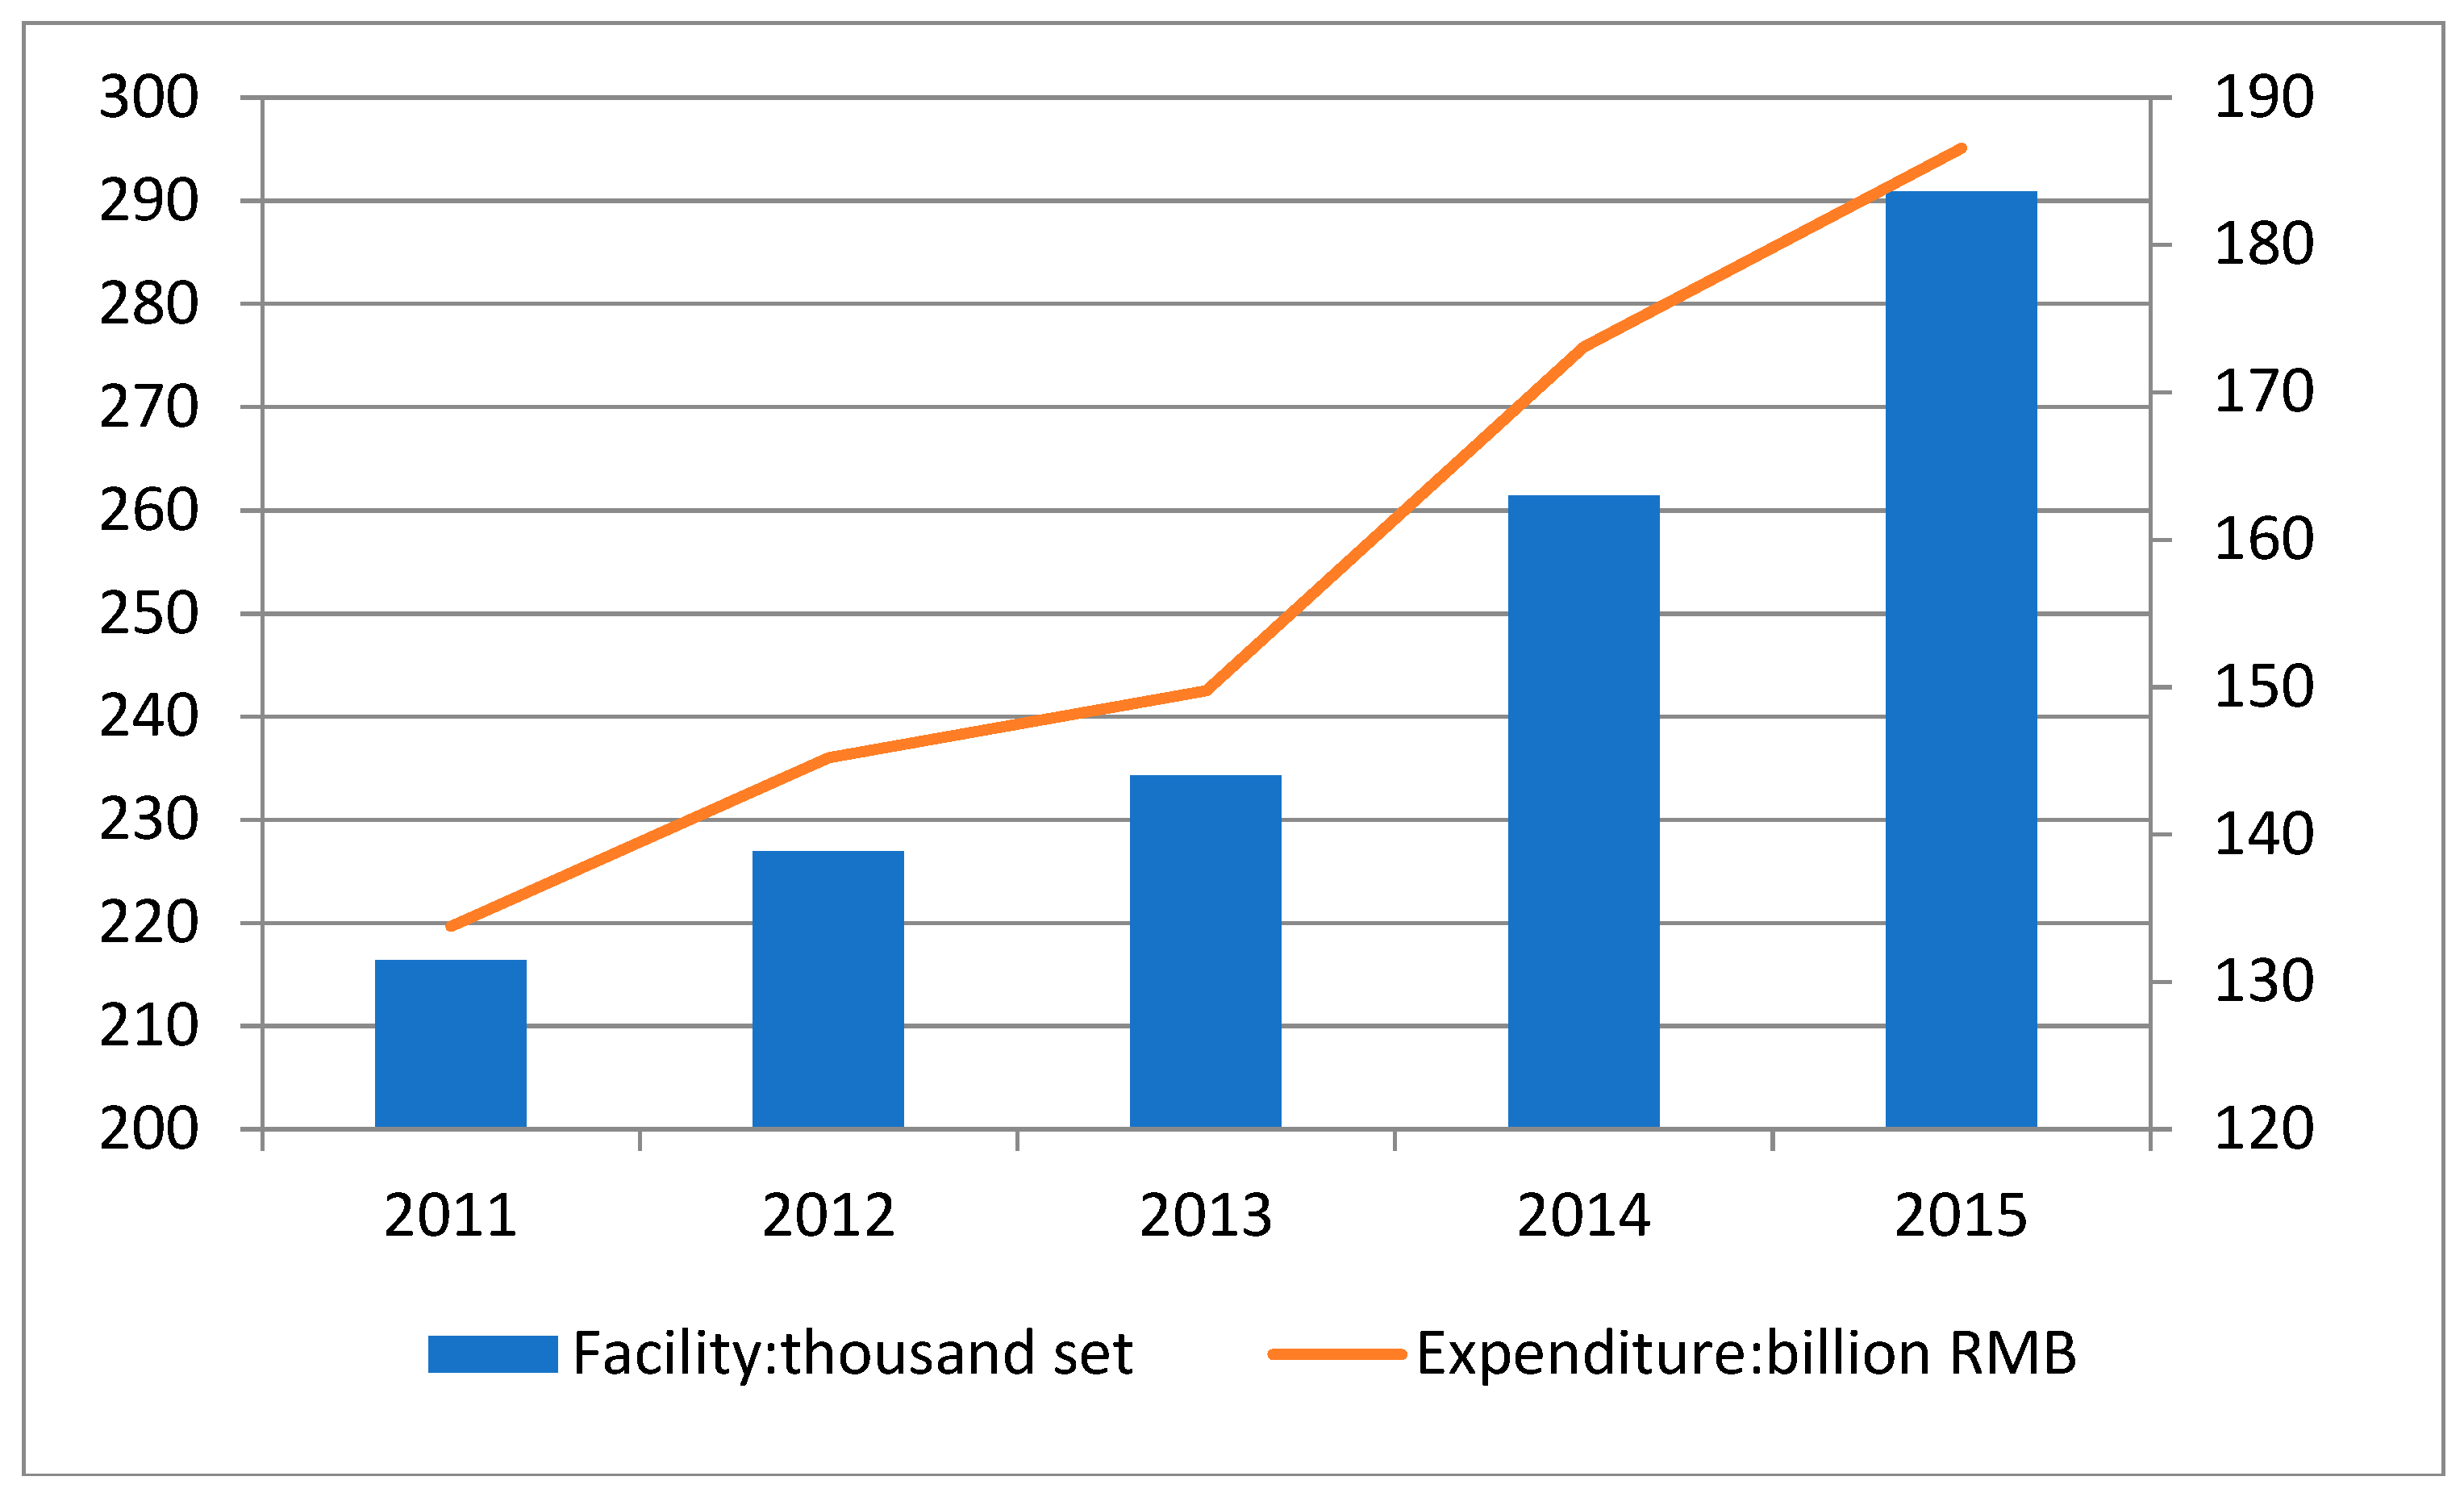
To address air pollutant emissions, in 2010 the Chinese government issued guiding opinions, focusing on the industrial sector, and made arrangements for government emissions control during the “12th Five-Year Plan” period (2011–2015). The main contents include setting up key areas to limit high-energy consumption industries, accelerating the replacement of coal by clean energy and renewable energy, and forcing the installation of waste gas treatment equipment by enterprises in the industrial sector.
In the treatment of air pollution, the efforts made by the Chinese government have achieved results. According to analyses of National Aeronautics and Space Administration (NASA satellite data, the levels of fine particulate matter in China fell by 17% between 2010–2015 [
4]. It shows that it is of great practical significance to make a more dynamic assessment of the energy and emission-reduction efficiencies of China’s industrial sector during this period, as well as clarify the sources of its performance.
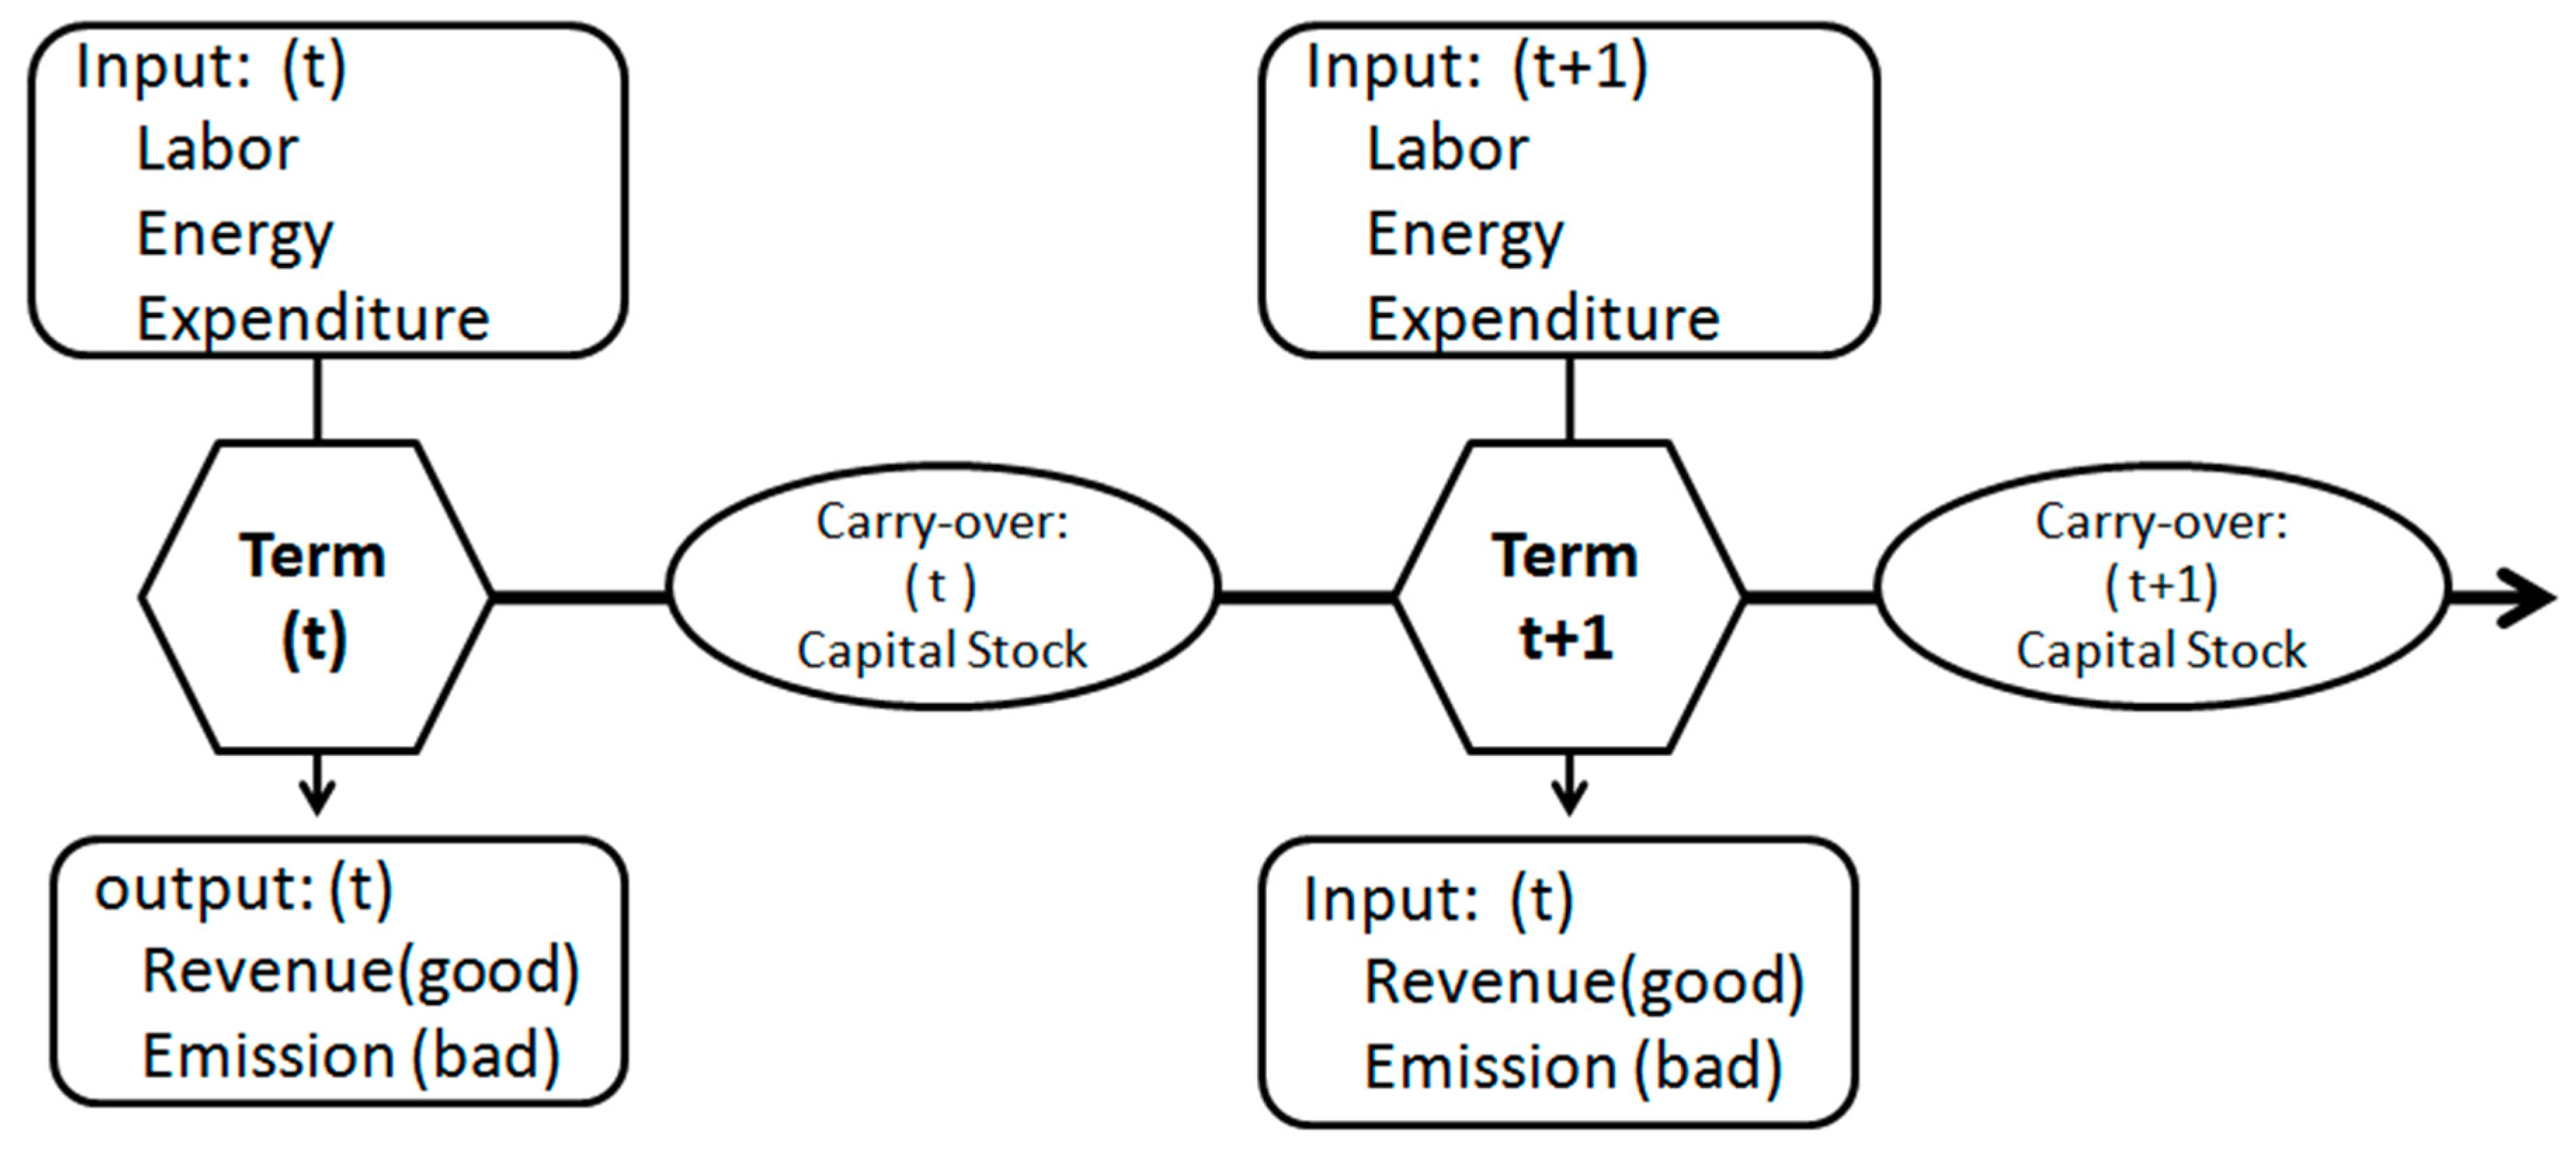
The dynamic slacks-based measure (SBM) is an application of the data envelopment analysis (DEA) method. As DEA is an efficiency analysis model for multiple inputs and outputs, more research studies are applying this form of energy-efficiency assessment. Compared to most studies based on DEA models, the dynamic SBM model normally uses a capital variable as the carry-over term in between two periods. Therefore, one can interpret the carry-over (capital) variable by the dynamic SBM model for analyzing and comparing continuous changes to decision-making units (DMUs) over years.
Färe et al. [
5] first applied the DEA method to the field of energy and environment, evaluating energy efficiency through the DEA method on DMUs by using labor, capital, and energy consumption as inputs, and GDP as output. With an emphasis on the greenhouse effect, some scholars have analyzed CO
2 as an undesirable output item. Such studies first appeared in comparisons between Organization for Economic Co-operation and Development (OECD) countries, such as those of Zaim et al. [
6], Färe et al. [
7], and Zhou and Ang [
8]. With China’s strong economic growth and the imbalance between regional developments, some scholars have used the DEA international comparison method for comparisons among its provinces. Hu and Wang [
9] used labor, capital, and energy consumption as inputs, and GDP as an output item, to analyze the energy efficiency of 29 provinces. Since then, this method has been used to analyze China’s energy efficiency, including by: Wei [
10], Chang and Hu [
11], Zou [
12], Li and Lin [
13], and Zhou et al. [
14]. In recent years, some scholars have begun to evaluate energy efficiency by adding an undesirable output, such as Choi et al. [
15], Wang et al. [
16], and Wang et al. [
17]. Many scholars have included China’s air pollutants other than CO
2 such as SO
2 or PM2.5 as undesirable outputs for analysis, such as Yeh et al. [
18], Wang and Feng [
19], Zhang and Choi [
20], and Yu and Choi [
21]. The above studies are based on static analysis.
Kao [
22] emphasized that dynamic analysis is necessary whenever data are available, because system efficiency is a linear combination of the period efficiencies of a dynamic system, and ignoring the dynamic nature produces overestimated efficiencies. There are some common methods that have been employed to analyze changes in energy efficiency, such as those with window analysis and the Malmquist index. For example, Sueyoshiet al. [
23] applied DEA window analysis to a data set on United States(U.S.) coal-fired power plants during 1995–2007, and found that these plants have gradually paid more attention to environmental protection issues. Wang et al. [
24] used the DEA window analysis technique, analyzed China’s regional total-factor energy and environmental efficiencies, and found that environmental efficiency in China slightly increased from 2000 to 2008. Wu et al. [
25] used Malmquist indices to investigate the energy utilization efficiency of China’s 30 provinces, and found that the eastern region is better than the central and western regions regarding energy efficiency. Yao et al. [
26] applied the meta-frontier non-radial Malmquist CO
2 emission performance index to estimate the changes in China’s CO
2 emission performance. Wu et al. [
27] measured the regional energy and environmental performances in China by using DEA-based Malmquist indices, and found that most regions exhibited a declining trend in technical efficiency and an increasing trend in technical progress during the 11th five-year plan period (2006–2010).
Tone and Tsutsui [
28] suggested that window analysis and the Malmquist index usually neglect carry-over activities between two consecutive terms, and developed dynamic DEA into a dynamic SBM within the SBM framework. Appling this method, Guo et al. [
29] used energy stock as a carry-over to evaluate the inter-temporal efficiency for executive efficiency based on fossil fuel CO
2 emissions in OECD countries and China. Ke [
30] used capital stock as a carry-over to evaluate the energy efficiency of Asia-Pacific Economic Cooperation (APEC) member economies over 18 consecutive years.
Some scholars have focused on China’s industrial sector to explore the relationship between energy consumption structure, energy intensity, government policies, and other factors related to energy efficiency. Cole et al. [
31] found that China’s industrial emissions have a positive function on both its energy use and human capital intensity, and a negative function on its productivity. Wang et al. [
32] noted that energy consumption and economic growth are the long-run causes for CO
2emissions, and that CO
2emissions and economic growth are the long-run causes for energy consumption, indicating that China’s CO
2emissions will not decrease for a long period of time, and that reducing CO
2emissions may handicap China’s economic growth to some degree. Yang et al. [
33] found that there is a lack of cooperation among local governments to continue reducing energy intensity, and hence complementary policies for reducing energy and carbon intensities are needed. Dong et al. [
34] indicated that the industrial sector has a better reduction potential than the other sectors, and suggested that the Chinese government should consider adjusting the energy consumption structure into existing energy policies and measures in the future.
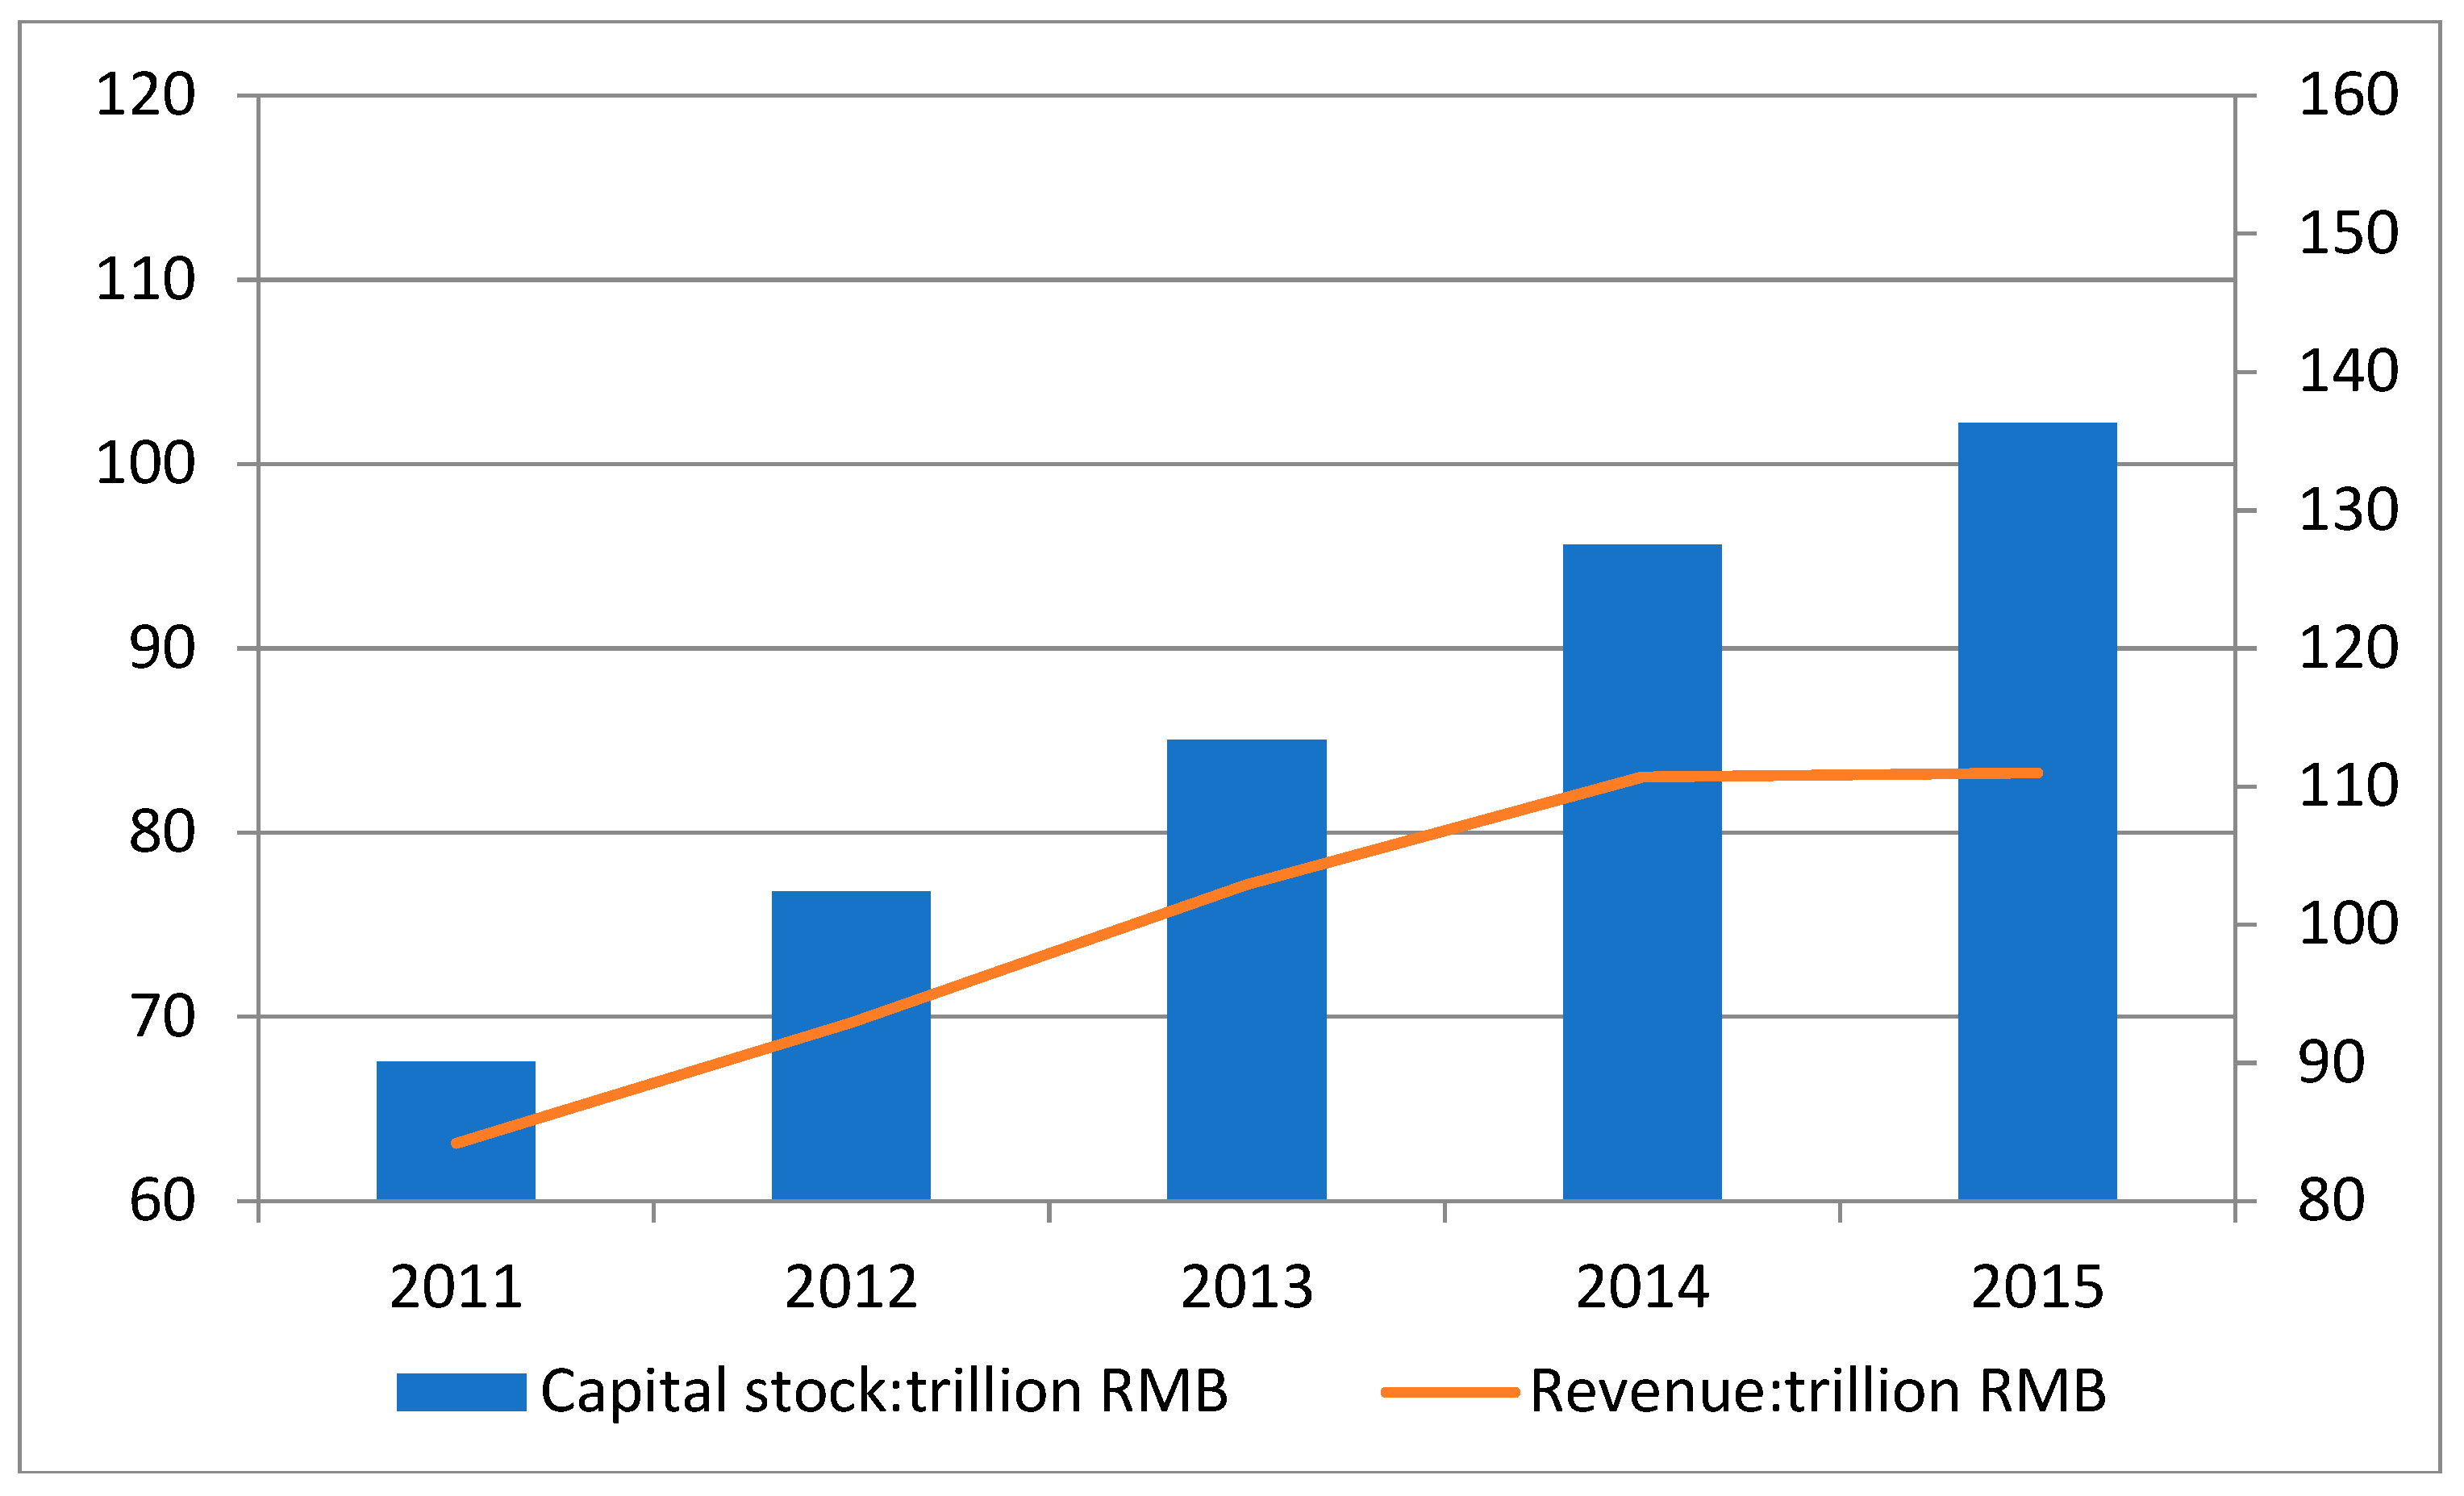
As mentioned earlier, through the intervention of the Chinese government, companies have increased their capital investment in waste gas treatment. The result showed that for the period between 2011–2015, that there was a significant rise in the number of industrial waste gas treatment facilities in China’s industrial sector. Previous studies that employed the DEA method to assess energy efficiency often used population, capital, and energy as input variables, and GDP and undesirables (such as CO
2, SO
2, PM2.5, etc.) as output variables. In our research, we will add the expenditure on industrial waste gas treatment facilities (i.e., Expenditure) as a new input variable and apply industrial waste gas emissions (i.e., Emission) including CO
2, SO
2, NO
x, Soot etc., as an undesirable output variable. In the selection of models for dynamic efficiency values, we are trying to make the necessary modifications to the dynamic SBM model proposed by Tone and Tsutsui [
28] that will make it suitable for analyzing data with an undesirable output. Then, we define the efficiency value as energy and emission-reduction efficiencies. Previous studies have discussed the impact of energy efficiency improvements on the optimization of the energy consumption structure and the reduction of energy intensity. The authors used the estimated efficiency results to establish treatment intensity and emission intensity as new indicators that can help evaluate whether emission treatment has a positive effect on improving energy and emission-reduction efficiencies.
The purpose of this study is to explore the case of considering the emission treatment, energy consumption structure, and energy intensity as factors in tests. Emission intensity exists as a factor that affects the dynamic change of efficiency, in order to see if there is a positive effect on whether the change in treatment intensity improves energy and emission-reduction efficiencies.
3. Empirical Study
Based on the modified dynamic SBM model (8), this study estimate the energy and emission-reduction efficiency values of the industrial sectors in 30 provinces of China.
Table 2 reports the results of the estimation.
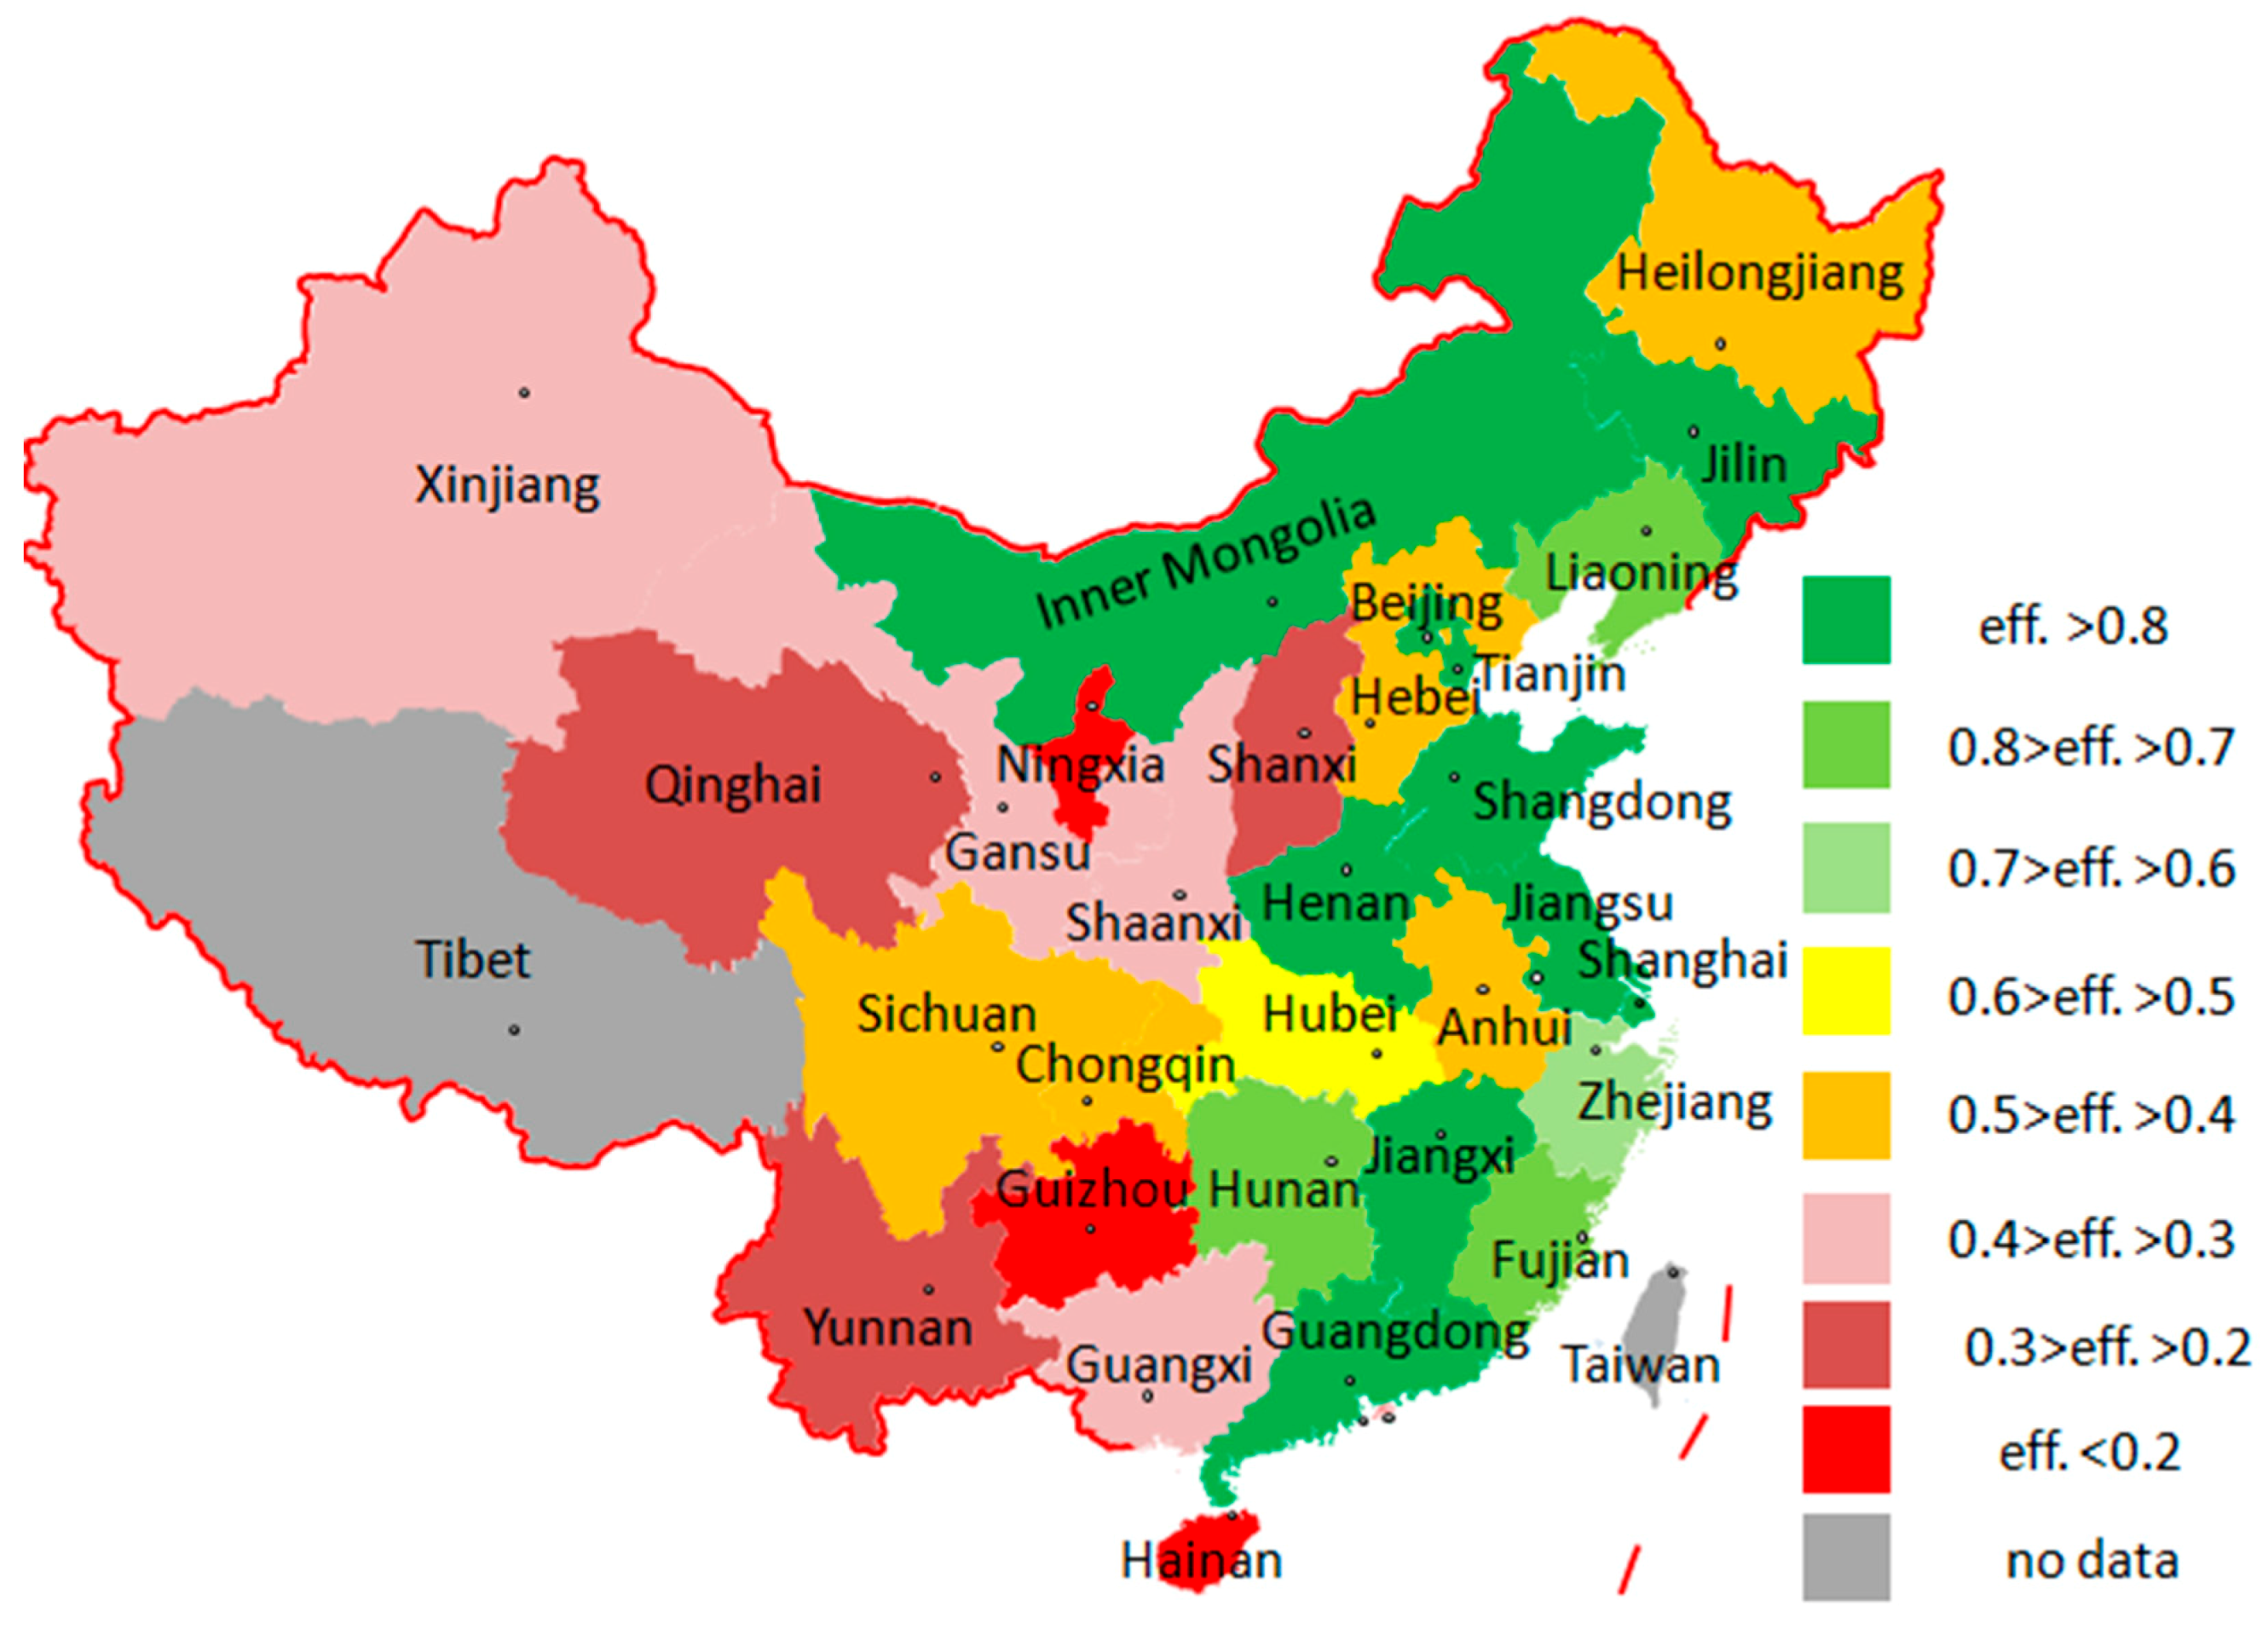
Figure 4 and
Figure 5 compare the values of 2011 and 2015, and allow us to visually see the changes in values over the past five years.
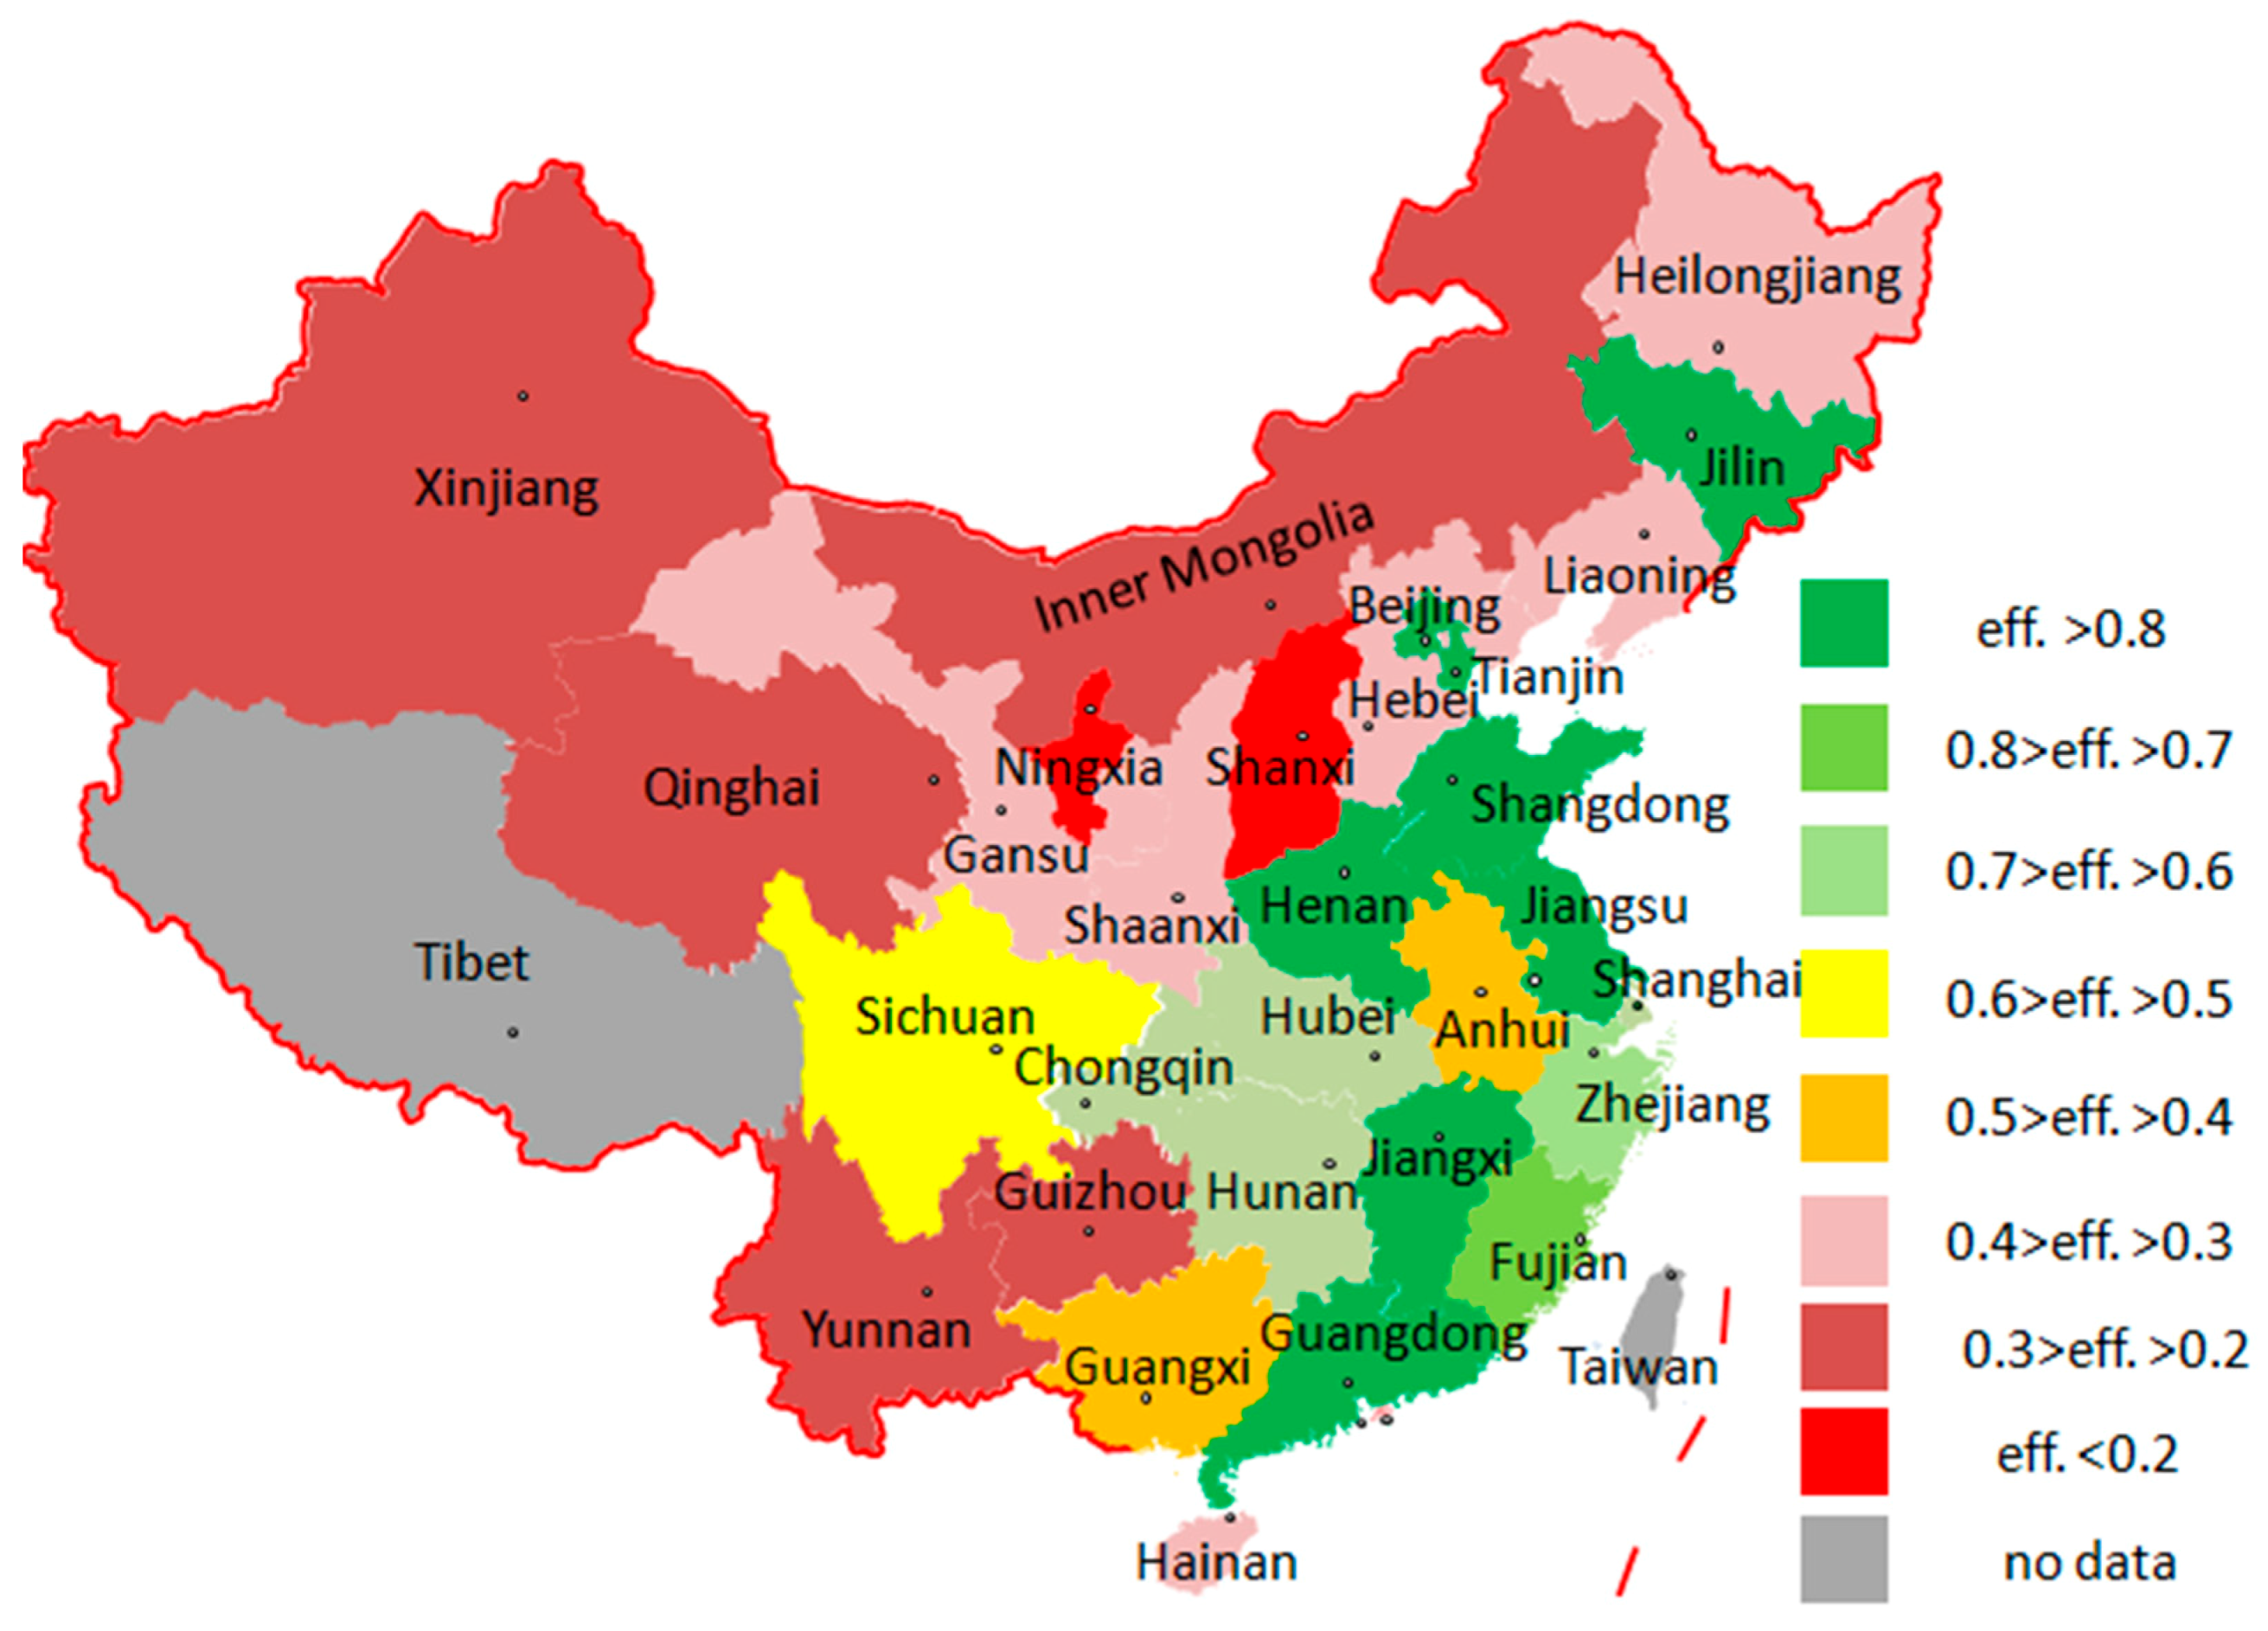
Table 2 shows that there are large differences in the efficiency values of the DMUs in different provinces, and divides the DMUs into different groups based on their values and changes over the five years.
These figures show the DMUs that have maintained a high level of energy and emission-reduction efficiency values over the five years, including Beijing, Guangdong, Jiangsu, Jiangxi, Jilin, Shandong, Shanghai, and Tianjin. Seven of the values of these eight DMUs (excluding Shanghai) are one during the five years; Shanghai fell in 2015, but its average value is 0.949. Among the 30 DMUs, only these eight DMUs’ values were greater than 0.8. This group of eight DMUs can be marked as H (High efficiency). For this group, most of them are located in eastern coastal areas with more developed economies, except Jiangxi and Jilin.
Second, it indicates the DMUs that had low energy and emission-reduction efficiency values within the five years and no growth trends; these included Gansu, Hebei, Ningxia, Qinghai, Shaanxi, Shanxi, Xinjiang, and Yunnan. These eight DMUs’ values were all less than 0.4. Although the values for Guizhou and Hainan are less than 0.4, their efficiency values show a significant upward trend, and treat these two DMUs separately. This group of eight DMUs can be marked as L (Low efficiency).
Third, it shows the DMUs that had a significant increase in energy and emission-reduction efficiency values over the past five years, including Chongqing, Guangxi, Guizhou, Hainan, Hubei, and Sichuan. Therefore, note that four of the six DMUs are concentrated in the southwest; this group is marked as I (Increase efficiency).
Fourth and finally, the DMUs that had a significant decline in energy and emission-reduction efficiency values over the past five years included Hebei, Heilongjiang, Inner Mongolia, Liaoning, and Shanxi. It can be seen that four of the six DMUs are located around the capital, Beijing, whereas Hebei, Shanxi, and Xinjiang also belong to the L group above; this group was marked as D (Decrease efficiency).
The results from this study can be compared to previous studies by conducting a dynamic analysis of China’s energy and environmental efficiency. Eastern China has the highest efficiency, followed by central China, and western China has the worst (Wang et al. [
24]; Wu et al. [
27]). Yao et al. [
26] found that the average emission performance of the industrial sector in eastern, central, and western China decreased in turn. The gap of efficiency values between eastern, central, and western regions are shown in
Figure 4 and
Figure 5, but this study pointed out that there was a significant decrease in some of the eastern provinces such as Liaoning and Hebei, as well a significant increase in some of the western provinces such as Chongqing and Sichuan. The results show that it is related to expenditure as an input added in this study.
5.Conclusions and Policy Recommendations
The Chinese government increased its control over energy conservation and emission reduction in the industrial sector, and achieved improved results over the period 2011–2015. Based on the existing research, we added the expenditure of industrial waste gas treatment as a new input variable, modifying the dynamic SBM model to make it suitable for analysis with undesirable output. Through this, we then estimated the energy and emission-reduction efficiencies of China’s industrial sector over this time.
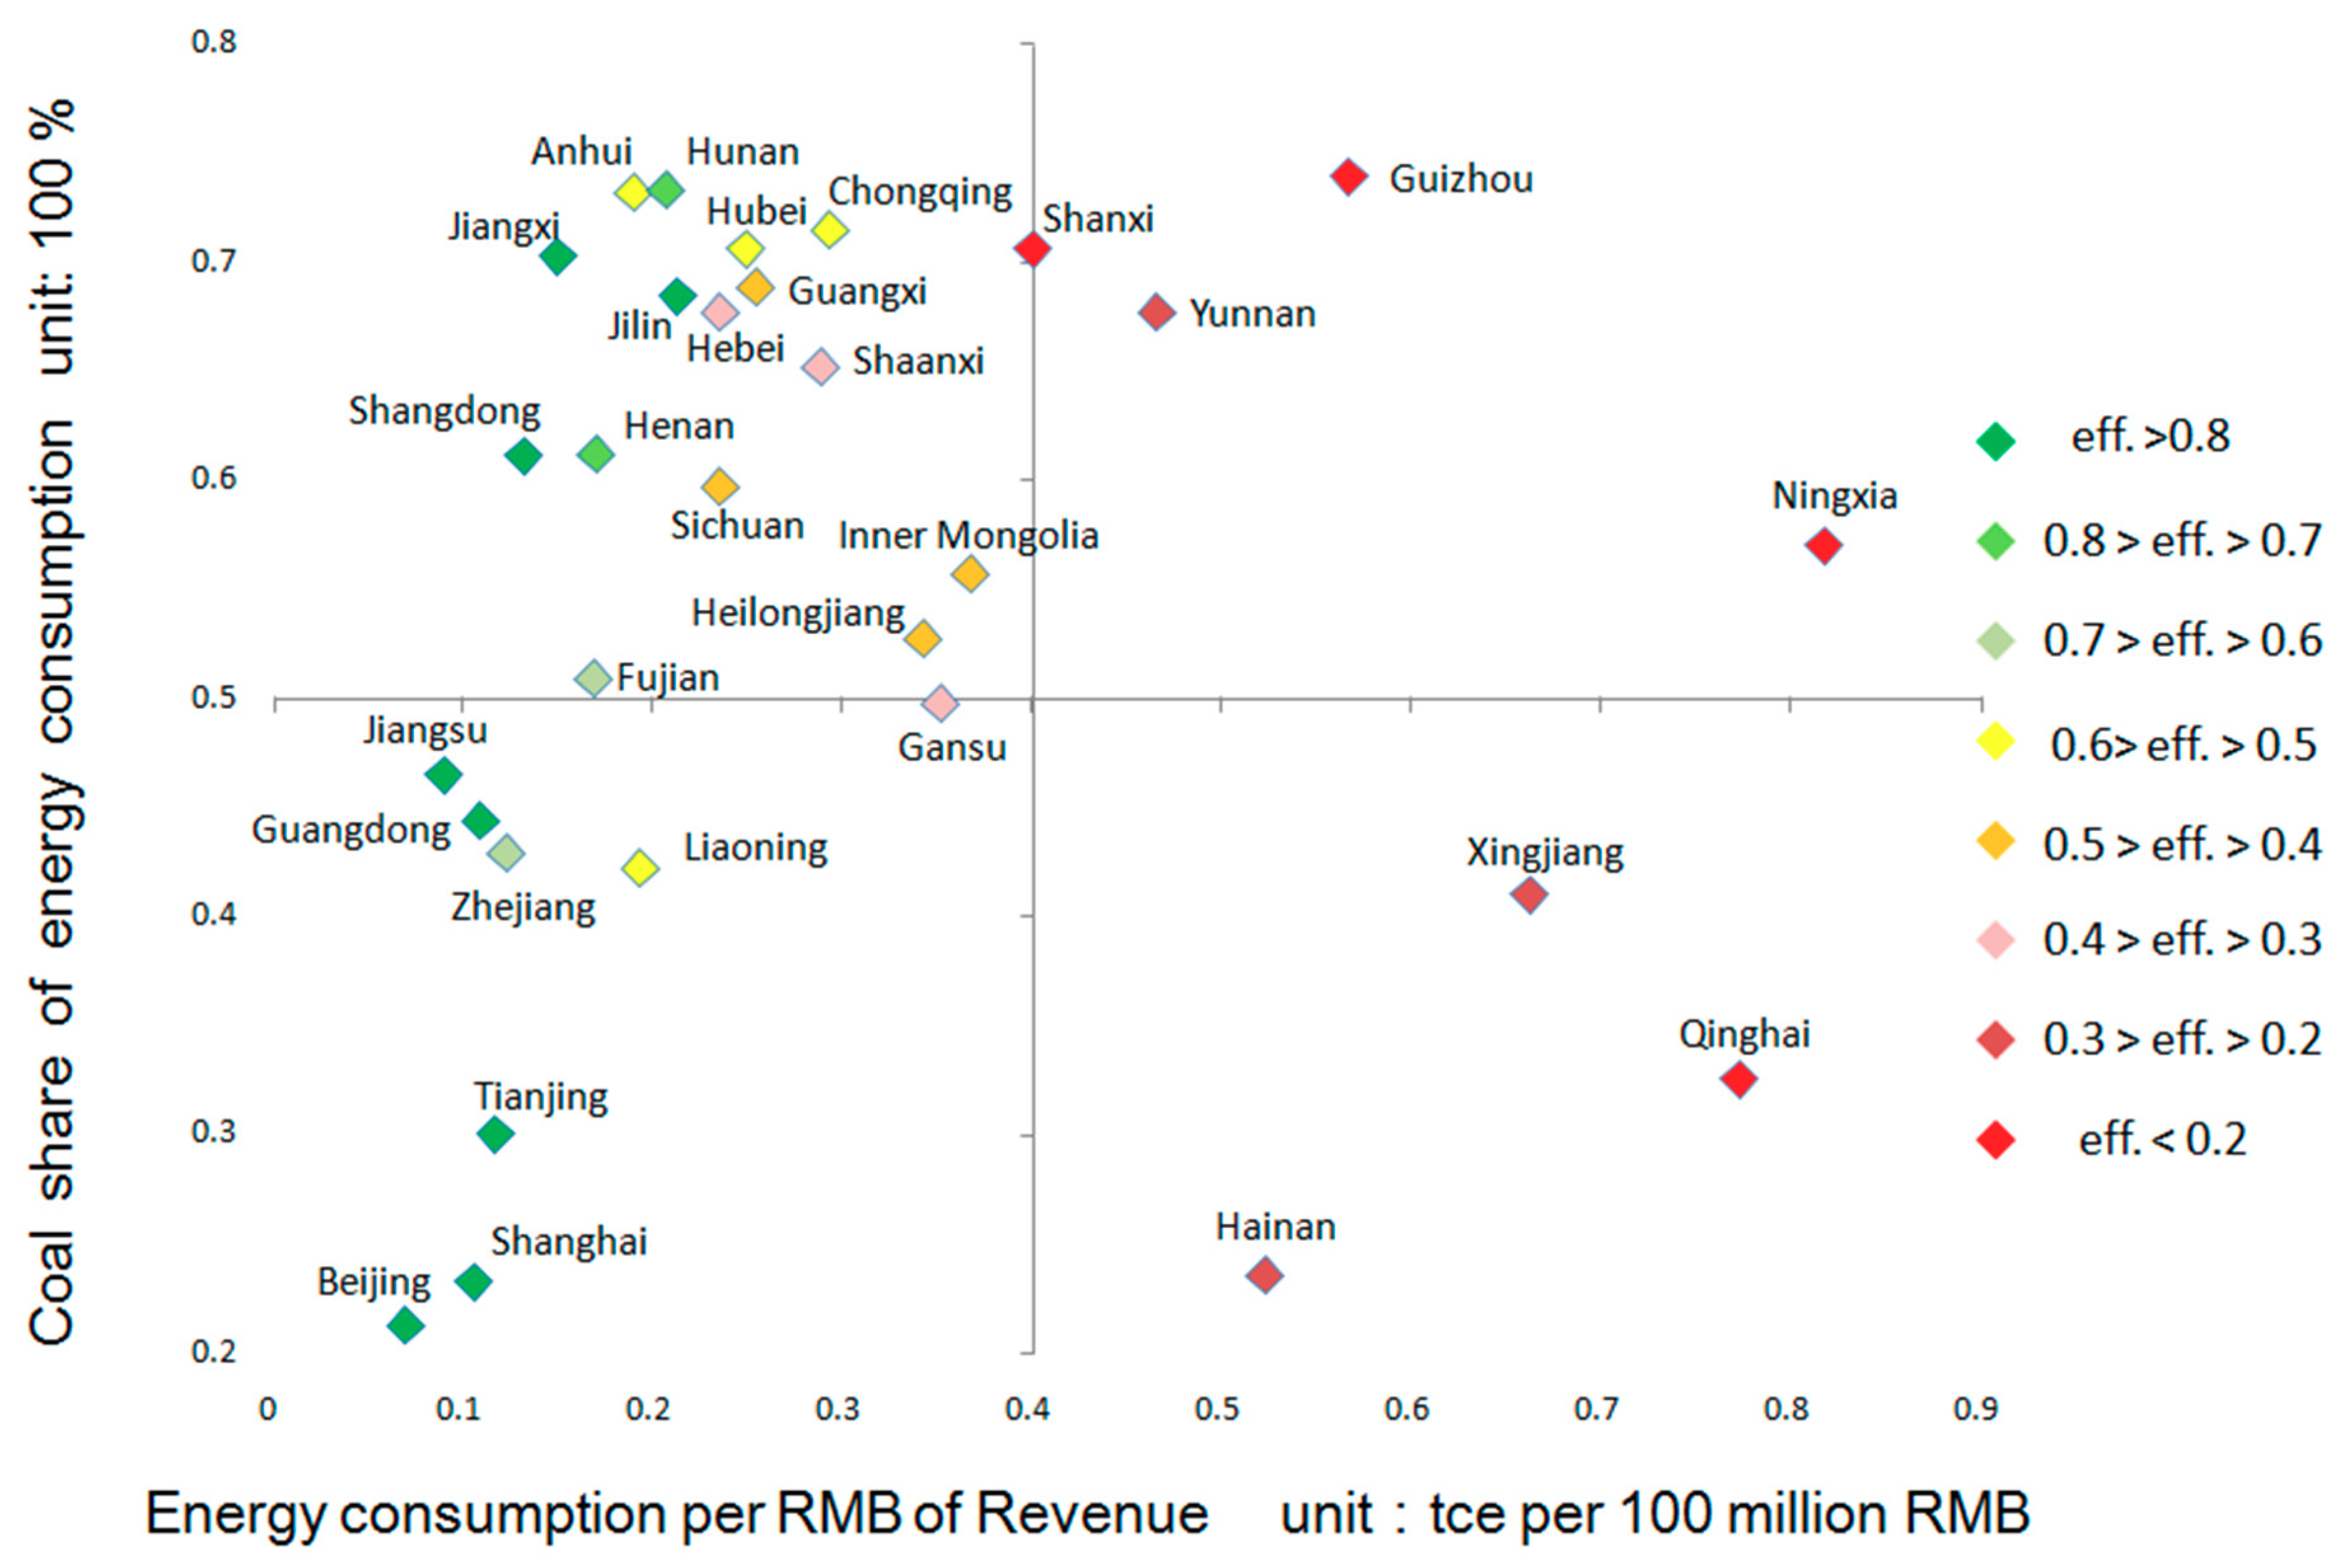
According to the results, we found that the DMUs with higher efficiency values were mainly distributed in the eastern coastal areas and usually had lower energy intensity. They also took a leading position in the process of energy consumption restructuring by replacing coal with clean energy; these included Beijing, Tianjin, Shanghai, Guangdong, and Jiangsu. In the central and western regions, the adjustment of energy consumption structure was slow, and there was more room for improvement. Some DMUs had improved their efficiency values; this was mainly due to a reduction of energy intensity, and included those of Guizhou, Chongqing, Sichuan, and Hubei. Some DMUs had decreased efficiency values due to the increase in energy intensity, such as Liaoning, Inner Mongolia, Shanxi, and Xinjiang.
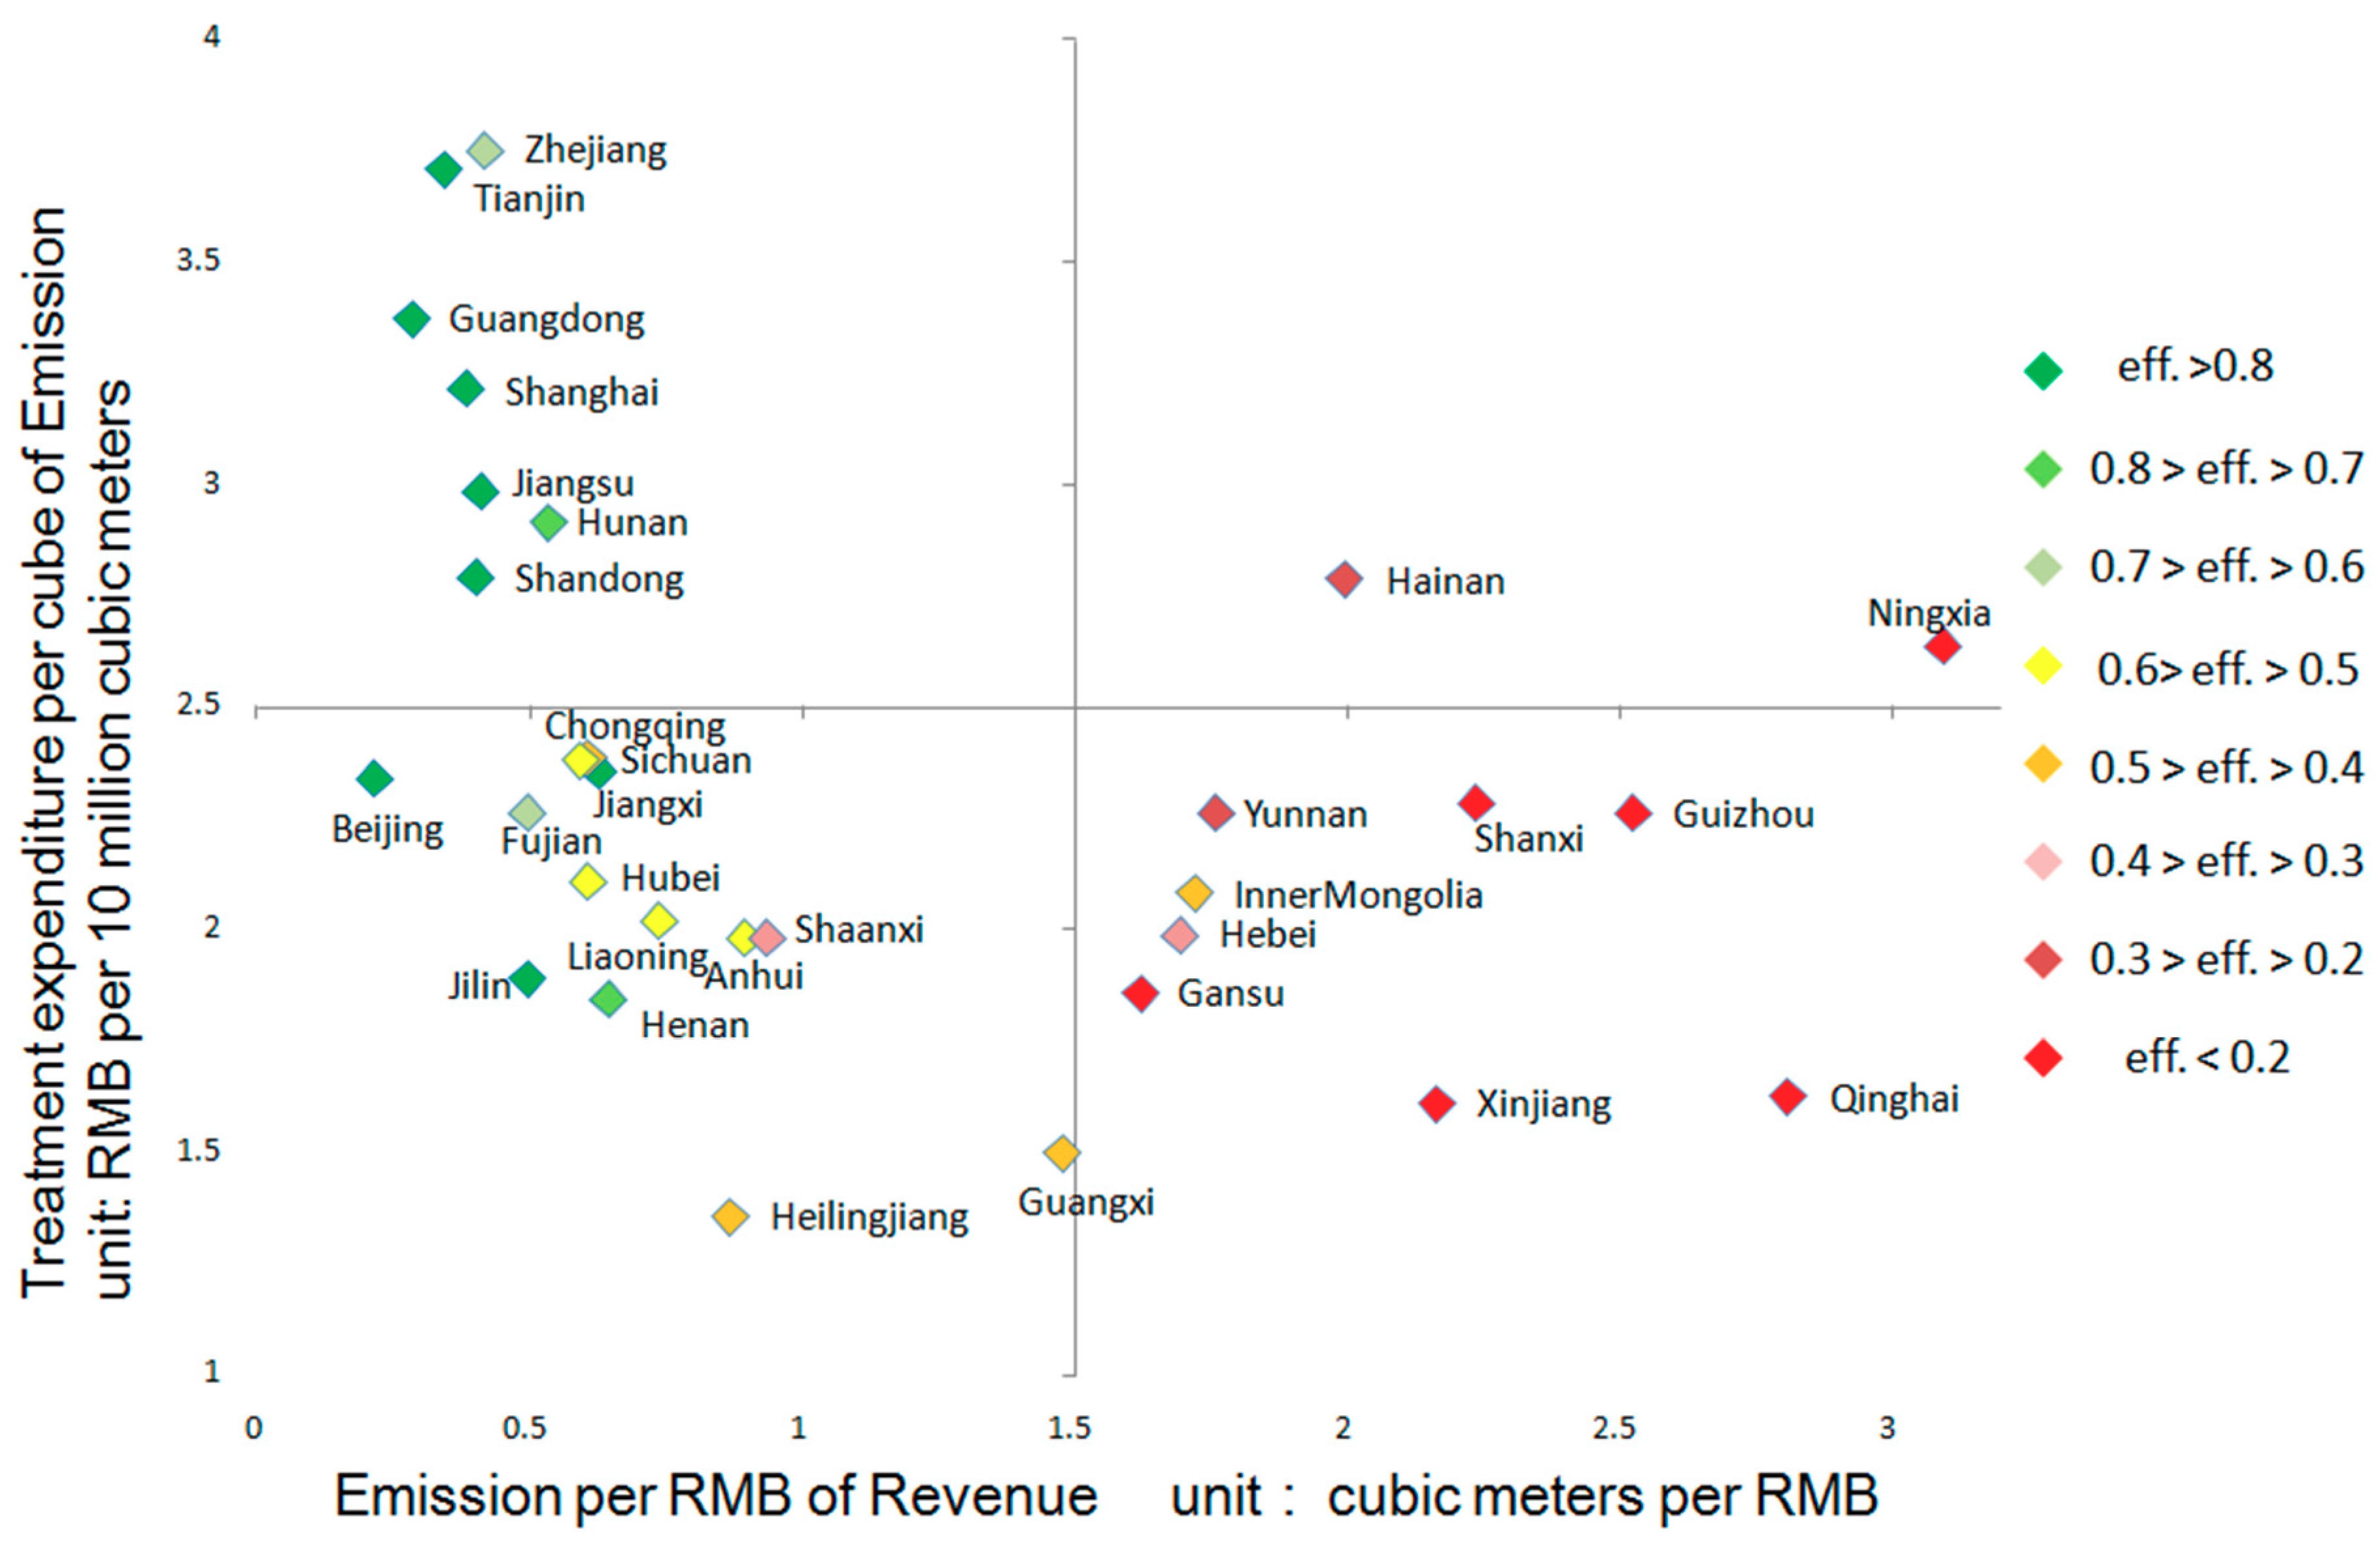
For the DMUs that increased their expenditure on the treatment of industrial waste gas in order to reduce air pollution, this effect was better than the energy-efficiency reduction caused by increased input. The DMUs with higher efficiency values typically had higher treatment intensity and lower emission intensity. Some DMUs had higher treatment intensity, and their emission intensity was significantly reduced, thus maintaining high efficiency values or improving their efficiency values; these included Jiangxi, Jilin, Guangxi, and Hainan. Some DMUs had higher or increased emission intensity; those DMUs could increase the expenditure of industrial waste gas treatment as an effective way to reduce air pollution, and thus further sustainably promote the improvement of their energy and emission-reduction efficiencies. This includes the DMUs of Guizhou, Qinghai, Xinjiang, Inner Mongolia, and Shanxi.


