1. Introduction
According to the announcement of the UNWTO (United Nations World Tourism Organization) [
1] in 2017, tourism is the fastest growing industry in the world economy over the last 60 years, producing 10% of the world’s GDP, creating one out of 10 jobs, and accounting for 7% of global exports. Among various kinds of tourism industries, casino business is classified as one with high added-value and an alternative tourism product which can overcome limitations in a climate environment as it is named as the golden industry without chimneys. The casino industry is cultivated and developed as a core industry of tourism with the goal of gaining foreign currency and various economic effects such as securing revenue for local governments, activation of local economies, creating income and jobs for local residents, redeveloping cities, diversifying leisure activities, and attracting foreign tourists [
2]. Therefore, countries that are legally regulated by the casino industry are also moving to adopt and expand the casino industry. Asian countries including Korea are striving to grow casino industries with the aim of economic benefits, such as attracting foreign currency through overseas capital investments. It is seen that there is a move towards activating the casino industry in Asian nations, and Thailand, Japan, Vietnam, and the Philippines, especially, are expanding their existing casino businesses further, and Singapore is tapping into the casino industry [
3].
As an industry that attracts foreign exchange, the casino industry’s rate of foreign exchange earning reaches about 98 percent. When it comes to revenue received in foreign currencies of domestic casino industries, it hit 1 billion 15 million and 982 thousand dollars in 2011 from 334 million 335 thousand dollars in 2003; the casino has consistently recorded a high foreign exchange income of over 1 billion [
4]. Likewise, the casino industry is no doubt a source of earning foreign exchange, and an important industry that attracts foreign tourists.
The casino industry is in an image transition from being negatively recognized as gambling to a more positive one that it is for leisure, and because of this its users are expanding to common people and tourists. Thus, casino users are becoming more diversified and popularized [
5]. In other words, the casino industry in Asian nations, as well as Europe and the US, which have maintained casino industries for a long time, are attempting to expand and activate the casino industry. As a result, the casino industry has reached a point where a change into a customer-oriented paradigm is required in order to escape from the existing operation manner and to implement differentiated strategies for the sustainability and growth of the casino industry in an environment where inter-state and inter-the regional competition which is mounting. In this regard, research on systematic methods to manage customers is being actively conducted and measured to create customers who repeatedly visit casinos, enhance positive word of mouth effect, and improve long-term profit by maintaining long term ties with customers [
6]. Ultimately, it is deemed that the key to customer-oriented strategies is to win customers with more values and researching the way to maintain attracted customers is the key to winning a competitive edge which is very important. Also, customer value analysis (CVA) on which customers contain higher values or higher potential values compared to others is the key to customer-oriented strategies, and quantifying values of certain individual customers or certain customer groups and making use of such data will help to understand and manage enterprise-customer relationships [
7].
In this case, the prerequisite is to fulfill expectations on receiving a certain special service and to provide customer-convenience, and the fundamental procedure is customer lifetime value (CLV) analysis and measures to improve customers’ loyalty [
8].
The sustainability and growth of casino industries at the moment amid fierce competition depends on changing manners of management into customer-oriented methods, and companies recognize the importance of measuring and forecasting the value of customers for efficient customer management [
9], as differentiated customer marketing [
10] by newly analyzing values and loyalties of customers is necessary to catch up with the changing environment of managing casino industries.
Depending on the development of customer lifetime value indicators, to make use of such indicators to casino management may be possible to facilitate marketing and reflect them to management strategies by exactly figuring out the values and desires of customers in order to win a competitive edge in the casino industry in the future. Thus, this paper will analyze characteristics of customers of casinos which differ from other businesses and develop customer lifetime value indicators for the stakeholders of related fields. In addition, this study will examine the ways to actually help management of sustainable casino businesses in the future through customer value analysis.
2. Literature Review
2.1. Concept of Customer Value
The modern customer does not want to be satisfied with only value quality or service quality, but with all quality, both service quality and price as provided by an enterprise. When a customer expects their needs to be fulfilled from an enterprise, what an enterprise gives to satisfy such customer is customer value from the perspective of customers. Therefore, companies need to simultaneously provide the price, product quality, and service quality meeting customer value [
11], and they must achieve differentiation or price competitiveness to secure a competitive edge [
12] in order to bring an enterprise’ ultimate gains and competitive advantage over other enterprises. That is, when maintaining a long-term relationship with customers, an enterprise can have a better understanding of what customer demands are, which leads to providing differentiated values and ultimately giving satisfaction to customers.
Zeithmal [
13] defined customer value as customers’ overall evaluation for all the costs customers paid and all benefits he/she obtained from a singular angle. Gale and Wood [
14] defined the relative price of a product as adjusted cognitive quality and customers’ opinion for a product or service by comparing with the competitor’s quality. Kotler and Armstrong [
15] defined customer value as customers’ evaluation for the differences between costs paid to the market and conveniences obtained in comparison with competitive alternatives. Through precedent studies, customer value can be defined as the degree of value the customer thinks about some product or service.
Customer value, which is also called economic value, can be measured by a customer’s utility value based on the perception of the costs and benefits of using the product [
13], and the most fundamental of all marketing activities is the creation of customer value [
16].
Customer value may be divided into the perspectives of customer and enterprise. From the perspective of the customer, the customer pays monetary expenses and intangible expenses, such as time, for the purchase of the product, and earns a benefit, such as the quality or convenience perceived through the good and/or service, in view of his subjective evaluation of utility for expenses paid for the product and/or service against the benefit earned. That is, if the customer has a large perception about the quality or convenience obtained for his provided tangible or intangible expenses, it can be rated as a high customer value, and vice versa, as a low customer value. Perspective of enterprise measures the economic value customer relations provide an enterprise with, largely using the techniques of the customer lifetime value put into customer-contributed net profit or contribution margin, model of measuring customer net profit value, or RFM(Receny, Frequence, Monetary) model. From the perspective of customer value, it can be said that CRM is an organizational activity to analyze and apply a marketing database and to use communication technology so that we may establish a strategy and specific methodology to maximize individual customers’ lifelong value.
Though companies provide diverse benefits through customer card systems, mileage, or membership to enhance long-term relationships and loyalty, all customers are not the same. So, through evaluation of each customer and analysis of which customer is loyal or likely to fall off, enterprises should grasp valuable customers who would ultimately benefit the enterprise to create its economic effects through maintaining continued relationships [
17]. In addition, regardless of their past purchase recognition getting apart from their past recognition of purchaser, enterprises began to focus on customer value with the understanding that a customer is an economic asset that has a direct influence on their management performance. They have become familiar to the different values of each customer because all customers have different characteristics and lifestyles.
For any form of customer, the values the customer provides to an enterprise and the values he/she earns through an enterprise are all different. For an enterprise, the concept of customer value is important because it is the basis for what strategy it will carry out for each departmentalized customer remove this part (unnecessary explanation) by how to divide what customers and for a customer’s decision-making on whether to continue transacting with an enterprise.
2.2. Characteristics of CLV
Customer lifetime value (CLV) is the financial value in conversion of the profit (revenue − cost) to be earned from customers for a certain future period into the current value based on a discount rate. Though it is a simple model, CLV has an important meaning because it allows evaluating the future value that customers could bring to an enterprise. Berger and Nasr [
18] define customer lifetime value as the profit or loss received from a customer for a period of transactions in a relationship with an enterprise. Gupta and Lehmann [
19] define it as the current value of all things that can occur from a customer against future profit. Jain and Dovrolis [
20] define CLV as the converted current value for the remainder of expenses subtracted from sales occurring from a current and future customer. He/she explains that this is the sum total of corporate gains expected to be expended from one customer and a systemic method to be able to understand and evaluate the relationship with an individual customer.
Customer lifetime value can be used for setting the goal of costs to be expended for securing customers to increase marketing performance, assigning funds to secure customers, choosing a proposal to secure customers, and supporting activity to maintain customers. Since expending excessive costs to secure customers can act contrarily as loss, it is proper to secure new customers at the cost under half the customer lifetime value [
21]. Customer lifetime value may vary depending on the type and value of the first sales, so decisions should be made on what product or proposal to use for each value. After grasping the customer lifetime value of a customer group, it is possible to decide on how much to invest in maintaining a customer. That is, since not all customers are worth securing, it will be a wise management strategy to check the results of evaluating customer values and then go into the activity of maintaining customers in accordance with the most valuable customers [
21].
At this time, to assess customer lifetime value accurately, you must think about contribution margin (past customer value), customer lifetime period, activity probability, and discount rate to consider estimated lifetime profit and acquisition cost together. Besides, to measure contribution margin, you should consider recurring revenue of relevant customers and concomitant recurring cost. It is a big difference from the existing simple customer valuation by sales because customer lifetime value considers every cost taken to generate the relevant sales together with the future remaining lifetime [
18].
2.3. Previous Research of CLV
This study has reviewed the previous research related to the customers’ life value in order to develop the value of customers’ life in the casino industry.
Cho and Heo [
22] drew a customer value model on the subject of cosmetic customers at a department store and set up a marketing strategy suited for the characteristics of departmentalized groups of the customer value model calculated this way to present a plan for increasing efficiency of differentiated customer management. Lee and Yoon [
23] presented a technical model for customer lifetime value analysis for those who used an airline and a reasonable management plan through departmentalizing customers. Kang, Han, and Shin [
9] assumed that the current customer value of the most basic CLV model would be fixed in the future, too, and that customers’ purchase patterns would remain changeless in the future. Then they presented a new CLV model by complementing the drawbacks of measuring profits being difficult in the true sense of the meaning because there was no consideration for attracting customers and costs for it involved. Reichheld [
24] proposed a CLV model in consideration of future gains and individual customers’ anticipated period of maintenance following profit patterns of customer lifestyle. Beger and Nasr [
18] proposed diverse CLV models applicable to types of customer behavior. Mayer [
25] attempted to measure customer value using existing accounting systems. Blattberg and Deightom [
21] proposed a measuring model using customer equity.
In the casino industry field, there have been attempts to develop a CLV. Park [
26] presented a customer lifetime value model among big data analyses on the casino industry in order to draw efficient operation plans and polices for the casino industry.
The purpose of this study is to utilize basic data and a methodology to derive the CLV of the casino industry based on customer life value research.
3. Methods
3.1. Procedure of Study
This study aims to develop the indicators for assessing the lifetime value of a casino customer for sustainable and growth of the casino industry. To accomplish the purpose of study, we considered the foregoing studies on the Delphi method to draw intuition and agreement of specialists in the casino field and AHP (analytic hierarchy process) that can test inter-item importance and priority through pairwise comparison by item based on items drawn. In order to accomplish the purpose of this research, previous research was reviewed and summarized, and the Delphi method was used to develop the lifetime value index of casino customers. Studies related to the development of indicators in new fields were conducted through intuition and consensus of experts through the Delphi method [
27,
28].
The Delphi method is a study method of collecting opinions of specialist groups and drawing collective consensus by analyzing them overall. Since it is a study method to draw a conclusion in the process of systematization, selecting the subjects of specialist groups is very important, and characteristic of the Delphi method, the size of reference groups can act as an important factor. The goal of the Delphi survey is to integrate intuitions possessed by specialists [
29] and it is the survey method that goes through collecting views carrying out questionnaires repeatedly by composing the panel of specialists. The Delphi method is expected to carry out questionnaires on the same subject repeatedly, usually 3–4 times. Brockhoff [
30] maintained that the accuracy of measurements increases until the third Delphi and decreases from the 4
th, while Delbecq, Ven, and Gustafson [
31] argued that the 2nd to 3rd Delphi is good enough [
30,
32].
The process of survey for this study is like this: For the first Delphi survey for “developing indicators needed for measuring a casino customer’s lifetime value”, it was an open/closed mixed questionnaire on study questions without mutual contact with the Delphi panel selected earlier. From the second questionnaire, a closed questionnaire was executed, and after checking the results, the third Delphi survey was carried out to finish the Delphi surveys [
33].
The most important part of Delphi surveys is the Delphi panel, or the selection of the subjects. This study carried on with the surveys using specialists with a high degree of professionalism in the casino industry.
When finishing the drawing of evaluation items for constructing the model of casino customers’ lifetime value attributes through Delphi surveys, the order of priority for each item was determined through pairwise comparison using AHP. This was carried out over four steps in total: First, make the decision-making hierarchy including the purpose of this study and specific tasks. Second, collect input data through pairwise comparison. Third, measure relative weights using the eigenvalue method [
33]. At this time, to know whether there is coherence in respondents’ judgments, we had to draw the consistency ratio (CR) and checked the logical consistency. Fourth, draw the weights of question items finally by synthesizing relative weights [
34].
3.2. Concept Mapping for Casino Customer Lifetime Indicator
This study aims to develop measuring indicators to assess casino customers’ lifetime values. Based on the category of casino customer, indicator items of foregoing studies were drawn in the form of a chart through interviews with related specialists, selecting primary indicator items through it.
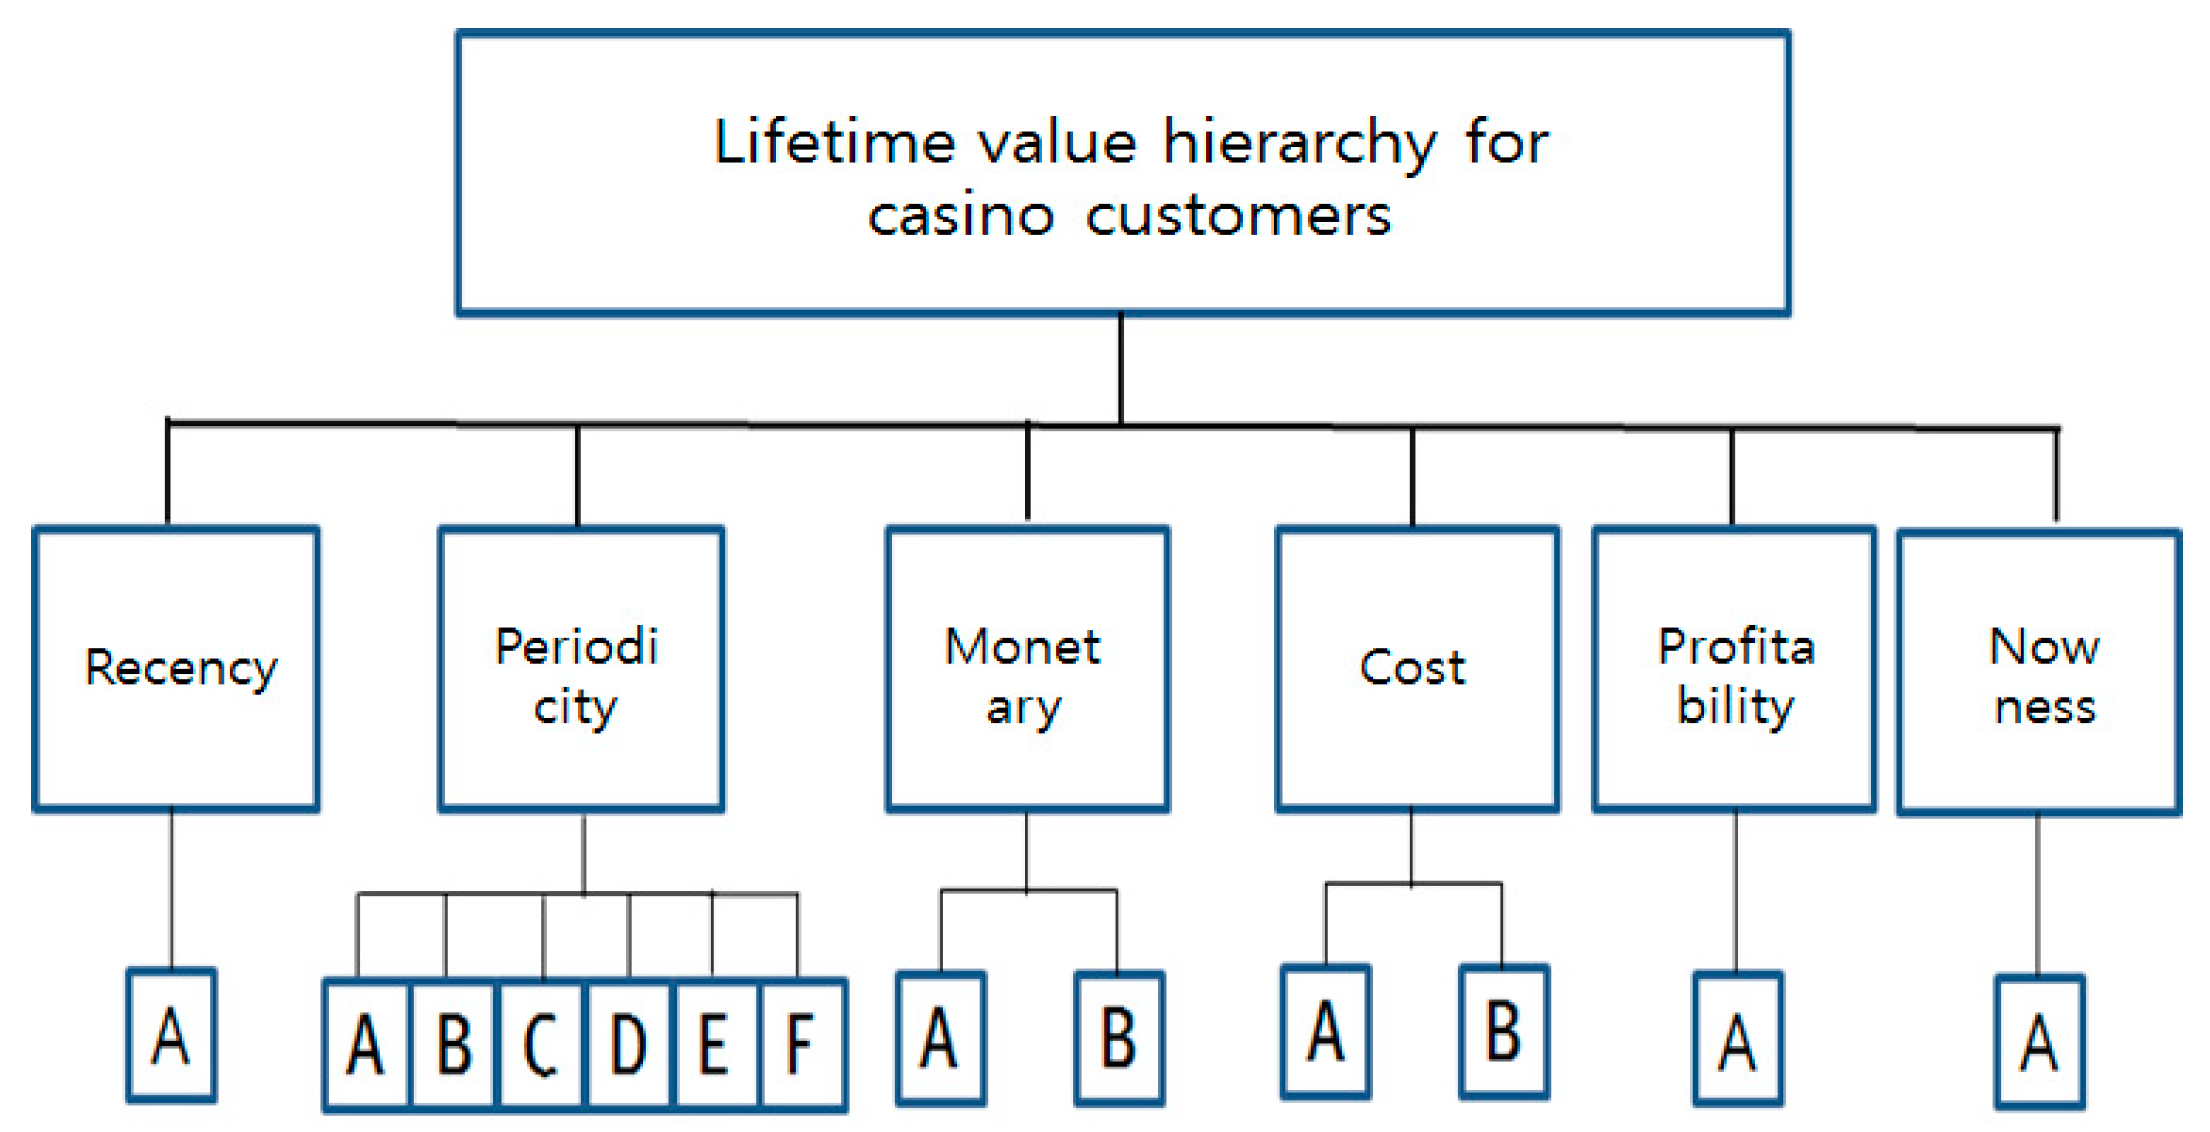
To go through the process of concept mapping [
33], after spreading the whole indicators, similar items were sorted and bound together. As a result of the drawing, the final concept mapping was composed including recency, periodicity, monetary, cost, profitability, and nowness. The result of concept mapping is shown in
Figure 1 below and related references are shown in
Table 1 below.
3.3. Standard for Selecting Delphi Panel
Since Delphi is a study method for prediction or decision-making by collecting views from specialist groups related to the theme, characteristically, it should be composed of those who have made contributions and are able to present opinions on the relevant study questions [
43]. Thus, for successful Delphi research, it is very important to select a Delphi panel who can continue to cooperate on questionnaires with a deep understanding of the relevant field [
44]. There is no set rule about the number of the panel and existing studies show that there are diverse studies using 10 to 1685 persons on the panel depending on the scope of questions and available resources [
45,
46]. However, Rowe and Wright [
32] recommend using 5 to 20 specialists, and some insist that most Delphi studies use about 15 to 35 specialists for the panel [
47]. Accordingly, this study is going to set the number of panelists within the proper scope recommended by foregoing studies and we secured a panel of 50 specialists in consideration of the reliability of the study results drawn and the efficiency for management. The final panel was comprised of panelists who were distributed diversely among casino industry workers, academics, government, and specialists in order not to lean toward any one group. The Delphi panelists of this study are shown in
Table 2 below.
3.4. Data Collection
The primary survey was aimed at employees at casinos and professors related to the casino industry, researchers, and public officers. The 1st answers were received from March 20th to April 1st, and 50 people gave answers by email. The 2nd survey was analyzed average and open questionnaire of results based on the 1st survey results, and we refined and revised lists. The answers were received from 3rd April to 20th April, using calls, texts, and regular mail in order to have an increased rate of responses. (Respondents were given a reminder to submit the survey and send it in). We received 48 answers by email (only sent an email to 50 people who are answered from the 1st survey). The 3rd questionnaire was based on the 2nd survey results, removing some lists. The period for the 3rd survey was from 25th April to 15th May, and we sent the email to the 48 people who answered the 2nd questionnaire. We received 47 answers. Finally, the AHP survey was included in the 3rd Delphi survey to see the weighted genetic concepts and indicator details.
4. Results
4.1. Result of the Delphi Survey
4.1.1. Result of the 1st Delphi Survey
The 1st Delphi survey developed new items, including questionnaires, to reflect the opinions of the related experts and workers in the field in addition to the items drawn from previous research, due to the lack of leading indicators that help clearly evaluate customer lifetime indicators of casino customers.
It excluded items rated 4.0 or less based on the average value and the items that five or more experts wanted removed. As a result of the 1st Delphi survey, in the recency factor, there were no items that were wanted removed by five or more experts, and those rated 4.0 or less based on the average value of the result. In regard to opinions on refining and adding items, the two items that were suggested were what were preferred games and customer status. In the result of the 1st Delphi survey in the periodicity factor, there were no items rated 4.0 or less based on the average. However, the monthly average time period of use was deemed the same as the to use period by five experts and was excluded. Opinions for refining and adding items suggested were deviation probability, companions, frequency of visit, game time, game participation rate, and continuity. In the monetary value factor, there were none rated 4.0 or less based on the average value of the 1st Delphi survey, but the average expense of use was excluded as it was deemed the same to the expense of one-time use. The opinions suggested to refine and add were to increase the rate of the average betting amount, cost of using subsidiary facilities, the highest price amount of use, and the lowest price amount of use.
There was no item in the cost factor of the 1st Delphi survey that was to be excluded because of the same reasons, and opinions of adding items such as credit, mileage accrual rate, rebate, and number of sales activities were suggested.
In the result of the 1st Delphi survey in the profitability factor, there were none to be excluded by such reasons, and the opinions suggested were expected such as earnings, house edge, hold rate, drop amount, and win/loss amount. There was no item in the nowness factor to be excluded, and suggested items were number of games.
In addition, opinions were suggested that loyalty factor should be added to the subcategory (e.g., recency, frequency) in order to measure customer lifetime value of casino users, and accordingly opinions on items of loyalty, corporate satisfaction, churning rate to competitors, and customer recommendations to be added were suggested. The result of the 1st Delphi survey is shown in
Table 3 below.
4.1.2. Result of the 2nd Delphi Survey
In the 2nd Delphi survey, items of 4.0 or less in the average value drawn in the 1st Delphi survey were excluded and items for the 2nd Delphi survey were chosen after a process of addition and refinement regarding opinions of the Delphi panelists.
First, the average value of all items in the 2nd Delphi survey results in the recency factor of casino customers’ lifetime value were found to be 4.0 or above. Thus, three items were decided for the 3rd survey. Second, as a result of the 2nd Delphi survey in the frequency sector, “durability” item was shown to have an average value of 4.0 or above, but it was deleted according to the opinions of five experts. Thus, nine items were decided on as questionnaire items. Third, there were none averaged 4.0 or less in the 2nd Delphi survey in the monetary value sector, but the highest price amount of use was deleted on the opinion of five experts. Thus, five items were decided as the 3rd survey items. Fourth, there were none averaged 4.0 or less in expense sector, but expense to attract customers, operation expense, credit, mileage accrual rate, rebate, and number of sales activities were deleted on the opinion of five experts as they cannot be drawn from the casino CRM.
Fifth, there were none averaged 4.0 or less in the profitability sector, but house edge and hold rate were deleted on opinion. Thus, three items were finally decided on for the 3rd survey. Sixth, there were none averaged 4.0 or less in the nowness sector, but discount rate and number of games were deleted as they cannot be drawn in the casino CRM. Lastly, there were none averaged 4.0 or less in the customer loyalty sector, but corporate satisfaction, churn rate to competitors, and possibility of revisit were deleted on the opinion of five experts. Thus, two items were decided on for the 3rd survey. The result of the 2nd Delphi survey is shown in
Table 4 below.
4.1.3. Result of the 3rd Delphi Survey
Items of the 3rd Delphi survey were decided after deleting items to exclude chosen by five experts and those averaged 4.0 or less in the 2nd survey, after addition and refinement. Same as the 2nd survey, items to be deleted were those agreed to be deleted by five experts or those which averaged 4.0 or less. On the process of the survey, 99% of the total opinion changes were found during the 3rd survey [
30,
32], thus it was deemed that the opinions were fully reflected and concluded during the Delphi survey at the 3rd trial.
In the recency sector in the 3rd Delphi, it appeared that none averaged 4.0 or less, but casino CRM measurement item of preferred game was excluded according to the opinion of five or more experts. In the frequency sector, it appeared that none averaged 4.0 or less, but companion item was excluded according to opinions.
In the monetary value sector, none averaged 4.0 or less, but the cost of using subsidiary facilities and lowest price amount of use were excluded on opinion. Also, in the profitability and customer loyalty sector respectively, none averaged 4.0 or less. The result of the 3rd Delphi survey is shown in
Table 5 below.
4.1.4. Verification of Reliability per Item
It is the method to increase consistency of each item by excluding items deteriorating reliability from the measurement tools by using Cronbach’s α value in case of using multiple items to measure reliability which means internal consistency among items [
48]. As characteristics of this research are to explore and discover customer lifetime value items in the casino industry, thus 6.0 or higher Cronbach’s α value is deemed to have allowable internal consistency [
49].
As a result of analyzing the reliability of five subcategories of casino customer lifetime value, Cronbach’s α values were 0.680 (recency), 0.789 (periodicity), 0.819 (monetary), 0.665 (profitability), and 0.649 (customer loyalty), respectively, showing high reliability.
Table 6 shows the verification of reliability per item.
4.2. Result of AHP (Analytic Hierarchy Process) Analysis
Analytic hierarchy process is targeted to expert groups, and its targets can vary depending on purpose. If looking into trends of number of valid AHP samples in research related to tourism, the number of valid samples differs from characteristics of research, as Kim and Mun [
50] had 30 samples, Lee and Choi [
40] had 203, Kim, Kim, and Kwahk [
51] had 31, Yoo [
52] had five, and Kim [
53] had 86 samples. That is, the consistent answers of respondents from expert groups selected properly, considering the characteristics of research, plays an important role in the utilization of AHP [
54].
This research conducted AHP questionnaire surveys against 51 experts who responded to the 3rd Delphi, and conducted a final analysis with 47 people who completed all three surveys. Eighteen questions are located under five subcategories. The result of AHP is shown in
Table 7 below.
This research has drawn the final indicators of casino customers’ lifetime values based on the importance of categories by drawing preliminary indicators through three Delphi surveys, and analyzing the reliability of preliminary indicators and AHP. The indicators consisted of one high-rank concept, five subcategories, and 18 detailed properties. The final indicators of this research were drawn by computing relative weight on subcategories and indicators, and the formula representing casino customers’ lifetime value indicators depending on developed items is represented by Formula (1).
Ti is total score of casino customers’ lifetime value, x is weight value in sub category, and a1y1 a18y18 is detailed property indicator score multiple with weight in detailed properties.
The result of analyzing relative weight of subcategory and indexes are shown in
Table 8 below.
4.3. Suggesting the Finally Drawn Evaluation Model of Casino Customer’s Lifetime Value
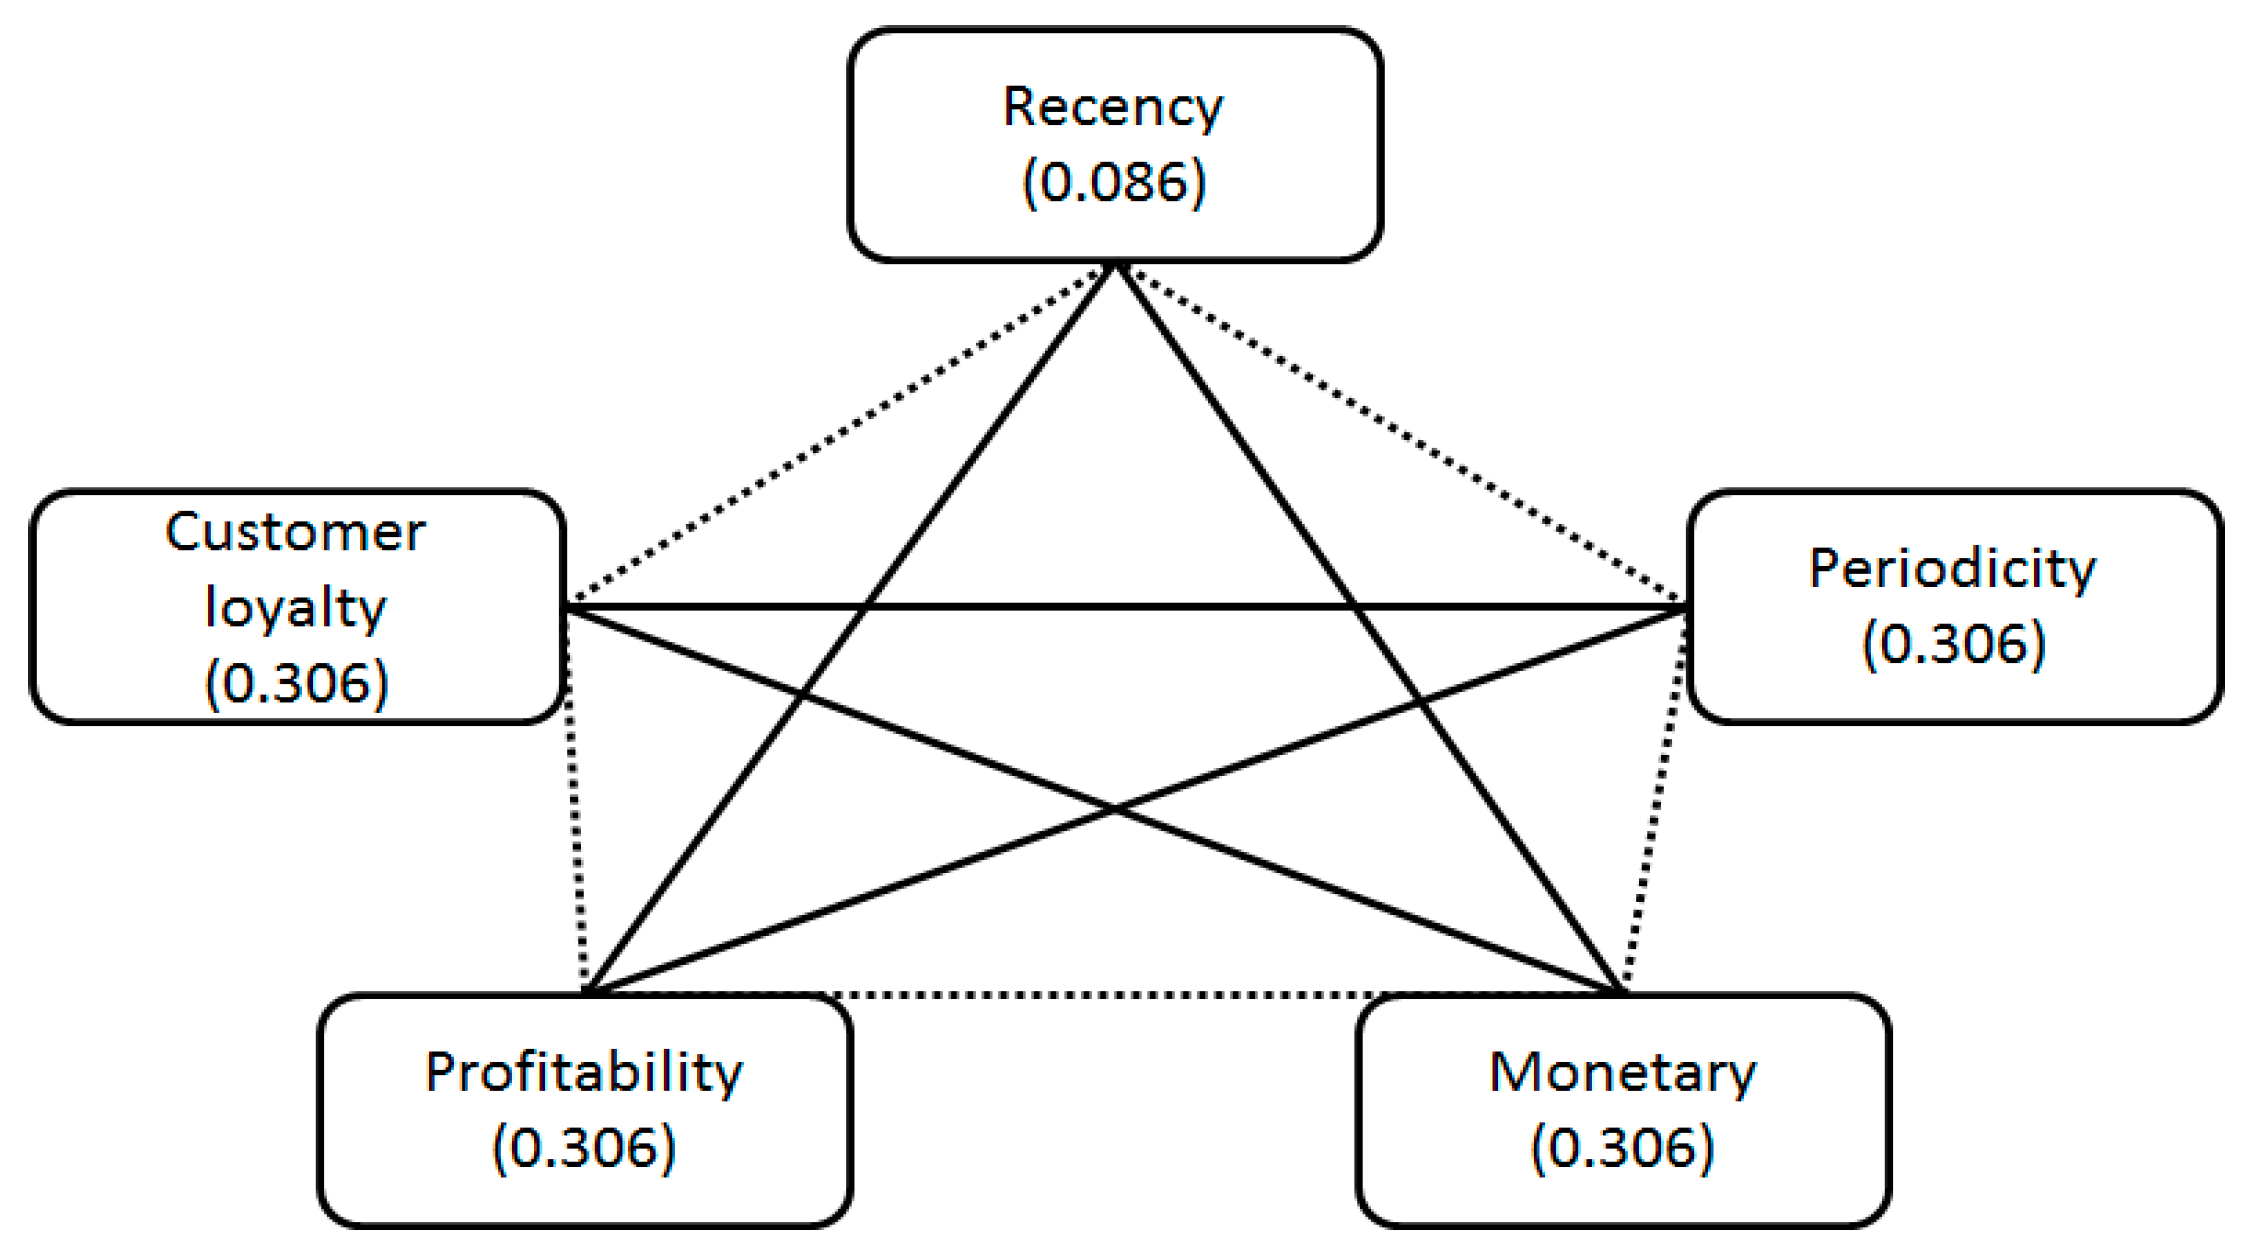
The research has provided the final evaluation model of a casino customer’s lifetime value which consists of five elements as shown in
Figure 2. In detail, those are recency (0.086), frequency (0.133), monetary value (0.206), profitability (0.269), and customer loyalty (0.306).
Figure 2 represents a five-sided figure where the fine lines indicate the size of casino lifetime value of one customer, and the dotted lines indicates the size of the whole customer lifetime value of a company. The finely drawn model of a customer’s lifetime value makes it possible to figure out the value of casino customers through detailed indicator measurement, and also, to seek out strategies and measures to implement in order to develop the casino industry through comparison among values of customers.
5. Discussion
This study is academically meaningful since CLV can provide new judgement of customers’ life value while RFM in the casino industry is difficult to find potentially superior customers.
Unlike other businesses, the casino business sometimes generate minus revenue by losing the games with casino customers. Due to this trait, the existing customers’ grade based on the revenue has various issues. In this regard, this new model can be the basis for analyzing the potential of customers through the analysis of a customers’ life value.
Also, business insights of this research lie in that the study can ignite the development of customers’ life value in the business in order to take a closer look at casino customers. Currently, casino companies are evaluating customers based on their expected revenue (e.g., average betting, participation rate, game time, game rotation, and game odds) which is managed only at the profit side. However, it is also meaningful that the items derived from this study consider not only the current aspect but also future value such as reuse rate, visit period, average betting growth rate, loyalty, customer recommendation, etc. These results are considered to be important factors for casino companies to make loyal customers through continuous management rather than one-off.
However, it is worth noting that there are several limitations that this research may have faced. First, the developed indicators through this research did not go through objective evaluations. Customers’ life value is one of the instrumental elements in order to know traits of casino customers; however, a study to figure out its impacts has not been conducted so far. Therefore, it is difficult to show specified correlations and influences between them. Second, this study utilized the Delphi method and the AHP method to develop the measurement indicator for customers’ life values. However, the study results need to be more enhanced by categorizing items through qualitative methodologies such as content analysis in terms of item classification. Third, the weighted values of the highest items generated through the analysis of the AHP at the last round were multiplied by the weighted values from the Delphi analysis, and the figure became the scoring basis for items of the final indicator. This is often used to understand the QFD (quality function deployment) model, but it lacks scientific validation. Accordingly, follow-up studies require scientific validation for this process.
In the future, it is necessary to verify the CLV model derived from this study through actual casino data. It is necessary to study the sustainable casino customer management strategy based on the analysis of the difference by comparison with the existing RFM casino customer class.
6. Conclusions
In today’s world, the tourism industry has brought the market expansion of global tourism through globalization and increasing tourism exchanges across countries becoming one of the triggers that drives important transformations in the world. In particular, the casino industry in the tourism area is deemed a relatively higher value-added business and is dubbed as the “golden and no-smoking industry”, showing its potential to be a substitute for regular tourism products with strong resistance to climate environment. As more and more countries push ahead with legalization of the casino industry and make greater efforts to enlarge the business and attract more investments considering its economic effects and purposes, the competition of the business is getting fiercer over time. In order to seek ways to respond to the environmental changes and to build sustainable casino industries, adopting the CLV method is encouraged. The CLV indicator allows a business to shift its management strategy from casino products-based marketing to the creation of proactive and continuous relationships with certain customers. This new strategy elevates the value of customers, thereby maximizing the value of businesses in the end by taking the CLV which measures the value of customers. Accordingly, the purpose of this research was to analyze the traits of casino customers whose characteristics are differentiated from other industries and develop customer lifetime value indicators for a sustainable casino industry. All these attempts were made in a bid to draw practical insights as a proactive move and possess competitive edges in terms of customer management in the business where aggressive competitions are awaited. To this end, previous studies and research were fully reviewed to create measurement indicators for customers’ life value and the Delphi method was implemented to draw consensus among experts of the business. The results of the method laid the foundation for pair-wise comparisons in an endeavor to utilize AHP, which was designed to validate importance and priorities among items.
Based on the results, the item of “newest-ness” was comprised of two detailed attributes (usage newest-ness and customers’ status); “frequency” was with eight detailed attributes including usage frequency, repeat usage rate, total usage, usage period, likelihood of becoming a lapsed user, visit frequency, gaming time, gaming participation rate; “monetary item” was with three sub-attributes including total spending, average spending, and increase rate of average betting amount; “profitability” was with three sub-attributes including expected earning, amount of drop, and amount of win/loss; and the last item, “customer loyalty”, was formed with two sub-attributes including loyalty and referral.
As a result of this study, this research provided the standard to measure the value of each customer who visits casinos. Therefore, it is significant to suggest a new standard that is necessary to distinguish good customers to be managed and general customers and set target customers.
In addition, this study showed the possibility to utilize customer lifetime value for not only standards to distinguish customers with high profitability, but also outcome indices of casino corporations. In case of high-growth industry or high-tech industry, it is difficult to measure the accurate value of a corporation with only financial information of the corporation because of the characteristics of the industry and non-financial factors that can supplement it, which must be included to measure the value of corporation [
55]. As a result of this study, it includes non-financial factors such as loyalty, customer recommendation, etc., so they can be utilized to measure the outcomes of casino corporations.


