Article

Life Cycle Assessment of Solar Façade Concepts Based on Transparent Insulation Materials

Faculty of Civil Engineering, Brno University of Technology, AdMaS Centre, 602 00 Brno, Czech Republic
*
Author to whom correspondence should be addressed.
Sustainability 2018, 10(11), 4212; https://doi.org/10.3390/su10114212
Submission received: 19 October 2018 / Revised: 9 November 2018 / Accepted: 12 November 2018 / Published: 15 November 2018
(This article belongs to the Special Issue The Application of Renewable Energy in Sustainable Architecture)

Abstract

:
Contemporary architecture and construction industry are trying to cope with increasing requirements concerning energy efficiency and environmental impacts. One of the available options is the active utilization of energy gains from the environment, specifically solar energy gains. These gains can be utilized by, for example, solar walls and facades. The solar façade concept has been under development for more than a century. However, it has not achieved widespread use for various reasons. Rather recently the concept was enhanced by the application of transparent insulation materials that have the potential to increase the efficiency of such façades. The presented study evaluates the environmental efficiency of 10 solar façade assemblies in the mild climate of the Czech Republic, Central Europe. The evaluated façade assemblies combine the principles of a solar wall with transparent insulation based on honeycomb and polycarbonate panels. The study applies Life-Cycle Assessment methodology to the calculation of environmental impacts related to the life cycle of the evaluated assemblies. The results indicate that even though there are several limiting factors, façade assemblies with transparent insulation have lower environmental impacts compared to a reference assembly with standard thermal insulation. The highest achieved difference is approx. 84% (in favor of the assembly with transparent insulation) during a modelled 50-year façade assembly service life.

1. Introduction

It is generally accepted that technological advances combined with human population growth are having a significant impact on the environment [1]. Some authors even compare it to the extinction events that wiped out most life forms on Earth in the past [2]. Such statements may seem exaggerated; however, the slow change in the global climate (e.g., rising atmospheric CO2 levels [3]) is well documented. To address the issue, scientists and politicians have introduced different “sustainable development” strategies such as Agenda 21 on sustainable construction [4] from 1999 or the more recent proposals for a “circular economy” [5]. These strategies and the research that supports them (e.g., [6]) indicate that the building sector plays an important role in humanity’s quest for sustainability. The reason is the massive energy and resource consumption connected to buildings, along with waste production: buildings are responsible for approximately 40% of total energy consumption and waste production [7] and 25% of greenhouse gas emissions [8]. Reducing these negative impacts of the building industry is the aim of regulations like European directive 2010/31/EU on the energy performance of buildings (EPBD [9]). This (recently updated) directive states that all new buildings and major renovation projects in the EU should comply with “nearly-Zero Energy Building” (nZEB) standards after 2020. Literature such as [10] suggests that the introduction of nZEBs will result in a massive reduction in energy consumption (and a related reduction in environmental impact) in new buildings in comparison with buildings completed over the last few decades.
In the past, the most efficient way to improve the energy consumption of buildings was to reduce their heating and ventilation energy losses. This was achieved through the addition of thermal insulation to the building’s envelope and the installation of HVAC systems with heat recovery [11]. This led to the development and propagation of highly efficient “passive” buildings [12]. However, literature such as [13,14] suggests that the potential for further savings in contemporary building designs is limited by increasing investment costs and embodied energy (as well as other environmental impacts). Therefore, the industry is looking for new solutions that will not only minimize energy losses, but also utilize the energy gains available on-site. Such solutions include the integration of renewable energy sources (RES) like photovoltaics [15] or solar thermal collectors [16] for on-site energy generation. Both of the previously mentioned references illustrate that the field of RES is already well established in the literature. Still, the research presented in this paper tries to bring a different perspective on one of the more straightforward ways of using renewable natural energy: the exploitation of solar energy gains with solar facades based on transparent insulation materials (TIMs).
The direct utilization of solar gains in buildings is not new. The solar wall principles that originated in the late 19th century were further developed by F. Trombe in the 1960s [17]. The principle behind the solar wall (or the derived Trombe wall) is rather simple. It consists of a massive wall and a glass cover on the exterior side of the wall. The outer surface of the wall is painted black in order to absorb as much solar energy as possible. The air gap between the glazing and the wall serves as a buffer and insulation layer that reduces the heat losses of the structure [18]. The solar wall concept has been studied and developed worldwide over the past few decades [19], when different studies developed solar walls where TIMs replaced the original glazing elements [20]. The application of TIMs had already proven successful in the case of solar thermal collectors [21]. Their integration in facade elements is still in development, even though commercial products already exist [22]. The presented study is part of a research project that strives to add to the existing knowledge in this developing field by evaluating the efficiency of various TIMs in combination with other novel elements and materials such as low-emissivity solar absorbers.
The works referenced in the previous paragraph typically analyze the thermal characteristics and energy balance of TIMs or solar walls. There are only a few works describing the overall environmental impacts related to these structures and materials. For example, Dowson et al. [23] released a paper describing the environmental impacts related to transparent silica aerogel insulation. Stazi et al. [24] presented a study on the environmental impacts of a rather traditional solar wall concept. The applicability of the results of both studies is limited as they do not include comparisons with other available materials. One of the few studies that provide such a comparison was released by de Garcia et al. [25]. It shows that (under specified boundary conditions) the ventilated solar façade they tested has a 7.5% lower environmental impact compared to a standard façade. The study presented in this paper follows de Garcia’s example along with previous work by Čekon and Struhala [26], which evaluated the performance of two TIM-based solar walls and a standard façade with mineral wool insulation. The study provides an evaluation of the environmental impacts of 10 TIM-based façade assemblies and a comparison with a reference façade with external thermal insulation composite system (ETICS). The evaluation focuses on the environmental impacts of the facade assemblies during their whole life cycle: from extraction of the raw materials to the final waste disposal. This should provide a complex understanding of the performance of the concept. For this purpose, the study also includes dynamic simulations of the energy performance based on regional climate data. The energy performance is modelled for multiple orientations of the facades to the cardinal points to provide further insight into the efficiency of the described façade concepts.

2. Methodology and Materials

The goal of the presented study is the evaluation of the environmental impacts of the TIM-based façade assemblies defined in Section 2.1. Life-Cycle Assessment (LCA) methodology is applied to achieve this goal. LCA methodology was conceived in the 1960s in the USA and several European countries, [27]. Currently it is well-established in literature (see e.g., [28]) as a method for complex multi-criteria evaluation of products. Its applications in building industry vary from evaluation of individual products or materials to evaluation of whole systems such as buildings or cities. It is especially useful in comparative studies, where it provides complex basis for the decision-making process [29].
LCA principles are internationally standardized. The general framework is defined in ISO 14040 [30]. This ISO standard is rather vague for the purposes of the presented study. Therefore, the boundary conditions and specifications for building-related LCAs described in European standards EN 15804 [31] and EN 15978 [32] are also applied in the presented study.

2.1. Assessed Façade Assemblies

A total of 11 different façade assemblies are evaluated in the presented study. The base of all the assemblies is a 200 mm thick concrete wall with cement-based plaster on the interior surface. Concrete was selected in this study due to its heat accumulation potential and heat transfer properties in order to maximize the solar gains of assemblies with TIMs (see Figure 1). Five different types of retail-available TIMs with different thermal and optical properties are selected for evaluation in the façade assemblies. Two types of retail-available solar absorbers are selected to enhance the efficiency of an overall thermal performance: common black paint (a non-selective solar absorber, nSSA) and aluminum-based sheet with low-emissivity coating (a selective solar absorber, SSA). This decision is based on authors’ previous work [33] that identified up to 54% better efficiency of SSA over nSSA. The evaluated façade assemblies are defined as follows:
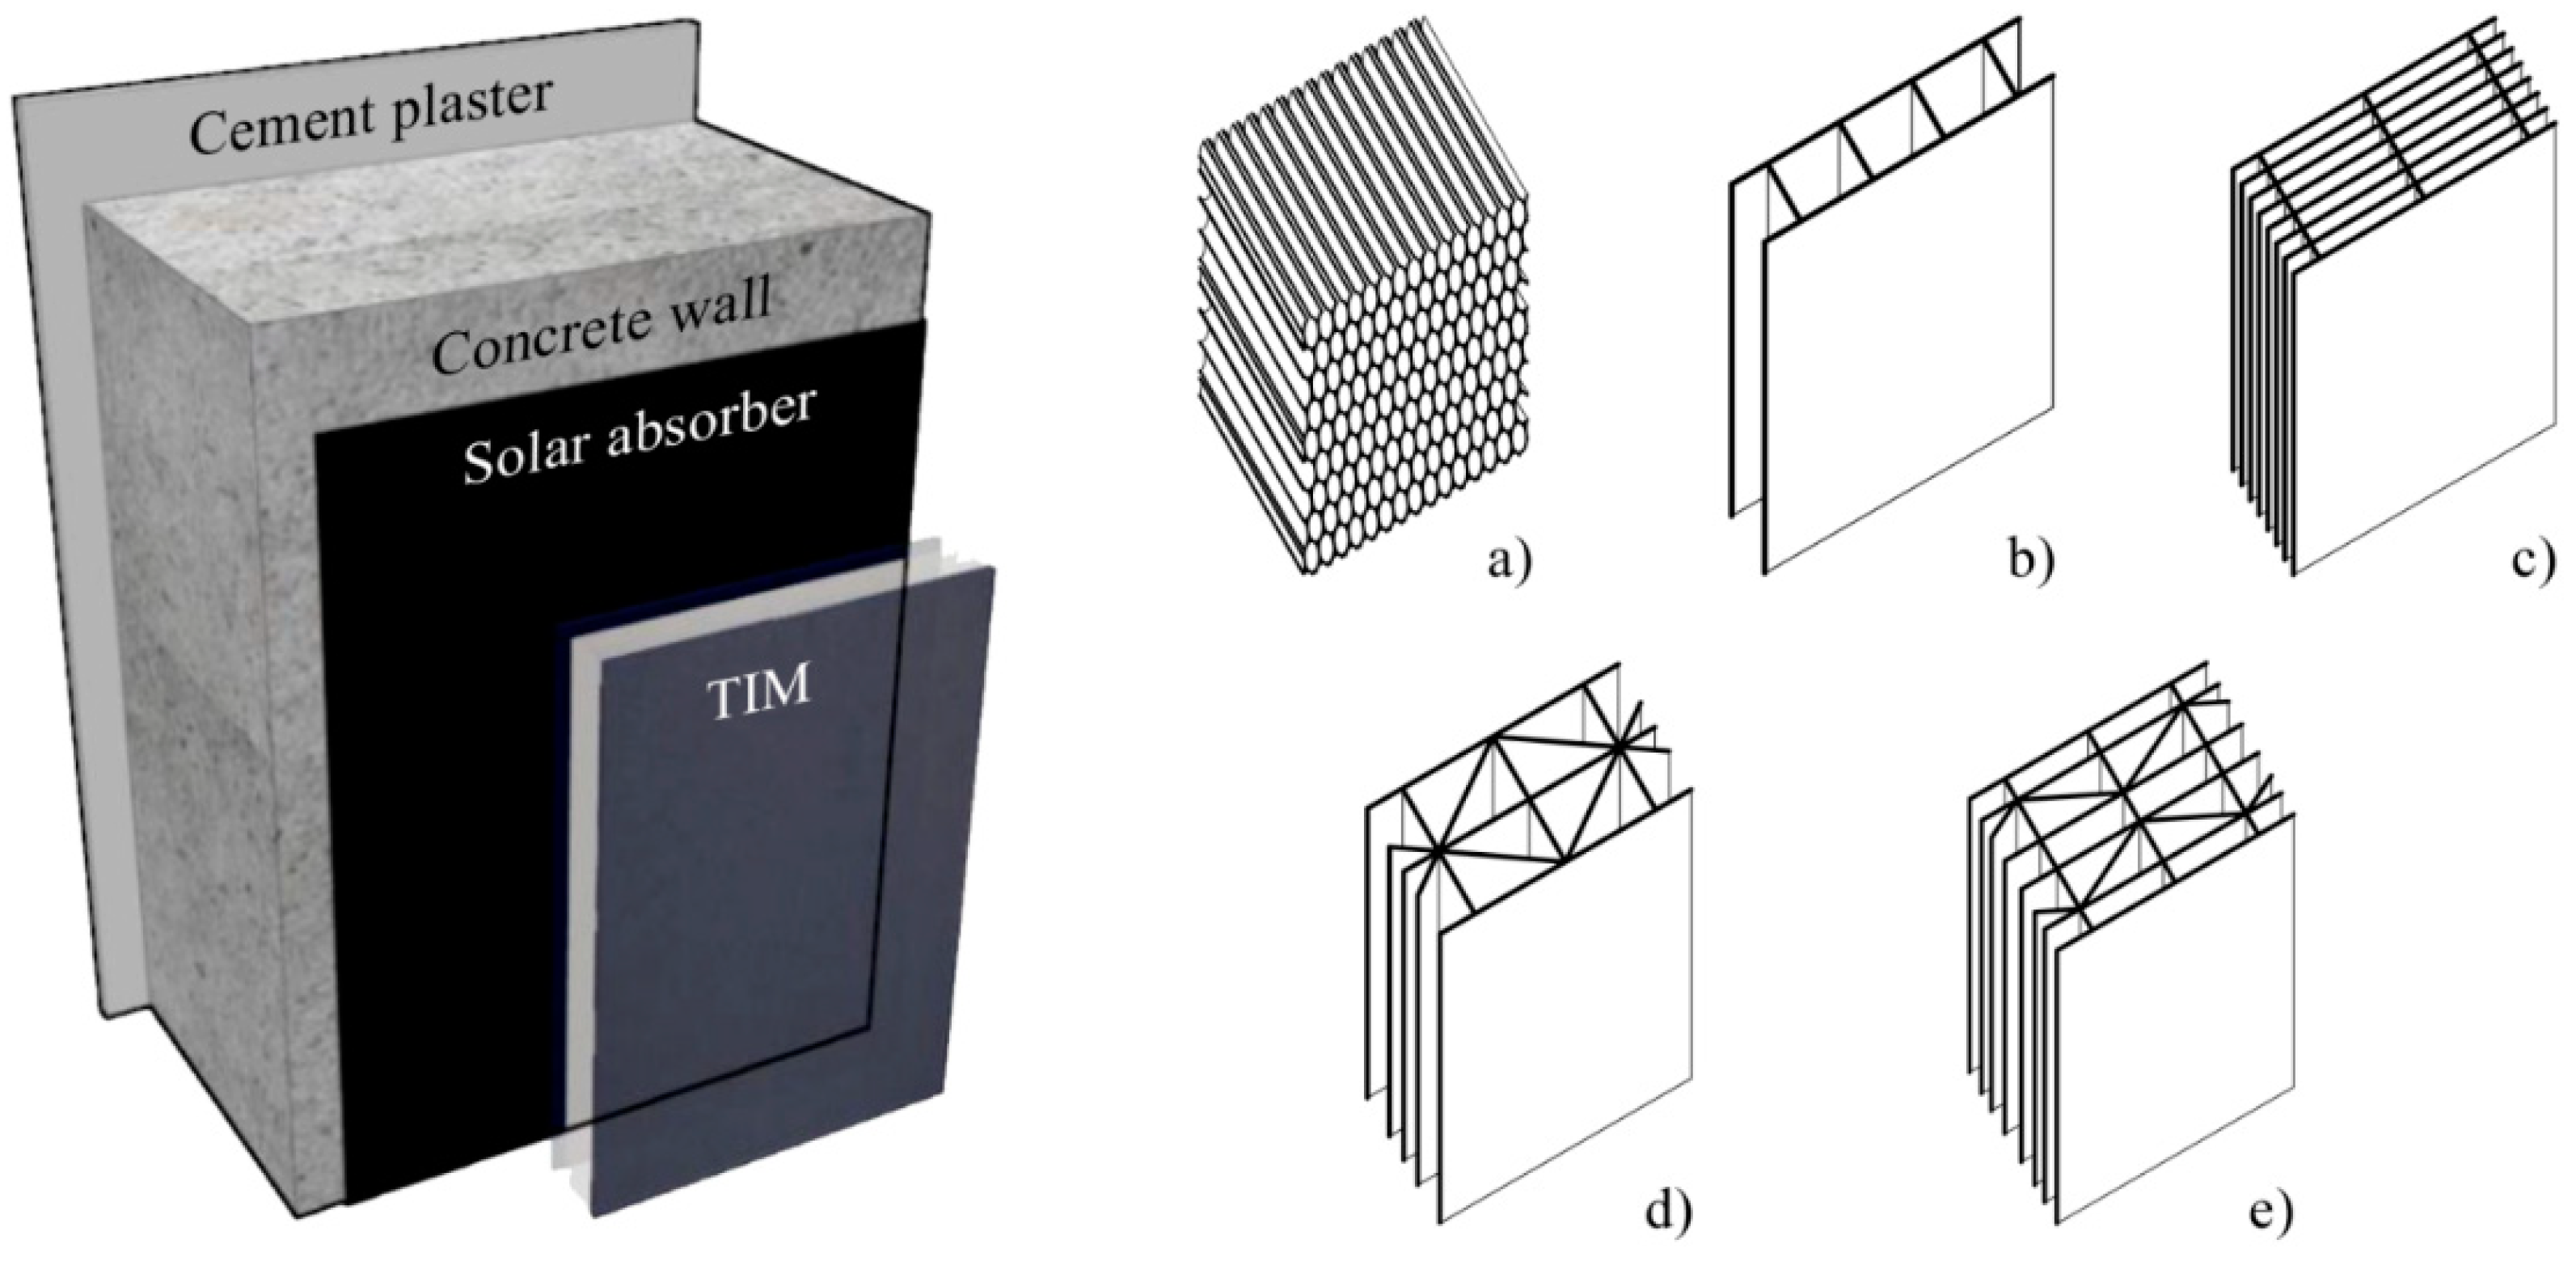
  • Assembly 1 is a reference assembly combining a concrete wall with standard ETICS. The ETICS consists of 220 mm expanded polystyrene (EPS), cement-based adhesive mortar and mineral exterior plaster. The assembly represents an envelope wall with a U-value of 0.21 W∙m−2∙K−1 that fulfils the high thermal protection level of building.
  • Assembly 2 consists of a concrete wall, a nSSA, a 25 mm air gap and a 40 mm TIM system made of honeycomb polymethylmethacrylate PMMA (HP40; circular cells horizontally oriented, perpendicular to the wall; see Figure 1a) encased between glass panes.
  • Assembly 3 consists of a concrete wall, a nSSA, a 25 mm air gap and a 10 mm polycarbonate TIM panel (PC10) with a single layer of vertically oriented square cells parallel to the wall surface (Figure 1b).
  • Assembly 4 consists of a concrete wall, a nSSA, a 25 mm air gap and a 20 mm polycarbonate TIM panel (PC20) with seven layers of vertically oriented square cells parallel to the wall surface (Figure 1c).
  • Assembly 5 consists of a concrete wall, a nSSA, a 25 mm air gap and a 25 mm polycarbonate TIM panel (PC25) with two layers of vertically oriented triangular cells parallel to the wall surface (Figure 1d).
  • Assembly 6 consists of a concrete wall, a nSSA, a 25 mm air gap and a 32 mm polycarbonate TIM panel (PC32) with five layers of vertically oriented combined cells (three layers with square cells, two layers of triangular cells) parallel to the wall surface (Figure 1e).
  • Assemblies 7 to 11 replace the nSSA with SSA. Otherwise the composition of these assemblies is the same as the composition of assemblies 2 to 6.

2.2. Boundary Conditions of the Assessment

The study models the whole life cycle of façade assemblies from raw material extraction up until final waste disposal as defined by [32]. In particular, the study evaluates the environmental impacts related to 1 m2 of each assembly during an estimated service life of 50 years. This service life is a common building design value in the Czech Republic. For the purposes of the assessment it is estimated that only the concrete load-bearing part of the wall would endure the whole 50-year service life. It is assumed that all of the other materials would have to be replaced once (after approx. 25 years) due to their lower durability. This should more accurately model the real use of façade assemblies.
The life cycle of the façade assemblies is divided into four stages according to [32]: the Product stage, the Construction process stage, the Use stage, and the End of life stage. There is a fifth stage defined in the standard that deals with the reuse and recycling of materials. However, this stage is omitted from the study to reduce possible information bias and a distortion of the results. The standard further divides the four life cycle stages into 16 modules (see Table 1).
Several of these modules are also omitted in the study: Modules A5 (Construction/Installation process) and C1 (Deconstruction/Demolition) are omitted because it is expected that environmental impacts related to them would be negligible. Use of the façade assemblies should not cause any environmental impacts and therefore module B1 is omitted. No repair or maintenance is expected during the service life of the façade assemblies. It is expected that particular materials will be replaced at the end of their respective service lives. Therefore, modules B2, B3 and B5 are omitted. No operational water use and waste water processing is expected and so modules B7 and C3 are also omitted.

2.3. Input Data Inventory

Information regarding the materials applied in individual assemblies is obtained from laboratory measurements of purchased samples. More information about the measurements can be found in [34]. All the assemblies share the same base structure made of 480 kg of concrete for the purposes of this study. The interior of the structure is covered with 16 kg of cement plaster (see Figure 1). The amounts of materials required for the exterior layers of the façade assemblies (TIMs or ETICS) are described in Table 2. Based on Czech statistical data [35] it is expected that at the end of the modelled service life all materials will be landfilled.
The transport of materials (in modules A2, A4, B4 and C2) is another important part of building-related LCA. Transport distances between a hypothetical building site in the city of Brno (Czech Republic) and the nearest production (waste management) facilities are considered in this study to represent a real-life transport scenario. The transport distances between the pertinent production facilities and Brno are: 591 km for the HP40 TIM; 536 km for the SSA; 324 km for the PC10, PC20, PC25 and PC30 TIMs; 160 km for nSSA; 32 km for the plasters and mortars; 15 km for the EPS; 5 km for the concrete. The nearest landfill is located 13 km from the building site.
Energy consumption is the most important part of the presented LCA as it has a major impact on the total results (see Section 3.2). Energy consumed during the operation of the evaluated façade assemblies can be divided into two parts: (summer) cooling energy and (winter) heating energy. The presented study only includes the heating energy consumption (see Table 3) necessary to maintain an interior temperature of 20 °C behind the evaluated façade assemblies. The reason is that previous research [26] has already indicated the problem of overheating in summer. This problem requires further technical solutions, such as shading or the application of phase-change materials [25]. Such additions are considered outside the scope of the presented study, which focuses solely on the façade assemblies described in Section 2.1. It should be noted that electricity is considered to be the energy source in the calculations.

2.3.1. Calculation of Energy Consumption

The basis for the evaluation of environmental impacts related to energy consumption is the dynamic numerical modelling of the energy performance of the façade assemblies. Dynamic modelling was selected as literature such as [36] suggests that it should provide the most accurate data for LCA. This type of modelling considers the thermal and spectral parameters of the evaluated materials that were obtained in the course of research for previous works ([34,37]) as well as varying exterior conditions. A summary of the material parameters is in Table 4. The numerical algorithm applied for the modelling is based on one-dimensional finite elements. The time discretization of the heat transfer problem uses a fully implicit scheme. The transition of heat in the solid non-transparent layers considers conductive heat transfer described by thermal conductivity, heat capacity, and density. Further information about heat transfer modelling can be found in literature such as [38] or [39]. Transparent materials like polycarbonate panels are modelled as single one-dimensional finite elements with equivalent heat transfer properties and transparency to solar radiation. This means that solar radiation penetrates the material over a period of time proportional to its transparency. Air gaps are also modelled as single finite elements according to the method stated in ISO 6946 [40] with equivalent thermal resistance that takes into account radiative heat transfer affected by the emissivity of surfaces and a convective component influenced by the thickness of the air layer. A schematic diagram illustrating the numerical model is in Figure 2.
The boundary conditions utilized for the numerical modelling of the energy performance of façade assemblies are as follows: The heat transfer coefficient equals 25 W∙m−2∙K−1 on the interior surface and 7 W∙m−2∙K−1 on the exterior surface of the modelled façade assemblies. These values are based on [41]. The exterior surface is also exposed to solar radiation, which is considered to be perpendicular to the surface for the purposes of the modelling. The incident solar radiation includes projected direct solar radiation, diffused solar radiation, and reflected solar radiation from the ground, which are based on relations from the literature [41]. The total solar energy gains depend on the orientation of the façade assemblies to the cardinal directions, the solar absorption coefficient of particular materials and time (based on reference climate data). All possible orientations to the cardinal points were considered during the calculations (see Figure 3). This study presents three energy demand scenarios (see Table 3): a southward orientation (180° clockwise from north), an eastward orientation (90° clockwise from north) and a north-eastward orientation (30° clockwise from north). The southward orientation represents the state with maximum solar gains. Therefore, the heating energy consumption of the assemblies with TIM is the lowest. The eastward and north-eastward orientations are included in this study to evaluate the impact of reduced solar gains on the results. West-oriented facades had lower energy consumption in the calculations and so are not included in the presented study. The climate data considered in the calculations are based on a reference test year for Bratislava “SVK_Bratislava.118160_IWEC” in the hour time regime [42]. This was selected as Bratislava (Slovakia) is geographically the closest city to the hypothetical construction site in Brno (Czechia), which has the necessary climate data. The time step used for the dynamic modelling is 600 s and intermediate values are linearly interpolated. A 20 °C interior temperature is considered for the purposes of the modelling.

2.3.2. LCA Calculation Procedure and Tools

The LCA was performed in GaBi software equipped with the ecoinvent 2.0 [43] database. No data describing the performance and environmental impacts of the materials were available at the time of the study. Therefore the study is based on generic ecoinvent datasets. The available datasets do not describe all of the products and processes necessary for the assessment, which results in several simplifications in the LCA models:
  • There is no single dataset representing the TIMs. The PC10, PC20, PC25 and PC30 TIMs are represented by a combination of datasets, these being RER: polycarbonate, at plant (material) and RER: extrusion, plastic film (processing). The HP40 TIM includes both these datasets plus the dataset RER: flat glass, uncoated, at plant representing the glass casing.
  • There is also no single dataset representing the selective solar absorber. It is modelled as a combination of datasets, these being RER: aluminum, primary, at plant (base material), RER: sheet rolling, aluminum (processing) and SK: selective coating, aluminum sheet, nickel pigmented aluminum oxide (coating).
  • The transport of raw materials and incomplete products during the Product stage (especially module A2) is included in individual ecoinvent datasets. The A4 and C2 (partially also B4) modules describe the transport of final products and wastes respectively. For the purposes of the assessment it is assumed that the materials and wastes are transported by road with a truck or lorry. This is represented by the dataset RER: transport, lorry 3.5-16t, fleet average.
  • Electric energy in process CZ: Electricity—low voltage, at grid represents the energy consumed to cover heat losses or overheating through the evaluated façade assemblies. No dataset representing HVAC equipment is included in the assessment.
The environmental impacts related to the evaluated façade assemblies are calculated using the CML2001 method (version Nov. 10). This method was developed by the Institute of Environmental Sciences, University of Leuven in the Netherlands [29]. It includes 12 impact categories: Abiotic Depletion Potential of Elements (ADP-el), Abiotic Depletion Potential of Fossil Fuels (ADP-ff), Acidification Potential (AP), Eutrophication Potential (EP), Freshwater Aquatic Ecotoxicity Potential (FAETP), Global Warming Potential (GWP), Global Warming Potential Excluding Biogenic Carbon (GWP-ex), Human Toxicity Potential (HTP), Marine Aquatic Ecotoxicity Potential (MAETP), Ozone Layer Depletion Potential (ODP), Photochemical Ozone Creation Potential (POCP), and Terrestrial Ecotoxicity Potential (TETP). Normalization of the individual results is also applied (version Nov. 10, EU25+3) to enable the aggregating of individual impact category results and increase the comprehensiveness of the study.

3. Results and Discussion

The presentation of the LCA results is divided into two parts for increased clarity. This is due to the fact that the majority of environmental impacts are (according to the performed calculations) related to the electrical energy necessary to cover heat losses. However, literature such as [44] or [45] indicates the increasing importance of environmental impacts related to materials (embedded or embodied environmental impacts). Therefore, Section 3.1 focuses on “embodied” environmental impacts related to applied materials, their transport, replacement, and waste processing (modules A1–A4, B4, C2 and C4, according to [32]). Overall environmental impacts, including energy consumption (module B6 according to [32]), are described in Section 3.2.

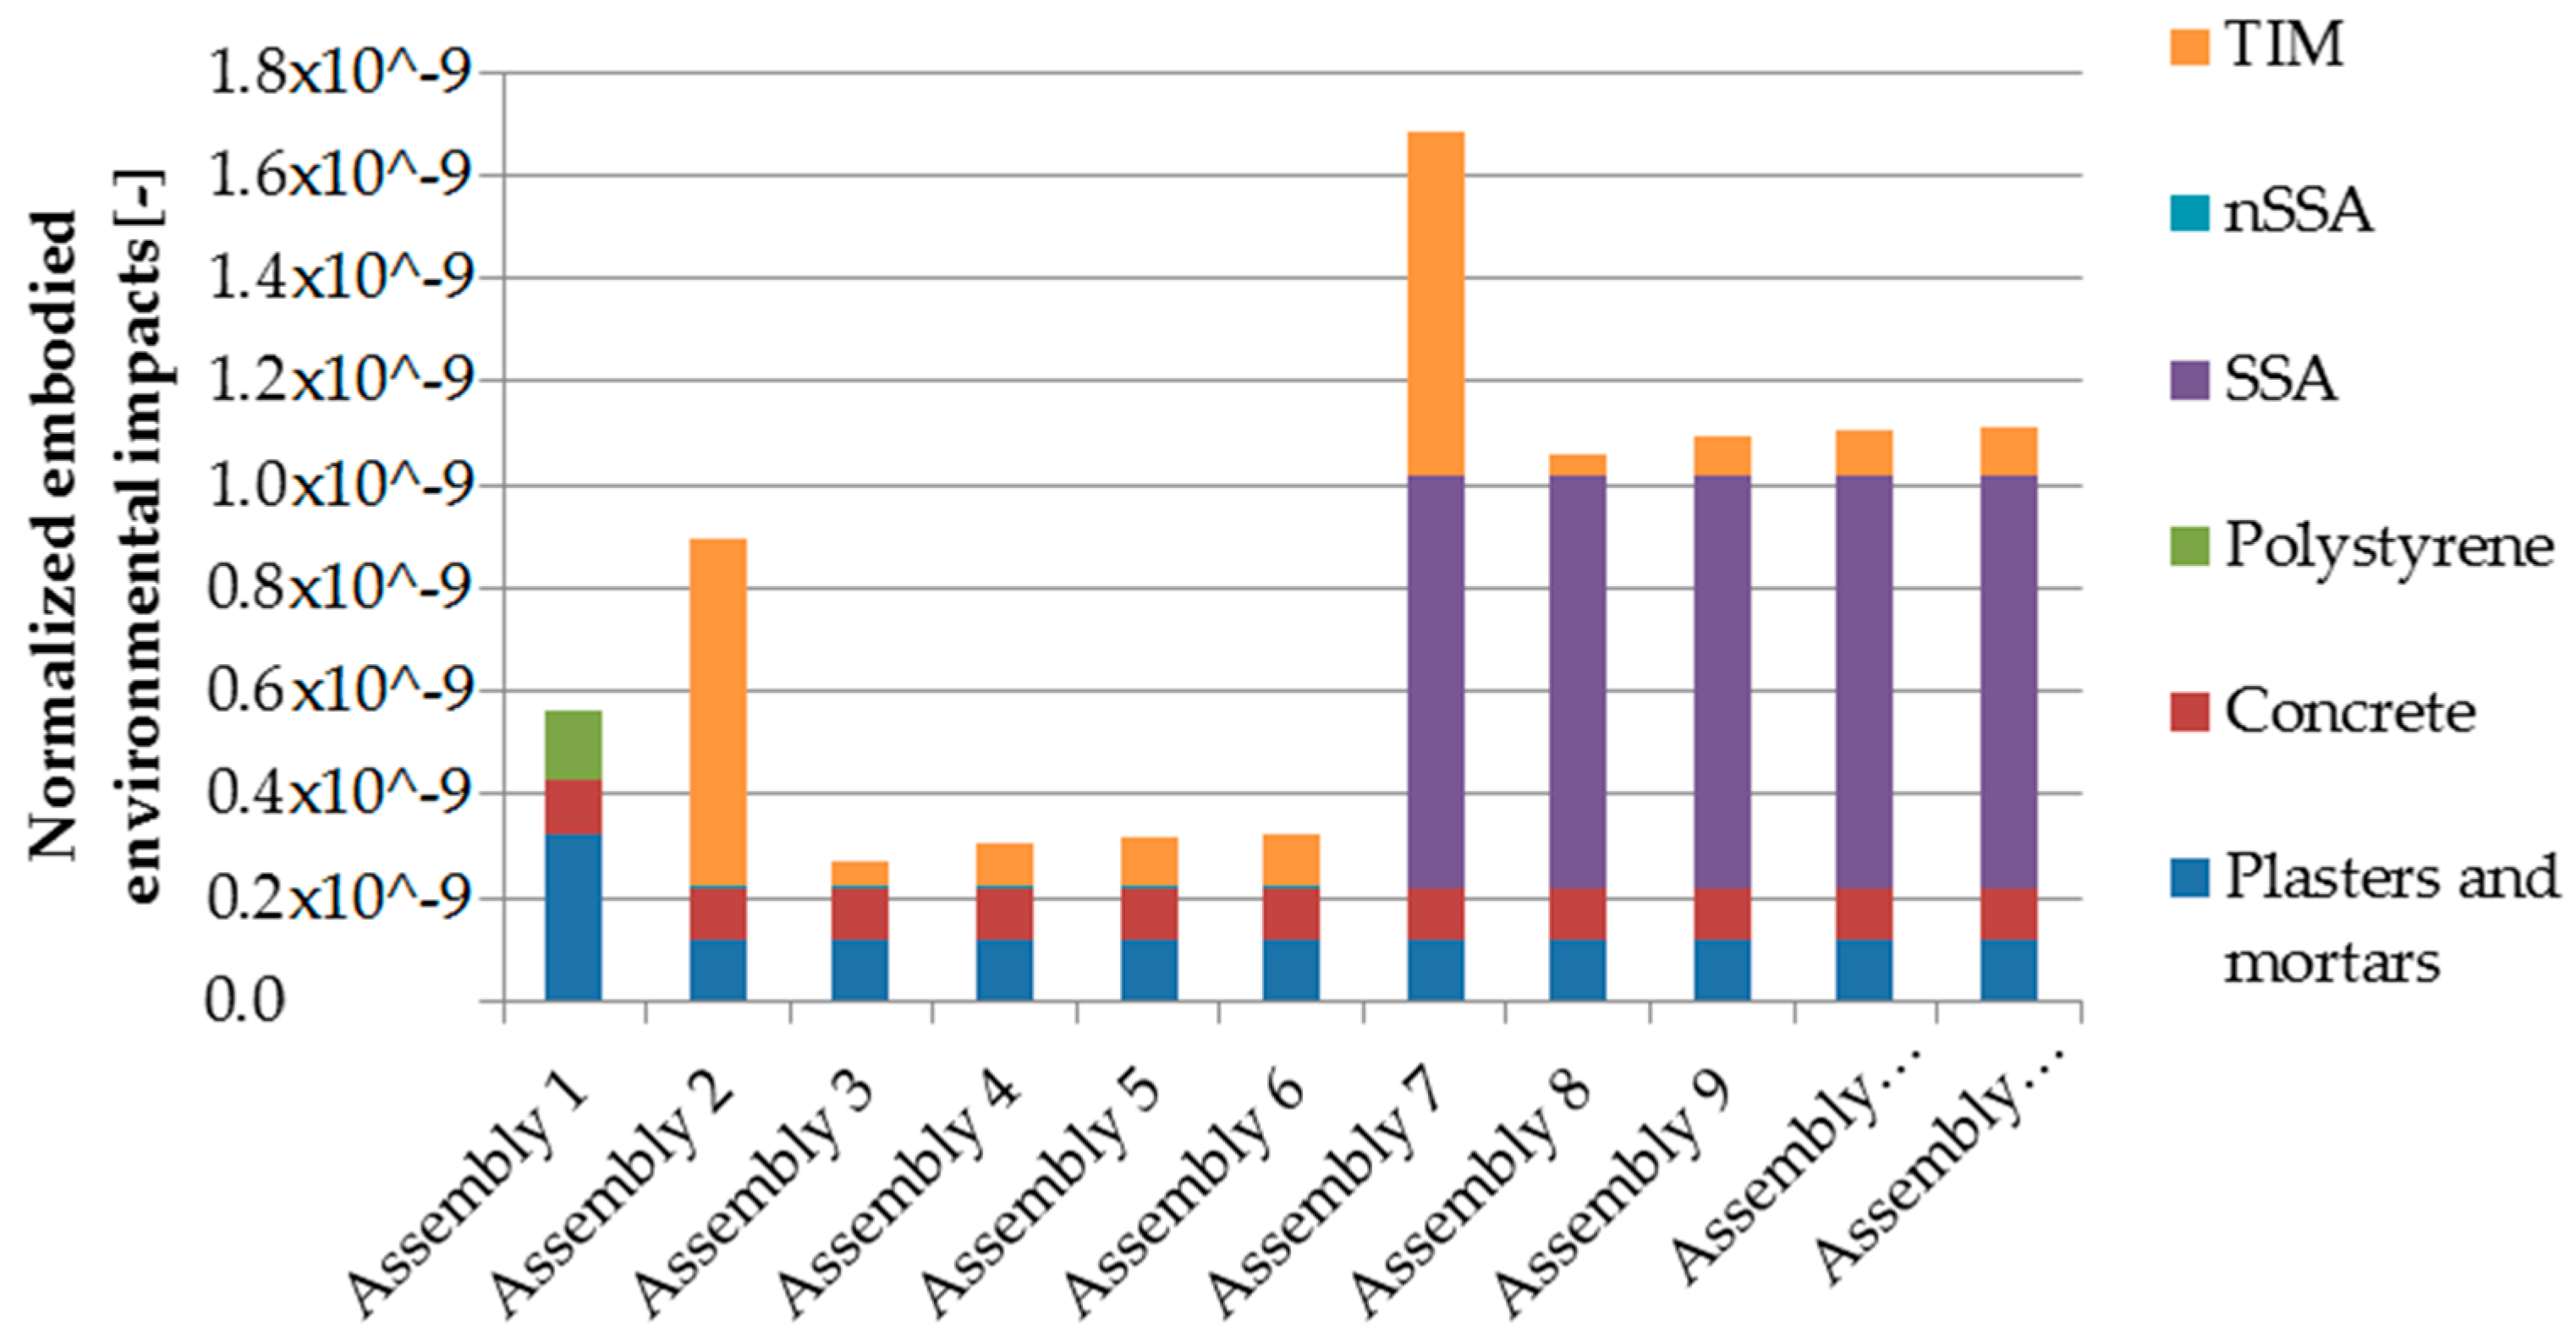
3.1. Evaluation of Material-Related Environmental Impacts

Table 5 and Figure 4 show embodied environmental impacts related to the production of materials (modules A1–A3 according to [32]) necessary for the construction of the evaluated façade assemblies. Table 5 shows numerical results in all 12 impact categories. These results indicate that Assembly 3 has the fewest embodied environmental impacts connected with the production of necessary materials in modules A1–A3. On the other hand, the identification from Table 5 of the assembly with the highest amount of embodied environmental impacts in these modules is impossible as various assemblies have the worst results in individual impact categories. Assembly 7 has the highest impacts in six impact categories. Reference Assembly 1 and Assembly 11 both have the highest embodied impacts in three categories. Overall the difference between the lowest and highest embodied environmental impacts in the modules varies between 29% (GWP and GWP-ex) and 89% (MAETP) in individual categories. The reasons for these differences are visible in Figure 4, which shows stacked normalized environmental impacts for modules A1–A3 of the evaluated assemblies.
Figure 4 indicates that the most notable difference in embodied environmental impacts occurs in the case of solar absorbers. It shows that the nSSA (black paint) has 99% lower environmental impact than the SSA made of metal with a selective coating. This is mostly due to the fact that the SSA contains aluminum sheet, whose production is environmentally demanding. In fact, the SSA is most demanding of all evaluated materials. In consequence, even if they represent a small fraction of the building mass, they largely contribute to its total embodied energy [45]. The figure also shows that the HP40 TIM has an approximate 90% higher environmental impact than the remaining four evaluated TIMs (PC10, PC20, PC25 and PC32) due to its glass casing. Interestingly enough, the evaluated layer of polystyrene insulation also has higher environmental impacts than these four TIMs. Based on these facts it could be said that Assembly 3 has the lowest environmental impacts in modules A1–A3 due to combination of the nSSA with the PC10 (the lightest evaluated TIM). In comparison, Assembly 7 has the highest environmental impacts in this part as it combines the SSA with the glass-encased HP40.
Life cycle modules A1–A3 represent only a part of the total embodied environmental impacts. These are shown in Figure 5. It is clear that the production of the original materials (modules A1–A3) and their replacements (module B4) is responsible for the majority of the overall environmental impacts. Even though the presented study included rather long transport distances, the environmental impacts related to transport are rather insignificant. Modules A4 (material transport) and C2 (waste transport) represent between 0.8% (Assembly 7) and 4.5% (Assembly 3) of the total embodied environmental impacts. This result implies that strategically placed production facilities could supply specialized goods like SSAs or TIMs for whole regions. Also, the environmental impacts connected with the landfilling of waste (module C4) are negligible: between 0.5% (Assembly 7) and 3.3% (Assembly 3). Other waste processing options in the Czech Republic (e.g., recycling or incineration) have even lower environmental impacts according to the datasets in the ecoinvent database. Due to these facts, the overall tone of Figure 5 is similar to the results for A1–A3 in Figure 4. However, the fewest embodied environmental impacts are still related with Assembly 3, while the highest environmental impacts are connected with Assembly 7. This implies that production efficiency is the key to reducing the embodied environmental impacts of the evaluated materials.

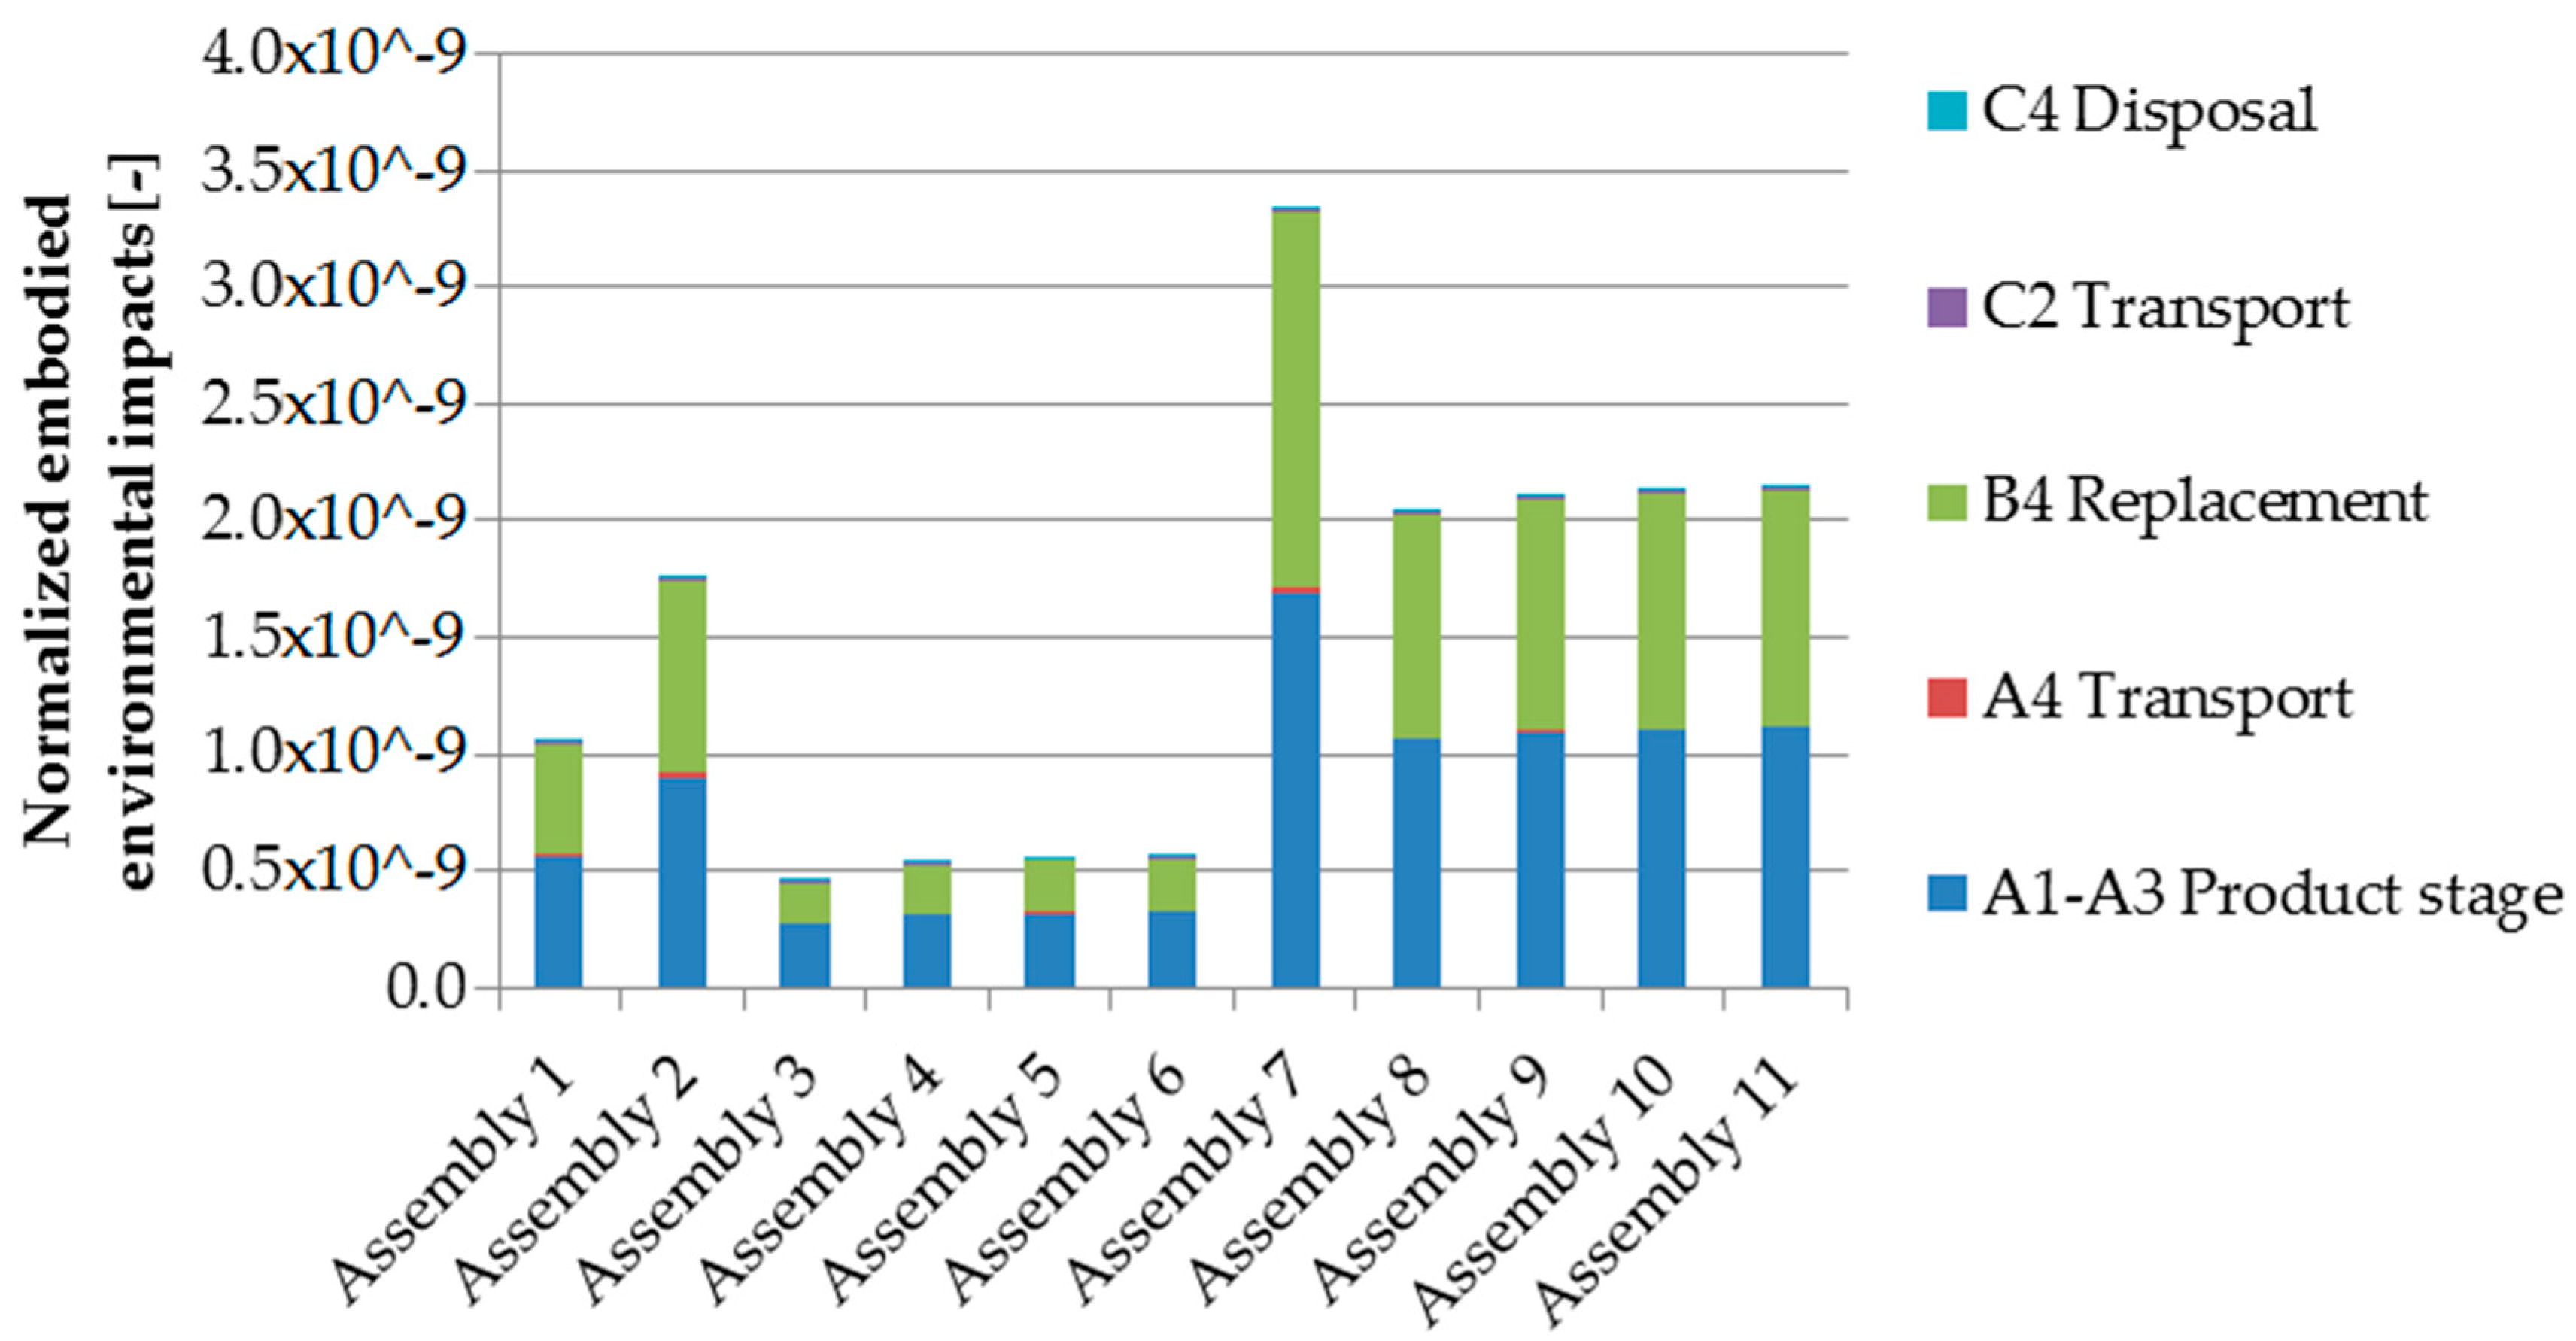
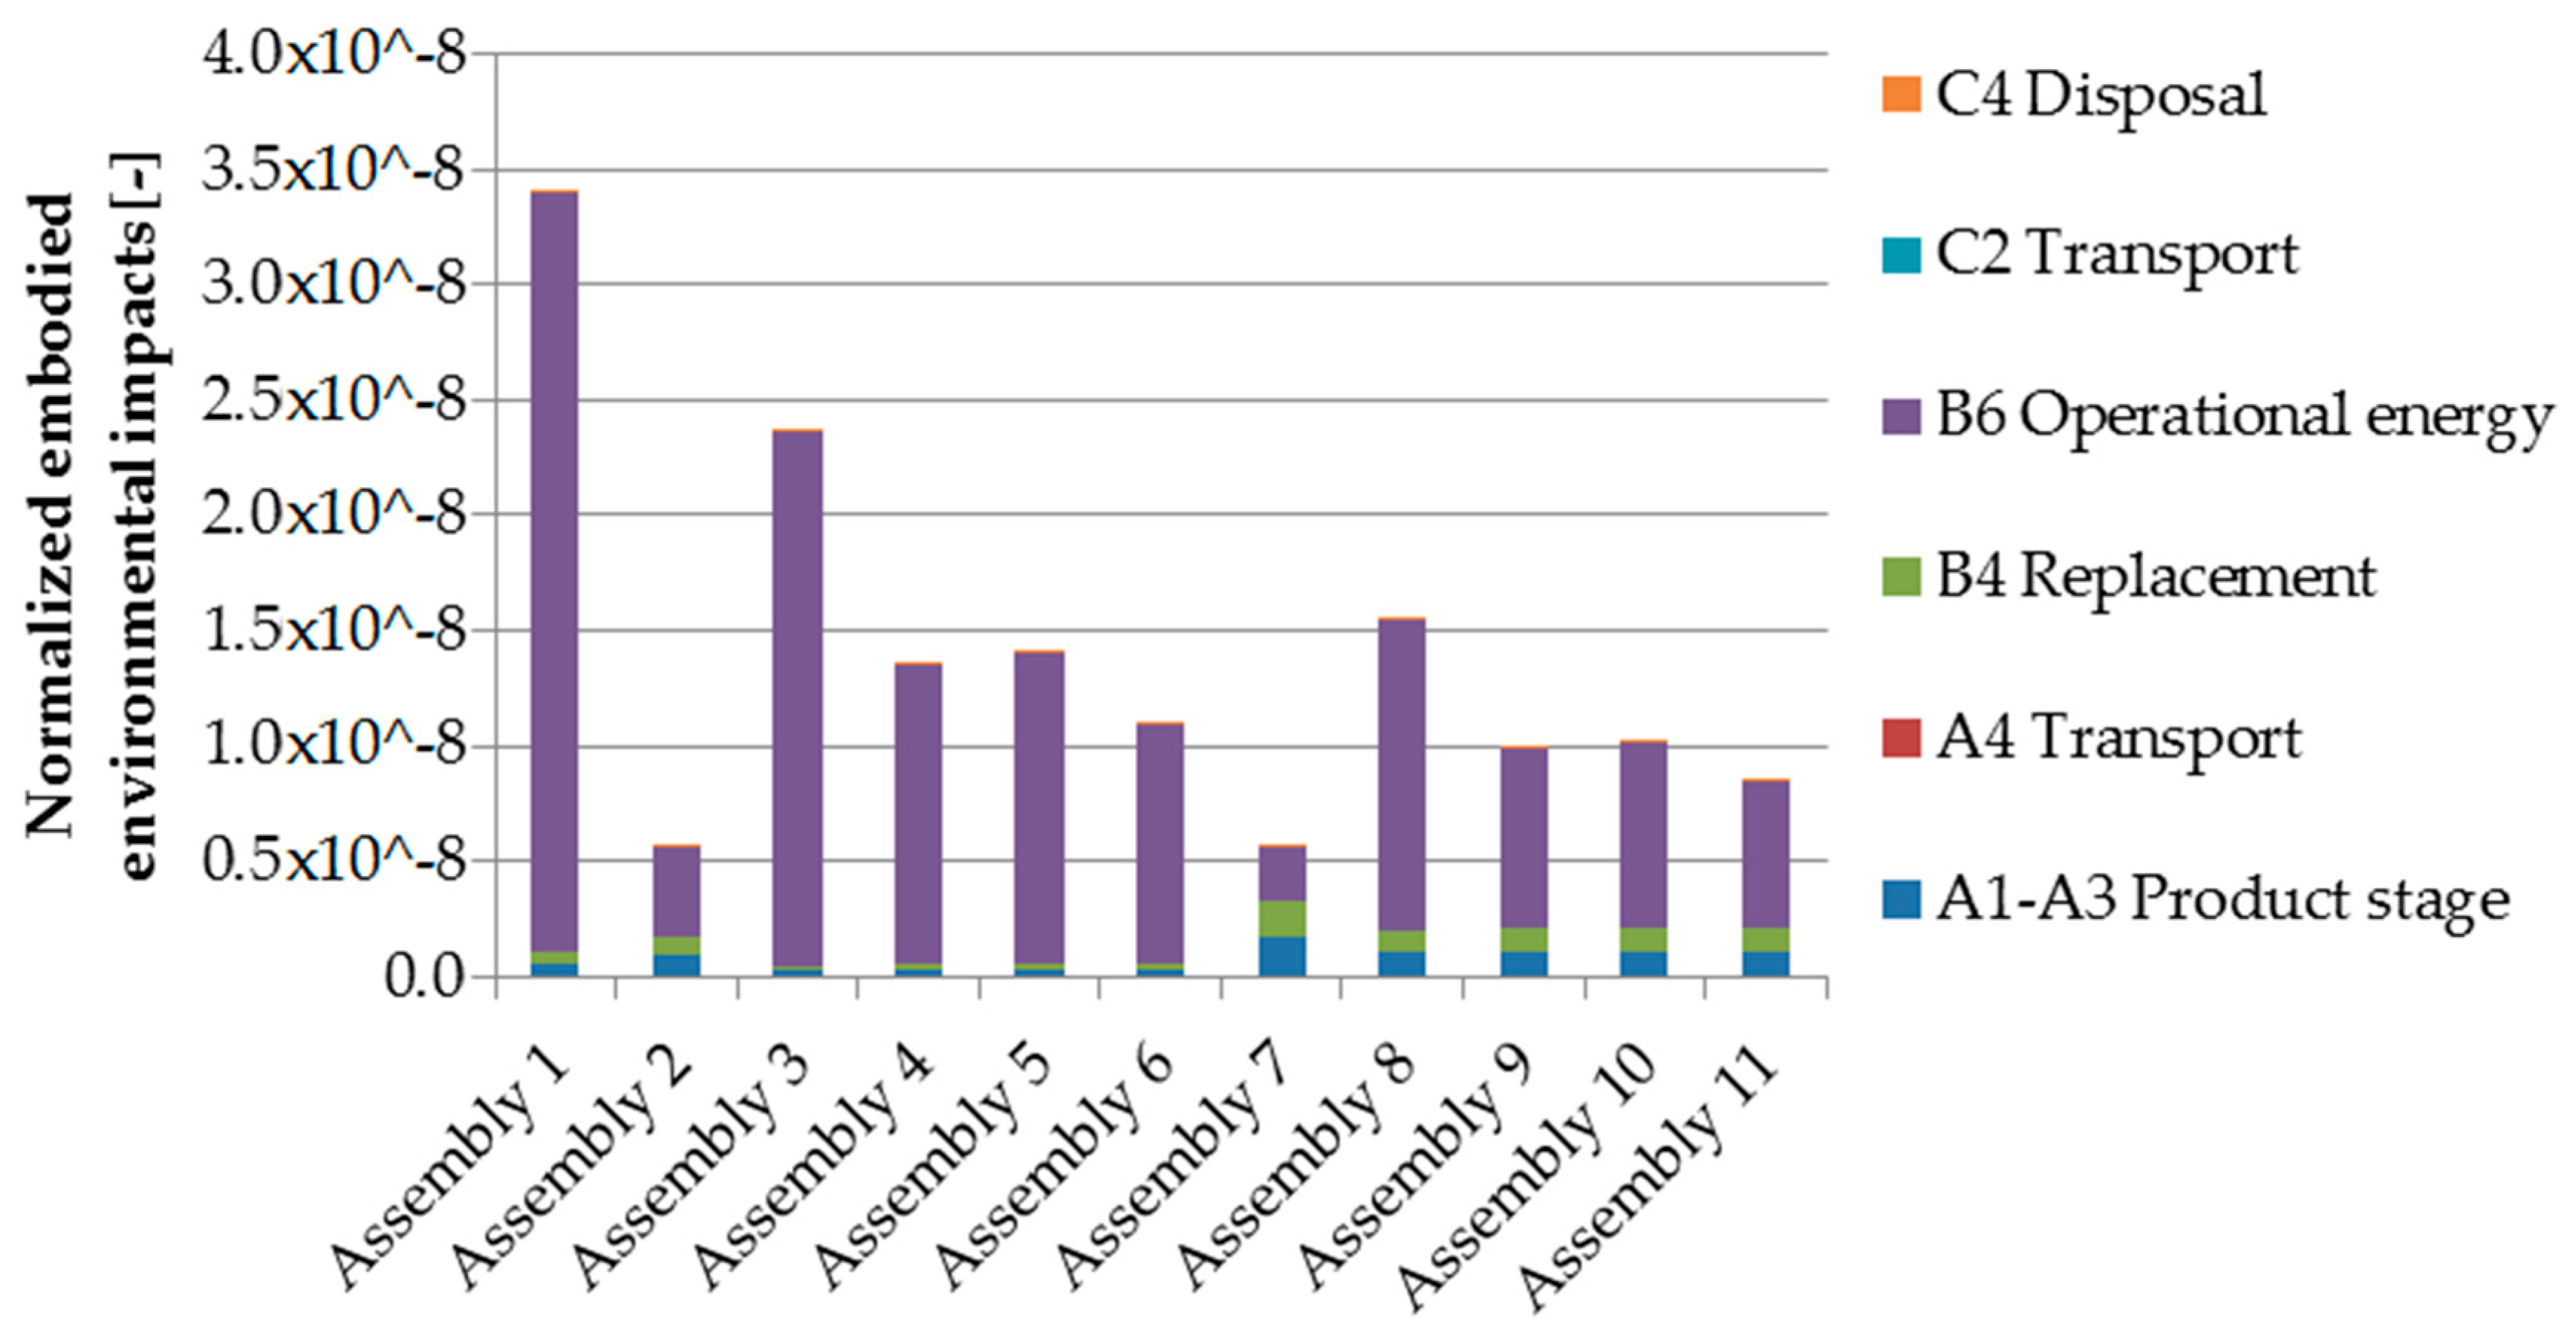
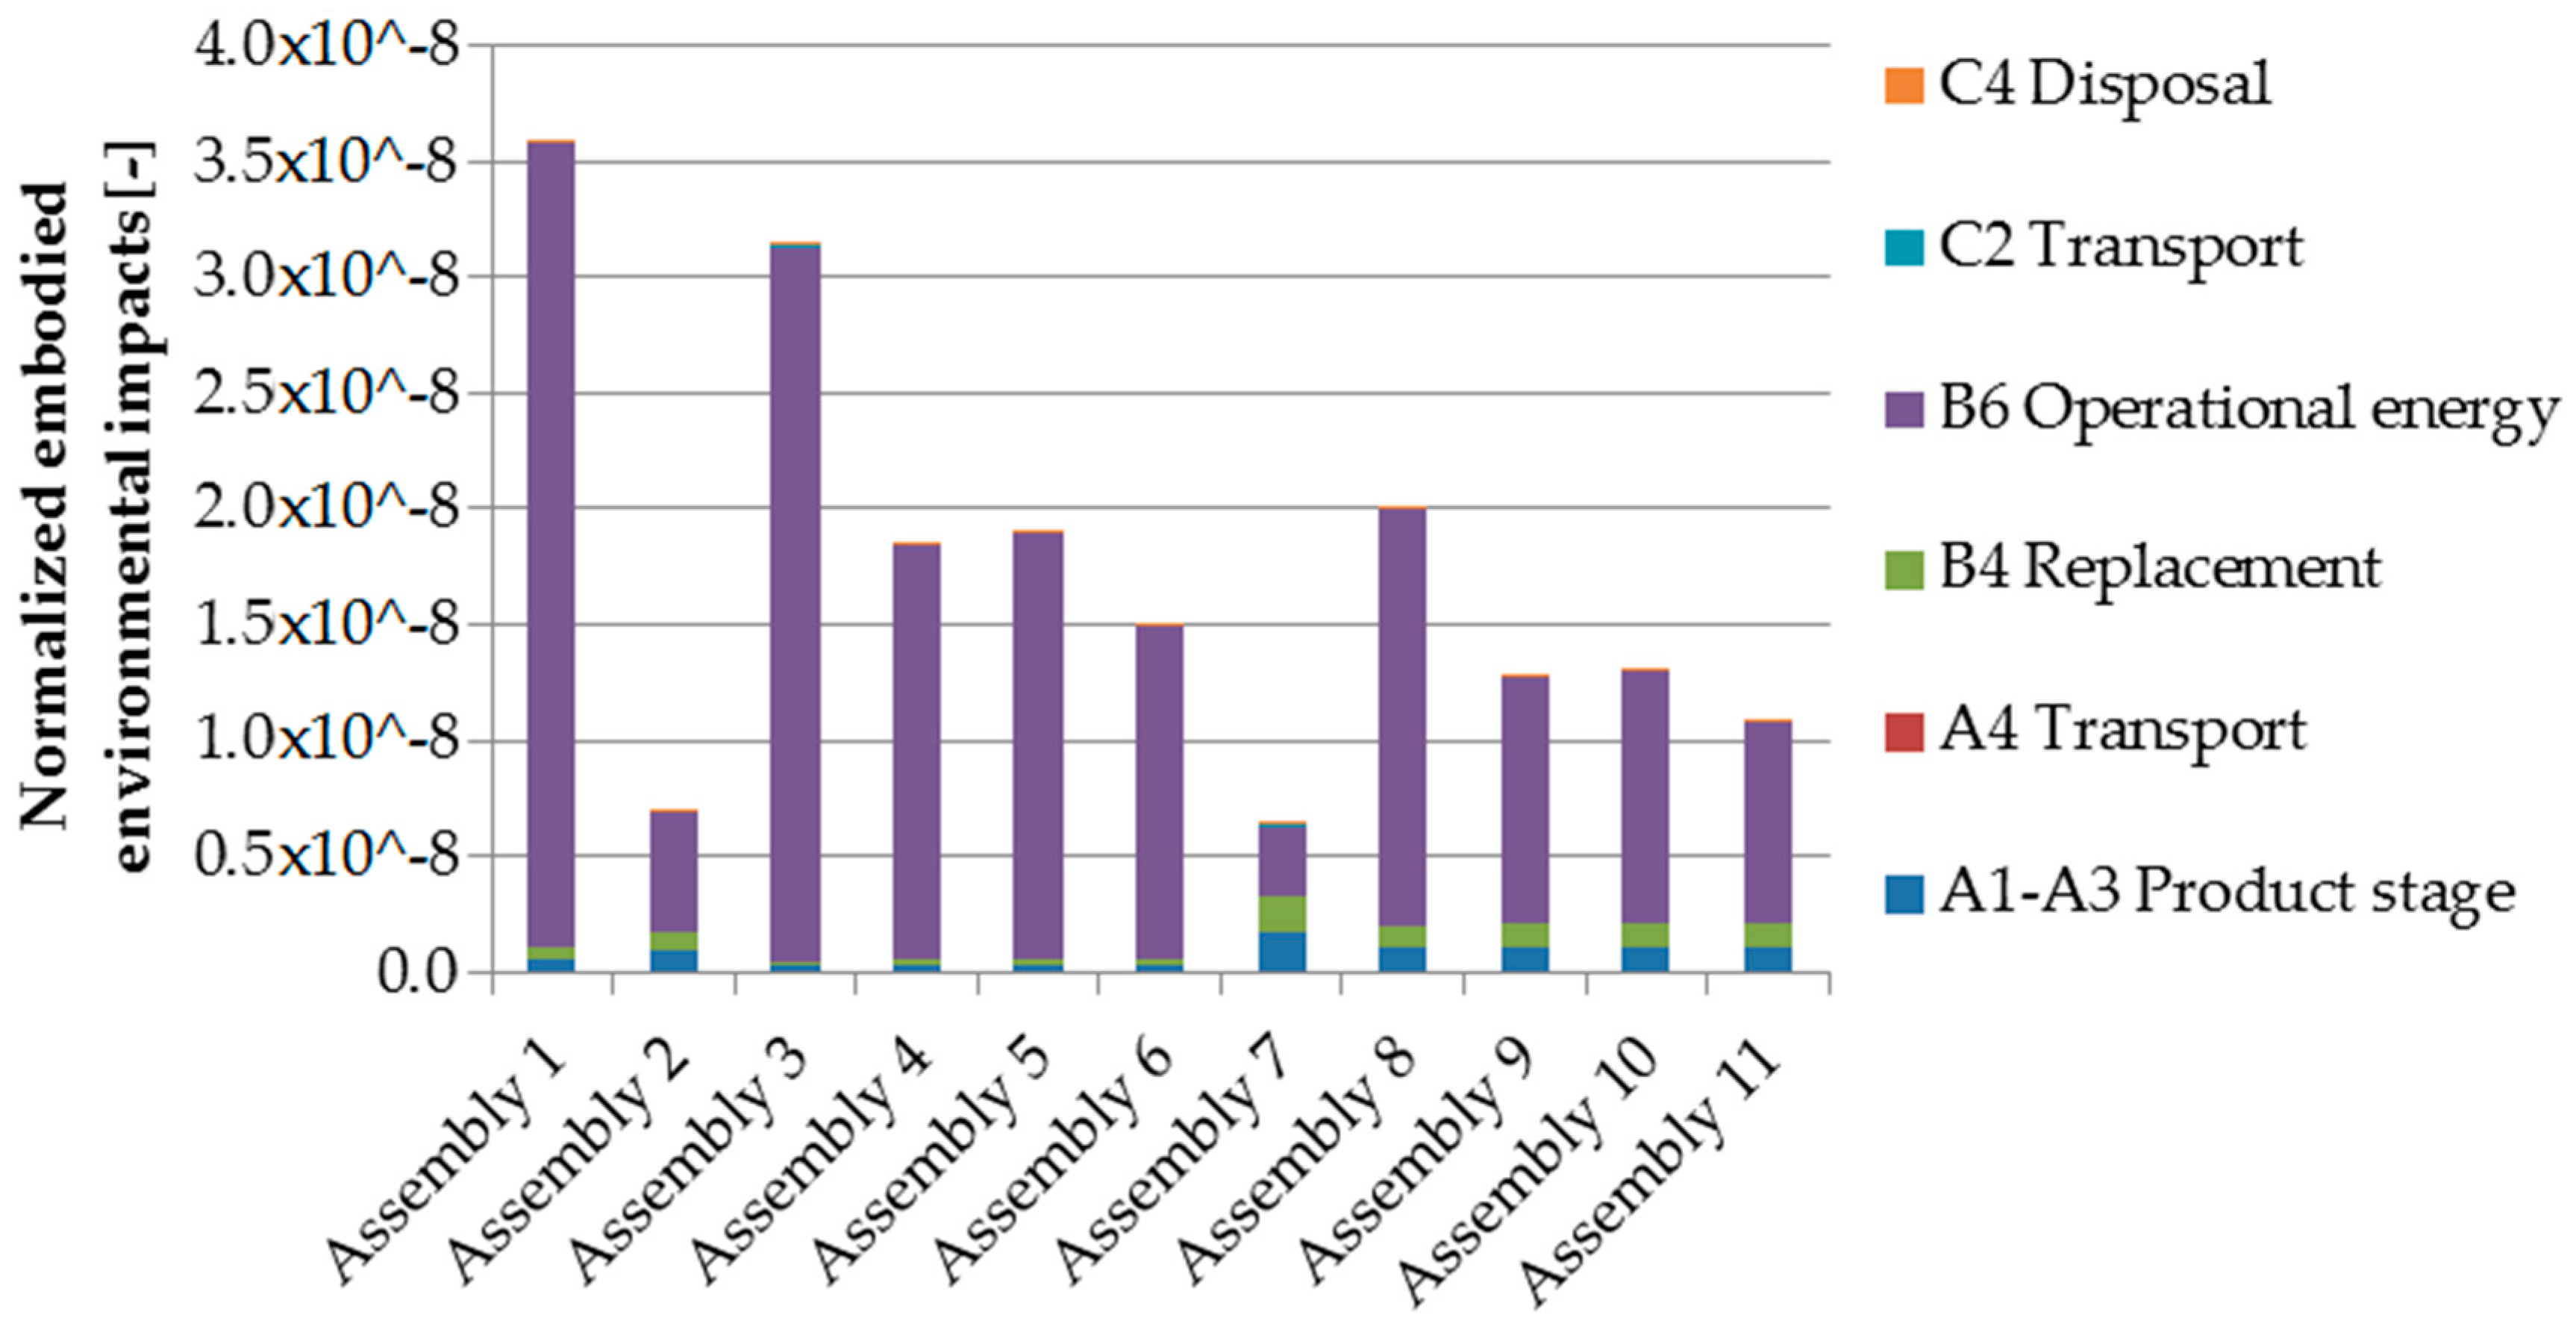
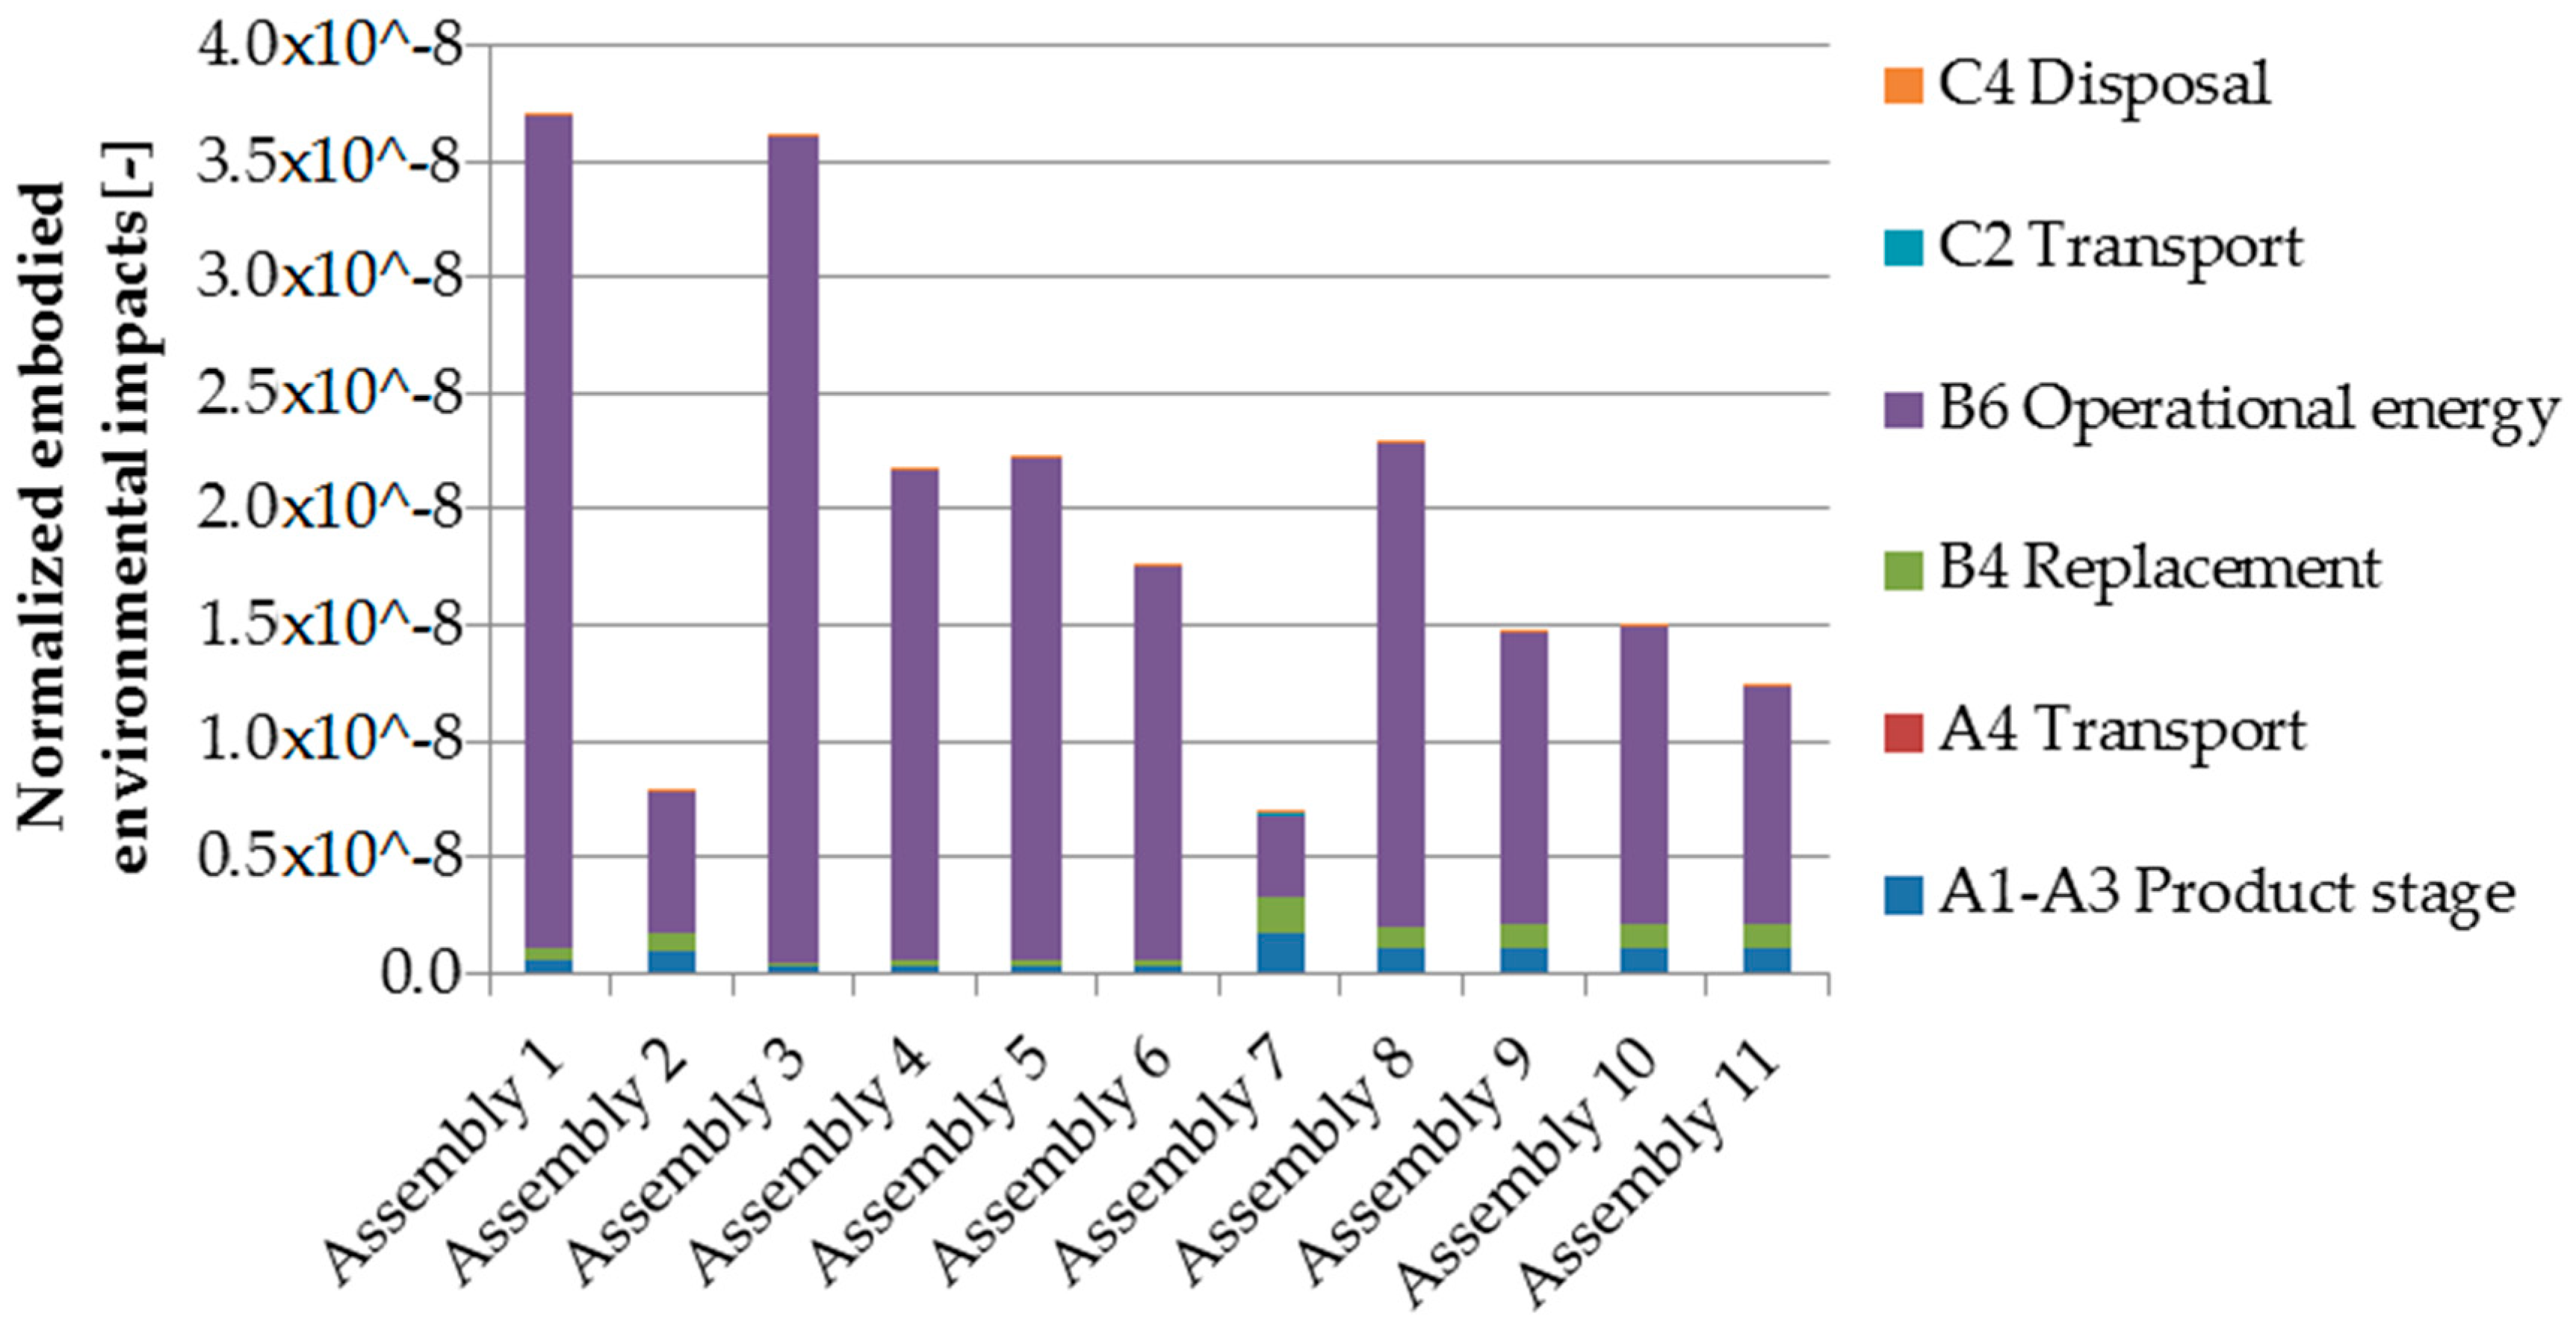
3.2. Evaluation of Overall Environmental Impacts

Previous Section 3.1 presented the embodied environmental impacts of the evaluated façade assemblies. This section adds environmental impacts related to heating consumption during the modelled 50-year service life of the façade assemblies. The results for each of the cardinal orientations described in Table 3 are shown in Figure 6, Figure 7 and Figure 8. These figures show that thanks to solar heat gains the heating energy consumption and interconnected environmental impacts are lower in all façade assemblies with TIMs compared to the reference assembly with ETICS. The difference varies depending on the scenario. When the southward orientation is considered (see Figure 6), the highest environmental “savings” (83.6%) are achieved by Assembly 2, while the lowest savings (30.5%) are achieved by Assembly 3. When the eastward orientation is considered (see Figure 7), the savings are reduced due to reduced solar energy gains. The highest savings (82.3%) are achieved by Assembly 7 and the lowest savings (12.5%) are achieved by Assembly 3. Similarly, when the north-eastward orientation is considered (see Figure 8), the highest savings (81.5%) are again achieved by Assembly 7 and the lowest (2.2%) by Assembly 3. The reason for these results is the fact that the difference in thermal resistance between these assemblies plays an increasingly important role depending on the reduction of solar energy gains. In this regard the 10 mm thick single-layer PC10 TIM cannot compete with the 40mm thick honeycomb structure of the HP40.
The results in Figure 6, Figure 7 and Figure 8 also indicate the important role of the type of solar energy absorber. In general, the calculated heating energy consumption of the assemblies with the SSA is lower compared to the assemblies with the nSSA. This in turn means that these assemblies have lower environmental impacts. The average difference between the environmental impacts of assemblies with the SSA and the nSSA in all three scenarios is 29.7%. When considering a 50-year service life, the difference in energy-related environmental impacts easily outweighs the higher embodied environmental impacts related to the production of nSSA in most assemblies. The only exception is Assembly 2 with the HP40 and the SSA. It has the lowest environmental impacts when the southward façade assembly orientation is considered. However, the difference between Assembly 2 and Assembly 7 (which placed second) is only 0.3%. Even in the other two scenarios the difference between Assemblies 2 and 7 is not high, even though Assembly 7 has 41% higher embodied environmental impacts. The total difference is 7.7% (in favor of Assembly 7) when eastward orientation is considered, and 12.2% (in favor of Assembly 7) when north-eastward orientation is considered.

4. Conclusions

The LCA presented in this study shows the potential for the application of solar facades and TIMs. In contrast to other studies (e.g., [15]) this contribution evaluates the efficiency of façades using a multi-criteria approach combining energy performance and various environmental impacts. The results show that all 10 façade assemblies with TIMs have lower overall environmental impacts compared to a reference assembly with ETICS. Three factors influence the achieved reductions. The first is the orientation of the evaluated façade assemblies to the cardinal directions. The highest difference (up to 83.6% in favor of TIM-based Assembly 2 with the honeycomb TIM and nSSA) is achieved with south-oriented façade assemblies that utilize the highest solar energy gains. The difference decreases in accordance with a change in orientation to bring it closer to the north. However, even north-east-oriented façade assemblies with TIMs have lower environmental impacts than the reference assembly with ETICS. Another factor that influences the results is the selected solar absorber. The lower efficiency of the nSSA is connected with higher heating energy consumption. Therefore, even though the results show that the nSSA has 99% lower embodied environmental impact than the SSA, the SSA should be preferred in order to reduce environmental impacts. In addition, this could be significantly improved, when SSA would be based on non-aluminum backing material; e.g., paper or foil. The last factor that influences the results is the thermal performance of the TIMs. In this regard the glass-encased PMMA panel HP40 with its relatively dense honeycomb structure proved more efficient than the plain polycarbonate panels PC10, PC20, PC25 and PC32.
While this study has shown the potential for the application of TIMs in solar walls, it has not covered all the issues connected with this field. Further research is therefore necessary. The aims of the future research will include the environmental impacts of cooling energy consumption, and the efficiency of different shading devices will be addressed as well to avoid possible overheating phenomena. Such study will hopefully provide a solution for the efficient application of TIM-based facades in the Czech Republic and surrounding regions.

Author Contributions

K.S. analyzed and described the environmental impacts of the façade assemblies, compiled the texts and prepared the draft of the manuscript; M.Č. conceived and designed the main concept of the presented research, contributed to the original texts of the manuscript and revised the manuscript draft; R.S. proposed and performed the thermal and energy analysis of the façade assemblies and described it in the manuscript.

Funding

Grantová Agentura České Republiky: GA 16-02430Y.

Acknowledgments

The presented study was supported by Czech Science Foundation project GA 16-02430Y “Contemporary concepts of climatically active solar facades integrating advanced material solutions”.

Conflicts of Interest

The authors declare that no conflict of interest exists in connection with this paper. The funding sponsors had no role in the design of the study, nor in the collection, analysis, or interpretation of data, nor in the writing of the manuscript or the decision to publish the results.

References

  1. UN. World Population Prospects: The 2017 Revision, Key Findings and Advance; United Nations, Department of Economic and Social Affairs, Population Division: New York, NY, USA, 2017; p. 53. [Google Scholar]
  2. Kolbert, E. The Sixth Extinction, An Unnatural History; Henry Holt and Company: New York, NY, USA, 2014; p. 336. ISBN 978-0805092998. [Google Scholar]
  3. Pachauri, R.K.; Meyer, L.A. Climate Change 2014: Synthesis Report. Contribution of Working Groups I, II and III to the Fifth Assessment Report of the Intergovernmental Panel on Climate Change; IPCC: Geneva, Switzerland, 2014; p. 151. [Google Scholar]
  4. CIB. Agenda 21 on Sustainable Construction; International Council for Research and Innovation in Building and Construction (CIB): Rotterdam, The Netherlands, 1999; p. 122. [Google Scholar]
  5. Kirchherr, J.; Reike, D.; Hekkert, M. Conceptualizing the Circular Economy: An Analysis of 114 Definitions. Resour. Conserv. Recycl. 2017, 127, 221–232. [Google Scholar] [CrossRef]
  6. SEV, A. How can the Construction Industry Contribute to Sustainablity Development? A Conceptual Framework. Sustain. Dev. 2009, 17, 161–173. [Google Scholar] [CrossRef]
  7. Fraunhofer, I.S.I. Study on the Energy Savings Potentials in EU Member States, Candidate Countries and EEA Countries Final Report; Fraunhofer-Institute for Systems and Innovation Research: Karlsruhe, Germany; Grenoble, France; Rome, Italy; Vienna, Austria; Wuppertal, Germany, 2009; p. 337. [Google Scholar]
  8. Kzlili, A.; Fokaides, P.A. Policy trends for the sustainability assessment of construction materials: A review. Sustain. Cities Soc. 2017, 35, 280–288. [Google Scholar]
  9. EC. Directive 2010/31/EU of the European Parliament and of the Council of 19 Maz 2010 on the energy performance of buildings. Off. J. Eur. Union 2010, 153, 13–35. [Google Scholar]
  10. Oh, J.; Hong, T.; Kim, H.; An, J.; Jeong, K.; Koo, C. Advanced Strategies for Net-Zero Energy Building: Focused on the Early Phase and Usage Phase of a Building’s Life Cycle. Sustainability 2017, 9, 2272. [Google Scholar] [CrossRef]
  11. Guillén-Lambea, S.; Rodríguez-Soria, B.; Marín, J.M. Review of European ventilation strategies to meet the cooling and heating demands of nearly zero energy buildings (nZEB)/Passivhaus. Comparison with the USA. Renew. Sustain. Energy Rev. 2016, 62, 561–574. [Google Scholar]
  12. Liang, X.; Wang, Z.; Royapoor, M.; Wu, Q.; Roskilly, T. Comparison of building performance between Conventional House and Passive House in the UK. Energy Procedia 2017, 142, 1823–1828. [Google Scholar] [CrossRef]
  13. Zacà, I.; D’Agostino, D.; Congedo, P.M.; Baglivo, C. Assessment of cost-optimality and technical solutions in high performance multi-residential buildings in the Mediterranean area. Energy Build. 2016, 102, 250–265. [Google Scholar] [CrossRef]
  14. Ekström, T.; Bernardo, R.; Blomsterberg, Å. Cost-effective passive house renovation packages for Swedish single-family houses from the 1960s and 1970s. Energy Build. 2018, 161, 89–102. [Google Scholar] [CrossRef]
  15. Favoino, F.; Goia, F.; Perino, M.; Serra, V. Experimental assessment of the energy performance of an advanced responsive multifunctional façade module. Energy Build. 2014, 68, 647–659. [Google Scholar] [CrossRef]
  16. Visa, I.; Moldovan, M.; Comsit, M.; Neagoe, M.; Duta, A. Facades Integrated Solar-thermal Collectors–Challenges and Solutions. Energy Procedia 2017, 112, 176–185. [Google Scholar] [CrossRef]
  17. Denzer, A. The Solar House: Pioneering Sustainable Design; Rizzoli: New York, NY, USA, 2013; p. 256. [Google Scholar]
  18. Saadatian, O.; Lim, C.H.; Sopian, K.; Salleh, E. A state of the art review of solar walls: Concepts and applications. J. Build. Phys. 2013, 37, 55–79. [Google Scholar] [CrossRef]
  19. Omrany, H.; Ghaffarianhoseini, A.; Ghaffarianhoseini, A.; Raahemifar, K.; Tookey, J. Application of passive wall systems for improving the energy efficiency in buildings: A comprehensive review. Renew. Sustain. Energy Rev. 2016, 62, 1252–1269. [Google Scholar] [CrossRef]
  20. Wong, I.L.; Eames, P.C.; Perrera, R.S. A review of transparent insulation systems and the evaluation of payback period for building applications. Sol. Energy 2016, 81, 1058–1071. [Google Scholar] [CrossRef]
  21. Osorio, J.D.; Rivera-Alvarez, A.; Girurugwiro, P.; Yang, S.; Hovsapian, R.; Ordonez, J.C. Integration of transparent insulation materials into solar collector devices. Sol. Energy 2016, 147, 8–21. [Google Scholar] [CrossRef]
  22. Casini, M. Smart Buildings: Advanced Materials and Nanotechnology to Improve Energy-Efficiency and Environmental Performance; Elsevier: Cambridge, UK, 2016; p. 363. [Google Scholar]
  23. Dowson, M.; Grogan, M.; Birks, T.; Harrison, D.; Craig, S. Streamlined life cycle assessment of transparent silica aerogel made by supercritical drying. Appl. Energy 2012, 97, 396–404. [Google Scholar] [CrossRef] [Green Version]
  24. Stazi, F.; Mastrucci, A.; Munafò, P. Life cycle assessment approach for the optimization of sustainable building envelopes: An application on solar wall systems. Build. Environ. 2012, 58, 278–288. [Google Scholar] [CrossRef]
  25. De Garcia, A.; Navarro, L.; Castell, A.; Boer, D.; Cabeza, L.F. Life cycle assessment of a ventilated facade with PCM in its air chamber. Sol. Energy 2014, 104, 115–123. [Google Scholar] [CrossRef]
  26. Čekon, M.; Struhala, K. Thermal, energy and life-cycle aspects of a transparent insulation façade a case study. IOP Conf. Ser. Mater. Sci. Eng. 2018, 415, 012019. [Google Scholar] [CrossRef]
  27. Hunt, R.G.; Franklin, W.E.; Hunt, R.G. LCA—How it came about—Personal reflections on the origin and the development of LCA in the USA. Int. J. Life Cycle Assess. 1996, 1, 4–7. [Google Scholar] [CrossRef]
  28. Boustead, I. LCA—How it came about: The Beginning in the UK. Int. J. Life Cycle Assess. 1996, 1, 147–150. [Google Scholar] [CrossRef]
  29. Baumann, H.; Tilman, A.-M. The Hitch Hiker’s Guide to LCA, An Orientation in life Cycle Assessment Methodology and Application; Studentlitteratur AB: Lund, Sweden, 2004; p. 20. [Google Scholar]
  30. ISO. Environmental Management—Life Cycle Assessment—Principles and Framework, ISO 14040; International Organization for Standardization (ISO): Geneva, Switzerland, 2006; p. 20. [Google Scholar]
  31. CEN. Sustainability of Construction Works—Environmental Product Declarations—Core Rules for the Product Category of Construction Products, EN 15804; European Committee for Standardization (CEN): Brussels, Belgium, 2012; p. 84. [Google Scholar]
  32. CEN. Sustainability of Construction Works—Assessment of Environmental Performance of Buildings—Calculation Method, EN 15978; European Committee for Standardization (CEN): Brussels, Belgium, 2011; p. 84. [Google Scholar]
  33. Čekon, M.; Struhala, K. Polycarbonate multi-wall panels integrated in multi-layer solar façade concepts. IOP Conf. Ser. Mater. Sci. Eng. 2018, 415, 012055. [Google Scholar] [CrossRef]
  34. Čekon, M.; Slávik, R.; Zach, J. Experimental Analysis of Transparent Insulation Based on Polycarbonate Multi-Wall Systems: Thermal and Optical Performance. Energy Procedia 2017, 132, 502–507. [Google Scholar] [CrossRef]
  35. CENIA. Zpráva o Životním Prostředí České Republiky 2015; Environmental Report of the Czech Republic 2015; Czech Environmental Information Agency (CENIA): Prague, Czech Republic, 2016; p. 269. (In Czech) [Google Scholar]
  36. Yaolin, L.; Zhou, S.; Yang, W.; Li, C.-Q. Design Optimization Considering Variable Thermal Mass Insulation, Absorptance of Solar Radiation, and Glazing Ratio Using a Prediction Model and Genetic Algorithm. Sustainability 2018, 10, 336. [Google Scholar] [CrossRef]
  37. Čekon, M.; Slávik, R. A Non-Ventilated Solar Façade Concept Based on Selective and Transparent Insulation Material Integration: An Experimental Study. Energies 2017, 10, 815. [Google Scholar] [CrossRef]
  38. Majumdar, P. Computational Methods for Heat and Mass Transfer; Taylor & Francis Group, LLC: New York, NY, USA, 2005; ISBN 1-56032-994-7. [Google Scholar]
  39. Lewis, R.W.; Nithiarasu, P.; Seetharamu, K.N. Fundamentals of The Finite Element Method for Heat and Fluid Flow; John Wiley & Sons, Ltd.: Chichester, UK, 2004; ISBN 0-470-84788-3. [Google Scholar]
  40. ISO. Building Components and Building Elements—Thermal Resistance and Thermal Transmittance—Calculation Method; ISO 6946; International Organization for Standardization (ISO): Geneva, Switzerland, 2017; p. 40. [Google Scholar]
  41. Hens, H. Applied Building Physics; Wilhelm Ernst & Sohn: Berlin, Germany, 2011; ISBN 978-3-433-02962-6. [Google Scholar]
  42. EnergyPlus. Weather Data by Location. Available online: https://energyplus.net/weather-location/europe_wmo_region_6/SVK//SVK_Bratislava.118160_IWEC (accessed on 14 November 2018).
  43. Frischknecht, R.; Jungbluth, N.; Althaus, H.-J.; Doka, G.; Dones, R.; Hischier, R.; Hellweg, S.; Nemecek, T.; Rebitzer, G.; Spielmann, M. Overview and Methodology. Final Report Ecoinvent Data v2.0; Swiss Centre for Life Cycle Inventories: Dübendorf, Switzerland, 2007; p. 77. [Google Scholar]
  44. Dutil, Y.; Rousse, D.; Quesada, G. Sustainable Building: An ever evolving Target. Sustainability 2011, 3, 443–464. [Google Scholar] [CrossRef]
  45. Roh, S.; Tae, S.; Suk, S.J.; Ford, G. Evaluating the embodied environmental impacts of major building tasks and materials of apartment buildings in Korea. Renew. Sustain. Energy Rev. 2017, 73, 135–144. [Google Scholar] [CrossRef]
Figure 1. Schematic diagram of an evaluated facade assembly with transparent insulation materials (TIM) (left) and the individual types of TIMs applied in the evaluated façade assemblies (right): (a) 40 mm honeycomb cells (HP40), (b) 10 mm single-layer square cells (PC10), (c) 20 mm seven-layer square cells (PC20), (d) 25 mm two-layer triangular cells (PC25), (e) 32 mm five-layer combined cells (PC32).
Sustainability 10 04212 g001
Figure 2. Calculation model based on the finite element method for: (a) an opaque structure; (b) a structure with a transparent element on the exterior side.
Sustainability 10 04212 g002
Figure 3. Solar radiation model based on the finite element method; calculated reduction factor for the azimuth of the structure and time of year: (a) for July; (b) for January.
Sustainability 10 04212 g003
Figure 4. Normalized embodied environmental impacts related to the production of materials in the assessed façade assemblies (modules A1–A3 according to EN 15978).
Sustainability 10 04212 g004
Figure 5. Normalized embodied environmental impacts related to the production of materials, the transport of materials, necessary replacements, and waste management (modules A1–A4, B4, C2 and C4 according to [32]).
Sustainability 10 04212 g005
Figure 6. Normalized environmental impacts of the whole 50-year life cycle of evaluated façade assemblies. The energy consumption represents the southward assembly orientation.
Sustainability 10 04212 g006
Figure 7. Normalized environmental impacts of the whole 50-year life cycle of evaluated façade assemblies. The energy consumption represents the eastward assembly orientation.
Sustainability 10 04212 g007
Figure 8. Normalized environmental impacts of the whole 50-year life cycle of evaluated façade assemblies. The energy consumption represents the north-eastward assembly orientation.
Sustainability 10 04212 g008
Table 1. Life cycle of a building according to EN 15978 [32]. Stages and modules considered in the presented study are highlighted in boldface and grey background color.
A1 to A3Product StageA1: Raw material supplyDBenefits and loads beyond the system boundary (Reuse, Recovery and Recycling potential)
A2: Transport
A3: Manufacturing
A4 to A5Construction Proc. StageA4: Transport
A5: Construction/Installation process
B1 to B7Use StageB1: Use
B2: Maintenance
B3: Repair
B4: Replacement
B5: Refurbishment
B6: Operational energy use
B7: Operational water use
C1 to C4End of Life StageC1: Deconstruction/demolition
C2: Transport
C3: Water processing
C4: Disposal
Table 2. Materials considered in the evaluated façade assemblies.
EPS (ETICS)Cement Mortar (ETICS)Mineral Plaster (ETICS)SSAnSSAPolycarbonate (TIM)Glass Cover (TIM)
Assembly 16.60 kg8.00 kg16.00 kg------------
Assembly 2------------0.15 kg0.86 kg26.00 kg
Assembly 3------------0.15 kg1.70 kg---
Assembly 4------------0.15 kg3.00 kg---
Assembly 5------------0.15 kg3.40 kg---
Assembly 6------------0.15 kg3.60 kg---
Assembly 7---------0.81 kg---0.86 kg26.00 kg
Assembly 8---------0.81 kg---1.70 kg---
Assembly 9---------0.81 kg---3.00 kg---
Assembly 10---------0.81 kg---3.40 kg---
Assembly 11---------0.81 kg---3.60 kg---
Table 3. The annual heating energy consumption of the evaluated façade assemblies. Three scenarios with different façade element orientations are considered.
Energy Consumption [kWh·m−2]South (180°)East (90°)North-East (15°)
Assembly 144.346.848.3
Assembly 25.16.88.1
Assembly 331.141.547.9
Assembly 417.524.128.3
Assembly 518.024.829.1
Assembly 613.919.322.9
Assembly 73.04.04.7
Assembly 818.124.128.0
Assembly 910.514.216.8
Assembly 1010.814.617.3
Assembly 118.511.613.8
Table 4. Materials considered in the evaluated façade assemblies and their physical parameters. *: equivalent value. **: measured value according to [34,37].
Thickness [mm]Number of Finite ElementsDensity [kg·m−3]Thermal Conductivity [W·m−1·K−1]Thermal Capacity [kJ·kg−1·K−1]Solar AbsorbanceThermal EmissivitySolar Transmittance **
Plaster0.01216000.758400.60.93---
Concrete0.021024001.47100010.93---
Polystyrene0.22/0.0510150.040 *120010.90---
PC100.0101165 *0.065 *10000.20.840.82
PC200.0201144.9 *0.051 *10000.20.840.62
PC250.0251135.5 *0.066 *10000.20.840.63
PC320.0321110.8 *0.059 *10000.20.840.53
TIM0.040110000.04010000.20.840.58
nSSA---------------0.950.9---
SSA---------------0.950.1---
Table 5. Environmental impacts related to the production of materials included in the assessed façade assemblies (modules A1–A3 according to [32]).
Assembly 1Assembly 2Assembly 3Assembly 4Assembly 5Assembly 6Assembly 7Assembly 8Assembly 9Assembly 10Assembly 11
ADP-el [kg Sb-Equiv.]6.5 × 10−42.2 × 10−41.2 × 10−41.4 × 10−41.5 × 10−41.5 × 10−42.7 × 10−41.8 × 10−42.0 × 10−42.0 × 10−42.0 × 10⁻⁴
ADP-ff [MJ]1.18.0 × 10−16.1 × 10−17.3 × 10−17.7 × 10−17.9 × 10−11.18.8 × 10−11.01.01.1
AP [kg SO2-Equiv.]2.7 × 10−13.8 × 10−11.7 × 10−12.1 × 10−12.2 × 10−12.3 × 10−14.9 × 10−12.8 × 10−13.2 × 10−13.3 × 10−13.4 × 10⁻¹
EP [kg Phosphate-Equiv.]5.0 × 10−25.4 × 10−23.6 × 10−23.9 × 10−24.0 × 10−24.1 × 10−26.4 × 10−24.6 × 10−24.9 × 10−25.0 × 10−25.1 × 10⁻²
FAETP [kg DCB-Equiv.]4.73.42.83.03.13.11.0 × 109.79.91.0 × 101.0 × 10
GWP [kg CO2-Equiv.]1.0 × 1028.5 × 107.7 × 108.8 × 109.1 × 109.3 × 101.0 × 1029.3 × 101.0 × 1021.1 × 1021.1 × 102
GWP-ex [kg CO2-Equiv.]9.9 × 108.4 × 107.6 × 108.7 × 109.0 × 109.2 × 109.9 × 109.2 × 101.0 × 1021.1 × 1021.1 × 102
HTP [kg DCB-Equiv.]1.5 × 101.3 × 108.59.29.49.51.9 × 101.5 × 101.6 × 101.6 × 101.6 × 10
MAETP [kg DCB-Equiv.]1.3 × 1043.3 × 1047.2 × 1038.1 × 1038.4 × 1038.5 × 1036.5 × 1043.9 × 1044.0 × 1044.0 × 1044.0 × 104
ODP [kg R11-Equiv.]5.4 × 10−65.5 × 10−63.2 × 10−63.2 × 10−63.2 × 10−63.2 × 10−66.6 × 10−64.3 × 10−64.4 × 10−64.4 × 10−64.4 × 10⁻⁶
POCP [kg Ethene-Equiv.]8.1 × 10−23.3 × 10−22.2 × 10−22.7 × 10−22.8 × 10−22.9 × 10−24.1 × 10−23.1 × 10−23.5 × 10−23.6 × 10−23.7 × 10⁻²
TETP [kg DCB-Equiv.]3.7 × 10−12.9 × 10−12.6 × 10−13.0 × 10−13.2 × 10−13.2 × 10−14.4 × 10−14.0 × 10−14.4 × 10−14.6 × 10−14.6 × 10⁻¹

