1. Introduction
The disaster management cycle consists of mitigation, preparation, response, and recovery. Categorized under the response and recovery phases, debris removal and treatment is not only a tremendous economic burden, but can also pose environmental and human health risks if managed improperly [
1]. Debris removal is therefore an important consideration after disasters, and has been widely researched, so that debris removal plans can be enacted as efficiently as possible when a disaster does occur [
2]. Having a debris management plan ahead of a disaster can speed up the recovery process and help prevent human health and environmental hazards [
2]. Although much research has been done in the areas of estimating debris volumes, clean-up costs, and time requirements [
3,
4,
5,
6,
7], there is a gap in the focus on specific debris types such as electronic waste [
8]. The United States Congressional Research Service states that estimating the volume of different debris waste streams is important because it allows for the “… identification of appropriate staging grounds to separate wastes, determination of necessary landfill space, determination of necessary contract services, and anticipation of special handling requirements applicable to hazardous debris” [
9]. In addition, a 2011 review paper on disaster waste management by Brown et al. adds that “whilst the literature provides an overview of the advantages and barriers to recycling following a disaster, there have been no quantitative assessments of post-disaster recycling feasibility, and what planning/preparations are possible pre-disaster to make recycling a more viable option” [
10].
Although electronic waste is a small portion of disaster-related debris [
6], the consequences of electronic waste generated during a disaster would likely be quite large in comparison to its volume. When considering the quantity of electronics that could be damaged and disposed of, this includes not only the electronic stocks that are currently in use, but also the stocks of old or unused electronics stored in people’s homes [
11,
12]. A disaster is viewed in this work as a catalyst that would likely lead to a much greater outflow of electronics to the waste stream simultaneously than would be expected under normal conditions. This would be due to the disaster ruining and therefore shortening and ending the life of electronics that were in use, as well as damaging old electronics that were being stored.
When discussing electronic waste disposal, there are many significant health concerns, regulations, valuable materials, and environmental impacts to consider. Electronic wastes can contain toxins such as lead, mercury, cadmium, and beryllium, which makes landfilling, incinerating, or improperly recycling the waste potentially dangerous to both human health and the environment [
13]. Exposure to these toxins (through improper recycling techniques in developing countries or landfill leaching) can result in an elevated risk of cancer, as well as developmental and neurological disorders [
13]. While studies show that the likelihood of landfill leaching from properly designed and maintained landfills is low, humans can be exposed to the hazardous materials contained in electronics through placement of the materials in incorrect landfills (such as landfills designed for inert construction and demolition or vegetative debris after a disaster) or exportation of the waste to developing countries for informal recycling [
14,
15]. While there have been international export bans on electronic waste in place since the 1989 Basel Convention, the majority of electronic waste is still not collected in formal collection programs and is exported to developing countries or mixed in with municipal solid waste and landfilled [
1,
16]. In a disaster, these concerns could be magnified due to the surge in electronic waste quantities, low prioritization of proper electronics disposal in the midst of disaster recovery efforts, and the combination of electronics with flood water and other waste. Electronics also contain valuable materials such as gold, silver, copper, and platinum group metals, which would be lost to landfilling or incineration [
17]. In fact, concentrations of some valuable materials are often higher in electronics than in the ore from which they are mined. Precious metals are found in printed circuit boards at tenfold the concentration of mined ore [
1]. Materials that are less valuable economically can still be important to recover because of the lower energy requirements and greenhouse gas (GHG) emissions that can be achieved by recycling versus producing virgin materials [
18].
In this paper, the importance of including electronic waste as an area of focused effort during the disaster recovery period is emphasized. To illustrate this point, the benefits of recycling electronic waste, as compared to landfilling, in a case study of a theoretical flood in Bonn, Germany are considered. This case study was chosen because floods are the most frequent type of disaster globally, and in Europe, the type that affects the greatest number of people and impacts the economy most severely [
19,
20]. Bonn is particularly susceptible to flooding due to its close proximity to the Rhine river, as seen in the historical floods of 1993 and 1995 [
21,
22]. According to the City of Bonn, “those who are living close to the river Rhine have to anticipate flooding” [
21]. The Centre for Climate Adaptation states that “significant upward flood trends in magnitude as well as frequency have been found in the Rhine catchment,” including at the gauges in Bonn and its neighboring city of Cologne [
23]. Bonn is also an interesting case study as it is a central location for disaster and geographic information systems (GIS) research and commercial GIS business [
24]. Bonn was even designated as a city of “geospatial technology excellence and research” in 2014 [
24,
25]. In addition, Bonn is home to the University at Bonn, which has several specialized GIS and geography programs, the German Federal Office of Civil Protection and Disaster Assistance, and the United Nations (UN) campus which hosts many global programs, including the Space-based Information for Disaster Management and Emergency Response and the UN Office for Disaster Risk Reduction [
26,
27,
28,
29].
In terms of electronic waste regulations, Germany has an “Electrical and Electronic Equipment Act (ElektroG)” which governs the sale, recovery, and recycling of electronics. This act is complementary to the European Union Waste Electrical and Electronic Equipment (WEEE) Directive [
30]. The most recent version of the WEEE directive has been in effect since 2014, and it sets a minimum standard for EU members on the treatment of WEEE, with producer responsibility as the central piece of the directive [
31,
32]. However, each country may enact extended producer responsibilities in different manners, as demonstrated by the German ElektroG program. Under this legislation, it is the producers’ or importers’ responsibility to finance the collection and recycling of electronics at the end of the electronics useful life. Consumers bring electronic waste to local collection points during non-disaster times, such as the town hall in Bonn [
33,
34]. The producers are then responsible for financing portions of the collection and treatment costs for the waste collected, based on the producers relative market shares [
30,
32]. Germany has approximately 10,000 registered producers [
30]. While this seems to be a well-planned system for normal operation, the UN Disaster Waste Management Guidelines say that after a flood, people typically strip the contents of affected buildings and place the waste by the roadside for collection. The guidelines also mention that it is quite common for hazardous materials, such as cleaning products and electronics, to be mixed in with regular wastes [
35]. Apart from this type of qualitative discussion, any analysis specific to the quantity or sustainability implications of the electronic waste generated in a disaster was lacking.
One example of electronic waste being collected, recycled, and accounted for was after Hurricane Katrina in New Orleans, Louisiana, and surrounding areas in 2005. The US Environmental Protection Agency (EPA) with the help of the US Army Corps of Engineers and private companies Dell and Best Buy, collected and ensured proper recycling of over 12,500 tons of electronic waste after Hurricane Katrina [
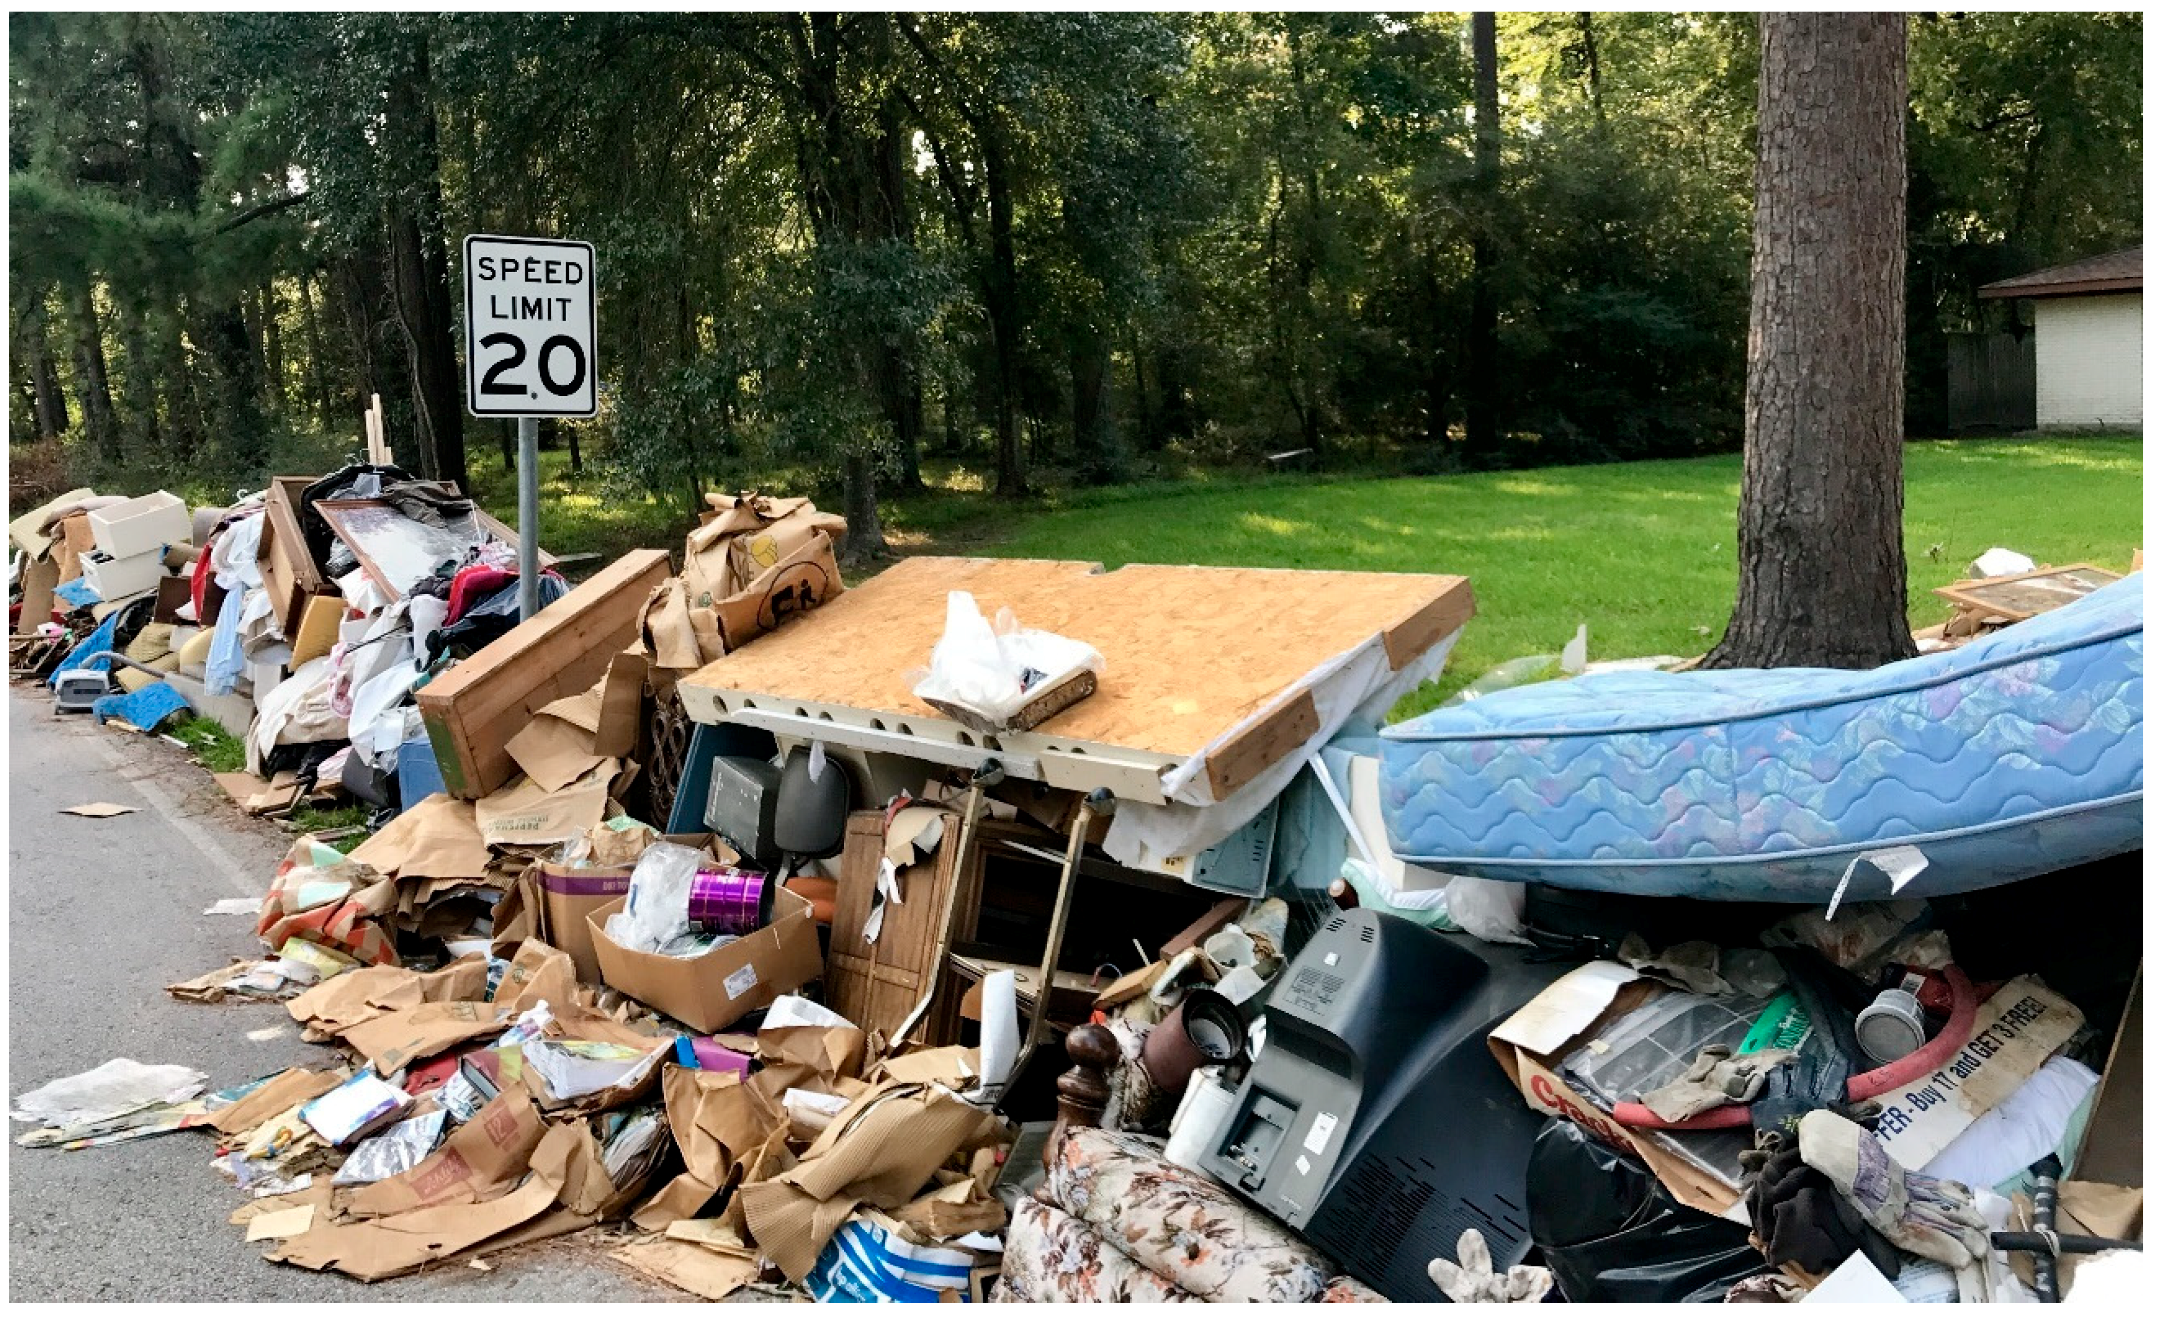
2]. More recently in 2017, the clean-up of Hurricane Harvey in Houston, Texas had less favorable results. While residents were instructed to separate electronics waste, most articles point out that due to the high quantity of waste (Houston is approximately six times the size of New Orleans), the chaos of the debris clean-up, the lack of effective communication, and the suspension of 19 environmental regulations, much of the electronic waste was mixed in with regular municipal solid waste destined for landfills, as seen in
Figure 1 [
36,
37,
38]. At this point, the EPA has not published electronic waste recycling numbers for Hurricane Harvey as was done for Hurricane Katrina. In fact, the Hurricane Katrina report was the only report found that actually quantified electronic waste generated by a disaster [
2]. Academic journals such as the International Journal of Disaster Risk Reduction, as well as local and national government debris management plans and post-disaster reports were reviewed, and while most included electronic waste as an existing debris category, details as to how and why the debris should be properly collected and recycled were lacking from all these sources. To complete such an analysis for this theoretical case study, the mass of materials recovered, economic value of materials recovered, GHG savings, and energy savings are used as metrics to quantitatively assess the benefits of collecting and recycling electronics, as opposed to landfilling. Health benefits are discussed qualitatively to supplement the sustainability analysis.
2. Methods
To analyze the sustainability benefits of collecting and recycling electronic waste as a separate waste stream after a disaster, a theoretical flood in Bonn, Germany was modeled. In 1993, the Rhine River in Bonn reached a level of 10.13 m, a record high in the past 100 years [
22]. For this scenario, an unprecedented 12-m river level was chosen, which would flood land elevations up to 58 m above sea level in most areas. The flood was modeled in ArcMap GIS to estimate the number of residential buildings in Bonn that would be impacted. At this point, any electronic waste that would be generated by the flooding of commercial buildings was neglected due to lack of data, recognizing that this most likely led to an underestimation in the results.
The flood was made using a digital elevation model, which was obtained from Copernicus, the European Union’s Observation Program [
39,
40]. The spatial analyst hydrology tools in ArcMap were used in conjunction with ModelBuilder to visualize the flooding of sea levels up to 58 m. The data used for the quantity and geospatial location of the residential buildings in Bonn came from OpenStreetMap, and the approximate quantity of residential buildings was verified through census data [
41,
42].
Data on US electronic stocks was used to model the quantity of electronic waste generated by the flood based on different damage level scenarios. Electronic stock information was not available for Germany specifically, but due to both its similarity in Gross Domestic Product per capita and its status as a developed nation, the electronic stock information from the United States was assumed to be a good surrogate on which to base German estimates [
43]. The electronic stock data comes from a material flow analysis study by Babbitt et al., based on the year 2015. In this same study, the average masses of electronic products were also calculated for the year 2015 through a combination of literature review, dynamic mass modeling, and empirical data collection as seen in
Table 1 [
44].
From the mass of electronic waste estimated; environmental, economic, and social metrics are used to demonstrate the benefits that can be realized by planning for and properly recycling the electronic waste material instead of landfilling. As environmental metrics, the mass of the materials that could be recovered from the electronic waste coming out of the flood was calculated, as well as the GHG and energy savings that could be realized by recycling those materials, as compared with landfilling them and subsequently having to produce new materials. These calculations were done by finding the differential between primary production and secondary production (or recycling) for GHG emissions and energy use for each material and multiplying by the quantity of each material that could be recovered after the flood. Economically, the value of materials that would be recovered by recycling were estimated, and potential profits or losses from collection and recycling were modeled for different scenarios. For the value of materials recovered, the price of materials in
$/kg was simply multiplied by the mass of materials that could be recovered after the flood. However, in the profit or loss model, we considered how varying the collection and processing costs, and the percentage of electronics damaged would lead to different economic outcomes. In terms of social sustainability, the negative health consequences that can be avoided through proper electronic waste management post-disaster are discussed qualitatively. These environmental and economic sustainability metrics were calculated based on the cumulative mass of electronics damaged in low, medium, and high scenarios, in which 10, 50, and 90%, respectively, of the electronics stocks in residential buildings are damaged by the flood. The ratio of electronic types that were damaged was assumed to be the same as the ratio of stocks that existed in the household (
Table 1). While buildings closer to the river would realistically experience worse flooding than those further from the river, due to the simplicity of this model it is assumed that there are equal flooding damages throughout all affected buildings in the inundation zone. Since the results are based on the total electronics damaged, the results would be the same whether it is assumed that all buildings had equal damage or the same degree of damage was distributed between residential buildings near the river and those further away.
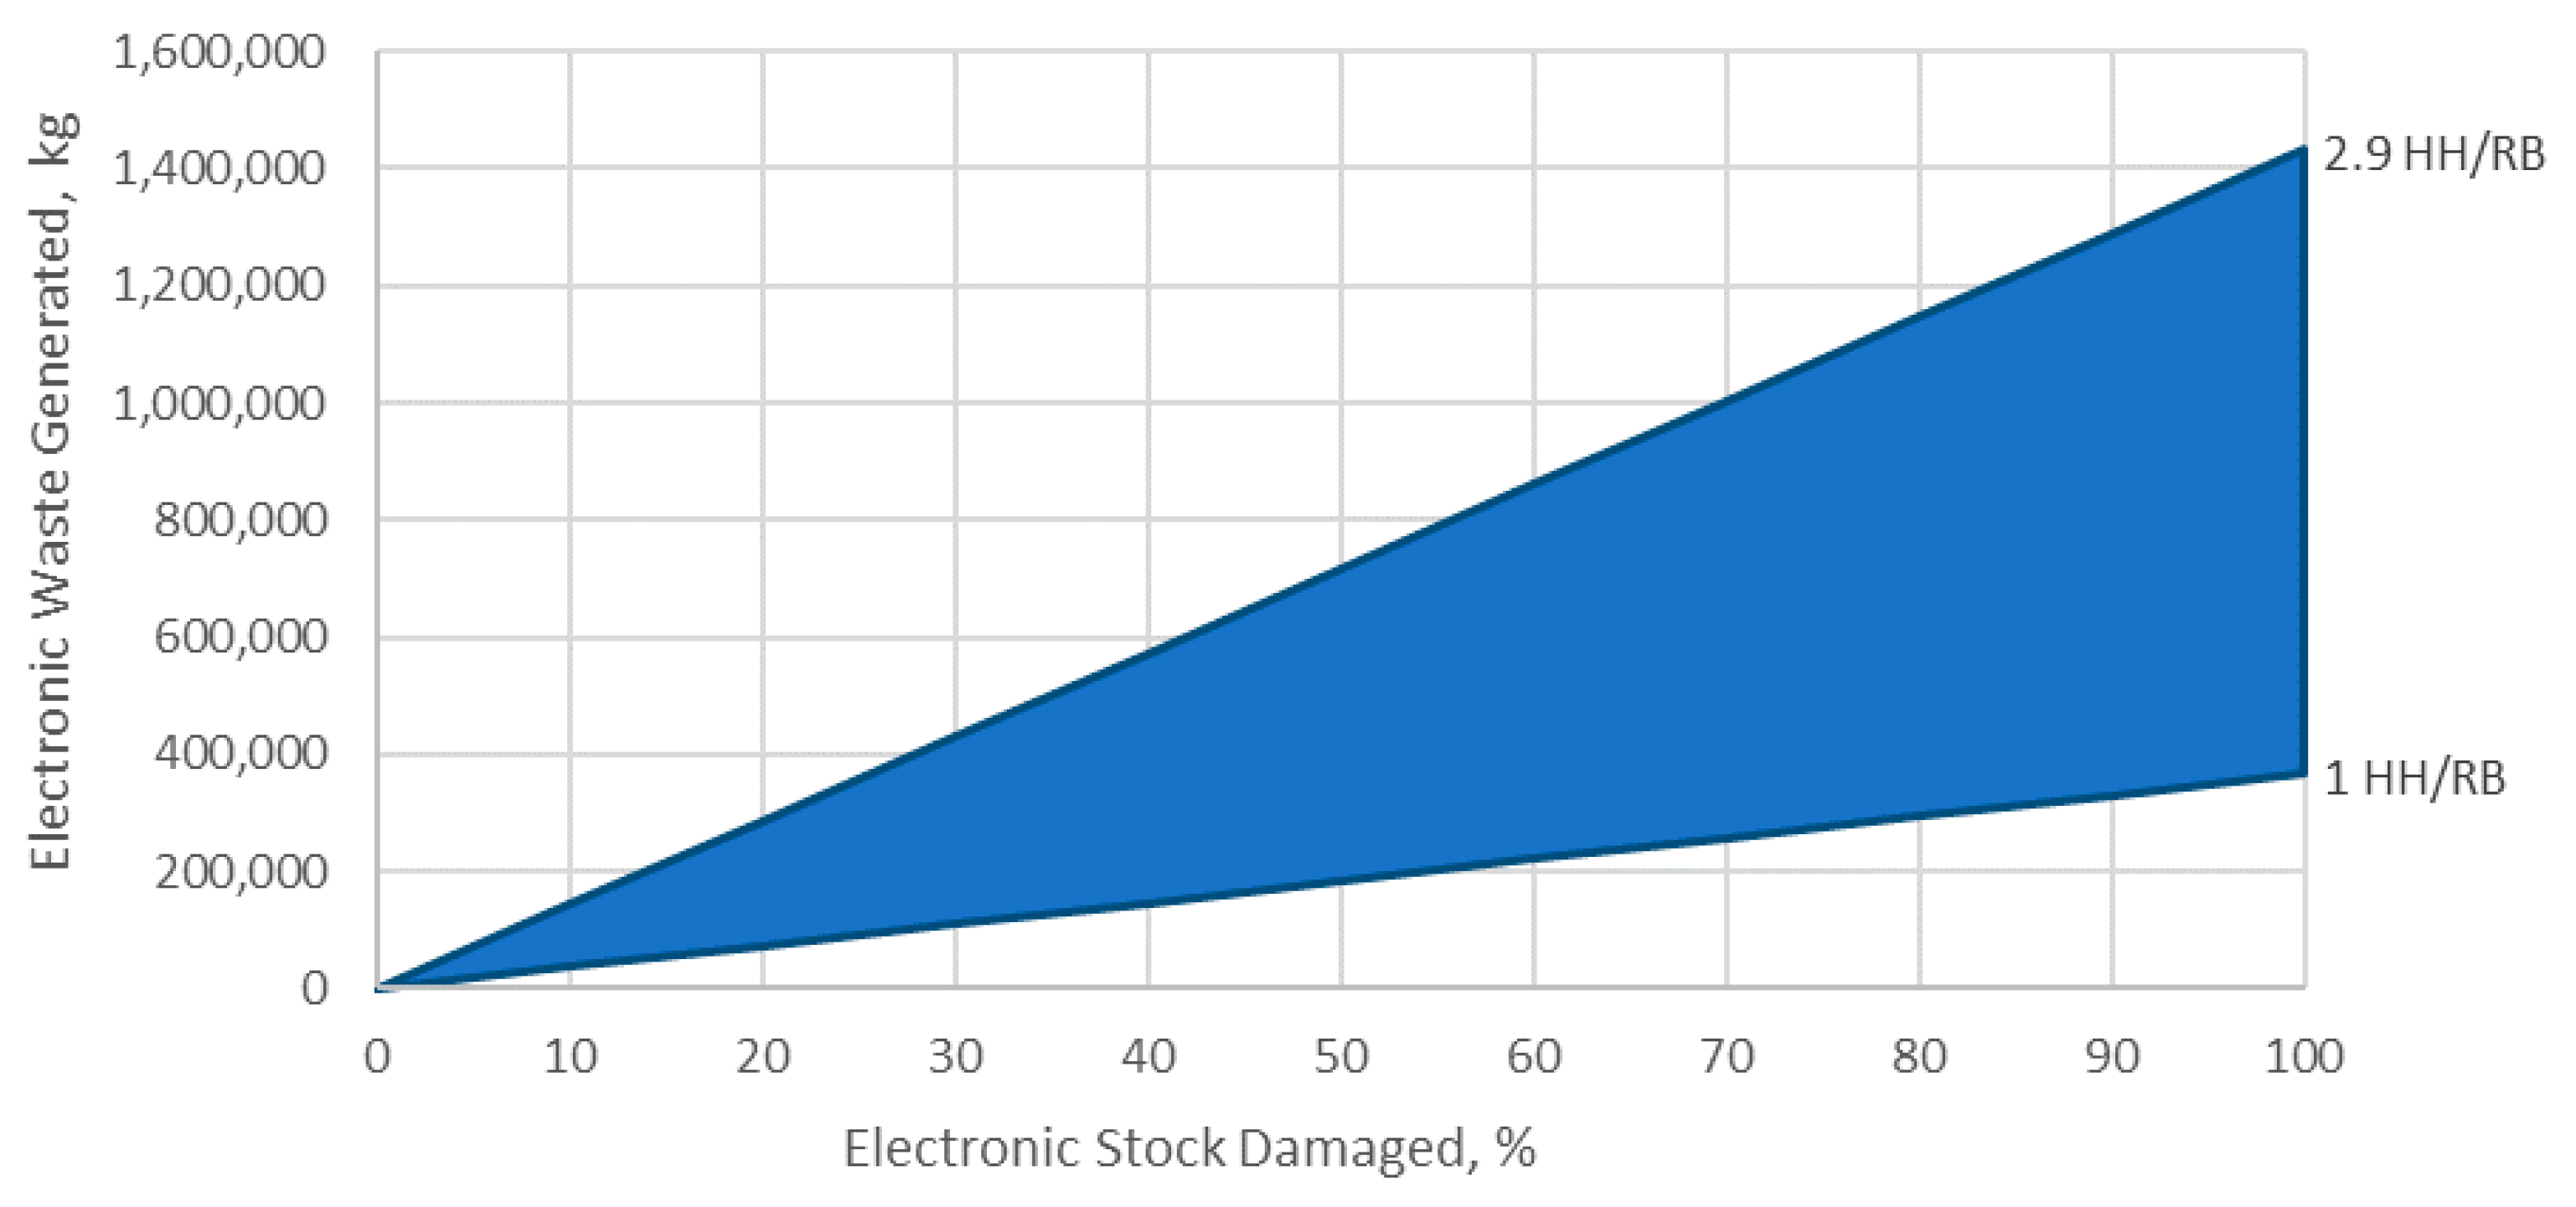
The average number of dwellings per residential building in the municipality of Bonn is 2.9 [
42]. This value suggests that each “residential building” modeled may correlate to more than one “household,” as per the electronic stocks data. However, it is likely that in any multi-story buildings, the greatest concentration of flooding impacts would be on first floor apartments. To deal with these uncertainties, a range of electronic waste that could be generated was calculated, based on a ratio of one “household” per “residential building” to 2.9 “households” per “residential building,” in addition to considering different damage scenarios.
3. Results
From the spatial model, it was determined that 4373 residential buildings would be encompassed in the flood inundation zone in Bonn. A visualization of the flood modeling and affected residential buildings can be seen in
Figure 2.
In
Figure 3 the generation of electronic waste is shown as it varies with the percentage of electronic stocks in the residential buildings that are damaged. At this time, retail outlets or commercial buildings were not considered in these estimates, due to lack of data.
In analyzing the sustainability aspects of these scenarios, “low,” “medium,” and “high” estimates of 10%, 50%, and 90%, respectively, are considered. In
Table 2, the electronic stocks per household are broken down into the materials contained and the quantity of materials that would be disposed of under the 10%, 50%, and 90% damage scenarios.
For all the following calculations, “other metals” was assumed to be equal parts zinc, nickel, and tin, the non-ferrous metals that have not already been called out separately in the breakdown. Owing to a combination of data availability and the large range in estimates, the flat panel displays and “other” categories were not included in the environmental or economic savings. Similarly, batteries were excluded from the environmental estimates due to a lack of information on the specific battery materials, and cathode ray tube (CRT) glass was assumed to have no recoverable economic value.
Environmental metrics that were calculated were the cumulative energy demand (or embodied energy) savings (in TJ) and GHG reductions (in metric tons of CO
2,eq) that could be realized from recycling the materials contained in the electronics rather than landfilling the electronics, and then producing that same quantity of primary raw materials. Details on material recovery rates [
45], primary and secondary production energy and GHG emissions [
18], and material prices [
46,
47,
48,
49] can be found in the
Supplementary Materials. The results for each of the three scenarios, 10% (low), 50% (medium), and 90% (high), of household electronics damaged in the flood are presented in
Table 3. The economic metric in the table is the value in USD of the materials or components contained within the electronic waste. The relationships in
Table 3 are linear, and therefore any intermediate damage scenarios can be interpolated. Further economic analysis which considers the recycling costs of collection and processing can be seen in
Figure 4.
It is important to consider the costs associated with recycling, such as collection and processing, which may offset any profits from material recovery. However, such a large influx of electronic waste may be beneficial to electronic waste recycling facilities that often face challenges with economies of scale. Owing to the lack of data, the differentiation of post-disaster electronic waste collection costs from normal costs is unknown. It is possible that with enormous waste transportation networks and staging areas already in place after a disaster, the collection costs per kg of electronic waste could be lower than pre-flood values. The data that would be necessary to support this theory were not available, and thus a range of collection and processing costs was modeled.
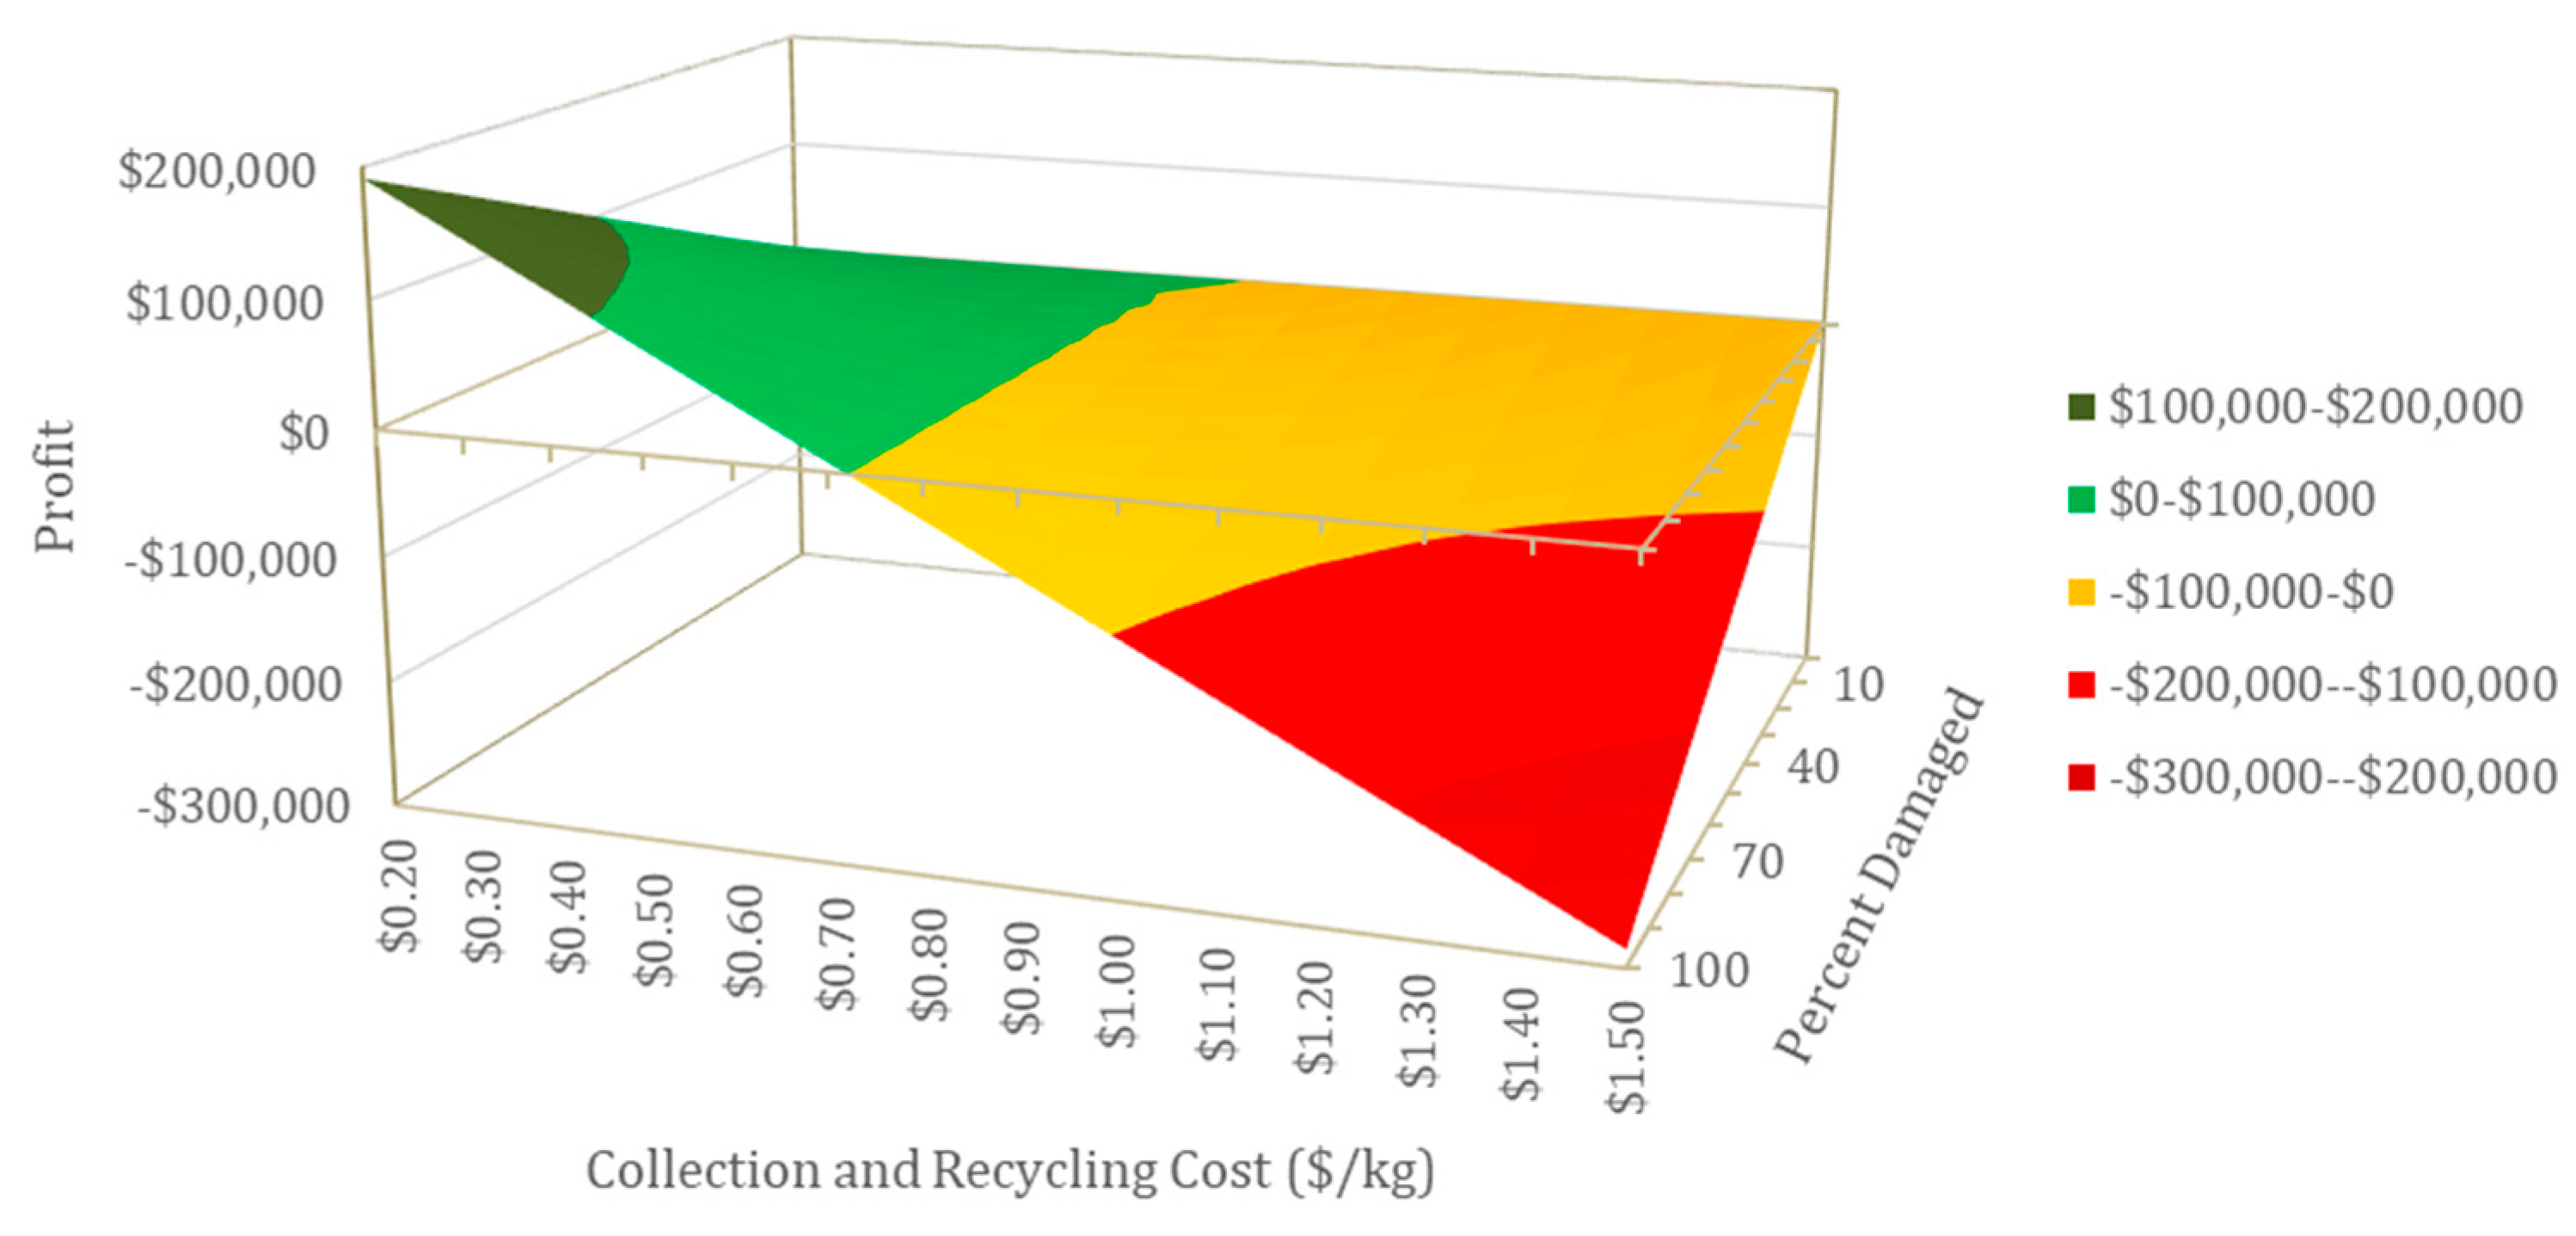
Figure 4 demonstrates how different recycling collection and processing costs (in
$/kg) combined with damage scenarios (from 0–100%), can lead to either a profit or loss for recycling the materials in the electronics, and subsequently selling these materials as commodities. In
Figure 4, this analysis is done only for the case of one “residential building (RB)” being equivalent to one “household (HH).” However, the relationship of the profit to the HH:RB ratio (or amount of electronics) is linear. For example, under the
$0.70/kg collection cost and 50% damage scenario, with 1 HH equivalent to 1 RB the profit would be
$3991, while using the 2.9 HH to 1 RB ratio would yield a profit 2.9 times greater at
$11,575. A range of recycling costs from
$0.20 to
$1.50 per kg was used based on literature values. One value cited by Wang et al. was for portable battery recycling (a subset of electronic waste) in Germany. The authors found an average of
$1.26 per kg for the variable costs of battery recycling, including collection, transportation, and processing [
52]. Another study that considered electronic waste more broadly calculated an average of
$0.69 per kg for “searching” and “shredding” [
45].
Collection and recycling costs exceeding
$0.72/kg result in net losses, but any costs remaining at or below
$0.72/kg generate profits (
Figure 4). Applying the literature value of
$0.69/kg would yield profits of
$1170,
$5830, or
$10,490 in the low, medium, and high scenarios, respectively. As mentioned previously, costs are likely to vary during a disaster, which could lead to much greater profits or losses than the ones calculated above.
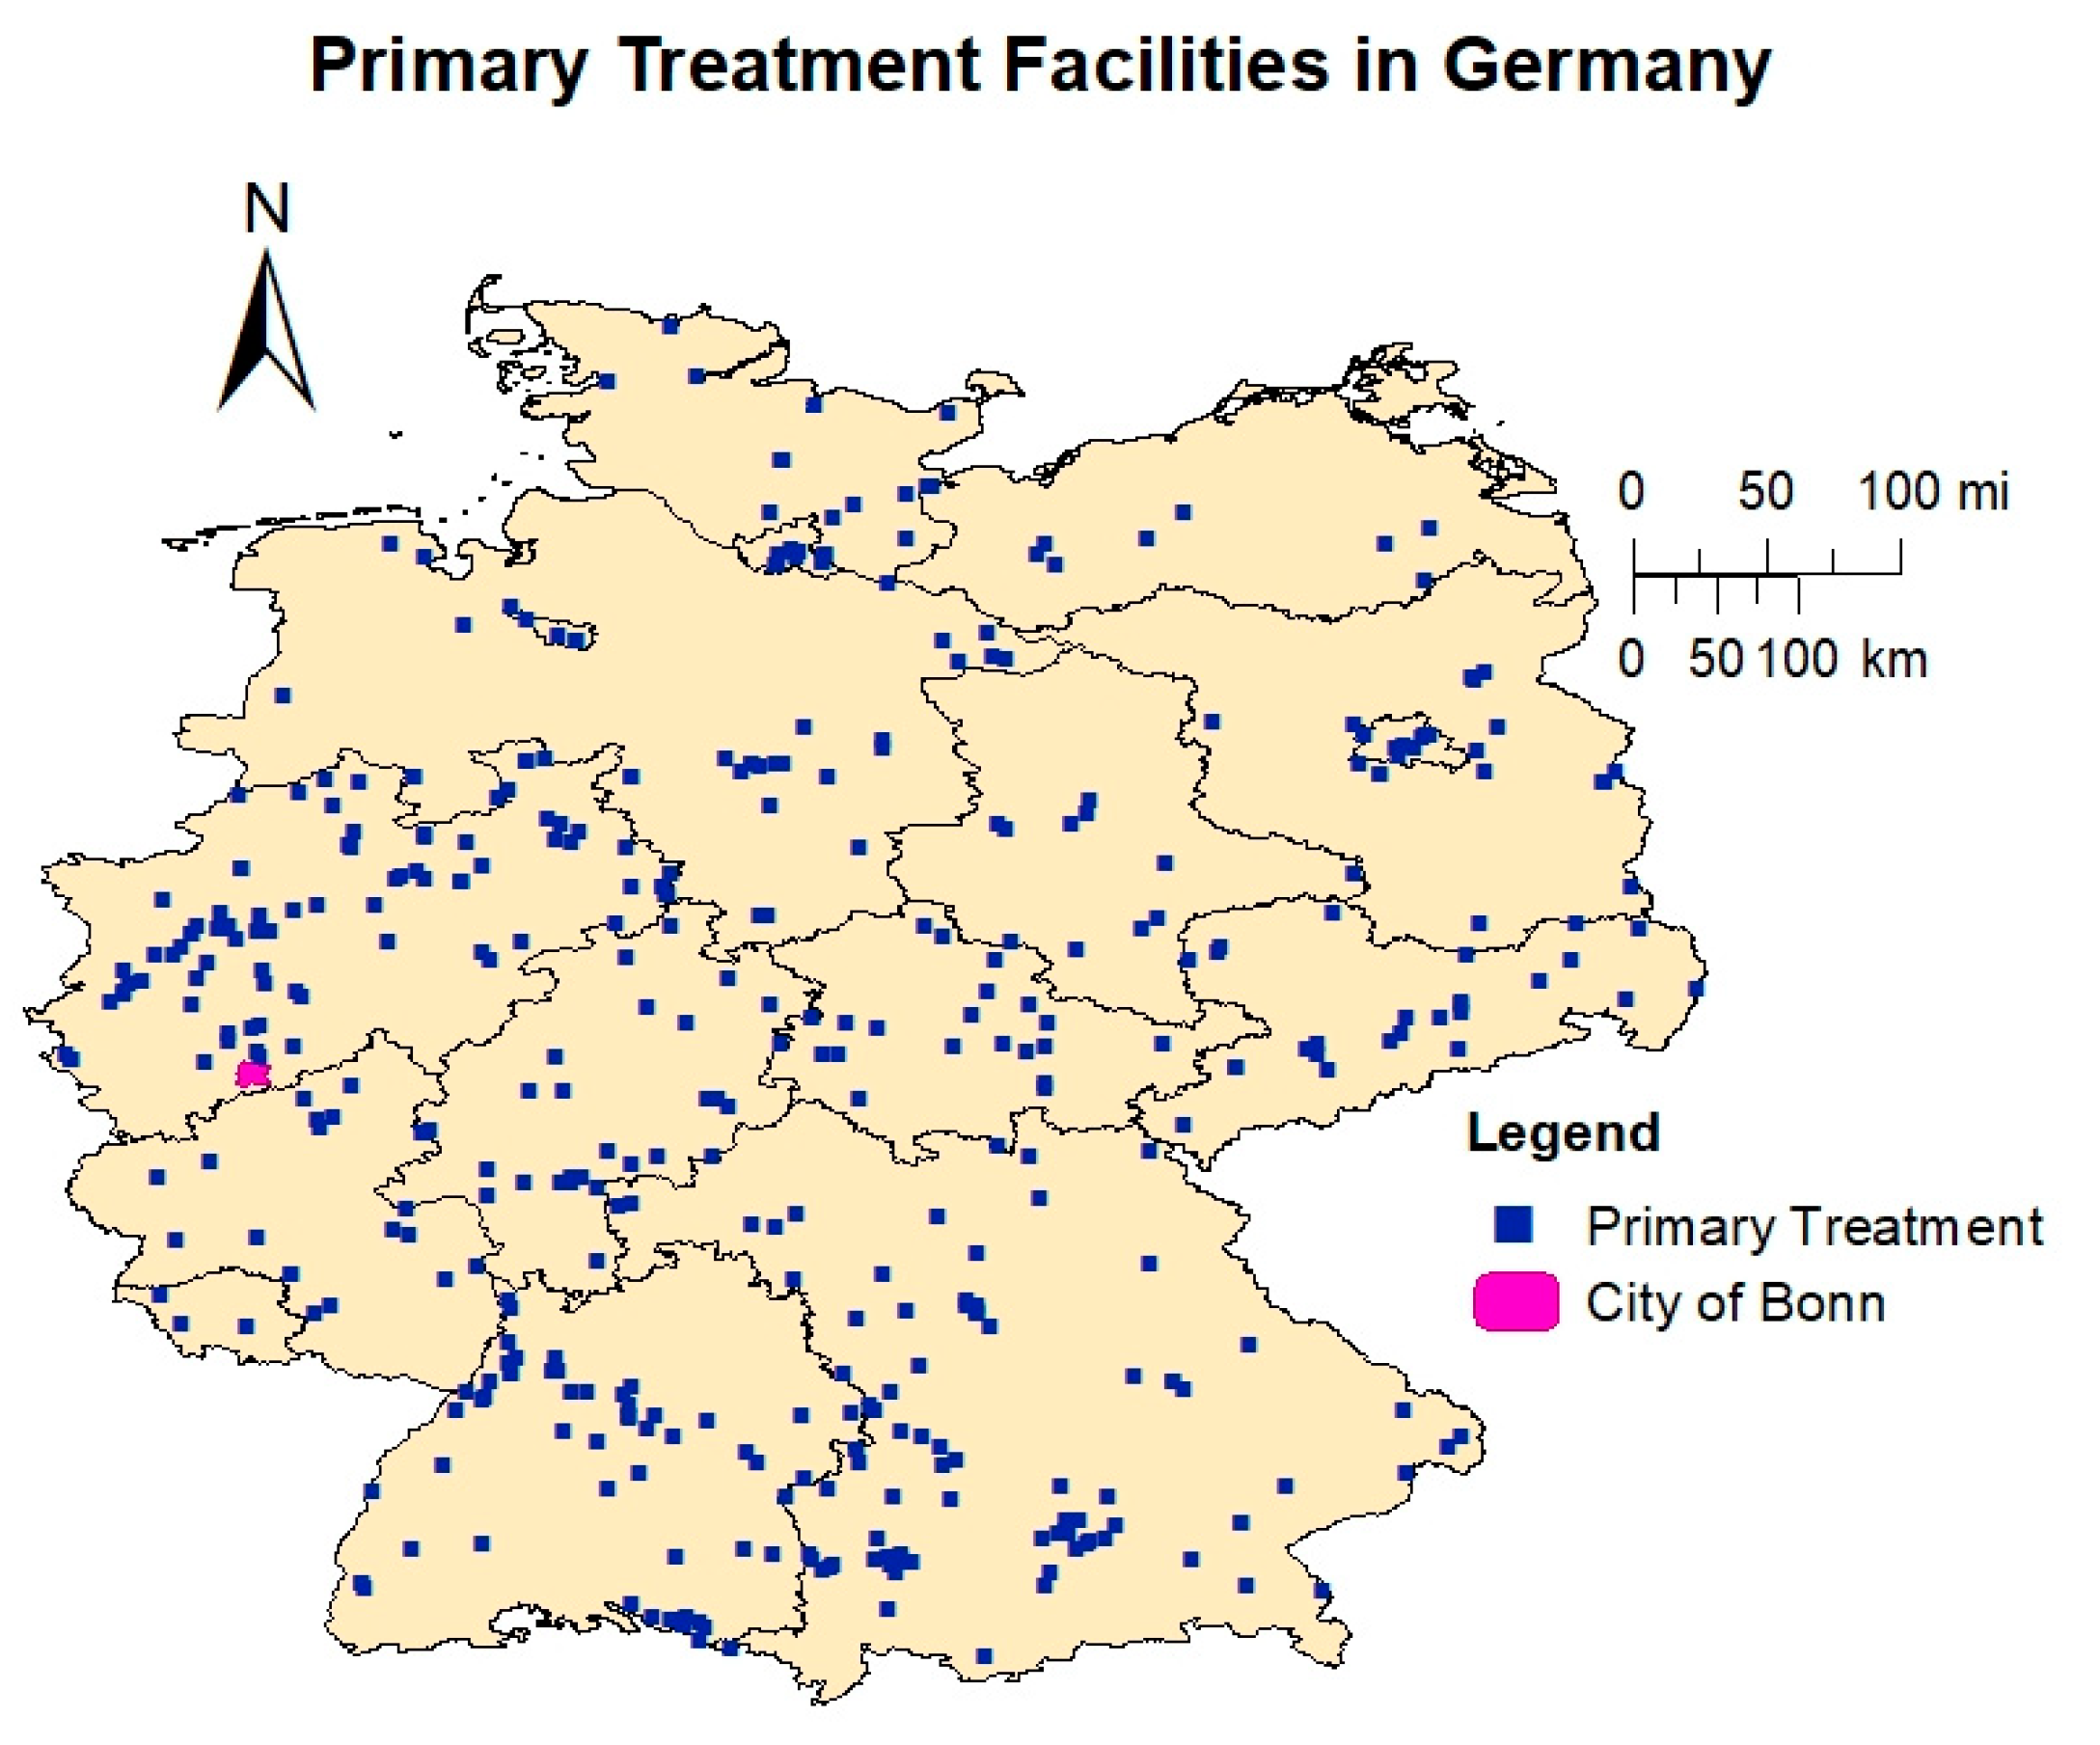
Part of the collection costs include transportation costs, which typically increase with the distance between the waste collection points and treatment facilities. The map in
Figure 5 displays the 442 primary treatment facilities for electronic waste that are authorized under ElektroG in Germany [
53]. While none fall within the city of Bonn, there are many nearby, with a total of 93 in the Nordrhein-Westfalen federal state in which Bonn is located [
53]. These facilities are the first locations the electronic waste might go from the collection points in a routine operation, and therefore would likely be the first locations to receive electronic waste after it has been sorted in staging areas post-disaster. These facilities are responsible for not only treating the electronic waste they receive, but also keeping extensive records of the weights and material content of devices entering and exiting the facilities [
54]. These primary facilities will typically prepare devices for reuse, remove pollutants, and separate recyclable materials and components [
54].
4. Discussion
In more easily understood metrics, the amount of GHG emissions saved by recycling the electronic waste generated after flooding, as opposed to landfilling, would be equivalent to taking up to 60 passenger vehicles off the road for one year, in the case of the low damage scenario [
55]. For the same scenario, energy savings from recycling are equivalent to eliminating as much as 150 tons of coal combustion for electricity generation [
56]. The economic metric shows that there is value in the materials that would be recovered, worth anywhere from
$26,500 to
$692,200 depending on the quantity of electronics that are damaged and the number of households per residential building. While the profitability of electronic waste collection and processing post-disaster is difficult to quantify, potential outcomes were modeled, which indicated the possibility for profits if collection and processing costs can be kept below approximately
$0.72/kg. However, there are costs associated with the collection and landfilling of electronics, as well as unmonetized environmental externalities, that should be considered in addition to the simple recycling profit modeling. While these scenarios demonstrate that recycling electronic waste after a disaster can, under certain scenarios, provide social, environmental, and economic savings as compared to landfilling, it is important to place such savings in the broader environmental context of recovery. While the impact of a disaster may be lessened by recycling electronic waste, the overall impact of a disaster will be largely negative, even within the small scope of electronic goods, as full recovery would include the production and use of replacement electronics.
In addition to the more quantifiable environmental and economic benefits, the recovery and proper recycling of electronic waste after a disaster is also important for preserving human health. According to the United States Congressional Research Service “… the desire to manage disaster debris as quickly as possible can have detrimental long-term repercussions if debris is managed improperly. During a disaster, some amount of hazardous waste will likely be commingled with nonhazardous wastes (for instance, under flooding conditions, household hazardous waste or sewage may contaminate nonhazardous personal property). Afterward, improper disposal of hazardous waste may lead to future environmental, health, or safety problems, such as the contamination of local groundwater” [
9]. The United States Congressional Research Service indicates that electronic wastes should be separated from other wastes and either recycled or disposed of as household hazardous waste [
9]. Some of the major health concerns include the lead in legacy CRT computer monitors and televisions (which can average nearly four pounds of lead per unit) [
1], mercury in flat screen displays lit by cold-cathode fluorescent lamps [
1], lead, mercury, nickel, and cadmium in batteries [
1], and arsenic, chromium, cadmium, mercury, beryllium, and brominated flame retardants in other electronic components [
13]. These chemicals have been proven to be human health hazards and have the potential to leach out of conventional landfills, or be released through informal recycling, into the surrounding soil and groundwater [
13].
While this case study was applied to residential buildings in a German city, it raises awareness of the global issue of electronic waste management after a disaster and instigates the discussion of how results might vary for commercial buildings or for other regions. Commercial electronic stocks will vary in composition from residential stocks. For example, commercial facilities may contain as many or more computers than residential buildings [
57]; however, other technologies such as DVD players, gaming consoles, and tablets are likely found in greater quantities in residential homes. It is also known that CRT televisions are a common residential stock item; however, they are unlikely to be present in commercial electronic stocks, as CRT televisions are no longer sold and are not frequently found in businesses or industrial facilities. This variation in electronic stock composition is important because some electronics such as CRTs contain toxic material like lead, while others like laptops contain more valuable materials.
Examples of regions that may vary from this case study include rural areas, where less damage could be expected due to the lower concentration of buildings, or developing countries where electronic stocks, electronic waste legislation, and the capacity to handle disaster can vary widely. Electronics in developing countries may be built cheaper but may also have longer lifespans due to higher repair rates [
58]. According to the UN Global E-Waste Monitor, urbanization, industrialization, lower electronics prices, and higher disposable incomes in developing countries are leading to increasing electronic ownership [
58]. Currently, there is still a disparity between electronics adoption in developed and developing countries. For example, annual electronic waste (not stocks) per inhabitant can range from 0.6 kg in the poorest country to 19.6 kg in the richest [
58]. Another study shows an “exponential relationship between wealth and number of computers,” indicating that as countries grow in purchasing power parity, ownership of electronics will increase proportionately [
1,
59]. In fact, one study estimates that developing countries may be generating approximately twice as many obsolete computers as the developed world by 2030 [
59]. An important issue to note is the variability in legislation regarding electronic waste. While 66% of the world population was covered under electronic waste regulations as of 2017, this statistic was heavily weighted by 85–100% coverage of Europe, North America, Australia, New Zealand, and Eastern Asia, whilst many developing regions had little or even no legislation regulating electronic waste [
58].
5. Conclusions
Under a theoretical flooding scenario in Bonn, Germany, recycling electronic waste from flooded homes was associated with substantial GHG, energy, and economic benefits relative to disposal by landfill. These benefits were all significant, especially when considering that this was a theoretical flood and the world experienced 342 disasters (of varying magnitudes) in 2016 [
60]. In addition, flooding and other disasters are predicted to increase due to climate change in the upcoming years [
23]. The Centre for Climate Adaptation says the Rhine is expected to have a “significant upward trend” in both the magnitude and frequency of floods [
23]. The results presented were estimates of the sustainability benefits that could be realized and were sensitive to the underlying assumptions. Improved data accuracy would lead to better estimates and models, such as those that exist for other major categories of disaster debris, which have had more research focus and better record-keeping in the past. However, as this flood scenario was theoretical in nature, and damages caused by a disaster can never be predicted exactly, the goal of this paper was to demonstrate the benefits that could be realized by including electronic waste recovery preparation in planning for disaster debris clean up. These estimates were conservative because only electronic waste from the residential sector was considered, and the potential commercial and industrial wastes were neglected. Future work could expand this scope, provided the necessary electronic stock data for commercial buildings were available.
Similar modeling approaches could be applied to other cities and regions around the world, as flooding and other disasters are global issues. The problem of electronic waste disposal post-disaster will continue to grow, given projected increases in disasters in the coming years due to climate change; therefore, it is important to have correct disaster recovery policies in place now. Such policies will require communication and collaboration between local governments and commercial recyclers, as well as an improvement in data gathering on the quantities of electronic waste generated in disasters, so that better estimates can be made in the future. Based on this work, it is recommended that policymakers’ guidelines include specific procedures for handling special materials, such as electronic waste, via appropriate recycling channels. Disaster response and recovery can be a chaotic time, and in the moment, proper collection and recycling of a small subset of waste such as electronics may seem trivial given the magnitude of response activities going on. For this very reason, disaster management plans for debris removal and other response activities should be generated during peace time, so that appropriate decisions can be made even during such a chaotic time. Every disaster is different, and in some cases the disaster management plans may not be carried out perfectly, but neglecting to include the debris category of electronic waste in these plans and literature limits the chances of its successful, safe recovery. One recommendation would be to build off current instructions and regulations that are present in these plans for white goods (such as refrigerators), which are similar in many ways to electronic waste. Although these two categories need to be collected and treated separately, the current practice for handling white goods could be used as a baseline for how electronic waste handling should be added to the literature. Both categories may contain hazardous materials and need to be collected separately, and therefore similar staging strategies and requirements could prove useful in developing the policy surrounding electronic waste collection after a disaster. As discussed earlier in this paper, the only quantitative success story found in the literature was seen after Hurricane Katrina, when a collaboration between businesses and government entities made the collection and recycling of electronics possible. On the other hand, after Hurricane Harvey, environmental legislation was relaxed, which may have contributed to less effective collection. Both cases can inform policy development going forward, to help ensure that the best decisions for long term sustainability are made regarding electronic waste after a disaster.


