Abstract
The Wenchuan earthquake, which happened in May 2008 in China, was one of the most destructive natural disasters of the past decade. The Chinese government implemented several aid programs, including the Paired Assistance to Disaster-Affected Areas (PADAA) program, to assist with disaster recovery. Although the Wenchuan earthquake has gained much scholarly attention, previous studies often adopted different recovery measures and provided fragmented empirical evidence on how an aid program may have influenced the recovery process in both the short and long term. To bridge the gap, this paper collects eight social, economic, and institutional indicators to measure four types of recovery processes, namely, economic recovery, social recovery, institutional recovery, and built environment recovery. The data, collected between 2002 and 2015, covers 269 earthquake-stricken counties. Based on this data, we constructed a set of disaster recovery indexes. We then evaluated the impacts of the PADAA program on the disaster recovery process across the 269 counties in both the short and long term. We concluded that the impact of the PADAA program on the post-disaster economic recovery was significant in both the short and long term, whereas its impact on the recovery of the institutional and built environment occurred in the short term. Its impact on post-disaster social recovery was inconclusive.
1. Introduction
The Wenchuan earthquake claimed more than 80,000 casualties and left about 4.8 million people homeless [1]. It affected a population of 29.8 million and an area of 440,000 square kilometers. The property damages were estimated to cost 120 billion USD [2]. The aid response was significant and unprecedented, with more than 146 billion USD (the exchange rate in 2008) pledged for relief and recovery. The post-disaster reconstruction effort aimed to create opportunities for the affected areas to be “reborn” (Speech at the Symposium on Post-disaster Reconstruction of Wenchuan Earthquake by Premier Mr. Wen Jiabao http://www.gov.cn/ldhd/2011-05/10/content_1860613.htm, accessed on 9 March 2018). The Paired Assistance to Disaster-Affected Areas (PADAA) program, which is the Chinese national counterpart aid (NCA) model, is an effective and efficient program for catastrophe recovery as compared with the other three types of models, namely, the central government oriented aid (CGA); the national non-governmental organizations aid (NNA), and the international humanitarian aid (IHA) [2,3]. The PADAA program matched 19 provinces or municipalities (assisting parties) in the developed eastern and central areas of China to the 24 disaster-affected areas (assisted parties) to build up the “one-pair-one” relationships. The assisting parties provided assistance in terms of financial, technical, and human resources to the assisted parties during the post-disaster recovery period. The policy was initiated as part of the Overall Planning for Post-Wenchuan Earthquake Restoration and Reconstruction Programme. Due to the data availability and consistency, this research chose 18 counties from the PADAA program and 25 counties that from the planning program that are not in the PADAA program. The details are listed in Appendix A. The PADAA program required an assisting party (province or city) to provide at least 1% of its previous year’s local budgetary revenue to the assisted party to support its recovery over a three-year period between 2008 and 2010 [3,4]. The overall planning set the three-year post-disaster recovery goal to surpass the original living standard and economic performance in the pre-disaster time as well as to lay a foundation for future sustainable socioeconomic development [3,4].
Disaster recovery is defined as the process of “restoring, rebuilding, and reshaping the physical, social, economic, and natural environment through pre-event planning and post-event actions” ([5], p. 234). In the literature, disaster recovery is viewed as either a redevelopment opportunity, such as the recovery of Santa Cruz after the 1989 Loma Prieta earthquake [6], or a process of integrating redevelopment and recovery goals [7]. Restoration to pre-disaster conditions or a new normality is often used as a benchmark for recovery, whereas the post-disaster recovery process is studied from the perspectives of economic recovery [8], social recovery [9], institutional recovery [10], and built environment recovery [11]. For example, the empirical literature has adopted changes in population [12,13], quality of life improvement [14], and improvements in public services, infrastructure, labor force, and employment [15]. Thus, in the literature, findings are fragmented. The short- and long-term impacts of the PADAA program on the whole post-disaster recovery process are not well-established.
To address this research gap, we adopted a holistic approach to determine how the PADAA program aided the recovery from the Wenchuan earthquake. Being different from the literature, our approach incorporated three components. First, we adopted an index-based methodology [16,17] and constructed the indexes from four perspectives: economics, society, institution, and built environment. Second, we used two recovery benchmarks in the analysis: (1) the time taken to return to pre-disaster conditions and (2) the attainment of would-be conditions as if the disaster had not occurred [12,13]. Third, we identified four comparable geographical area groups in the Wenchuan earthquake region: (1) non-damaged counties (Non_Damaged); (2) damaged counties which did not receive any government reconstruction plan (Non_Planned); (3) damaged counties which received some form of the government reconstruction plan but were not assisted by the PADAA program (Planned); and (4) damaged counties which were assisted by some form of the government reconstruction plan and were also assisted by the PADAA program (Planned_PADAA). It is noted that the earthquake damage in the fourth group was the gravest (Table A1 of Appendix A). This identification allowed us to conduct a comparative analysis to analyze the impacts of the PADAA program on the post-Wenchuan earthquake recovery.
The paper is structured as follows. Section 2 reviews the literature related to disaster recovery and the Wenchuan earthquake recovery. A literature gap is identified. Section 3 introduces the data collection methods and research design. Section 4 presents the results. Section 5 concludes the study.
2. Literature Review
2.1. Disaster Recovery Literature
Disaster recovery, as part of the disaster cycle, has received little investigation and is poorly understood [5,11,15,18]. There are four streams of literature in this aspect: (1) the time frame of disaster recovery; (2) the perspectives of studying disaster recovery; (3) the factors influencing disaster recovery; and (4) the measurements of disaster recovery. The classic study carried out by Haas et al. of four American cities focused on the recovery of housing and jobs after a disaster [19]. They assumed that disaster recovery consists of four overlapping periods: the emergency period; the restoration period; the replacement and reconstruction period; and the commemorative, betterment, and developmental reconstruction period [19]. Alternatively, the recovery period is differentiated by short-term recovery, intermediate recovery, and long-term recovery [20]. The short-term recovery period is often the emergency period and the early stages of the replacement and reconstruction period. It is measured in days. The intermediate recovery period is measured in weeks or months, representing the replacement, betterment, and developmental reconstruction period. The long-term recovery period may last months or years and encompasses the entire reconstruction and rehabilitation period [20].
The second stream of literature pinpoints the perspectives of studying disaster recovery, including economic recovery [8], social recovery [9], institutional recovery [10], and built environment recovery [11]. The definition of recovery is the return of all systems, both formal and informal, to as normal a state as possible. The economic and social perspectives are the two most important perspectives in studying disaster recovery. Some scholars argue that besides bringing a community back to its pre-disaster condition [20,21,22,23], disaster recovery can be seen as an opportunity to improve the pre-disaster living conditions [22,23,24,25].
The third stream of the literature addresses the factors influencing recovery [8,26,27,28,29]. Some fundamental factors are external aids or assistance [2,30], disaster damage [30], and social capital functions as the main engines of long-term recovery [27,28,29]. Additional factors are pre-disaster and post-disaster planning and socio-economic status, the impacts and disruptions of post-disaster responses and efforts, and macro- and microeconomic programs and public policies [31,32]. However, the long-term outcomes of external assistance in disaster recovery are still unclear.
Finally, it is important to adopt accurate measurements when studying disaster recovery [12,13,26]. Existing databases mainly collect information on immediate disaster-related losses and the information from one-time surveys or focus group investigations [12]. Indicators related to disaster recovery processes are not systematically recorded. As a consequence, we do not have a good understanding of disaster recovery processes and recovery outcomes, especially over the long term [12]. However, the time series of social economic indicators in disaster-stricken regions provide reliable sources to quantify the changes before and after a disaster. These indicators allow us to undertake meaningful comparisons by filtering out the exogenous influences and to elaborate on the overall post-disaster recovery. Two benchmarks are suggested to measure disaster recovery outcomes: (1) the time taken to return to the pre-disaster conditions and (2) the attainment of would-be conditions as if the disaster had not occurred [12].
In summary, the literature suggests that the study of the post-disaster recovery process requires a holistic approach to incorporate four elements into a framework. They are the time frame of recovery; the four perspectives—social, economic, institutional and built environment recovery; the factors influencing disaster recovery; and the accurate measurement of recovery processes and recovery benchmarks. This framework guided us to develop our research design in this paper.
2.2. China Disaster Recovery Literature
The PADAA program involves aid being offered by an assisting party to an assisted party. This can occur between geographical regions or other recipient unit types, and it is implemented through the coordination of the different levels of administrative governments and related organizations [3]. The program, which originated from the China civil war, started in 1945 and was gradually developed into different forms of cooperation mechanisms to provide aid to crisis-stricken regions, reflecting the values of the China Communist Party (CCP), that is, “one in trouble, all to help” [3]. In a PADAA program, the central government manages the allocation of resources with an attempt to promote inter-regional (local) political competition to fulfill the tasks of post-disaster reconstruction goals and to achieve sustainable development in disaster-stricken regions [3,4,33]. Although the PADAA program is more effective than non-governmental organizations or international humanitarian agencies at providing assistance to disaster-stricken regions, there are flaws in the design and implementation of the PADAA program [3]. However, in the literature, the evaluation of the PADAA program is piecemeal and incomplete.
Together with other types of aid programs, the PADAA program was implemented in the counties which were badly affected by the Wenchuan earthquake. The literature related to the Wenchuan earthquake has typically focused on the short-term emergency management period [2,3]; the post-disaster recovery plans and reconstruction [31,34]; and the disaster recovery outcomes in the long term [33] such as the livelihood recovery [33], the vegetation recovery [35], and the business recovery [36]. Research on the post-disaster recovery in the long term, especially in regard to the impact of the PADAA program on the overall post-disaster recovery over both the short and long term, is not well established.
The present paper contributes to the literature by addressing the gaps identified above. We investigated the impacts of the PADAA program on post-Wenchuan earthquake recovery over both the short and long term. We hypothesized that the PADAA program could help to decrease the time of recovery; however, its impact on post-disaster recovery could be sensitive to the social and economic indicators chosen to measure the recovery process.
3. Data Collection and Research Design
3.1. Data Collection
We collected eight time series variables for each of the 269 counties affected by the Wenchuan earthquake between 2002 and 2015 covering both before and after the earthquake periods. The 269 counties are located in Sichuan, Gansu, and Shanxi provinces, and a map of the study area is attached in Figure 1. The data were sourced from the China County Statistical Yearbooks and the WIND database (The website of the database is http://www.wind.com.cn/en/data.html). All monetary prices in Table 1 are deflated to the year 2002 price and are presented in USD. These indicators were used to construct recovery indexes.
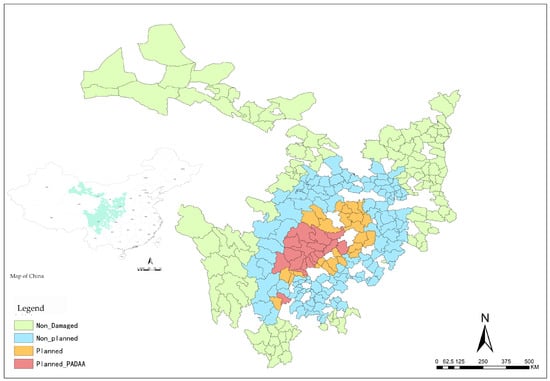
Figure 1.
The distribution of the 269 counties in the Wenchuan earthquake-stricken region. Note: The four groups of the counties in Figure 1 are defined in Section 3.2.1.

Table 1.
Variable definitions.
Out of the eight variables, the real GDP (“GDP”) and real industrial outputs from the enterprises above the designated size (“Output_Enterprise”) were chosen to measure economic recovery at the county level. School children (“Secondary_Sch”, “Primary_Sch”) and population (“Population”) were chosen to measure social recovery at the county level. Local budgetary revenue (“Pub_Revenue”) and fixed asset investment (“Fixed_Asset”) were chosen to measure institutional recovery at the county level. The number of hospital beds (“Hospital_Bed”) was chosen to measure the built environment at the county level.
3.2. Research Design
To answer the question of how the PADAA program aided in the recovery from the Wenchuan earthquake, our research design incorporated three components. First, we identified four county groups that were stricken by the Wenchuan earthquake based on the severity of damage and whether they received government aid packages. Second, we adopted an index-based methodology to construct the recovery indexes from four perspectives: economics, society, institution, and built environment [16,17]. Third, we used two benchmarks to measure the recovery outcomes. The first benchmark referred to the time taken for a county to return to its pre-disaster conditions. The second benchmark referred to whether a county attained the would-be conditions as if the disaster had not occurred [12,13]. We used the K-nearest matching method to design a comparative study in order to analyze the recovery process [37].
3.2.1. Grouping the Counties
The 269 counties were divided into four groups. The first group contained counties with no earthquake damage, which thus received no government aid (“Non_Damaged”); the second group contained those with mild damage which received no government aid (“Non_Planned”); the third group contained those with severe damage which received government aid through some form of government reconstruction plan (“Planned”); and the fourth group of the counties had the most severe damages and received aid through both some form of government reconstruction plan and the PADAA program (“Planned_PADAA”) (Figure 1). A summary of the statistics is given in Table 2. The details are listed in Table A1 of Appendix A.
Table 2.
Summary of the statistics.
Table 2 illustrates the average development levels in 2008, when the earthquake happened, and the average post-disaster annual growth rate per county in each group between 2008 and 2015 for the eight indicators. Out of the 269 counties, the earthquake damage of those in the fourth group (“Planned_PADAA”), consisting of 18 counties, was the worst. Thus, they received PADAA aid. The average annual growth rates of the real GDP and the industrial output (“GDP”; “Output_Enterprise”) show that the average post-disaster annual growth rate was higher in the fourth group than in the other groups which were either not damaged or were damaged but did not receive PADAA aid. In terms of social recovery, the population size and the number of school children had negative post-disaster annual growth rates, but the fourth group performed the best in this regard. In terms of institutional recovery, the fourth group obtained a higher annual growth rate than the other groups for public budgetary revenue (“Pub_Revenue”), but a slightly lower annual growth rate for fixed assets. In terms of the built environment recovery, as measured by the number of hospital beds (“Hospital_Bed”), the fourth group (“Planned_PADAA”) experienced a relatively high annual growth rate as compared to the other groups. Overall, these figures imply that the PADAA program may have played a positive role in economic recovery.
3.2.2. Constructing Recovery Indexes
To measure the impact of the PADAA program on post-disaster recovery, we constructed four index series for each county. We used the construction of an economic recovery index series between 2002 and 2015 as an example to illustrate the method. The economic performance of a county is indicated by two variables: “GDP” and “Output_Enterprise”. For the “GDP” variable, we took the mean GDP of 2006 and 2007 as a base value. Then, the ratio of the “GDP” of each year to the mean was used as the GDP index number for the year. The same procedure was applied to the “Output_Enterprise” variable to obtain the “Output_Enterprise” index number. The economic recovery index series for each county between 2002 and 2015 was then constructed by taking the average of two index numbers for each year. The social recovery was measured by three variables: “Population”, “Primary_Sch”, and “Secondary_Sch”. We applied the same procedure to these three variables to derive the social recovery index series of a county between 2002 and 2015. The institutional recovery was indicated by two variables: “Fixed_Asset” and “Pub_Revenue”. The built environment was assessed as the number of hospital beds. Both index series were constructed in the same way.
For each group, as defined in Section 3.2.1, the group recovery index series was simply the average of all counties’ indexes in a group. With this definition of the indexes, if a post-disaster index number from a recovery index series (e.g., the economic recovery index series) is greater than one, this indicates that the county (or the counties in a group) has returned to its pre-disaster level from the perspective of economic recovery.
3.2.3. Designing the Comparative Analysis Framework
The comparative analysis framework adopted two alternative benchmarks to study the disaster recovery process. The first benchmark referred to the time taken for a county to return to its pre-disaster conditions. For the recovery index series, an index number of a year after 2008 greater than 1 indicated that the county returned to its pre-disaster level in that year. Therefore, we calculated the years taken for each county to first return to their pre-disaster level using the economic, institutional, and built environment recovery indexes. It is noted that the social recovery indexes were constructed by the number of school children and population. During the investigation period (between 2008 and 2015), the number of school children and population did not return to pre-disaster levels. Thus, the time taken to return to the pre-disaster level from the perspective of social recovery was more than seven years. We compared the calculated time periods for the four county groups, which aided us in justifying the impacts of the PADAA program on post-disaster recovery.
The second benchmark referred to whether a county had attained the would-be conditions as if the disaster had not occurred. The comparative analysis involved four steps. In the first step, for each earthquake damaged county, we selected 10 matched undamaged counties from the first group (“Non_Damaged” group) using the K-nearest matching method. For ease of explanation, we called the damaged county County_A; these counties were from the “Non_Planned”, “Planned”, and “Planned_PADAA” groups. The 10 similar undamaged counties were named County_B; these counties were selected from the “Non_Damaged” group. The “GDP” and “Population” were taken as the reference units for the selection. The mean values from 2006 and 2007 were used as the reference years. The K-Nearest Neighbor Algorithm [34] was used to calculate the distances between County_A and County_B against the two reference units. The average distance between County_A and County_B was used as the selection method. The selection rule was that from the first group (“Non_Damaged”), the 10 Non_Damaged counties (County_B) with the shortest distances to County_A were selected as the matching counties to County_A.
In the second step, we averaged the index numbers of the 10 matching counties for each disaster recovery index series for each year between 2002 and 2015. The derived recovery index series for the 10 matching counties was used as the reference recovery index series for County_A. It provided a proxy for the would-be conditions in a post-disaster year if County_A had not been stricken by the earthquake.
In the third step, we calculated the percentage differences of the index numbers between County_A and its 10 matching counties for each year and for each type of recovery index series (economic recovery indexes, social recovery indexes, institutional recovery indexes, and built environment recovery indexes).
In the fourth step, we averaged the percentages of all counties in each of the three damaged groups (the “Non_Planned”, “Planned”, and “Planned_PADAA” groups) in each year separately. These allowed us to compare the post-disaster recovery processes of the three groups across the years when the second recovery benchmark was used. It is worth noting that the use of a cross-group comparison at each time point was not appropriate to justify the role of the PADAA program because the counties in the different groups experienced different degrees of damage. Thus, our comparative analysis focused on the dynamic changes. The above design allowed us to track the dynamics of the comparative post-disaster recovery processes of the three groups across years. We justified the effectiveness of the PADAA program in aiding post-disaster recovery based on these comparative analyses.
4. Data Analysis and Empirical Findings
In this section, we first report the findings using the first benchmark, followed by those using the second benchmark.
4.1. Research Findings: Returning to Pre-Disaster Conditions
We applied the research design that was detailed in Section 3.2.3 to the four recovery indexes by group. The time taken for each county to return to its pre-disaster level was calculated and is presented in Table 3.
Table 3.
Time taken to return to pre-disaster conditions by group (years).
Table 3 shows that, from the perspectives of economics, institution, and built environment, the counties in the “Planned_PADAA” group, which were the most severely damaged counties and received the aid from the PADAA program, generally took longer to return to their pre-disaster level than other groups. Moreover, as the post-disaster population decreased sharply, the social recovery required a longer time to recover than was measured in the study, and it is possible that it may not be able to return to its pre-disaster condition. Although the PADAA program is expected to have played a positive role in post-disaster recovery, the counties receiving the PADAA aid were also badly damaged by the earthquake. Thus, it is not surprising that they took longer to return to their pre-disaster levels. Without the aid from the PADAA, they might have taken even longer to recover.
4.2. Research Findings: Achieving Would-Be Conditions as If the Disaster Had Not Occurred
We applied the research design of the second recovery benchmark to the data. The results are presented in Figure 2, Figure 3, Figure 4 and Figure 5. The length of the bars in each figure indicates the gaps between the condition (the level of development) of a damaged county (indicated by its recovery indexes) and its would-be conditions as if the disaster had not occurred (indicated by its matching counties’ recovery indexes). A negative value in a particular year means that the counties in that group failed to achieve their would-be conditions.
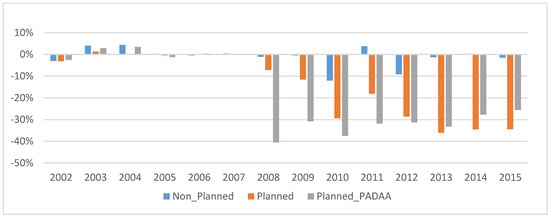
Figure 2.
Economic Recovery by Groups. Notes: Economic recovery was measured in RMB Yuan to decrease the influence of the exchange rate on the research results. The length of a bar indicates the gap between the conditions (the level of development) of a damaged county (indicated by its recovery indexes) to its would-be conditions as if the disaster had not occurred (indicated by its matching county’s recovery indexes). A negative value in a particular year means that the counties in that group failed to achieve their would-be conditions. This is applicable to Figure 2, Figure 3, Figure 4 and Figure 5.
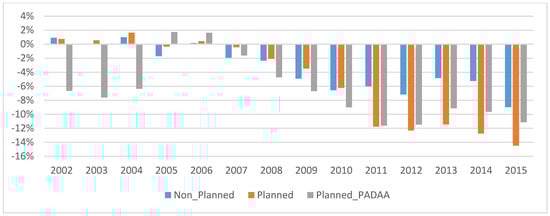
Figure 3.
Social Recovery by Groups.
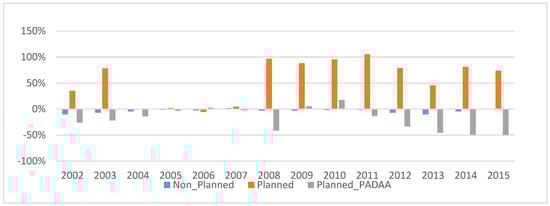
Figure 4.
Institutional Recovery by Groups. Notes: Economic recovery and institutional recovery were measured in RMB Yuan to decrease the influence of the exchange rate on the research results.
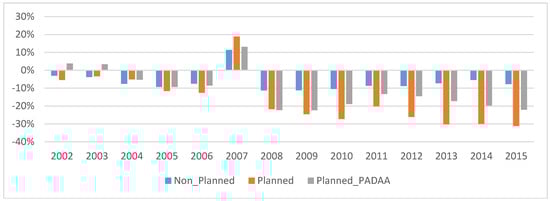
Figure 5.
Built Environment Recovery by Groups.
Figure 2 presents the comparative results of the counties in each of the three earthquake damaged groups (“Non_Planned”, “Planned”, and “Planned_PADAA”) as compared with their matching non-damaged counties from the perspective of economic recovery. Before the disaster year of 2008, the economic gaps between the damaged counties and the matching non-damaged counties were minimal. In the post-disaster years, the gaps were much bigger. The counties in the three earthquake damaged groups did not catch up with the economic performances of their matching counties. This means the disaster recovery did not achieve the would-be economic condition as if the disaster had not happened, even at seven years post-disaster. However, when we tracked the dynamic pattern of economic recovery, we found a slightly upward trend of economic recovery between 2008 and 2015 (the length of the grey color bar representing the group of “Planned_PADAA” became shorter over time) for the counties that received aid from the PADAA program, whereas a downward trend of economic recovery (the length of the orange color bar representing the group of “Planned” became longer over time) occurred for the counties that were less seriously damaged and did not receive the aid from the PADAA program. In the first three years after the disaster, the upward trend (“Planned_PADAA” group) and the downward trend (“Planned” group) of economic recovery were more obvious. Because the PADAA program was only implemented in the first three years after the disaster, the observed dynamic patterns justify the conclusion that the PADAA program sped up the post-disaster economic recovery over both the short and long term.
Figure 3 presents the comparative results of the counties in each of the three earthquake damaged groups (“Non_Planned”, “Planned”, and “Planned_PADAA”) as compared with their matching non-damaged counties from the perspective of social recovery. We failed to observe an impact of the PADAA program on the social recovery in the short term. This is despite the fact that the PADAA program took effect within the first three years. However, we observed that the counties in this group performed better in the long term than the other groups. The impact of the PADAA on affected counties in social recovery is still inconclusive, compared with the economic recovery.
Figure 4 presents the comparative results of the counties in each of the three earthquake damaged groups (“Non_Planned”, “Planned”, and “Planned_PADAA”) as compared with their matching non-damaged counties from the perspective of institutional recovery. Within the first three years after the disaster, the institutional recovery among the counties in the “Planned_PADAA” group (grey color bars) was much faster than that of the counties in the “Planned” group (orange color bars). This is despite the fact that the counties in the “Planned” group demonstrated positive changes, indicating that their institutional performance was better than their matching non-damaged counties. However, after the first three years, a downward trend in institutional recovery was observed for the counties in the “Planned_PADAA” group. Because the PADAA program was only implemented in the first three years after the disaster, the observed dynamic patterns justify the conclusion that the PADAA sped up the post-disaster institutional recovery in the short term only.
Figure 5 presents the comparative results of the counties in each of the three earthquake damaged groups (“Non_Planned”, “Planned”, and “Planned_PADAA”) as compared with their matching non-damaged counties from the perspective of built environment recovery. Before the disaster year (2008), the gaps between the damaged counties and the non-damaged counties were much smaller. In the post-disaster years, the gaps were much bigger. Within the first three years after the disaster, the built environment recovery among the counties in the “Planned_PADAA” group (grey color bars) was much faster than that of the counties in the “Planned” group (orange color bars). However, after the first three years, a downward trend in built environment recovery was observed. Because the PADAA program was only implemented in the first three years after the disaster, the observed dynamic patterns justify the conclusion that the PADAA program sped up the post-disaster built environment recovery in the short term.
In summary, by using “achieving would-be conditions as if the disaster had not occurred” as a disaster recovery benchmark, we justified the conclusion that the PADAA program played a positive role in speeding up the economic recovery over both the short and long term. Its impact on the recovery of the institutional and built environments was limited to the short term only, whereas its impact on social recovery was inconclusive.
5. Conclusions
The PADAA program offers advantages in helping disaster-affected areas to recover at faster rates, but the resilience of the program is questionable, especially because the large-scale investments required in the assisted areas may not be sustainable [2,3,4].
This research concludes that the PADAA program successfully stimulated the economic recovery of the damaged counties after the Wenchuan earthquake over both the short and long term. It also aided in the recovery of the institutional and built environments in the short term. However, its impact on social recovery was inconclusive. We suspect that the population number may not be an appropriate measure for social recovery. This calls for further study. The current study focused on the Wenchuan earthquake only; thus, the data are of limited quality. Future studies will attempt to assess the Qinghai Yushu earthquake in China as well as covering other assistance schemes implemented by the Chinese government. As the PADAA program has been commonly adopted by the Chinese government for a few decades with notable achievements, it is important to comprehensively study the effectiveness of the program as well as to investigate potential improvements to the program’s design and implementation. In addition, the identification of adaptive capacity and the means of building the adaptive capacity may need to be further explored to improve the PADAA program. Finally, we found that, methodologically, the benchmark based on whether a county has attained its would-be conditions as if the disaster had not occurred is a more appropriate benchmark that the commonly used benchmark of the time taken for a county to return to its pre-disaster conditions in assessing post-disaster aid programs.
In conclusion, we propose three suggestions. First, the PADAA program has its limitations, and a large-scale financial assistance program is often not sustainable, The PADAA program implemented in the Wenchuan earthquake was coupled with a financial aid package of 4000 billion RMB to cope with the financial crisis in 2008 (A financial stimulus policy of 4000 billion RMB was released in China to cope with the 2008 financial crisis. http://finance.sina.com.cn/g/20081109/19215484791.shtml, accessed on 5 January 2018). It was embedded in a layered and nested top-down regime to ensure that recovery tasks could be completed in such a manner that the assisting provinces with more resources could help the assisted counties where fewer resources could be mobilized to achieve a balanced distribution of responsibility [34]. It is commented that local involvements are typically less innovative in assisting post-disaster recovery [31,34]. Thus, it is necessary to decentralize the decision-making power to the local level in order to respond to local needs efficiently and to enhance the local post-disaster rescue apacity. This explains why the post-disaster reconstructions in Yushu, Lushan, and the recent Jiu Zhaigou adopted a decentralized approach, with the theme of “guiding by the central government, decision-making by the local government, participating by the civil society” (“Guiding by the central government, decision-making by the local government, participating by the civil society”(Zhongyang tongchou zhidao, defang zuowei zhuti, zhaiqu qunzhong guangfan canyu, it was the new strategy adopted in the Lushan post-disaster reconstruction, and the Jiu Zhaigou post-disaster reconstruction also followed this strategy http://www.sc.gov.cn/10462/wza2012/zxft/20130725/20150923yas.shtml, and http://www.sc.xinhuanet.com/content/2018-03/15/c_1122539133.htm, accessed on 16 March 2018). The post-disaster reconstructions in Ya’an and Jiu Zhaigou also adopted a decentralized approach, mainly from intra-provincial assistance.
Second, besides using the top-down regime to ensure efficiency, a bottom-up management style is also necessary. Enhancing the local adaptive capacity to cope with disaster and reducing the reliance on external assistance call for policy innovations. It is suggested that a disaster recovery policy design take a customized approach. More work needs to be done on how to improve local governments’ capabilities to cope with disaster, for example, the institutions related to disaster management being established in a local regime. To cope with disasters, this should be done in a preparedness manner.
Finally, international experiences (for example, India and Japan) regarding disaster recovery provide evidence on how to manage social resources and social capital to build post-disaster resilience [27]. Top-down recovery regimes are often criticized as being ambitious and flawed as “the existing recovery and mitigation plans for recovery at best ignore and at worst harm existing stocks of social capital” ([27], p. 151). With the increasing importance of social resources in a post-disaster recovery, we call for policy innovation to enhance social capital both before and after disasters. We need to reinvestigate the roles of state institutions and the market. Through the early studies, support from informal personal social networks was one of the most significant factors of improving recoveries and emotional recovery is related to other qualities after disasters [38,39,40]. We need to shift attention to the building of social resources in a localized manner. Chinese experiences show that large-scale external assistance may be effective in aiding high density areas which have experienced a devastating catastrophe to reduce the time taken for people to get back to their normal lives. In addition, strengthening the social capital between communities is also important.
Author Contributions
Conceptualization, methodology, validation, formal analysis, investigation, resources, data curation, writing—original draft preparation by F.Y.; Review and editing, Y.T.; Supervision, Y.T.
Funding
This research received no external funding
Acknowledgments
The authors would like to express their appreciation for the comments and suggestions received from Tom Christensen, Praveen Maghelal, Xiangyu Li, Yanjiang Zhang and two anonymous reviewers.
Conflicts of Interest
The authors declare no conflict of interest.
Appendix A
Table A1.
The four county groups.
Table A1.
The four county groups.
| Categories | No. of Counties | List of Names |
|---|---|---|
| Non_Damaged | 114 | Gaoling, Hancheng, Huayin, Yijun, Jingyang, Xunyi, Chunhua, Tongguan, Dali, Heyang, Chengcheng, Pucheng, Baishui, Fuping, Yanchang, Yanchuan, Zichang, Ansai, Zhidan, Wuqi, Ganquan, Fu, Luochuan, Yichuan, Huanglong, Huangling, Shenmu, Fugu, Hengshan, Jingbian, Dingbian, Suide, Mizhi, Jia, Wubao, Qingjian, Zizhou, Langao, Pingli, Zhenping, Xunyang, Baihe, Luonan, Danfeng, Shangnan, Shanyang, Zhenan, Zuoshui, Yumen, Dunhuang, Linxia, Hezuo, Yongdeng, Gaolan, Yuzhong, Yongchang, Jingyuan, Jingtai, Minqin, Gulang, Sunanyuguzu, Minle, Linze, Gaotai, Shandan, Jinta, Subeimengguzu, Akesai, Huan, Huachi, Heshui, Zhengning, Linxia, Yongjing, Guanghe, Hezheng, Dongxiangzu, Jishishan, Maqu, Xiahe, Dachuan, Xichang, Miyi, Yanbian, Hejiang, Xuyong, Jiangan, Changning, Yunlian, Xingwen, Rangtang, Yajiang, Luhuo, Ganzi, Xinlong, Dege, Baiyu, Shiqu, Seda, Litang, Batang, Xiangcheng, Daocheng, Derong, Yanyuan, Dechang, Huili, Huidong, Ningnan, Puge, Butuo, Jinyang, Zhaojue, Xide |
| Non_Planned | 112 | Xingping, Fengxiang, Qishan, Fufeng, Mei, Long, Qianyang, Linyou, Feng, Taibai, Gan, Liquan, Yongshou, Bin, Changwu, Wugong, Nanzheng, Chenggu, Yang, Xixiang, Zhenba, Liuba, Foping, Hanyin, Shiquan, Ningshan, Ziyang, Huining, Qingshui, Qinan, Gangu, Wushan, Jingchuan, Lingtai, Chongxin, Huating, Zhuanglang, Jingning, Ning, Zhenyuan, Tongwei, Longxi, Weiyuan, Lintao, Zhang, Min, Dangchang, Li, Kangle, Lintan, Zhuoni, Diebu, Luqu, Pengshan, Mingshan, Qionglai, Emeishan, Huaying, Wanyuan, Jianyang, Kangding, Pujiang, Xinjin, Rong, Fushun, Lu, Pengxi, Shehong, Daying, Weiyuan, Zizhong, Longchang, Jianwei, Jingyan, Jiajiang, Muchuan, Ebianyizu, Mabianyizu, Nanbu, Yingshan, Yilong, Xichong, Renshou, Hongya, Danleng, Qingshen, Yibin, Gao, Pingshan, Yuechi, Wusheng, Linshui, Xuanhan, Kaijiang, Dazhu, Qu, Yingjing, Tianquan, Tongjiang, Pingchang, Anyue, Lezhi, Jinchuan, Maerkang, Aba, Ruoergai, Hongyuan, Luding, Danba, Jiulong, Daofu, Mianning |
| Planned | 25 | Mian, Ningqiang, Lveyang, Cheng, Wen, Kang, Xihe, Hui, Liangdang, Zhouqu, Guanghan, Langzhong, Dayi, Zhongjiang, Luojiang, Santai, Yanting, Zitong, Wangcang, Cangxi, Shimian, Lushan, Baoxing, Nanjiang, Jiuzhaigou |
| Planned_PADAA | 18 | Dujiangyan, Pengzhou, Chongzhou, Shifang, Mianzhu, Jiangyou, An, Beichuan, Pingwu, Qingchuan, Jiange, Hanyuan, Wenchuan, Li, Mao, Songpan, Xiaojin, Heishui |
Notes: Data were sourced from the National Bureau of Statistics of China (2008), the State Council of the PRC (2008), and the Xinhua News Agency (10 May 2011).
References
- Hubbard, J.; John, H.S.; Klinger, Y. Structural Setting of the 2008 Mw 7.9 Wenchuan, China, Earthquake. Bull. Seismol. Soc. Am. 2010, 100, 2713–2735. [Google Scholar] [CrossRef]
- Xu, J.P.; Lu, Y. A comparative study on the national counterpart aid model for postdisaster recovery and reconstruction: 2008 Wenchuan earthquake as a case. Disaster Prev. Manag. Int. J. 2013, 22, 75–93. [Google Scholar] [CrossRef]
- Zhong, K.B.; Lu, X.L. Exploring the Administrative Mechanism of China’s Paired Assistance to Disaster Affected Areas Programme. Disasters 2018, 42, 590–612. [Google Scholar] [CrossRef] [PubMed]
- Xie, W.; Rose, A.; Li, S.; He, J.; Ali, T. Dynamic Economic Resilience and Economic Recovery from Disasters: A Quantitative Assessment. Risk Anal. 2018, 38, 1306–1318. [Google Scholar] [CrossRef] [PubMed]
- Smith, G.P.; Wenger, D. Sustainable disaster recovery: Operationalizing an existing agenda. In Handbook of Disaster Research; Rodriguez, H., Quarantelli, E.L., Dynes, R.R., Eds.; Springer: New York, NY, USA, 2007; pp. 234–257. [Google Scholar]
- Arnold, C. Earthquake as Opportunity: The reconstruction of Pacific Garden Mall, Santa Cruz After the Loma Prieta Earthquake of 1989. In Lessons Learned Over Time: Learning form Earthquake Series; EERI: Oakland, CA, USA, 1999; Volume 1. [Google Scholar]
- Pantelić, J. The link between reconstruction and development. Land Use Policy 1991, 8, 343–347. [Google Scholar] [CrossRef]
- Chang, S.; Rose, A. Towards a Theory of Economic Recovery from Disasters. Int. J. Mass Emerg. Disasters 2012, 30, 171–181. [Google Scholar]
- Tierney, K.; Oliver-Smith, A. Social dimensions of disaster recovery. Int. J. Mass Emerg. Disasters 2012, 30, 123–146. [Google Scholar]
- Smith, G.; Birkland, T. Building a Theory of Recovery: Institutional Dimensions. Int. J. Mass Emerg. Disasters 2012, 30, 147–170. [Google Scholar]
- Alesch, D.J.; Siembieda, W. The Role of the Built Environment in the Recovery of Cities and Communities from Extreme Events. Int. J. Mass Emerg. Disasters 2012, 30, 197–211. [Google Scholar]
- Chang, S.E. ‘Urban disaster recovery: A measurement framework and its application to the 1995 Kobe earthquake’. Disasters 2010, 34, 303–327. [Google Scholar] [CrossRef]
- Cheng, S.; Ganapati, E.; Ganapati, S. Measuring disaster recovery: Bouncing back or reaching the counterfactual state? Disaster 2015, 39, 427–446. [Google Scholar] [CrossRef] [PubMed]
- Loukaitou-Sideris, A.; Kamel, N.M. Residential Recovery from the Northridge Earthquake: An Evaluation of Federal Assistance Programs; Policy Research Program, California Policy Research Center: Tustin, CA, USA, 2004. [Google Scholar]
- Liu, A.; Fellowes, M.; Mabanta, M. Special Edition of the Katrina Index: A One Year Review of Key Indicators of Recovery in Post-Storm New Orleans; Brookings Institution: Washington, DC, USA, 2006. [Google Scholar]
- Kantamaneni, K. Counting the cost of coastal vulnerability. Ocean Coast. Manag. 2016, 132, 155–169. [Google Scholar] [CrossRef]
- Kantamaneni, K. Coastal infrastructure vulnerability: An integrated assessment model. Nat. Hazards 2016, 84, 139–154. [Google Scholar] [CrossRef]
- Rubin, C.B. Recovery from disaster’. In Emergency Management: Principles and Practice for Local Government; Drabek, T.E., Hoetmer, G.J., Eds.; International City Management Association: Washington, DC, USA, 1991; pp. 224–262. [Google Scholar]
- Haas, J.E.; Kates, R.W.; Bowden, M.J. Reconstruction Following Disaster; MIT Press: Cambridge, MA, USA, 1997. [Google Scholar]
- FEMA. National Disaster Recovery Framework: Strengthening Disaster Recovery for the Nation. 2011. Available online: https://www.fema.gov/pdf/recoveryframework/ndrf.pdf (accessed on 1 August 2018).
- Blaikie, P.; Cannon, T.; Davis, I.; Wisner, B. At Risk: Natural Hazards, People’s Vulnerability, and Disasters; Routledge: New York, NY, USA, 1994. [Google Scholar]
- Enarson, E.; Morrow, B.H. (Eds.) The Gendered Terrain of Disaster: Through Women’s Eyes; Praeger Publishers: Westport, CT, USA, 1998. [Google Scholar]
- Hewitt, K. Regions of Risk: A Geographical Introduction to Disasters; Addison Wesley Longman Limited: London, UK, 1997. [Google Scholar]
- Mileti, D.S. Disasters by Design: A Reassessment of Natural Hazards in the United States; Joseph Henry Press: Washington, DC, USA, 1999. [Google Scholar]
- Godshalk, D.R. Disaster Mitigation and Hazard Management. In Emergency Management: Principles and Practice for Local Government; Drabek, T.E., Hoetmer, G.J., Eds.; International City Management Association: Washington, DC, USA, 1991; pp. 131–160. [Google Scholar]
- Olshansky, R.B.; Etienne, H.F. Setting the Stage for Long-Term Recovery in Haiti. Earthq. Spectra 2011, 27, 463–486. [Google Scholar] [CrossRef]
- Aldrich, D.P. Building Resilience: Social Capital in Post-Disaster Recovery; University of Chicago Press: Chicago, IL, USA, 2012. [Google Scholar]
- Aldrich, D.P. It’s who you know: Factors driving recovery from Japan 11 March 2011 disaster. Public Adm. 2015, 94, 399–413. [Google Scholar] [CrossRef]
- Aldrich, D.P.; Sawada, Y. The physical and social determinants of mortality in the 3.11 tsunami. Soc. Sci. Med. 2015, 124, 66–75. [Google Scholar] [CrossRef] [PubMed]
- Reddy, S.D. Factors influencing the incorporation of hazard mitigation during recovery from disaster. Nat. Hazards 2000, 22, 185–201. [Google Scholar] [CrossRef]
- Song, Y.; Li, C.; Olshansky, R.; Zhang, Y.; Xiao, Y. Are we planning for sustainable disaster recovery? Evaluating recovery plans after the Wenchuan earthquake. J. Environ. Plan. Manag. 2017, 60, 2192–2216. [Google Scholar] [CrossRef]
- Green, R.; Bates, L.K.; Smyth, A. Impediments to recovery in New Orleans’ Upper and Lower Ninth Ward: One year after Hurricane Katrina. Disasters 2007, 31, 311–335. [Google Scholar] [CrossRef]
- Han, Z. From Vulnerability to Resilience: Long-Term Livelihood Recovery in Rural China after the 2008 Wenchuan Earthquake. Ph.D. Thesis, University of Delaware, Newark, DE, USA, 2014. [Google Scholar]
- Shao, Y.; Xu, J. Regulating post-disaster reconstruction planning in China: Towards a resilience-based approach? Asian Geogr. 2017, 34, 71–89. [Google Scholar] [CrossRef]
- Liu, Y.; Liu, R.; Ge, Q. Evaluating the vegetation destruction and recovery of Wenchuan earthquake using MODIS data. Nat. Hazards 2010, 54, 851. [Google Scholar] [CrossRef]
- Huang, L.; Wang, L.; Song, J. Post-Disaster Business Recovery and Sustainable Development: A Study of 2008 Wenchuan Earthquake. Sustainability 2018, 10, 651. [Google Scholar] [CrossRef]
- Larose, D.T. Discovering Knowledge in Data: An Introduction to Data Mining; John Wiley & Sons: Hoboken, NJ, USA, 2014; pp. 90–106. [Google Scholar]
- Bolin, R. Long-Term Family Recovery from Disaster; University of Colorado: Boulder, CO, USA, 1982. [Google Scholar]
- Bolin, R.C.; Bolton, P. Recovery in Nicaragua and the USA. Int. J. Mass Emerg. Disasters 1983, 1, 124–144. [Google Scholar]
- Bolin, R.C.; Bolton, P.A. Race, Religion and Ethnicity in Disaster Recover; University of Colorado: Boulder, CO, USA, 1986. [Google Scholar]
© 2018 by the authors. Licensee MDPI, Basel, Switzerland. This article is an open access article distributed under the terms and conditions of the Creative Commons Attribution (CC BY) license (http://creativecommons.org/licenses/by/4.0/).