Article

Decoupling and Driving Factors of Economic Growth and Groundwater Consumption in the Coastal Areas of the Yellow Sea and the Bohai Sea

1
State Key Laboratory of Hydrology-Water Resources and Hydraulic Engineering, Hohai University, Nanjing 210098, China
2
Institute of Management Science, Hohai University, Nanjing 210098, China
*
Author to whom correspondence should be addressed.
Sustainability 2018, 10(11), 4158; https://doi.org/10.3390/su10114158
Submission received: 29 September 2018 / Revised: 4 November 2018 / Accepted: 4 November 2018 / Published: 12 November 2018
(This article belongs to the Special Issue Sustainable Water Management: Economics and Governance)

Abstract

:
Seawater intrusion has occurred in the coastal area of the Yellow Sea and the Bohai Sea as early as the 1970s, and the situation is worsening, with rapid socioeconomic development in recent years. Substantial amounts of groundwater have been exploited to support socioeconomic activities, especially agricultural activities, causing a reduction in the groundwater level, and hence the intrusion of seawater. This issue seriously restricts the sustainable socioeconomic development of these coastal areas. To this end, this paper applied the improved Tapio decoupling theory to analyze the degree of decoupling, and the spatial difference between the economic growth and the groundwater consumption of the five provinces and cities in the coastal areas of the Yellow Sea and Bohai Sea in the period of 2003–2016. Based on the improved STIRPAT (Stochastic Impacts by Regression on Population, Affluence, and Technology) model and panel data, we determined the driving factors of groundwater consumption in the coastal areas of the Yellow Sea and Bohai Sea. The results demonstrated that the effective irrigation area of farmland should be expanded, new water-saving technology should be introduced, the crop planting structure should be readjusted, and the consumption of groundwater should be reduced. By implementing these measures, it would be possible to contain seawater intrusion in the coastal areas of the Yellow Sea and Bohai Sea.

1. Introduction

Coastal areas are often characterized by dense populations and rapid economic growth [1]. Concurrent with sea level rise in under warming climate, groundwater exploitation driven by human activities are causing serious seawater intrusion issues in many coastal areas, triggering a series of ecological and environmental problems, such as groundwater quality deterioration and soil degradation. These are threatening the sustainability of socioeconomic development [1]. The State Oceanic Administration of China detected severe seawater intrusion in some coastal areas of the Yellow Sea and Bohai Sea as early as 2007. In particular, the longest distance of seawater intrusion occurred in the south of Laizhou Bay (~45 km) [2]. The longest distance of seawater intrusion in Panjin area is ~68 km [3]. Over the period of 2008–2013, seawater intrusion in the coastal areas of Bohai Sea expanded further. The seawater intrusion was ~10–30 km away from the shorelines, and its invasion range increased gradually with time [4]. More recently (2014–2016), the distance of seawater intrusion increased further at some monitoring areas in the Bohai coastal area (i.e., about 10–43 km away from the shorelines) [5,6,7]. In a sense, the worsening seawater intrusion along the coasts of the Yellow Sea and Bohai Sea elevated the challenges of groundwater ecological environment protection. Overexploitation of groundwater in the process of socioeconomic activities (especially agricultural activities) is depleting groundwater resources, causing seawater intrusion and adversely affecting the groundwater-dependent ecosystems. Therefore, understanding the decoupling relationship between economic growth and groundwater consumption would offer an important theoretical basis for adopting groundwater management and protection measures, in order to prevent further expansion of seawater intrusion and to achieve sustainable economic development.
The term “Decoupling” originally refers to the different trends of change between two physical quantities in physics. Later, similar terminology was applied in the economic field [8]. The idea was to indicate that while the economy is growing, the availability of a specific resource is depleting, i.e., breaking the link between environmental load and economic performance. Based on the driving force–environmental pressure–environmental state conditions, OECD(Organization for Economic Co-operation and Development) countries have established a systematic set of indicators to divide the state between economic development and resource consumption into relative decoupling and absolute decoupling relationships [9,10]. Based on the OECD decoupling model, Tapio [11] and colleagues developed the Tapio decoupling model which classifies decoupling into eight categories: strong decoupling, expansion relative decoupling, recessionary decoupling, strong negative decoupling, weak negative decoupling, expansion decoupling, growth linkage, and recession linkage. Its division of the decoupling state is more elaborate, relative to the OECD decoupling index. However, the original Tapio decoupling model does not consider relative decoupling and absolute decoupling. Zhang [12] incorporated relative decoupling and absolute decoupling into the original Tapio decoupling model. Therefore, the improved decoupling model has 10 classifications. This can more accurately reflect the relationship between economic development and resource consumption in different regions, and the temporal variation within each region.
Most of the studies on economic growth and the decoupling of water resources in China have concentrated on the national, regional, and provincial levels, and they are based on the total water resources, sewage discharge, the water environment, and the water footprint of the industry. Few researches examined the cross-regional groundwater resources. You [13] and Jia [14] studied the decoupling relationship between national/regional economic growth and water resources utilization (e.g., total water consumption, agricultural water consumption, industrial water consumption). Wu [15], Han [16] and colleagues analyzed the interaction between water resource utilization and economic development, and constructed a temporal decoupling model of China’s economic development and water resources utilization. Yuan [17], and Gai and colleagues [18] investigated the macro-scale decoupling relationship between economic growth and resource and environmental pressure, and evaluated the rebound effect. Ma [19] applied the Tapio decoupling model to study the inter-provincial differences between industrial wastewater and economic growth, and decomposed the factors of wastewater discharge from the perspective of resources and industry. Based on the “pressure-state-response” framework, Li [20] studied the decoupling relationship between the economic growth of the textile industry and water resources/the environment. Zhang [21] examined the influence of decoupling the elastic coefficient decomposition on environmental regulation policies in the decoupling relationship between water environment pressure and economic growth. From a water footprint perspective, Li, Y. [22], Li [23], Pan and colleagues [24] studied the decoupling relationship between water resources and economic development.
A number of methods have been applied to understand the growth path of national/regional resource consumption, economic transformation, and the drivers of the growth of resource consumption. Although the structural decomposition method (SDA) [25,26,27] and logarithmic mean divisia index (LMDI) [28,29,30,31,32] are routinely adopted in the literature, the decomposition factors are limited. The application of the STIRPAT model (Stochastic Impacts by Regression on Population, Affluence, and Technology) [33,34,35] for analyzing the resource pressure has been rare. Previous study demonstrated that this model is useful for identifying the driving factors in accordance to the characteristics of the article [25]. Following this approach, this paper applies the improved STIRPAT model and panel data to systematically study the driving factors of groundwater consumption in the coastal provinces and cities of the Yellow Sea and Bohai Sea. This analysis investigates the economic development level, technical efficiency, and water resource structure of these study areas. The overall goal is to provide empirical evidence on the overexploitation of groundwater; and theoretical support on handling the problem of seawater intrusion in the coastal provinces and cities of the Yellow Sea and Bohai Sea. The decoupling model is used to evaluate the relationship between economic growth (i.e., regional GDP) and groundwater consumption for these study areas in the period of 2003–2016. Through such quantitative analysis, we would be able to understand the influence of different driving forces of groundwater level consumption and to formulate feasible management strategies to achieve sustainable groundwater consumption and manage seawater intrusion.

2. Study Region, Methods, and Data

2.1. Study Region

Bohai Sea is the shallowest semi-closed inland sea in China. It is surrounded by land on three sides. It consists of five parts: the Liaodong Bay in the north, the Bohai Bay in the west, the Laizhou Bay in the south, the Central Sea Basin, and the Bohai Strait. It connects with the Yellow Sea through the Bohai Strait. The Yellow Sea, which lies between the Mainland China and the Korean Peninsula, is the largest marginal sea in the western Pacific Ocean. It is bounded by the Laotieshan Cape in the southern tip of Liaodong Peninsula, and the Penglai Cape in the northern coast of Shandong Peninsula. It is connected to the Bohai Sea, covering the LaoTieshan Cape at the southern end of the Liaodong Peninsula, and the Penglai Point at the north bank of the Shandong Peninsula. The provincial boundaries of the Yellow Sea include Liaoning, Shandong, and Jiangsu.
The coastal area of the Yellow Sea and Bohai Sea is located in the north of China, covering Liaoning, Hebei, Jiangsu, Shandong, and Tianjin (see Figure 1). It covers a total area of ~61.3946 million km2, and accounting for ~6.37% of China’s total land area. Among different land use types, cultivated land dominates this coastal area. In 2015, the cultivated land area was 23.122 million km2, accounting for 37.66% of the total land area [36]. Coastal areas are often characterized by a dense population. In 2016, about 22.7% of China’s population lived in the coastal area of the Yellow Sea and the Bohai Sea. It is an important area for China’s economic development. In 2016, its total GDP accounted for about 30% of the country’s GDP. The Yellow Sea and Bohai Sea are located in the Northern Temperate Zone, with an annual precipitation of less than 600 mm (except Jiangsu). Over the period of 2003–2016, the per capita groundwater supply dropped from 12.8 m3 to approximately 8.86 m3 (estimated from collected data). More recently, declining water resources and the rising salinity of cultivated land resources due to seawater intrusion are restricting the economic development of the Yellow Sea and the Bohai Sea.

2.2. Tapio Decoupling Model

By incorporating relative decoupling and absolute decoupling into the original Tapio decoupling model, we expanded the number of categories in the classification system to 10 categories [12], as shown in Table 1. The level of decoupling was divided into relative decoupling, absolute decoupling, and connection. Relative decoupling was divided into expansion relative negative decoupling, expansion relative decoupling, declining relative decoupling, and declining relative negative decoupling; absolute decoupling was divided into expansion weak absolute decoupling, expansion strong absolute decoupling, declining weak absolute negative decoupling, declining strong absolute negative decoupling; connections were divided into expansion connections and recession connections. The strong decoupling of expansion was the most ideal state to realize economic development and groundwater consumption, whereas the absolute negative decoupling of the recession was the least ideal state. The improved Tapio decoupling model could more accurately reflect the relationship between economic development and groundwater consumption in different regions and years of each region. The driving force–environmental pressure index is established (i.e., one was the economic driving force indicator, the other was the groundwater consumption index) for decoupling the economic growth and groundwater consumption of the coastal provinces and cities in the Yellow Sea and Bohai Sea. This study used the improved Tapio decoupling elastic method to examine the influence of changes in groundwater consumption on economic development. The model [11] is expressed as follows:
e = ( U t U t 1 ) / U t 1 ( GDP t GDP t 1 ) / GDP t 1 = Δ U / U Δ GDP / GDP
where e is the decoupling elastic index (which represents the decoupling state between groundwater consumption and economic development) [37,38], U t is the consumption of groundwater at phase t, U t 1 is the consumption of groundwater at phase t 1 , GDP t is the gross domestic product in phase t, GDP t 1 is the gross domestic product in phase t 1 , and Δ U and Δ GDP are the changes of groundwater consumption and GDP, respectively. The improved decoupling criteria comprehensively presented the decoupling state of economic growth and groundwater consumption, improving the accuracy of the decoupling model in relating the economic growth and groundwater consumption.

2.3. Decomposition of the Drivers of Groundwater Consumption

The IPAT model (I = Human Impact, P = Population, A = Affluence, T = Technology combines) the core drivers of human-driven and environmental issues to form an analytical framework. The impact of a country or region on the environment and ecosystem is a product of its population size and affluence. It is undermined by specific technologies that support this affluence, namely the I = PAT model, also known as the environmental pressure control model [39]. The IPAT framework is widely used for analyzing environmental pressure drivers because of its simple form of structure. It can be decomposed into: (1) an ImPACT (Im = PACT) [40] form with unit output consumption C; (2) a STIRPAT form, which determines the driving factors in accordance to the research content and its characteristics. However, the application of IPAT and ImPACT models is limited because they do not allow for the non-monotonic and different proportion changes of influencing factors. To compensate the linear equivalence between variables, Dietz [41] formulated the IPAT equation in a random form, i.e., a stochastic model—STIRPAT. This approach enables each variable value to vary depending on the unit of observation [39,42], i.e.:
I = aP b A c T d ε
where I, P, A and T are the environmental stress, population size, richness, and technology respectively; a is the model coefficient; b, c, d are the driving force indices of the variables; ε is the model error. The current study expands the STIRPAT model in accordance to the factors affecting groundwater consumption.
  • The level of economic development is a measure of the scale of socioeconomic activities in a specific period, and it is an important driver of groundwater consumption. In the primary industry, substantial amount of groundwater was extracted for agricultural irrigation (e.g., flood irrigation). Therefore, the per capita GDP ( F p ) of the primary industry [13,43] can represent the level of economic development.
  • From technical perspective, water consumption per 10,000 yuan of GDP ( U g ) [44,45] is commonly used to indicate the technical efficiency of water resources. It also represents the regional environmental pressure. For groundwater research, the water use efficiency of surface water and groundwater is similar. Therefore, current study adopts the water consumption of 10,000 yuan of GDP to gauge the technical factors of water environment pressure in the coastal provinces and cities around the Yellow Sea and Bohai Sea.
  • Groundwater consumption is affected by the water resources consumption structure ( G w ). Hence, optimizing agricultural irrigation water consumption and other forms of water consumption would help with managing the issue of groundwater exploitation. Following Lin [46] and He [34], the water resources consumption structure (i.e., the proportion of surface water consumption to water consumption) was introduced into the model.
  • Key variables affecting groundwater consumption were incorporated:
(1)
The effective irrigation area (A) is the area of farmland covered by irrigation projects or facilities. It indicates the degree of regional water conservation, and affects the groundwater consumption. It was introduced into the model in order to evaluate the impact of water conservation on groundwater consumption.
(2)
Sewage charge [47] ( D c ) indicates the short-term impact of environmental regulation on groundwater consumption. It is a kind of fee-based environmental regulation. Its inclusion in the model enabled the current study to evaluate the role of short-term environmental regulation on groundwater consumption.
(3)
The proportion of investment in drainage and sewage treatment infrastructure in urban environmental infrastructure (S). The investment of drainage and sewage treatment infrastructure affects the groundwater consumption. This study took the proportion of investment in drainage and sewage treatment infrastructure in urban environmental infrastructure as a measure of the impact of water infrastructure investment scale on groundwater consumption.
(4)
Policy factors. The Chinese government has introduced a series of water resources management policies (since the 1970s), which also affected groundwater consumption. This study introduced the time trend variable to examine the sustainability of these policies.

2.4. Data

The records of gross domestic product (GDP) (yuan), population (person), groundwater consumption ( m 3 ), surface water consumption ( m 3 ), water consumption ( m 3 ), the gross domestic product of the primary industry (yuan), drainage, sewage treatment infrastructure investment (yuan), environmental infrastructure investment (yuan), effective irrigation area ( hm 2 ), and sewage charge collection (yuan) were derived from the 2004–2017 China Statistical Yearbook [48], the China Environmental Yearbook [49], and the China Environmental Statistics Yearbook [36]. The regional GDP, the gross domestic product of the primary industry, and the levy of pollutant discharge fees were based on 2003. To eliminate the price variation, the regional GDP index, the primary industry GDP index, and the commodity price index were adjusted to constant prices.

3. Decoupling Effect Analysis

3.1. Trend Analysis of GDP and Groundwater Consumption

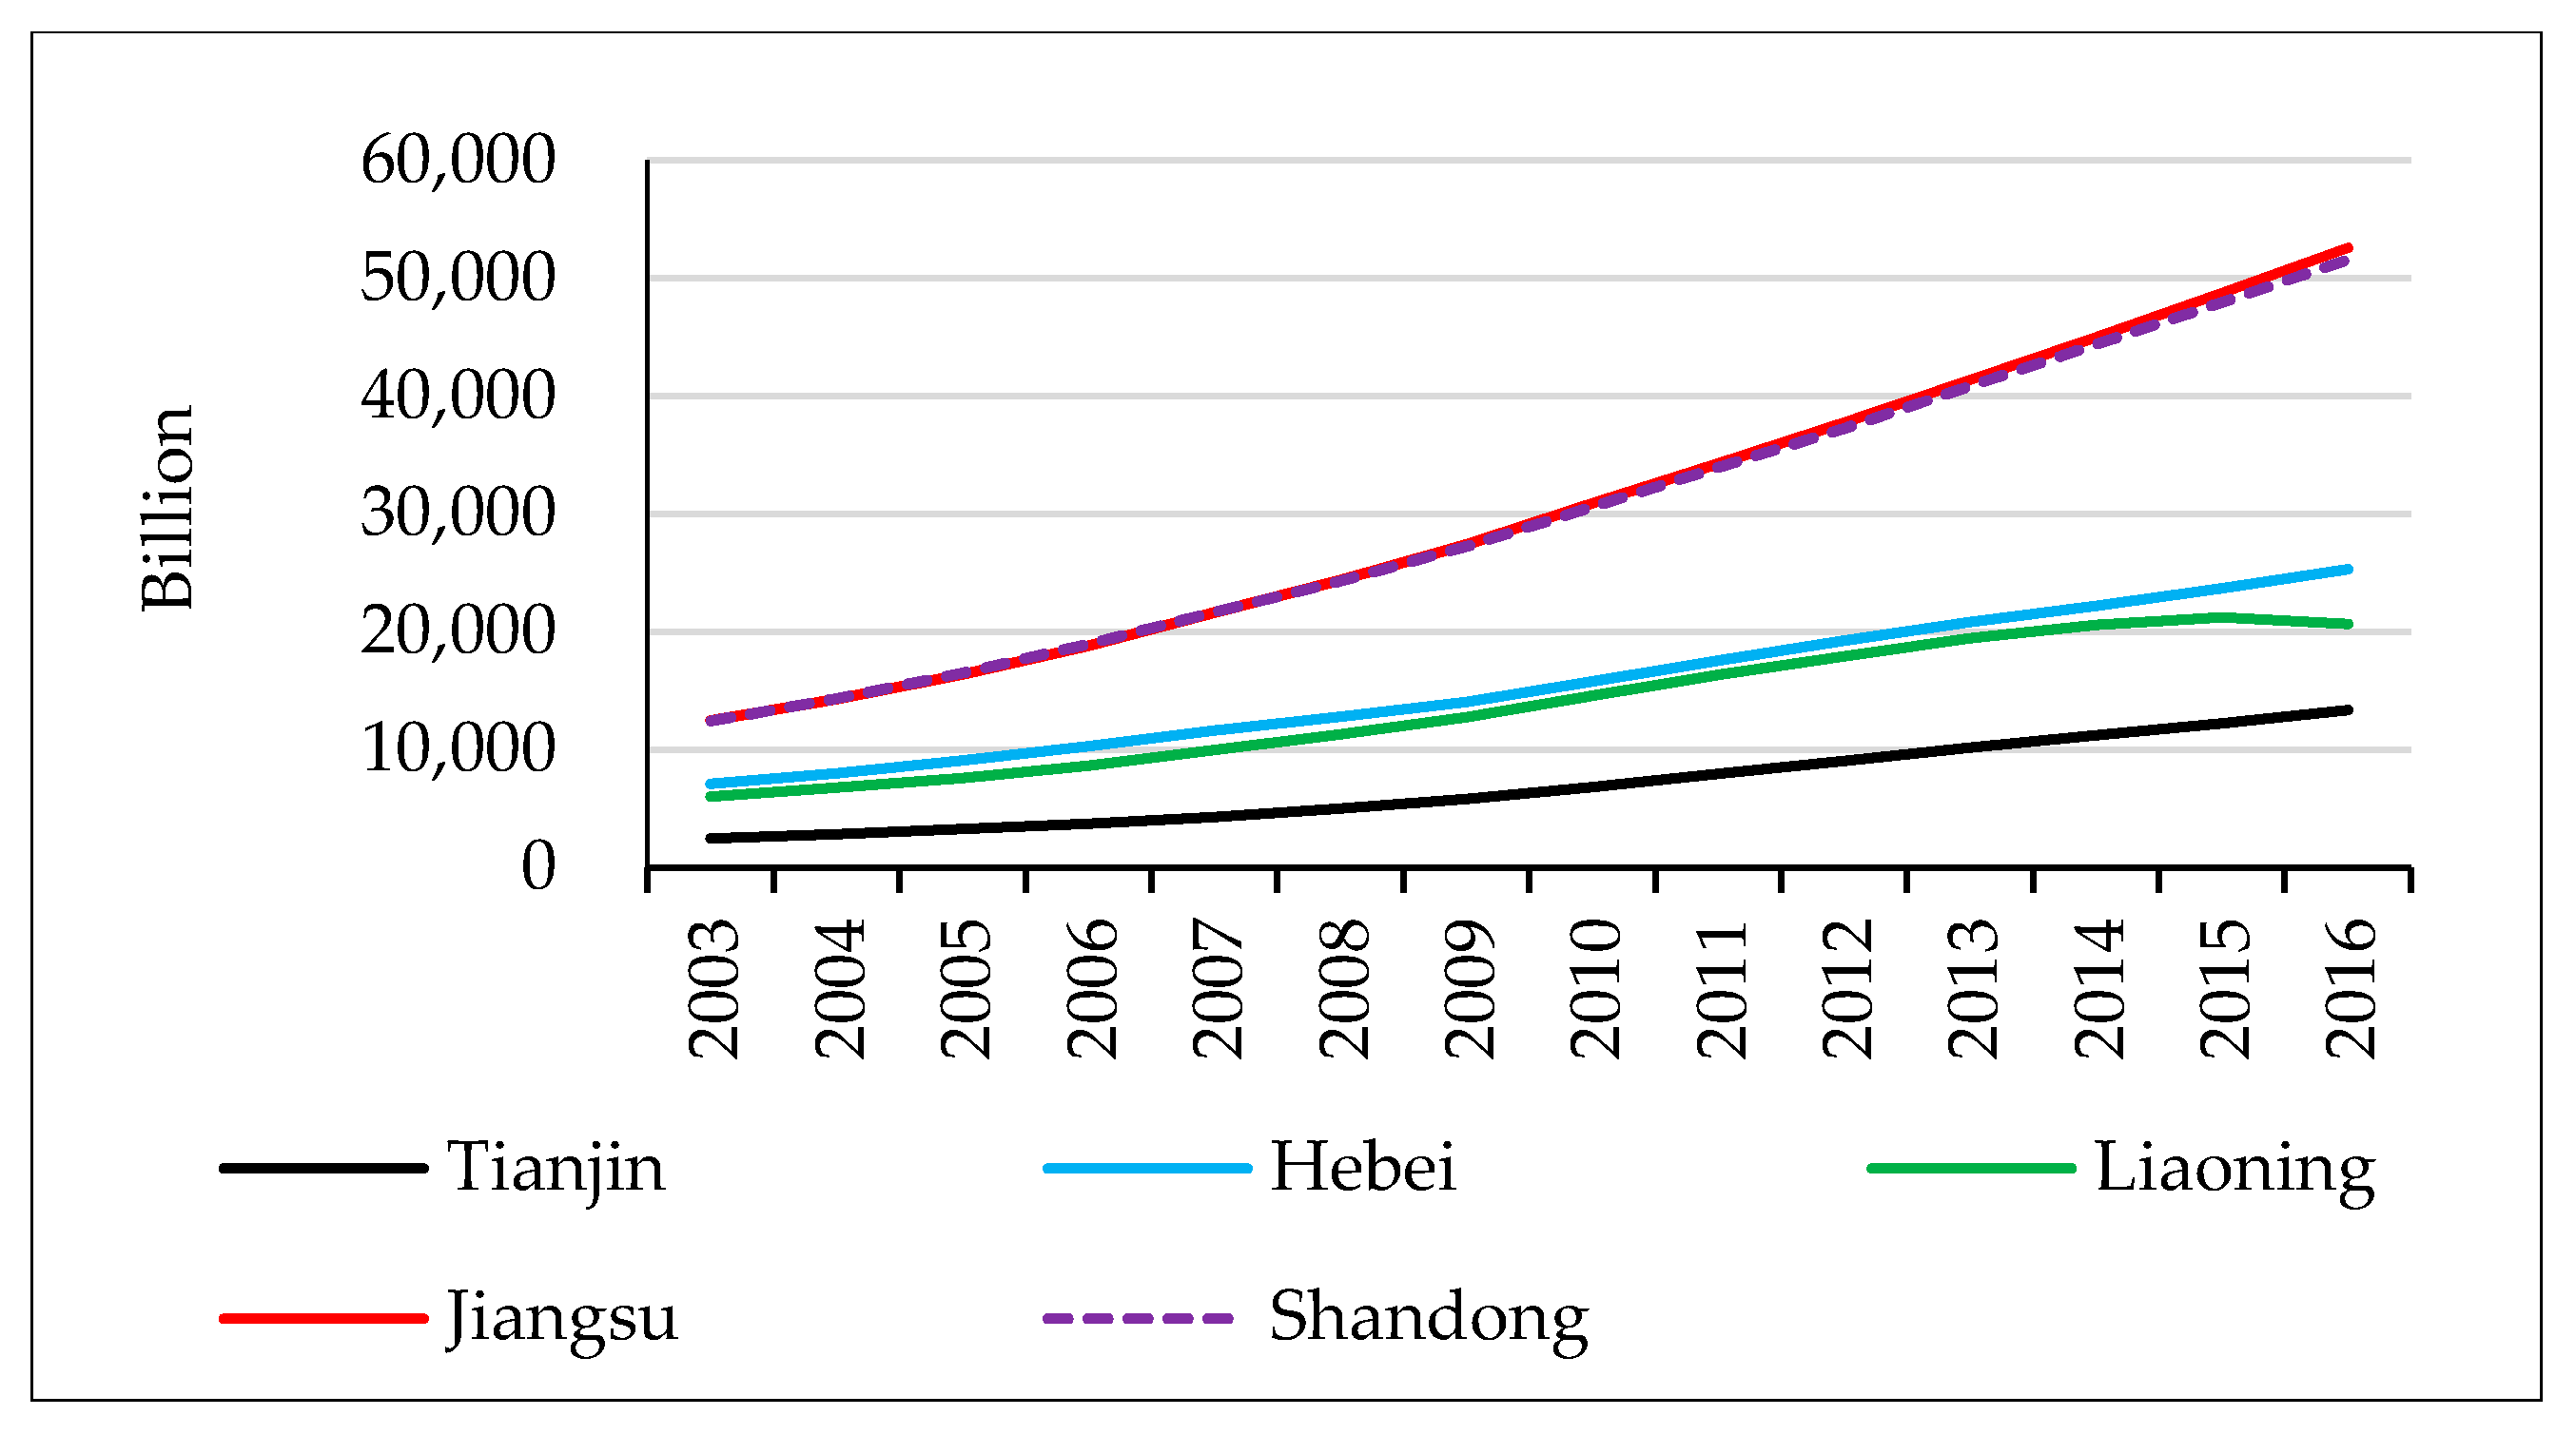
The coastal areas of the Yellow Sea and Bohai Sea span across four provinces (i.e., Hebei, Liaoning, Jiangsu and Shandong) and a city (i.e., Tianjin). Overexploitation of groundwater in the coastal provinces and the cities of the Yellow Sea and the Bohai Sea is intensifying seawater intrusion in these areas. The GDP of the coastal provinces (e.g., Jiangsu, Shandong) and cities (e.g., Tianjin) of the Yellow Sea and Bohai Sea has been growing since 2003 (see Figure 2). Although the GDP growth in Liaoning Province was obvious in 2003–2010, it was relatively mild in 2011–2015, and it turned negative in 2016. This is because the 12th Five-Year Plan (2011–2015) was promoting industrial upgrading. Nonetheless, the structural and institutional contradictions of the old industrial base were significant, which restricted the upgrading of advantageous industries.
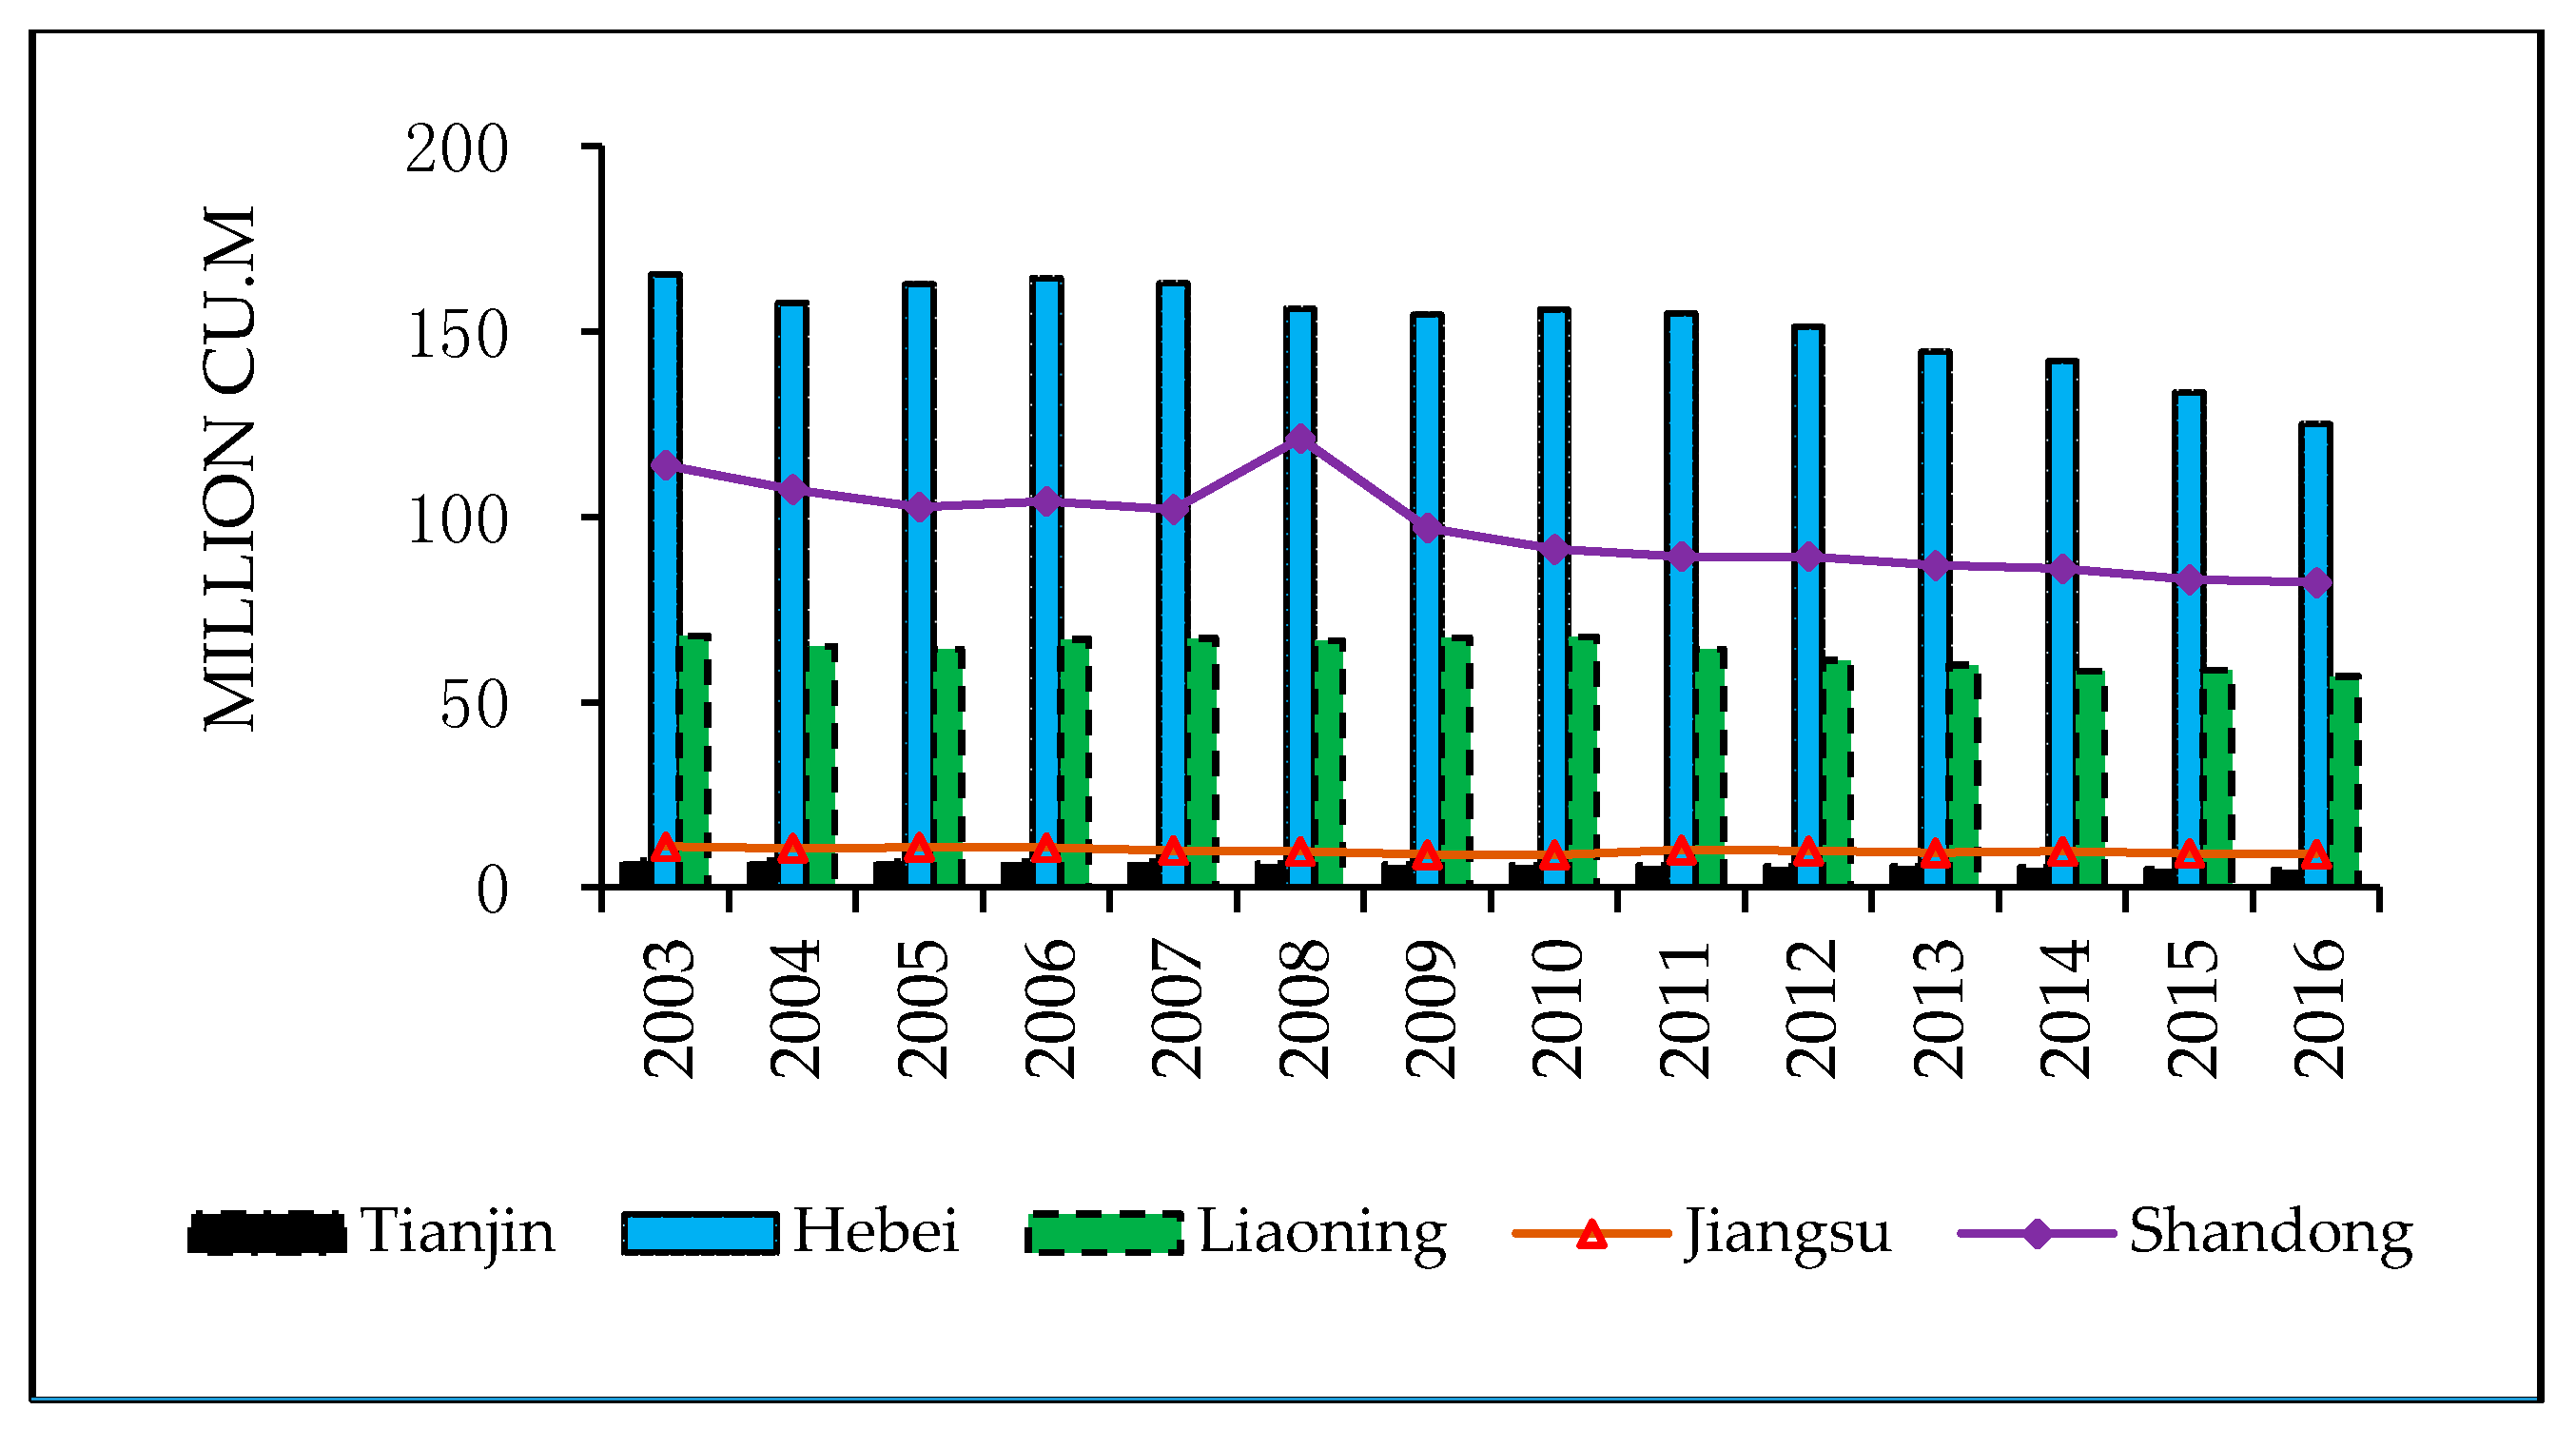
Groundwater consumption in the coastal provinces and cities of the Yellow Sea and Bohai Sea is shown in Figure 3. The comparison between water consumption and groundwater consumption shows that the water consumption of all provinces and cities was relatively stable and slightly fluctuated. Groundwater consumption showed a downward trend. In particular, Shandong Province experienced a surge in groundwater consumption in 2008, which was mainly affected by the primary and secondary industry the government was investing in. In 2008, the pace of industrial structure adjustment in Shandong accelerated, with the added manufacturing value increasing by 14.1% and accounting for 86.3% of the above-scale industries [50]. Shandong province resolutely implemented the national macro-policy regulation and control, and introduced a timely series of measures to stimulate domestic demand to promote economic growth. Investment consumption maintained rapid growth (investment in agriculture, real estate and high-tech industries increased by 56.3%, 30.1%, and 57.8% respectively [50]). To expand domestic demand, a series of measures were implemented by the government, stimulating the development of the primary and secondary industry (high water consumption industry) and resulting in a sharp increase in water consumption in 2008.

3.2. Temporal and Spatial Characteristics of Decoupling Effect

3.2.1. Temporal Variation Characteristics

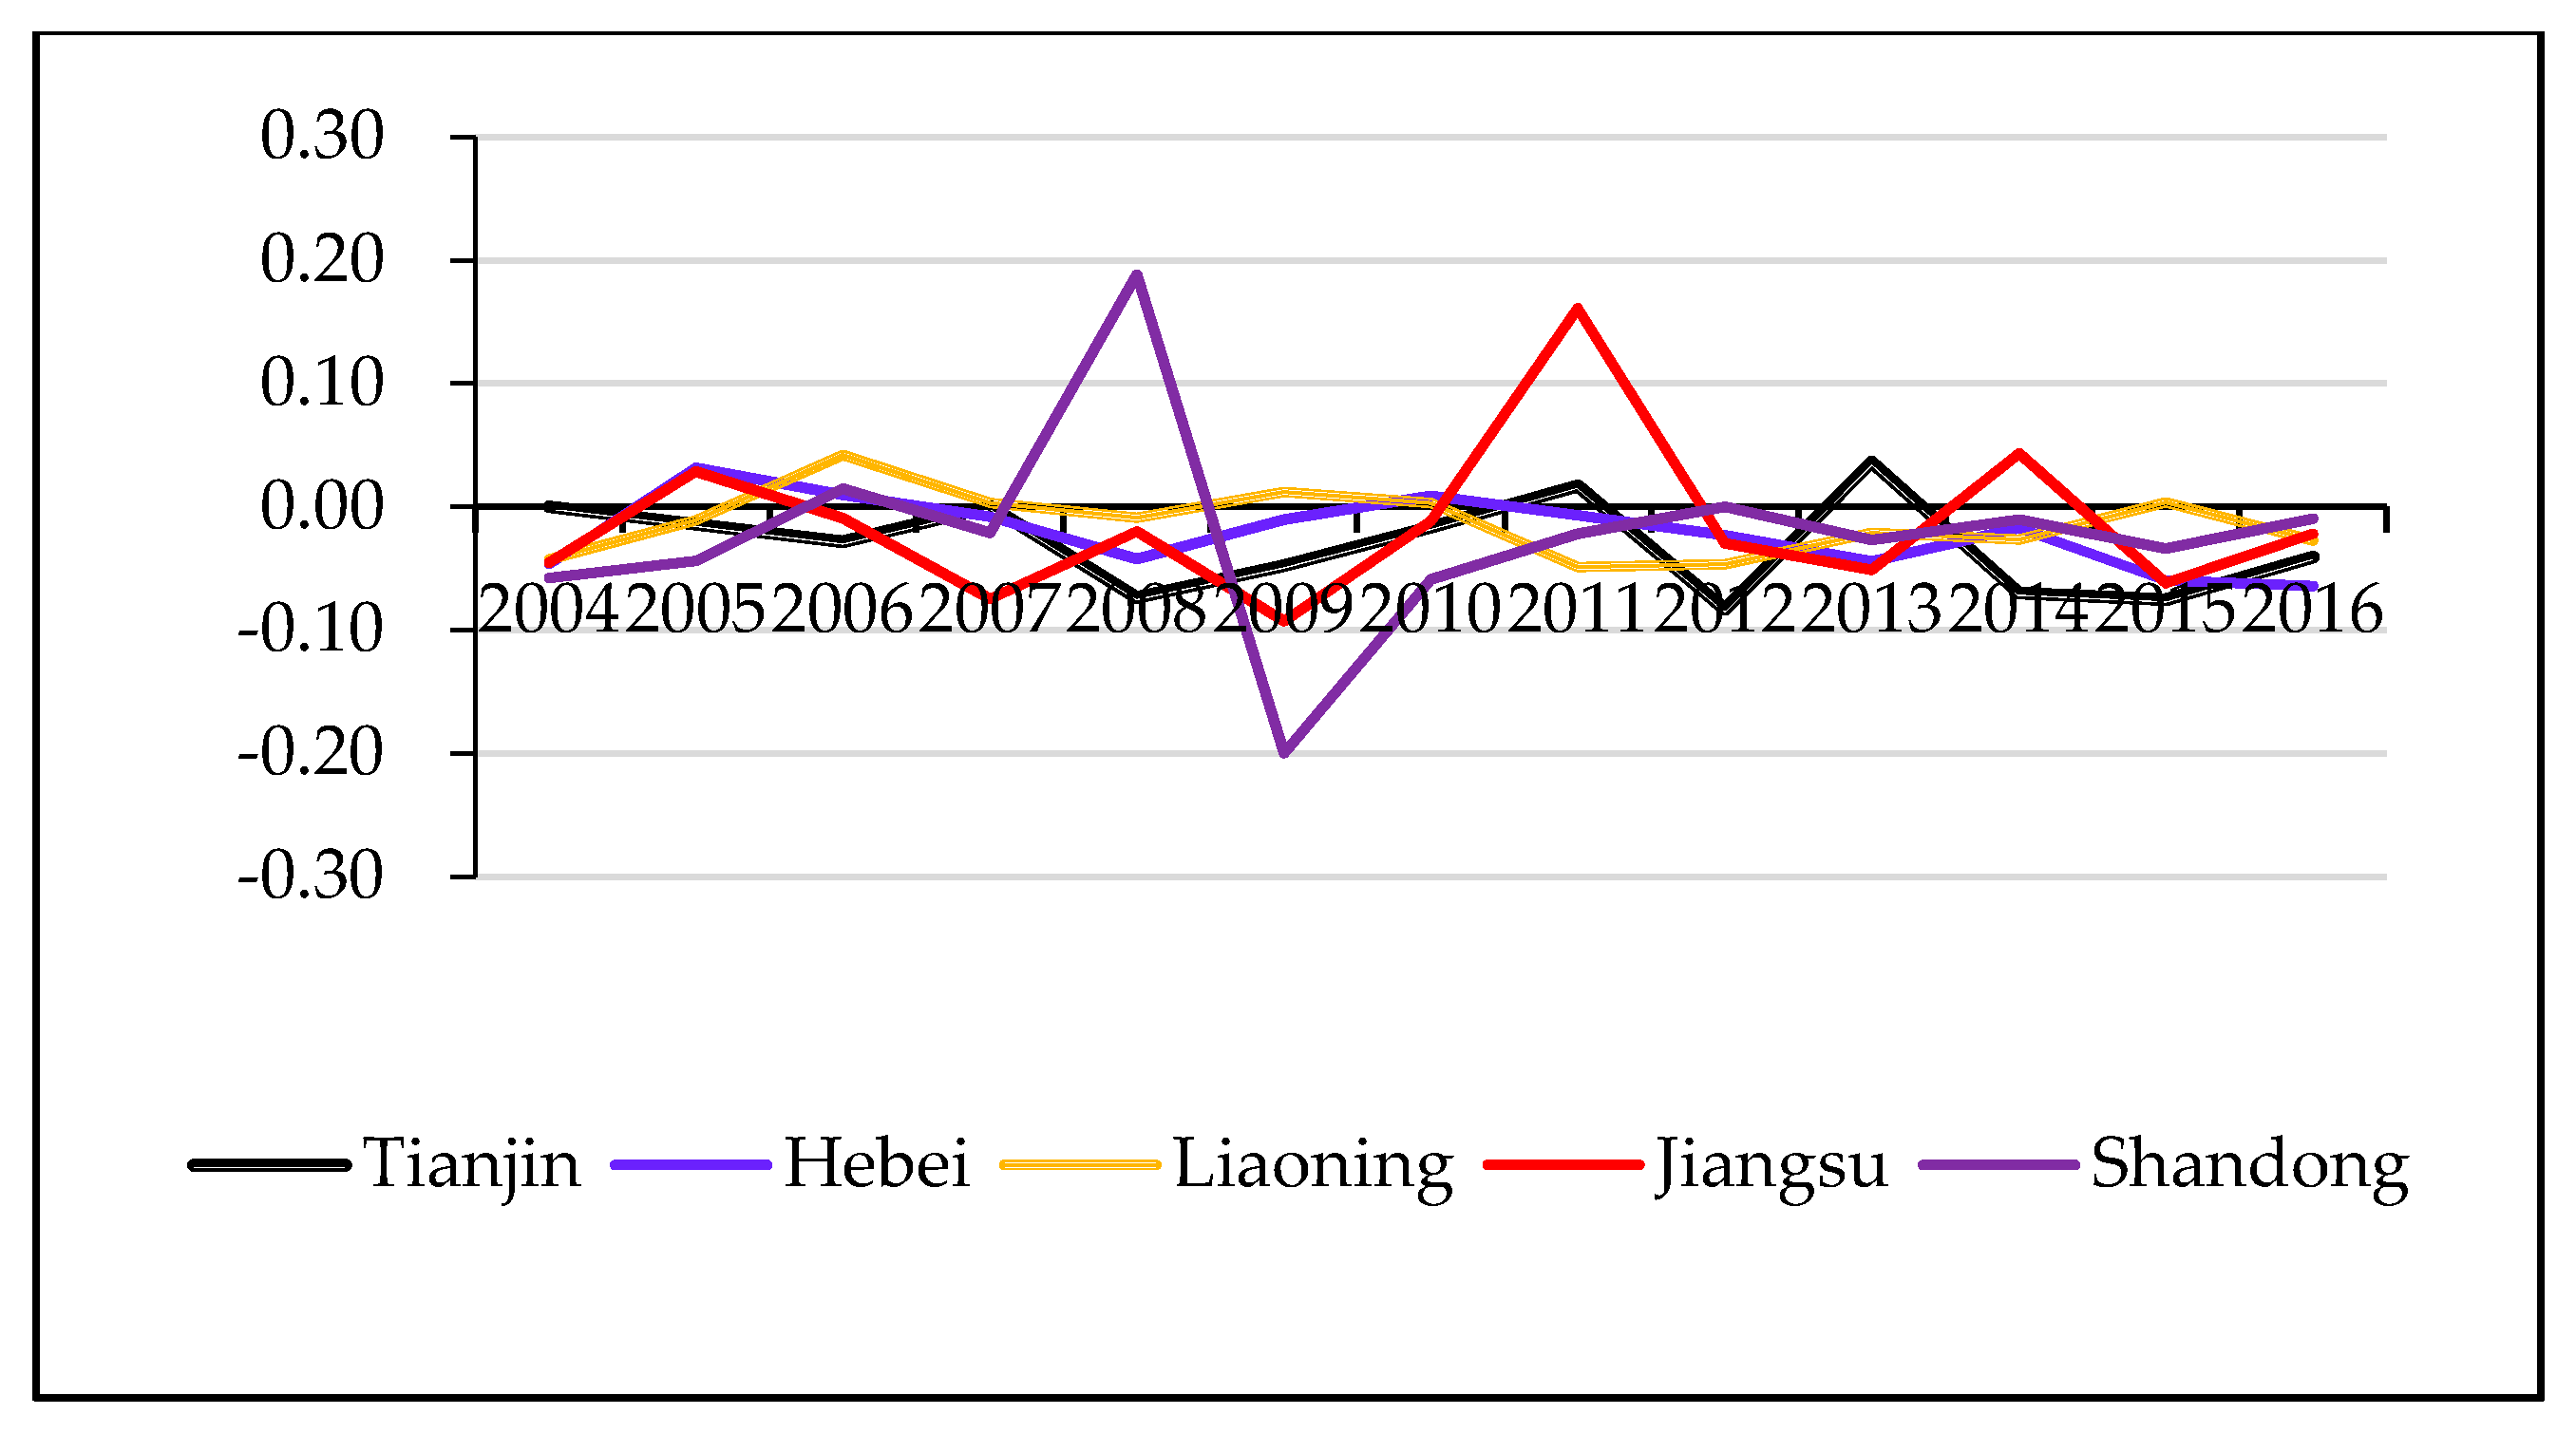
Based on the GDP and groundwater consumption in 2003, the growth rate of regional GDP and the growth rate of groundwater consumption in 2004–2016 were calculated (see Figure 4). The growth rate of groundwater in the coastal provinces of the Yellow Sea and the Bohai Sea showed wave-like fluctuations. The gap between the growth rates of groundwater consumption in Shandong Province from 2008 to 2009 is especially significant. Since 2004, Tianjin’s GDP growth rate has been declining. As the largest coastal open city in the northern China, Tianjin has a high level of economic development, and a higher economic growth rate than other areas around the Yellow Sea and Bohai Sea. The decline in Tianjin’s GDP growth rate in 2010–2016 and its gradual recovery is attributed to the fact that Tianjin was undergoing a transition from high-speed to high-quality growth [51,52,53]. High-quality growth is characterized by comprehensive, coordinated and sustainable growth. It involves technological support and high-tech growth, low-carbon, green, and environmentally-friendly growth. These will eventually benefit the growth of people’s livelihoods [54]. The GDP growth rate in Hebei, Jiangsu, and Shandong Provinces showed a significant downward trend in recent years. This is because the government was pushing industries to restructure, and traditional industries to destock, which led to significant declines in economic growth. The GDP growth rate in Liaoning Province has been dropping for a sustained period. The main reason lies in the 10-year period of development in revitalizing the old industrial base, and failures to upgrade advantageous industries [55]. The economic development of Liaoning is trapped by traditional industrial structures, which feature a high proportion of secondary industry. Energy industry and the production of bulk commodities are the pillar industries of Liaoning. However, in recent years, the profits of heavy industries have been shrinking, resulting in a decline in investments and in related industries. These thus lead to a significant drop in demand in local demand for industrial products. Based on the Tapio decoupling elastic method, the decoupling state of the coastal area in the Bohai Sea and the Yellow Sea from 2004 to 2016 was obtained (see Table 2). The expansion relative decoupling indicated that the GDP growth in the coastal area of the Yellow Sea and Bohai Sea was positive and the groundwater consumption also increased in 2006 and 2008, which are the most unsatisfactory two years. Overall, the decoupling status in the coastal provinces of the Yellow Sea and Bohai Sea is positive.

3.2.2. Spatial Difference Characteristics

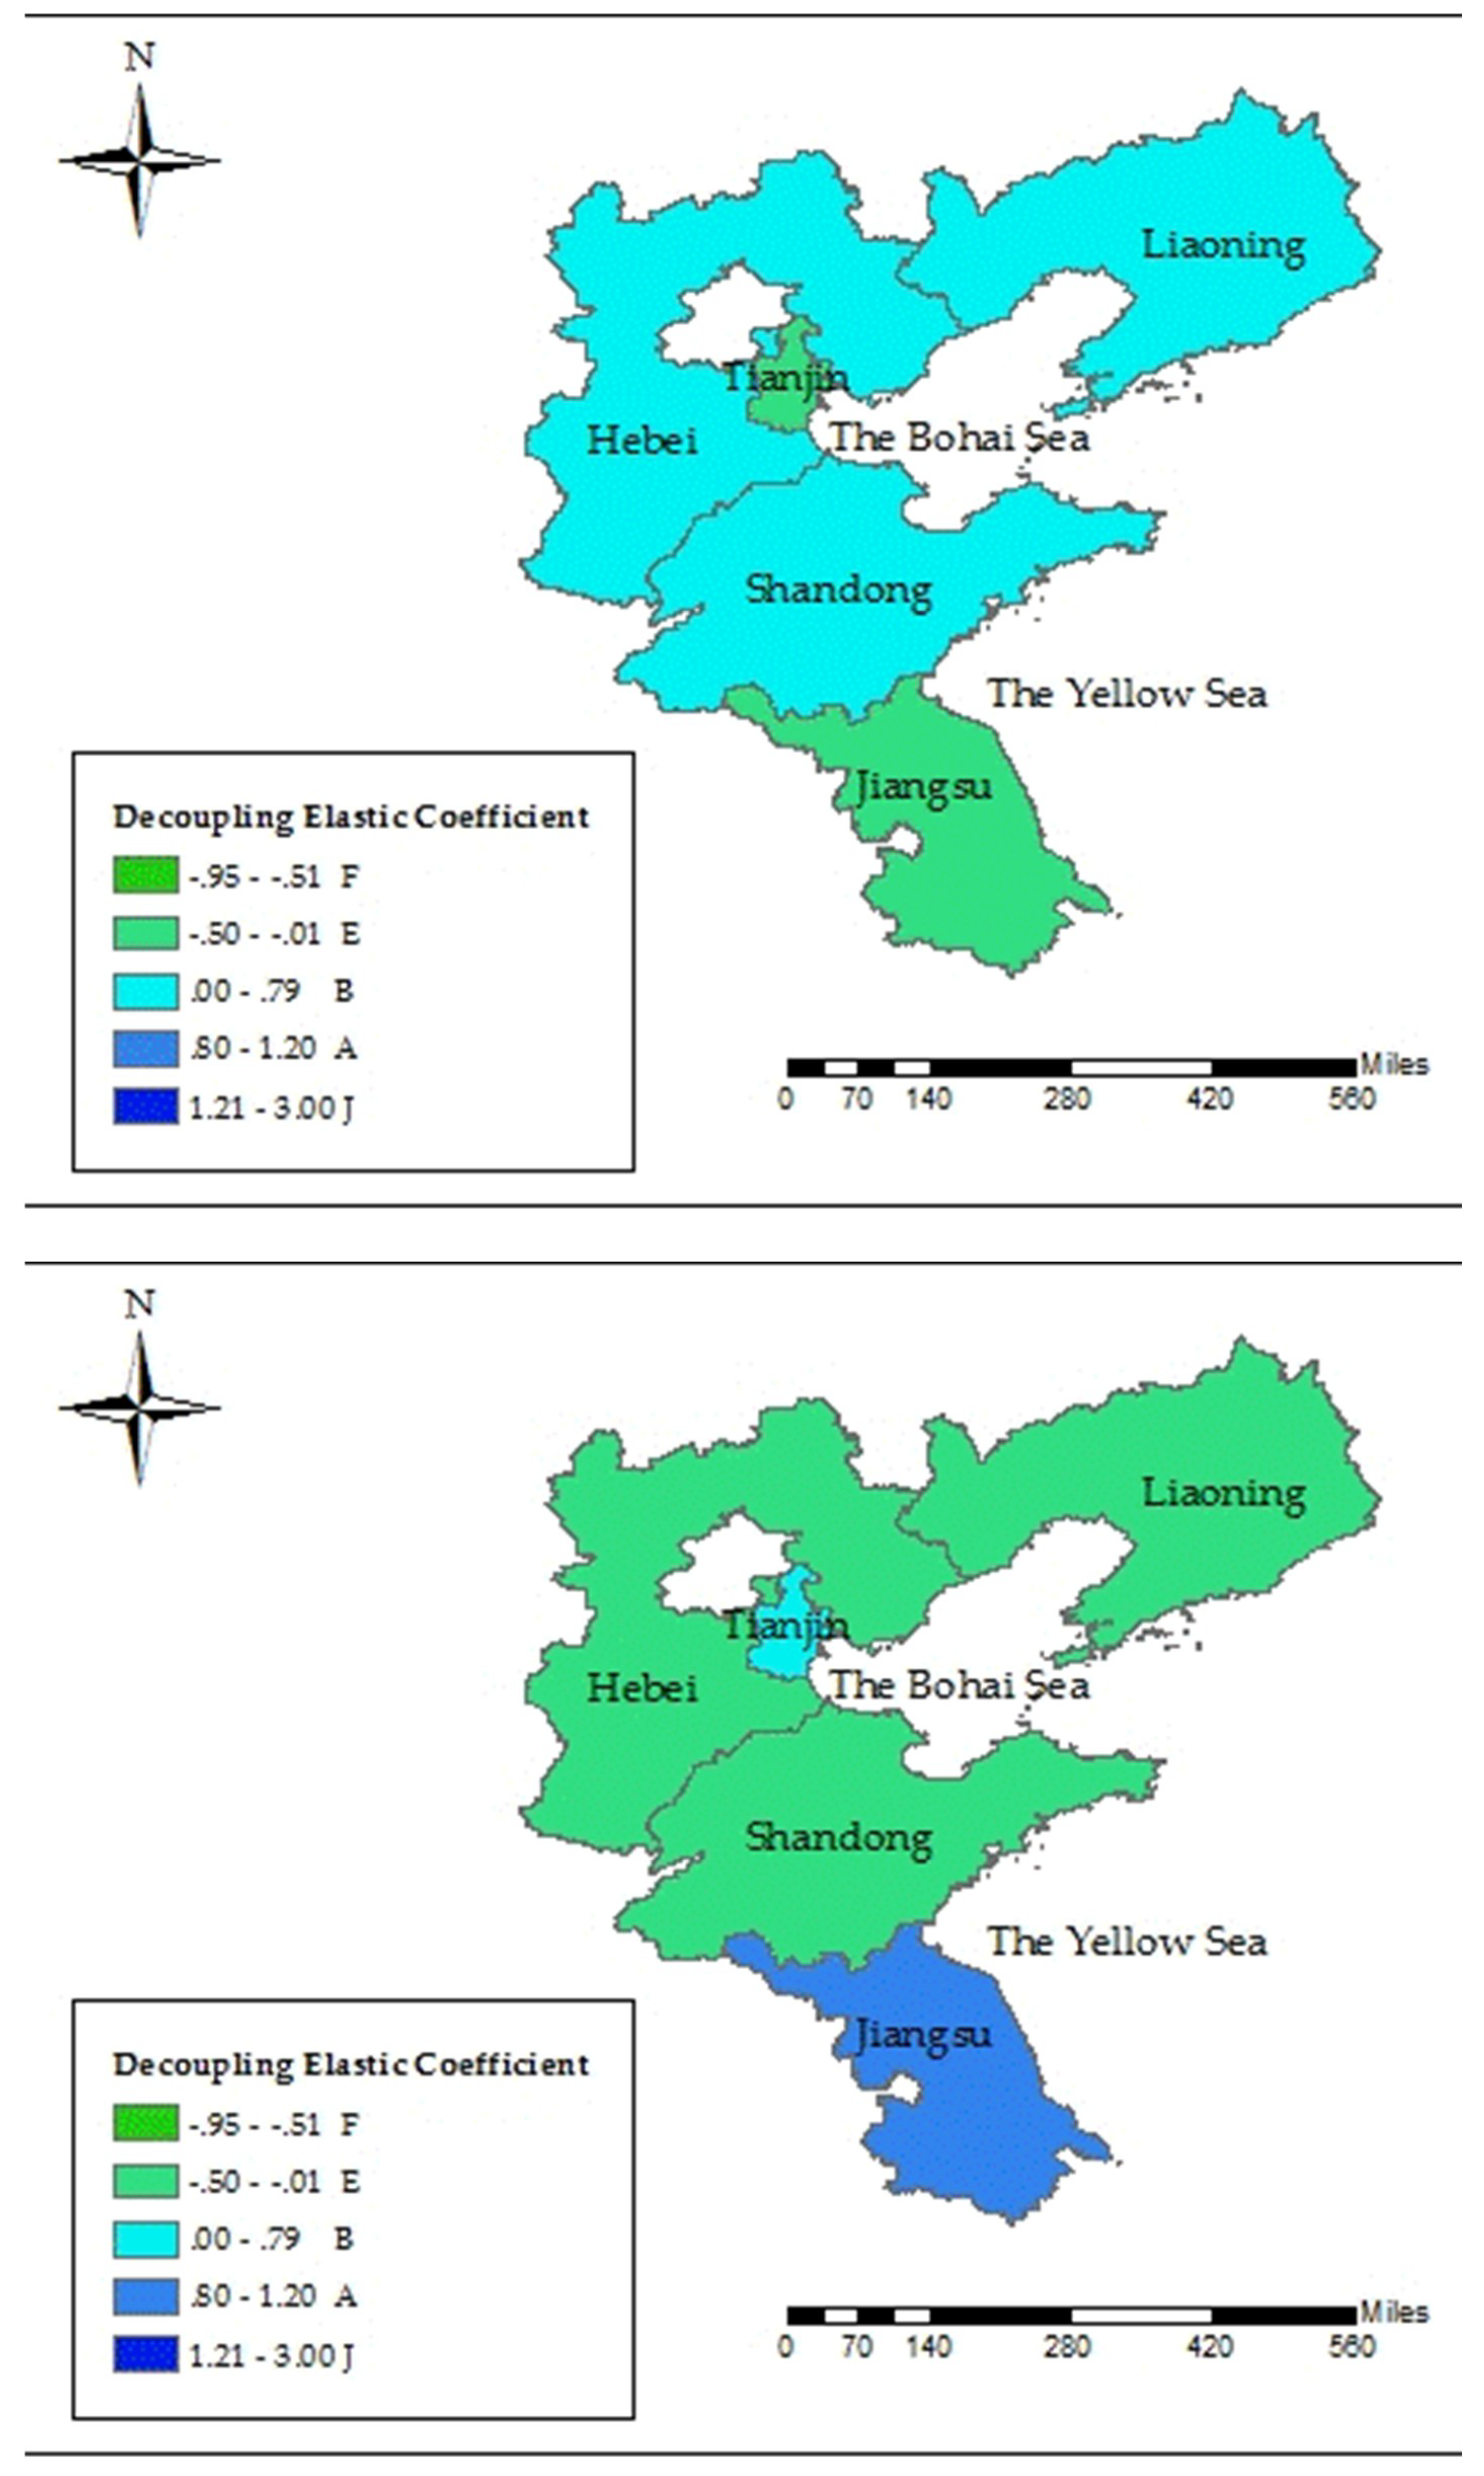
Figure 5 shows a significant difference in the degree of decoupling between the provinces and cities around the Yellow Sea and Bohai Sea in 2006, 2011, and 2016. There was no clear sign for the overall decoupling change in Liaoning Province. It is experiencing the worst decoupling state among the provinces and cities (i.e., a series of fluctuations involving expansion weak absolute decoupling, expansion relative decoupling, the expansion of weak absolute decoupling, recession connections; details in Table 3). On one hand, Liaoning’s heavy steel industry and high-yield water industry have greatly enhanced the water demand in Liaoning Province. On the other hand, during the “11th Five-Year Plan” period (2006–2010), the old industrial bases were fully revitalized, the coastal economic belt was developed, and opening up became a national strategy, which increased the requirements of resources and environment protection [56]. The economy in 2016 experienced a negative growth because of the 10-year development of the revitalization of the old industrial base, the failure to upgrade the advantageous industries, and the emergence of a recession [55].
Shandong Province heavily relied on groundwater extraction in its water consumption. In 2016, groundwater consumption accounted for 38.5% of total water consumption [57]. The relationship between groundwater consumption and economic growth in Shandong Province generally showed an irregular decoupling evolution. In 2008, Shandong’s economic growth was under an extensive development mode, with stable economic growth and a high consumption of groundwater resources. The decoupling index was 1.57 greater than 1.2, which was in a state of expansion negative decoupling. In 2013–2016, the absolute decoupling of expansion and the groundwater consumption decreased year by year, and the decoupling state improved over time.
For Jiangsu Province, the “12th Five-Year Plan” [56,58] and the 2015 Vision Plan [59] caused high-water-consuming industries such as machinery and petrochemicals to become pillar industries. These affected the instability of Jiangsu Province’s economic growth and the decoupling of groundwater consumption in 2010–2015 to some extent. In 2011, the growth rate of groundwater consumption surpassed the trend of economic growth. To reduce the over-exploitation of groundwater in Jiangsu Province, it would be feasible to consider optimization the industrial structure and improvement of the water-saving technology of agricultural industry.
The absolute decoupling state of the decoupling state in Tianjin and Hebei Province accounts for 85% (Calculated) of the decoupling state, which is superior to other provinces around the Yellow Sea and Bohai Sea. These indicate that Tianjin and Hebei have achieved high-quality coordination in economic development and groundwater resources. The next step is to rectify groundwater resource and control the expansion of seawater intrusion. Overall, the decoupling status of the coastal provinces and cities of the Yellow Sea and Bohai Sea in 2010–2016 was better than that of the decoupling state in 2004–2009. These imply that it is possible to manage the issue of groundwater over-extraction. To restore the groundwater environment, it is necessary to adopt water-saving technologies, optimize the industrial structure, and formulate relevant laws and regulations.

4. Driving Factor Analysis

To prevent the problem of “pseudo-regression” in the regression equation, the unit root test was used to examine the stability of each panel sequence. The ADF (Augmented Dickey–Fuller) was applied to test the validity of the unit root. It is known that the first-order difference sequence of variables at a 1% significance level is a stationary sequence. This study uses the Eviews 10.2 software to perform regression analysis on each model (see Table 4). To test the stability of the regression residuals, we apply the E–G two-step method to perform panel co-integration test and evaluate the stationarity of residual sequence, etc. The statistic value of each t-test was less than the corresponding critical value at a 1% significance level. Thus, the “H0” was rejected, which indicates that the residuals sequence did not have a unit root and was stationary. The sequence showed co-integration between the variables.
Table 4 shows the regression results of the natural logarithm of groundwater consumption as a dependent variable. Among them, Model 1 only included the regression results of per capita GDP of primary industry, technical efficiency, and water resource structure variables. To test the robustness of Model 1, the control variables (i.e., effective irrigation area, sewage charges, and the proportion of investment in drainage and sewage treatment infrastructure in urban environmental infrastructure, and time trend variables) were added into Model 2, Model 3, Model 4, and Model 5, respectively.
In the regression results (Table 4), the per capita GDP of the primary industry was positively correlated to the groundwater consumption. This means that an increase in per capita GDP in the primary industry requires an increase in groundwater consumption. Typically, the water requirement of crops concentrates in the growing period (i.e., June–August). When the amount of rainfall cannot not satisfy the water requirement of crops, we would utilize groundwater resources for crop irrigation (e.g., flooding irrigation). Industrial water consumption also affects the groundwater overdraft.
The technical efficiency was positively correlated to the groundwater consumption, which indicates that the improvement of water use efficiency increased the productivity of groundwater consumption. Given the gradually improving utilization efficiency of water resources, the consumption of water resources in the coastal provinces and cities of the Yellow Sea and Bohai Sea dropped from 247.672 m 3 per million yuan in 2003 to 69.51 m 3 per million yuan in 2016. The water consumption structure of water resources was negatively correlated to the groundwater consumption. This implies that greater amount of surface water was allocated for consumption, which effectively reduced the groundwater consumption in a relative sense.
The effective irrigation area was negatively correlated to the groundwater consumption. This indicates that advanced irrigation technology/equipment increases the productivity of water resources and reduces the groundwater consumption. Although the proportion of investment in drainage and sewage treatment infrastructure in urban environmental infrastructure is negatively correlated to the groundwater consumption, such a correlation is quite weak. This might imply that the proportion of investment in water conservation infrastructure related to groundwater mining is small, and that perhaps the utilization rate of water conservation infrastructure is low.
A significant negative correlation between the amount of sewage charge and the groundwater consumption was found. In a sense, the short-term cost-based environmental regulation can promote enterprises to improve water use efficiency, save water resources, and effectively reduce the groundwater consumption. Finally, the time trend variables were positively correlated to the groundwater consumption (with a coefficient of 0.056). The water resources management and protection policies on groundwater resources were rare in the past. Starting from 2017, the Ministry of Water Conservancy implemented the “Regulations on Groundwater Management (Draft for Consultation)” for managing groundwater resources. Nonetheless, the Chinese/local governments still do not realize the importance of water resource optimization allocation, water price formation mechanism, and other regulatory methods, laws, and regulations to conserve water resources. More effort needs to be placed in irrigation districts to establish a variety of management mechanisms, and to promote water conservation among the stakeholders [60]. In particular, pertinent laws and regulations made by Chinese/local governments are important for tackling the issues of seawater intrusion.

5. Policy Implication

Rapid socioeconomic development in the coastal provinces and cities of the Yellow Sea and the Bohai Sea is driving the overexploitation of groundwater resources, and escalating the environmental threats of seawater intrusion. To achieve sustainable socioeconomic development, it is crucial to manage groundwater resources and to maintain groundwater-dependent ecosystems. According to the decoupling index of coastal provinces and cities in the Yellow Sea and the Bohai Sea, the overall decoupling state in 2010–2016 is better than that in 2004–2009. This indicates that the issue of groundwater overexploitation is showing some signs of improvement. However, additional efforts are required to further restore a sustainable groundwater environment in the coastal areas of the Yellow Sea and Bohai Sea. To this end, we present some aspects of policy implication:
  • Innovation in the farmland management mode and readjustment of the crop planting structure. The coastal provinces and cities in the Yellow Sea and Bohai Sea utilize excessive amounts of water for agricultural production, and they have unreasonable crop planting structures. The existing crop planting structure needs to be rectified. Plausible measures include constructing farmland demonstration areas, drawing lessons of agricultural production methods from foreign countries, realizing modern farming practices through modern machineries/equipment, promoting the construction of modern ecological irrigation areas, popularizing high-efficiency water-saving technologies (such as sprinkler irrigation, micro-irrigation, low-pressure pipeline irrigation, and fully tap the potential of agricultural water-saving).
  • Investment in water conservation public facilities, and the introduction of advanced equipment and expansion of effective irrigation area. Effective irrigation area is an important index to measure the degree of water conservation in agricultural production units and regions. Advanced irrigation technology can effectively save water resources and reduce groundwater consumption. The investment in water conservation public facilities would significantly improve water use efficiency, and should be an effective measure to promote water saving. We should also make full use of international coordination mechanism on groundwater consumption, introduce advanced water-saving technology and equipment from abroad, reduce groundwater consumption, and prevent seawater intrusion.
  • Strengthen the government’s control of groundwater resources, establish and improve the agricultural water price mechanism, and establish the mechanism of precision subsidy for agricultural water use and water-saving incentive mechanisms. Surveys have shown that that large numbers and a wide distribution of groundwater users would restrict conventional management. In such case, management agencies should perform targeted management in accordance with the different types of users, strengthen groundwater management, and perhaps political intervention.
  • Establishment of a better water resource supply structure, and optimization of water resource allocation. Under the sustainable development framework, it would be useful to adopt the water control policy of “water-saving priority and space balance”. In particular, we need to make efficient use of the south-to-north water diversion project, and establish a water resource allocation system to obtain desirable water quantity and quality outcomes. Plausible measures include encouraging the usage of unconventional water, building a highly efficient modern ecological water network, enhancing surface water allocation, prioritizing the usage of reclaimed water and surface water, reducing the groundwater consumption, and strengthening the management and protection of groundwater.
  • Introduction of engineering techniques/methods to improve groundwater environment. These include improving and optimizing groundwater recharge technology, recirculating freshwater and improving the level of groundwater, constructing underground dams to prevent the loss of underground freshwater, and improving the groundwater environment through underground dam projects.
Comprehensive understanding about the consumption of groundwater resources is the basis for planning a more sustainable use of groundwater resources when going forward. In this paper, the decoupling theory and STIRPPAT model are introduced into the study of the relationship between groundwater consumption and economic development. This paper obtains some preliminary results. However, we note that climate variables (such as temperature and precipitation) are also important factors that affect the regional groundwater consumptions. Meanwhile, it remains a challenge to incorporate them into the current study, and they will be extensive investigated in our future research.

Author Contributions

L.Q. developed the original idea of the study, analyzed the data, and commented on the manuscript. J.H. collected the original data, calculated the results, and wrote the manuscript. L.Q. and W.N. reviewed the manuscript. All authors read and approved the final manuscript.

Funding

This research was supported by National Key R&D Program of China, comprehensive prevention and management of seawater intrusion in the coastal area of the Yellow Sea and Bohai Sea (Grant number: 2016YFC0402808).

Acknowledgments

We thank two anonymous reviewers and the editors for helpful comments.

Conflicts of Interest

The authors declare no conflict of interest.

References

  1. Wu, J.C.; Wu, Y.X.; Lin, J.; Han, J.B. Comprehensive prevention and management of seawater intrusion in the coastal area of the Yellow Sea and the Bohai Sea. Chin. J. Environ. Manag. 2018, 91–92. Available online: http://www.cnki.net/KCMS/detail/detail.aspx?QueryID=16&CurRec=1&filename=ZHGL201802017&dbname=CJFDLAST2018&dbcode=CJFQ&pr=&urlid=&yx=&v=MjI1ODIxTHV4WVM3RGgxVDNxVHJXTTFGckNVUkxLZVp1ZHRGeW5uV3IvQVB5WE1Zckc0SDluTXJZOUVZNFI4ZVg= (accessed on 12 November 2018). (in Chinese). [CrossRef] [PubMed]
  2. Shandong Marine Environmental Quality Bulletin. 2007. Available online: http://www.soa.gov.cn/lwzsj/yhsshyhjzlgb/2007nsds/201212/t20121212_22418.html (accessed on 30 June 2010).
  3. Liaoning Marine Environmental Quality Bulletin. 2007. Available online: http://www.soa.gov.cn/lwzsj/yhsshyhjzlgb/2007nlns/201212/t20121212_22447.html (accessed on 30 June 2010).
  4. China Marine Disaster Bulletin. 2013. Available online: http://www.soa.gov.cn/zwgk/hygb/zghyzhgb/201403/t20140318_31018.html (accessed on 19 March 2014).
  5. China Marine Disaster Bulletin. 2014. Available online: http://www.soa.gov.cn/zwgk/hygb/zghyzhgb/201503/t20150318_36388.html (accessed on 03 March 2015).
  6. China Marine Disaster Bulletin. 2015. Available online: http://www.soa.gov.cn/zwgk/hygb/zghyzhgb/201603/t20160324_50521.html (accessed on 24 March 2016).
  7. China Marine Disaster Bulletin. 2016. Available online: http://www.soa.gov.cn/zwgk/hygb/zghyzhgb/201703/t20170322_55290.html (accessed on 22 March 2017).
  8. Vehmas, J.; Kaivo-oja, J.; Luukkanen, J. Global Trends of Linking Environmental Stress and Economic Growth. Available online: https://www.utu.fi/fi/yksikot/ffrc/julkaisut/tutu-julkaisut/Documents/Tutu_2003-7.pdf (accessed on 8 November 2018).
  9. Indicators to Measure Decoupling of Environmental Pressure from Economic Growth. Available online: http://www.oecd.org/environment/indicators-modelling-outlooks/1933638.pdf (accessed on 8 November 2018).
  10. OECD. Environment Indicators-Development, Measurement and Use; Organisation for Economic Co-operation and Development: Paris, France, 2003; Volume 13. [Google Scholar]
  11. Tapio, P. Towards a theory of decoupling: Degrees of decoupling in the EU and the case of road traffic in Finland between 1970 and 2001. Transp. Policy 2005, 12, 137–151. [Google Scholar] [CrossRef]
  12. Zhang, C.; Cai, W.H.; Yu, T.S. Regional economic development and carbon productivity—A convergent and decoupling index analysis. China Ind. Econ. 2013, 18–30. Available online: http://www.cnki.net/KCMS/detail/detail.aspx?QueryID=62&CurRec=1&filename=GGYY201305001&dbname=CJFDLAST2015&dbcode=CJFQ&pr=&urlid=&yx=&v=MjU4NzFNcW85RlpZUjhlWDFMdXhZUzdEaDFUM3FUcldNMUZyQ1VSTEtlWnVkdEZ5bmdWNy9JSWlyU2Q3RzRIOUw= (accessed on 12 November 2018). (in Chinese).
  13. You, H.X.; Yue, J.G. Decoupling analysis of water resources and economic development in Jiangsu Province. J. Econ. Water Resour. 2015, 7, 13–79. [Google Scholar]
  14. Jia, S.F.; Zhang, S.F.; Yang, H.; Xia, J. Relation of industrial water use and economic development: Water use Kuznets Curve. J. Nat. Resour. 2004, 3, 279–284. [Google Scholar]
  15. Wu, D. Evaluation and prospect on the decoupling trend of economic development and water resource utilization in China. J. Nat. Resour. 2014, 1, 46–54. [Google Scholar]
  16. Han, W.Y.; Chen, X.P.; Zhang, Z.L. Research on relationship between urban water use and economic growth based on decoupling analysis theory. Bull. Soil Water Conserv. 2017, 140–145. Available online: http://www.cnki.net/KCMS/detail/detail.aspx?QueryID=77&CurRec=1&filename=STTB201705024&dbname=CJFDLAST2017&dbcode=CJFQ&pr=&urlid=&yx=&v=MTM3NzExVDNxVHJXTTFGckNVUkxLZVp1ZHRGeW5nVmJ2SU5qbmZiTEc0SDliTXFvOUhZSVI4ZVgxTHV4WVM3RGg= (accessed on 12 November 2018). (in Chinese).
  17. Yuan, Q.M.; Qiu, J.; Qin, C.C. Decoupling relationship and rebound effect between economic growth and the resource environment for Tianjin. Resour. Sci. 2014, 954–962. Available online: http://www.cnki.net/KCMS/detail/detail.aspx?QueryID=82&CurRec=1&filename=ZRZY201405009&dbname=CJFD2014&dbcode=CJFQ&pr=&urlid=&yx=&v=MDc5Nzc3L05Qei9SZDdHNEg5WE1xbzlGYllSOGVYMUx1eFlTN0RoMVQzcVRyV00xRnJDVVJMS2VadWR0RnluZ1c= (accessed on 12 November 2018). (in Chinese).
  18. Gai, M.; Hu, H.G.; Ke, L. Decoupling analysis between economic development and resources and environmental of the Yangtze River Delta. J. Nat. Resour. 2013, 28, 185–197. [Google Scholar]
  19. Ma, H.L.; Hou, Y.R.; Li, S.S. Decoupling relationship between industrial wastewater discharges and economic growth in regional differentiation of China. China Popul. Resour. Environ. 2017, 185–192. Available online: http://www.cnki.net/KCMS/detail/detail.aspx?QueryID=90&CurRec=1&filename=ZGRZ201711020&dbname=CJFDLAST2017&dbcode=CJFQ&pr=&urlid=&yx=&v=MzExMjRSTEtlWnVkdEZ5bmhVcjdCUHlyWmRMRzRIOWJOcm85SFpJUjhlWDFMdXhZUzdEaDFUM3FUcldNMUZyQ1U= (accessed on 12 November 2018). (in Chinese).
  20. Li, Y. Decoupling Water Consumption and Environmental Impact on China’s Textile Industrial Economic Growth. Master’s Thesis, Zhejiang Sci-Tech University, Hangzhou, China, 2018. [Google Scholar]
  21. Zhang, F.; Song, X.N.; Xue, H.F.; Dong, H.Z. Decoupling relationship and dynamic response between industrial water intensity, environmental regulation and technological progress. China Popul. Resour. Environ. 2017, 193–201. Available online: http://www.cnki.net/KCMS/detail/detail.aspx?QueryID=102&CurRec=1&filename=ZGRZ201711021&dbname=CJFDLAST2017&dbcode=CJFQ&pr=&urlid=&yx=&v=MDY0ODhIOWJOcm85SFpZUjhlWDFMdXhZUzdEaDFUM3FUcldNMUZyQ1VSTEtlWnVkdEZ5bmhVNy9OUHlyWmRMRzQ= (accessed on 12 November 2018). (in Chinese).
  22. Li, Y.; Lu, L.Y.; Tan, Y.X.; Wang, L.L.; Shen, M.H. Decoupling water consumption and environmental impact on textile industry by using water footprint method: A case study in China. Water 2017, 9, 124. [Google Scholar] [CrossRef]
  23. Li, N.; Sun, T. Environmental regulation, water environmental pressure and economic growth—Based on the decomposition of Tapio decoupling elasticity. Sci. Technol. Manag. Res. 2016, 258–262. Available online: http://www.cnki.net/KCMS/detail/detail.aspx?QueryID=110&CurRec=1&filename=KJGL201604047&dbname=CJFDLAST2016&dbcode=CJFQ&pr=&urlid=&yx=&v=MDI5NTk4ZVgxTHV4WVM3RGgxVDNxVHJXTTFGckNVUkxLZVp1ZHRGeW5oVjcvSkxpZk1Zckc0SDlmTXE0OUJZNFI= (accessed on 12 November 2018). (in Chinese).
  24. Pan, A.E.; Chen, L. Decoupling and water footprint analysis of the coordinated development between water utilization and the economy in Hubei. Resour. Sci. 2014, 36, 328–329. [Google Scholar]
  25. Guo, C.X. An analysis of the increase of CO2 emission in China—Based on SDA Technique. China Ind. Econ. 2010, 47–56. Available online: http://www.cnki.net/KCMS/detail/detail.aspx?QueryID=114&CurRec=1&filename=GGYY201012006&dbname=CJFD2010&dbcode=CJFQ&pr=&urlid=&yx=&v=MjU3MzVoVjd2SklpclNkN0c0SDlITnJZOUZZb1I4ZVgxTHV4WVM3RGgxVDNxVHJXTTFGckNVUkxLZVp1ZHRGeW4= (accessed on accessed on 12 November 2018). (in Chinese).
  26. Su, B.; Ang, B.W. Structural decomposition analysis applied to energy and emissions: Some methodological developments. Energy Econ. 2012, 28, 177–188. [Google Scholar] [CrossRef]
  27. Yan, Y.F.; Yang, L.K. China’s foreign trade and climate change: A case study of CO2 emissions. Energy Policy 2010, 38, 350–356. [Google Scholar]
  28. Zhao, Z.Y.; Guo, C.F. The decomposition analysis on the driving factors of China’s carbon emission. China Soft Sci. 2012, 6, 175–183. [Google Scholar]
  29. Fan, T.J.; Luo, R.L.; Fan, Y.D.; Zhang, L.L.; Chang, X.Y. Study on influence factors for carbon dioxide emissions in China’s chemical industry with LMDI method. China Soft Sci. 2013, 3, 166–174. [Google Scholar]
  30. Zhao, C.; Chen, B. Driving force analysis of the agricultural water footprint in China based on the LMDI method. Environ. Sci. Technol. 2014, 48, 12723–12731. [Google Scholar] [CrossRef] [PubMed]
  31. Yang, L.J.; Wu, W.; Su, Q.; Du, Z.P.; Jiang, X.W. Carbon emissions of transportation energy consumption and its decoupling analysis in Jiangsu Province. Resour. Environ. Yangtze Basin 2014, 23, 1383–1390. [Google Scholar]
  32. Zou, M.Z.; Kang, S.Z.; Niu, J.; Lu, H.N. A new technique to estimate regional irrigation water demand and driving factor effects using an improved SWAT model with LMDI factor decomposition in an arid basin. J. Clean. Prod. 2018, 185, 814–828. [Google Scholar] [CrossRef]
  33. Wang, X. Impacts of social and economic factors on water environment pressure in Beijing based on STIRPAT model. Environ. Sci. Technol. 2015, 38, 48–52. [Google Scholar]
  34. He, X.G.; Zhang, Y.H. Influence factors and environmental Kuznets curve relink effect of Chinese industry’ s carbon dioxide emission—Empirical research based on STIRPAT model with industrial dynamic panel data. China Ind. Econ. 2012, 1, 26–35. [Google Scholar]
  35. Fan, Y.; Liu, L.C.; Wu, G.; Wei, Y.M. Analyzing impact factors of CO2 emissions using the STIRPAT model. Environ. Impact Assess. Rev. 2006, 26, 377–395. [Google Scholar] [CrossRef]
  36. China Environmental Statistics Yearbook; China Statistics Press: Beijing, China, 2004–2017.
  37. Diakoulaki, D.; Mandaraka, M. Decomposition analysis for assessing the progress in decoupling industrial growth from CO2 emissions in the EU manufacturing sector. Energy Econ. 2007, 29, 636–664. [Google Scholar] [CrossRef]
  38. Salahuddin, M.; Gow, J. Economic growth, energy consumption and CO2 emissions in Gulf Cooperation Council countries. Energy 2014, 73, 44–58. [Google Scholar] [CrossRef]
  39. Zhong, X.J.; Long, S.B. Rethinking the environmental impact of the IPAT model. China Popul. Resour. Environ. 2016, 3, 61–68. [Google Scholar]
  40. Waggoner, P.E.; Ausubel, J.H. A framework for sustainability science: A renovated IPAT identity. Proc. Natl. Acad. Sci. USA 2002, 99, 7860–7865. [Google Scholar] [CrossRef] [PubMed] [Green Version]
  41. Diets, T.; Rosa, E.A. Rethinking the environment impact of population, affluence and technology. Hum. Econ. Rev. 1994, 1, 277–300. [Google Scholar]
  42. Diets, T.; Rosa, E.A. Effects of population and affluence on CO2 emissions. Ecology 1997, 94, 175–179. [Google Scholar] [CrossRef]
  43. Qi, S.Z.; Lin, S.; Wang, B.B. Impact of economic growth pattern of the six provinces of central China on regional Carbon Emission: Based on the Tapio Model and Lag Instrumental Variable Analysis of Panel Data. China Popul. Resour. Environ. 2015, 59–66. Available online: http://www.cnki.net/KCMS/detail/detail.aspx?QueryID=118&CurRec=1&filename=ZGRZ201505008&dbname=CJFDLAST2015&dbcode=CJFQ&pr=&urlid=&yx=&v=MTUzNDhadWR0RnluaFZMM09QeXJaZExHNEg5VE1xbzlGYklSOGVYMUx1eFlTN0RoMVQzcVRyV00xRnJDVVJMS2U= (accessed on 12 November 2018). (in Chinese).
  44. Wu, D. An analysis of evolution trend and decoupling evaluation mechanism of economic development and water resource utilization in China based on comparative analysis of China and America. J. Hohai Univ. (Philos. Soc. Sci.) 2016, 18, 47–91. [Google Scholar]
  45. Tong, J.P.; Ma, J.F.; Liu, G.F. Analysis of variations and factors of water use amount per ten thous and Yuan GDP in China based on a complete decomposition model. Resour. Sci. 2010, 33, 1870–1876. [Google Scholar]
  46. Lin, B.Q.; Jiang, Z.J. Environmental Kuznets Curve prediction and influencing factors analysis of carbon dioxide in China. Manag. World 2009, 27–36. Available online: https://www.researchgate.net/publication/285853566_Environmental_Kuznets_curve_prediction_and_influence_factors_analysis_of_Chinas_carbon_emissions (accessed on 12 November 2018). (in Chinese).
  47. Zhang, P.; Zhang, P.P.; Cai, G.Q. Comparative study on impacts of different types of environmental regulation on enterprise technological innovation. China Popul. Resour. Environ. 2016, 4, 8–13. [Google Scholar] [CrossRef] [PubMed]
  48. China Statistical Yearbook. Available online: http://www.stats.gov.cn/tjsj/ndsj/ (accessed on 9 November 2018).
  49. China Environmental Yearbook. Available online: http://www.stats.gov.cn/ztjc/ztsj/hjtjzl/ (accessed on 9 November 2018).
  50. National Economic and Social Development Report. Available online: http://www.shandong.gov.cn/art/2013/4/2/art_2188_55810.html (accessed on 9 November 2018).
  51. An, S.X. A research on the path of promoting high-quality economic development: A literature Review. Contemp. Econ. Manag. 2018, 40, 11–17. [Google Scholar]
  52. Wang, M.J. How to recognize China’s economy shifting to high quality development stage—China’s Macroeconomic Research Institute studies and implements the report of the party’s 19th National Spirit Series Seminar. China Econ. Trade Her. 2018, pp. 63–68. Available online: http://www.cnki.net/KCMS/detail/detail.aspx?QueryID=163&CurRec=25&filename=ZJMD201801029&dbname=CJFDLAST2018&dbcode=CJFQ&pr=&urlid=&yx=&v=MjMzMDR1eFlTN0RoMVQzcVRyV00xRnJDVVJMS2VadWR0Rnlqa1ZML01QeWZHYXJHNEg5bk1ybzlIYllSOGVYMUw= (accessed on 12 November 2018). (in Chinese).
  53. Ren, B.P. Theoretical interpretation and practical orientation of China’s economy from high speed growth to high quality development in new era. Acad. Mon. 2018, 50, 66–74. [Google Scholar]
  54. Wang, M.; Gao, L. On Dawworth: High quality growth is a pressing issue. China Enterprise News. Available online: http://m.ccidnet.com/pcarticle/2767977 (accessed on 9 November 2018).
  55. Xu, C. Analysis of the causes of economic recession in Liaoning Province from the demand side. Times Finance 2018, 5, 120–121. [Google Scholar]
  56. The Eleventh Five-Year Plan. Available online: http://www.gov.cn/gongbao/content/2006/content_268766.htm (accessed on 14 March 2006).
  57. Shandong Water Resources Bulletin. 2016. Available online: http://www.shandong.gov.cn/art/2017/2010/2013/art_2529_10801.html (accessed on 13 October 2017).
  58. The Twelve Five-Year Plan. Available online: http://finance.people.com.cn/GB/14164290.html (accessed on 17 March 2011).
  59. The Thirteenth Five-Year Plan. Available online: http://www.xinhuanet.com//politics/2016lh/2016-03/17/c_1118366322.htm (accessed on 17 March 2016).
  60. Akiyama, T.; Kharrazi, A.; Li, J.; Avtar, R. Agricultural water policy reforms in China: A representative look at Zhangye City, Gansu Province, China. Environ. Monit. Assess. 2017, 190, 9. [Google Scholar] [CrossRef] [PubMed]
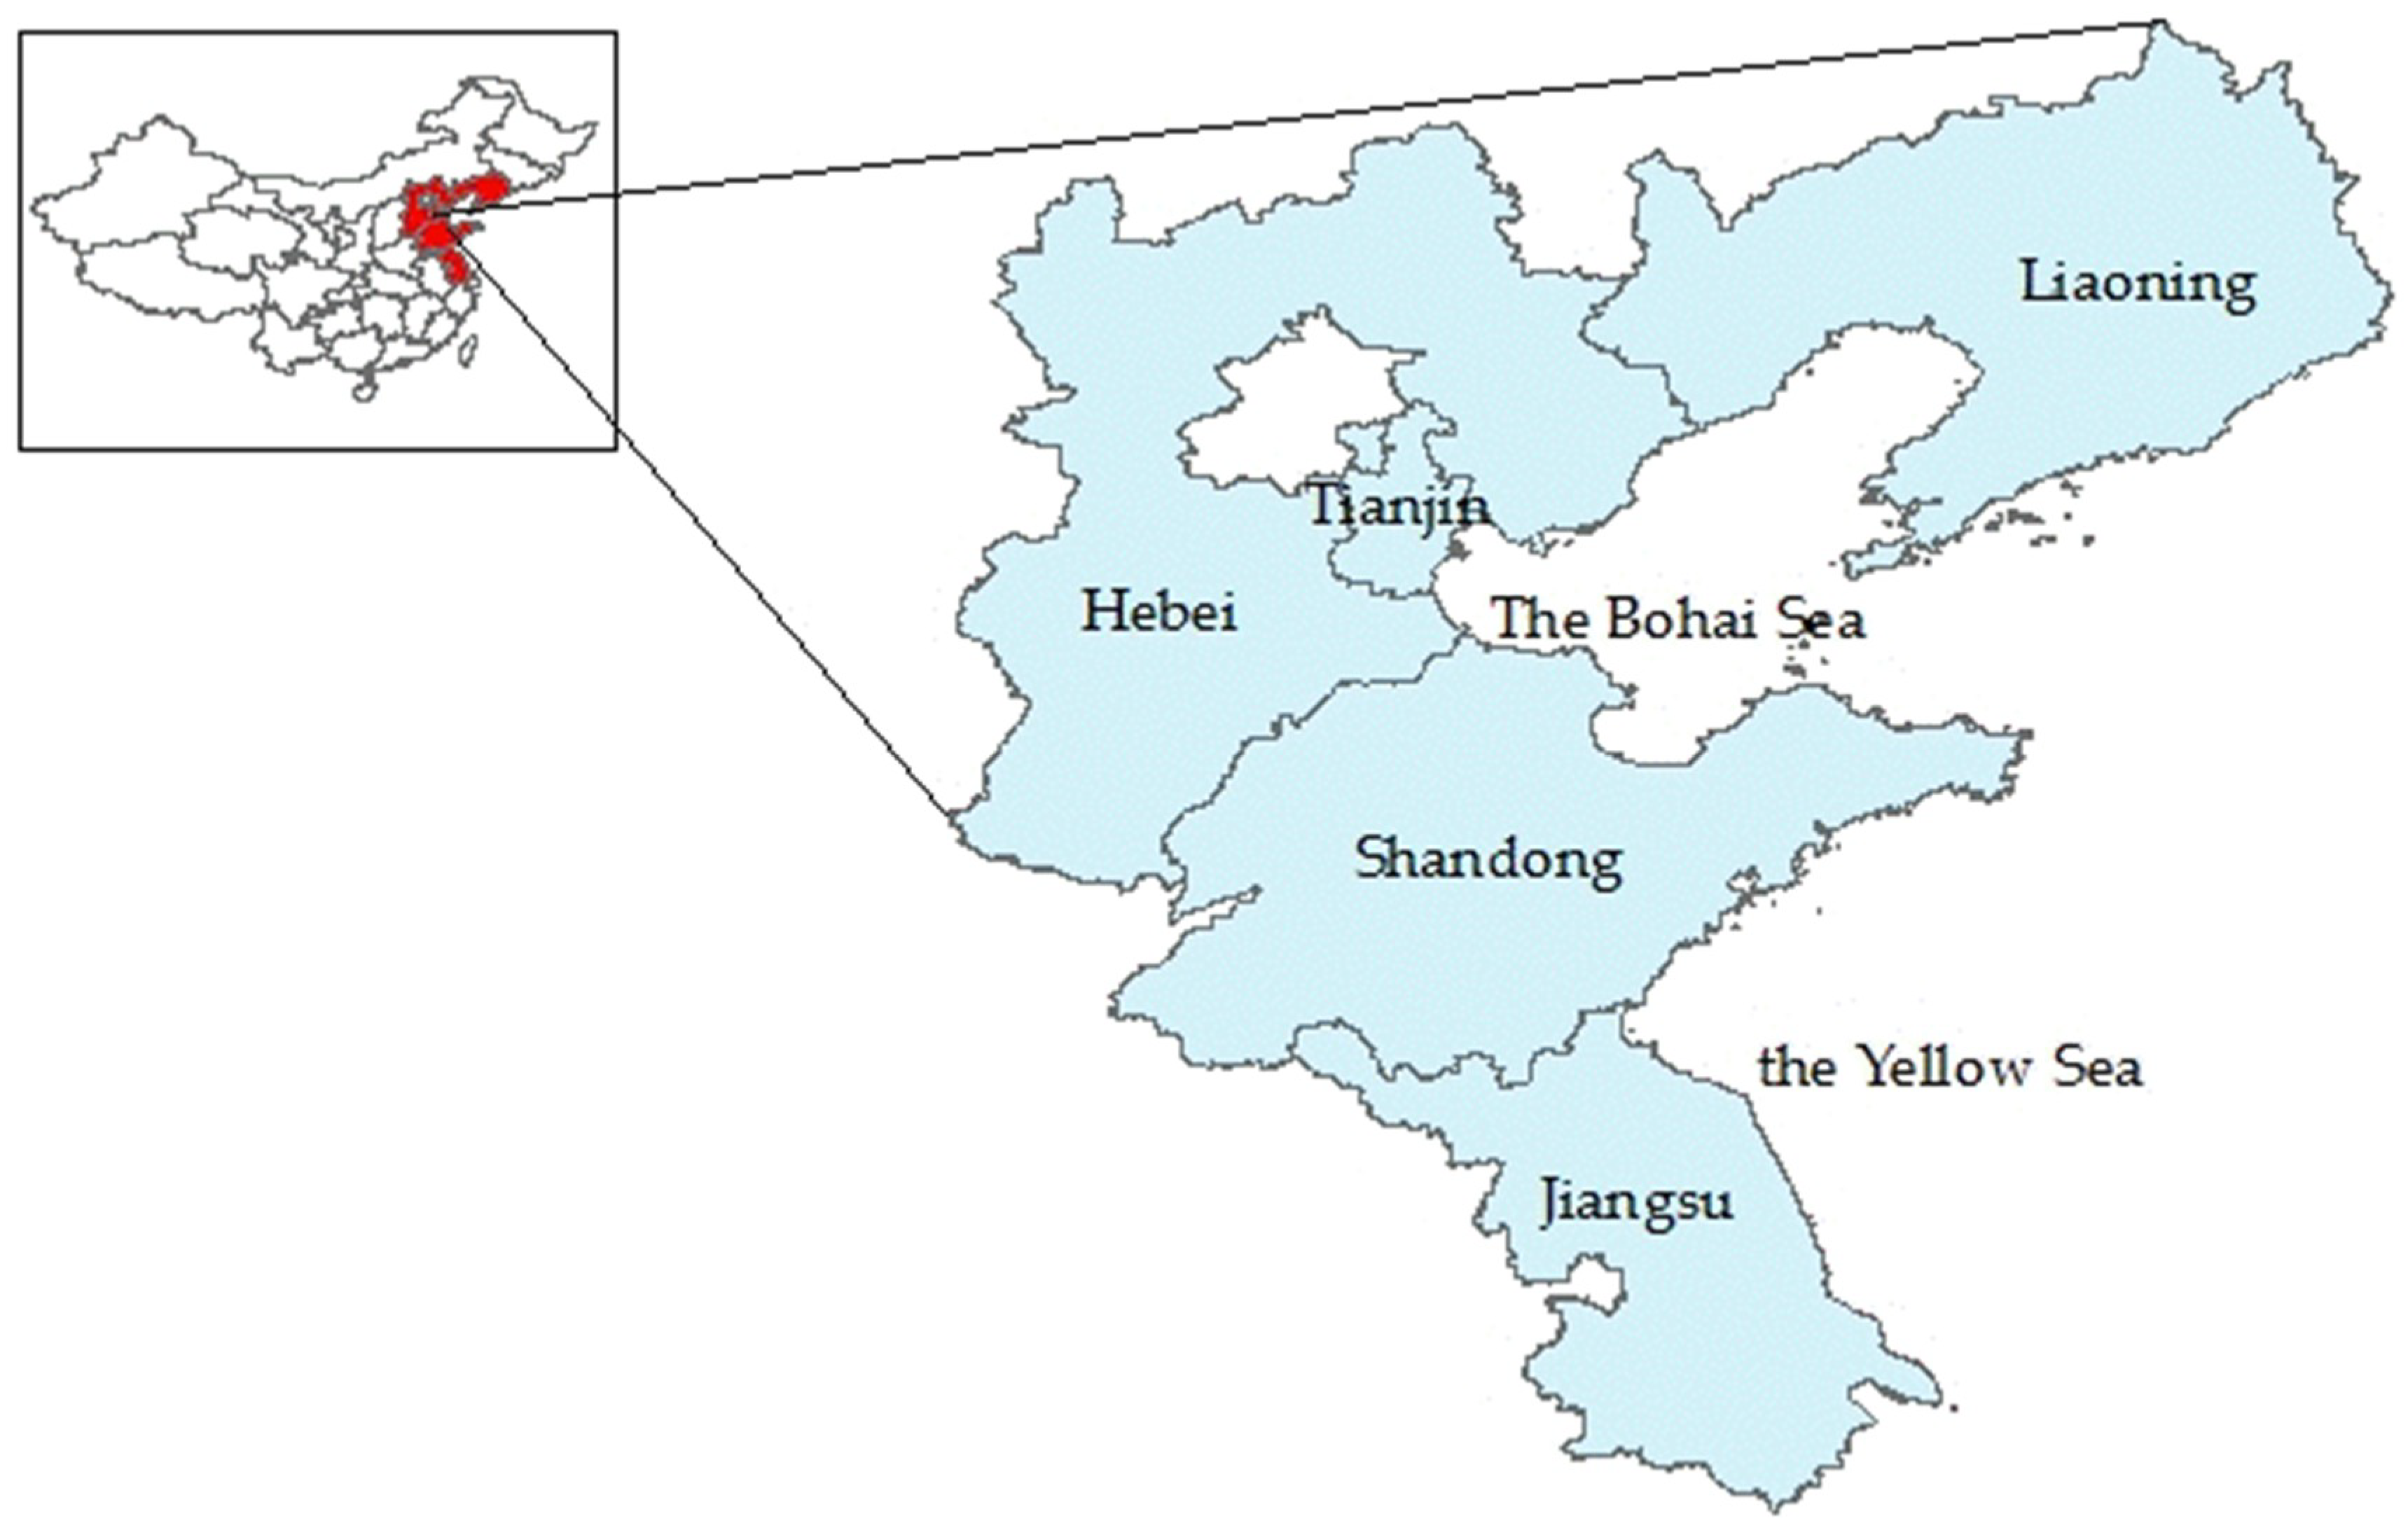
Figure 1. The location of the Yellow Sea and Bohai Sea on the map of China.
Sustainability 10 04158 g001
Figure 2. GDP trends in the coastal provinces and cities of the Yellow Sea and Bohai Sea.
Sustainability 10 04158 g002
Figure 3. Groundwater consumption in the coastal provinces and cities of the Yellow Sea and Bohai Sea.
Sustainability 10 04158 g003
Figure 4. Growth rate of groundwater consumption in the coastal provinces of the Yellow Sea and Bohai Sea.
Sustainability 10 04158 g004
Figure 5. Decoupling status of coastal provinces in the Yellow Sea and the Bohai Sea in 2006, 2011, and 2016.
Sustainability 10 04158 g005aSustainability 10 04158 g005b
Table 1. Judging criteria for the degree of decoupling between economic growth and groundwater consumption.
Decoupling TypeΔ G D P Δ U Decoupling Elasticity IndexDecoupling Timing Discrimination
Relative decouplingIncreaseIncrease>1.2Expansion relative negative decoupling (A)
IncreaseIncrease0 ≤ e < 0.8Expansion relative decoupling (B)
DeclineDecrease>1.2Declining relative decoupling (C)
DeclineDecrease0 ≤ e < 0.8Declining relative negative decoupling (D)
Absolute decouplingIncreaseDecrease−0.5 ≤ e < 0Expansion weak absolute decoupling (E)
IncreaseDecrease<−0.5Extended strong absolute decoupling (F)
DeclineIncrease−0.5 ≤ e < 0Declining weak absolute negative decoupling (G)
DeclineIncrease<−0.5Declining strong absolutely negative decoupling (H)
ConnectionIncreaseIncrease0.8 ≤ e ≤ 1.2Expansion connection (I)
DeclineDecrease0.8 ≤ e ≤ 1.2Recession connection (J)
Table 2. Decoupling between coastal economic growth and groundwater consumption in the Yellow Sea and Bohai Sea.
YearGDP Growth RateU Growth RateElastic ValueDecoupling State
20040.1441−0.048−0.336Expansion weak absolute decoupling (E)
20050.1421−0.0006−0.004Expansion weak absolute decoupling (E)
20060.14430.01580.110Expansion relative decoupling (B)
20070.1439−0.0116−0.081Expansion weak absolute decoupling (E)
20080.12380.03150.255Expansion relative decoupling (B)
20090.1231−0.073−0.591Extended strong absolute decoupling (F)
20100.1303−0.013−0.099Expansion weak absolute decoupling (E)
20110.1157−0.0024−0.134Expansion weak absolute decoupling (E)
20120.1011−0.035−0.220Expansion weak absolute decoupling (E)
20130.0946−0.0338−0.357Expansion weak absolute decoupling (E)
20140.0803−0.0163−0.203Expansion weak absolute decoupling (E)
20150.0735−0.0405−0.550Extended strong absolute decoupling (F)
20160.0627−0.039−0.629Extended strong absolute decoupling (F)
Table 3. Decoupling of economy and groundwater in the coastal provinces of the Yellow Sea and Bohai Sea in 2004–2016.
YearTianjinHebeiLiaoningJiangsuShandong
Elastic ValueDecoupling StateElastic ValueDecoupling StateElastic ValueDecoupling StateElastic ValueDecoupling StateElastic ValueDecoupling State
20040.00B−0.36E−0.33E−0.31E−0.38E
2005−0.10E0.24B−0.09E0.20B−0.29E
2006−0.20E0.07B0.30B−0.06E0.10B
20070.00B−0.06E0.02B−0.50F−0.15E
2008−0.45E−0.42E−0.07E−0.16E1.57A
2009−0.29E−0.10E0.09B−0.75F−1.64F
2010−0.10E0.07B0.02B−0.09E−0.48E
20110.10B−0.06E−0.40E1.46A−0.20E
2012−0.60F−0.24E−0.49E0.29B0.00B
20130.29B−0.54F−0.24E−0.53F−0.28E
2014−0.70F−0.27E−0.46E0.49B−0.12E
2015−0.81F−0.88F0.11B−0.73F−0.42E
2016−0.45E−0.95F1.09J−0.28E−0.13E
Table 4. Regression results of the natural logarithm of groundwater consumption by dependent variable.
Explanatory VariablesModel 1Model 2Model 3Model 4Model 5
LnF p 0.682 ***1.432 ***6.569 ***6.551 ***2.749***
(0.070)(0.227)(0.468)(0.474)(0.517)
LnU g −0.198 ***0.0031.403 ***1.392 ***1.030 ***
(0.103)(0.033)(0.138)(0.142)(0.100)
LnG w −1.620 ***−1.760 ***−0.520 ***−0.532−2.328 ***
(0.117)(0.116)(0.127)(0.131)(0.215)
LnA −0.903 ***−3.986 ***−3.981 ***−2.471 ***
(0.262)(0.308)(0.310)(0.260)
LnD c −5.067 ***−5.036 ***−2.101 ***
(0.444)(0.455)(0.436)
LnS 0.032−0.007
(0.088)(0.057)
Trend 0.056 ***
(0.006)
Constant term17.276 ***24.371 ***130.575 ***130.100 ***73.508 ***
(0.455)(2.105)(9.376)(9.533)(8.740)
F 131.504119.106326.837268.394566.286
R 2 0.8660.8880.9650.9650.986
Sample number6565656565
Note: The regression coefficients are standard errors in parentheses; ***, **, and * indicate significant levels at 1%, 5%, and 10%, respectively.