Article

Comparison of AHP and a Utility-Based Theory Method for Selected Vertical and Horizontal Forest Structure Indicators in the Sustainability Assessment of Forest Management in the Sierra de Guadarrama National Park, Madrid Region

by
Susana Martín-Fernández
*,
Adrián Gómez-Serrano
,
Eugenio Martínez-Falero
and
Cristina Pascual
ETSI Montes, Forestal y del Medio Natural, Universidad Politécnica de Madrid, Ciudad Universitaria sn, 28040 Madrid, Spain
*
Author to whom correspondence should be addressed.
Sustainability 2018, 10(11), 4101; https://doi.org/10.3390/su10114101
Submission received: 18 September 2018 / Revised: 2 November 2018 / Accepted: 5 November 2018 / Published: 8 November 2018
(This article belongs to the Special Issue Sustainable Forest Management)

Abstract

:
This paper compares two pairwise comparison methods, the analytic hierarchy process (AHP) and a utility theory based method (UTB method), for sustainability assessment in forest management at the local level. Six alternatives were ranked, corresponding to six different types of forest management in the Sierra de Guadarrama National Park in the Madrid Region in Spain. The methods were tested by postgraduate students enrolled in a “Decision Support Systems” course at Universidad Politécnica de Madrid. Three sustainability indicators were considered: structural diversity, timber yield, and amount of biomass. The utility theory based method was the first to be compared, which is implemented in the computer program SILVANET. For each pair of alternatives, the students were asked which one they considered to be more sustainable. In the case of the Analytic Hierarchy Process, the students compared the indicators and the alternatives for each indicator. The Spearman’s correlation coefficient indicated that there was no correlation between the rankings for most of the students. The results revealed that the convergence in opinion in the AHP method was higher than in the utility based method for a low number of participants, and distinguished the differences between the alternatives more accurately. However in the case of the UTB method, the participants considered sustainability as a whole and made a more context-based comparison.

1. Introduction

Since the United Nations Conference on the Environment (UNCED) in Rio de Janeiro in 1992, sustainability and the development of indicators for Sustainable Forest Management (SFM) have received greater attention, and have advanced [1]. The 1993 Helsinki resolution defined the term SFM in the European context as “the stewardship and use of forests and forest lands in a way, and at a rate, that maintains their biodiversity, productivity, regeneration capacity, vitality and their potential to fulfill, now and in the future, relevant ecological, economic and social functions, at local, national, and global levels, and that does not cause damage to other ecosystems” [2].
Several SFM processes have been enacted over the last 25 years to develop criteria and indicators for the conceptualization, monitoring and creation of a solid basis for decision-making at international, national, and local levels [1,3]. During this time, these criteria and indicators have evolved in line with the thinking on SFM and have gradually adapted to the changes in the ecological, economic and social aspects of the forest and to new demands from other processes such as the Convention on Climate Change or the UN Convention to Combat Desertification. However, all these international processes converge to similar principles that are also adopted in the global-United Nations definition of SFM as a “a dynamic and evolving concept [that aims] to maintain and enhance the economic, social, and environmental values of all types of forests, for the benefit of present and future generations”. Key issues like forest resources, afforestation/reforestation, health and vitality, damages, productive functions, biodiversity, protective functions, and economic issues are well covered by indicators in all C&I processes [4].
The Rio conference and the Montreal process marked the incorporation of public participation in forest decision-making. Criteria and indicators were developed to facilitate this public and stakeholder participation and societal consensus in SFM [1,3,5]. This has enabled citizens to influence issues concerning environmental and natural resources and forest management, such as sustainability assessment at the national, regional, and local level. Kates et al. (2001) [6] define sustainability assessment as “an evaluation of global to local integrated nature-society systems in short- and long-term perspectives in order to assist them to determine which actions should or should not be taken in an attempt to make society sustainable”. Sustainability assessment provides scientific support for decision making. Its outcomes improve participation, iteration and transparency in decision-making processes [7]. However, as sustainability is a far-reaching concept, it depends on socio-political meanings and environmental dynamics. Its assessment requires further development to be universally accepted [4,5,8,9]. There have been several initiatives at the country level, such as the one developed by FOREST EUROPE, UNECE, and FAO in 2011, and the one developed by UNECE/FAO in 2016. Both proposed experimental methods based on pan-European criteria and indicators for SFM, and were common for every country involved in the process [10,11].
This paper is framed at the local level in the Sierra de Guadarrama National Park. At this level, forest management plans are the main tool for SFM implementation; however C&I are top-down in their development, so in order to ensure the success of the plans, local conditions (forest types, economy, and traditions) must be taken into account [4], making it essential to obtain the participation of the local community.
One of the features of public participation in forest management is that the process must be adapted to the specific characteristics of the context in which it is to take place [12,13]. One of the greatest problems in currently available methods is their lack of flexibility [14]. Despite this, numerous studies have sought to design more generic processes for public participation that can be applied in various contexts such as negotiating national forest plans [12] or designing regional plans [15,16].
This study defines a process as the different forms of public participation, as described with their respective structures and procedures [17]; and methods are defined as the techniques used to obtain, analyze and synthesize—among other procedures—both qualitative and quantitative data [18].
The methods applied in the process depend on the phase of the process itself, the availability of resources and the prior experiences in public participation in the area. There is therefore no “most suitable” method for all contexts [14,19,20,21,22]. The choice of tools may affect the outcome of the process [23]. This is a key aspect, as in public participation processes the agreements that are reached after applying the corresponding method may derive in beneficial agreements [13] or become a focus of social conflict [24]. The most frequent methods applied in participatory processes in sustainable forest management and assessment are negotiations with stakeholders and voting systems [25,26,27,28,29,30,31], and multicriteria decision-making methods [31,32,33,34,35,36,37,38]. Another method for weighting criteria is the pair wise comparison. It stems from the Analytic Hierarchy Process (AHP), a decision-making framework developed by Thomas Saaty (1980) [39]. Specifically, AHP is the most popular multiple criteria decision support in public participation processes in forest management [19]. In fact, according to Esmail and Geneletti (2017) and Diaz-Balteiro and Romero (2008) [40,41], over 98 implementations of this tool have been recorded in nature conservation and forest management. AHP aims to break down the decision problem into a hierarchy, ordered from the highest-level objective—in this study sustainability—, middle level criteria, SFM indicators and alternatives, and forest sites with different management in the study area at the lowest level. AHP employs pairwise comparison of criteria and alternatives which are translated into weights. The utility theory based method (UTB method), following the developments of Fishburn—and hence utility theory—has been successfully applied to assess management sustainability and to determine stakeholders’ preferred management plan [42,43,44]. It is based on a direct (non-hierarchical) process of pairwise comparison of alternatives that show the same forest sites applied in AHP. The properties of each user’s preferences are analyzed and the alternatives are ordered according to a value function that expresses the number of pairs in which a specific forest site was considered to be more sustainable than the other site in the pair of alternatives. The UTB method has been implemented in the SILVANET computer program [45]. The users are shown pairs of alternatives and their characteristics, and also documentation on indicators and SFM available in the program. The user only has to tell the program which alternative he or she considers to be more sustainable. As output, the first SILVANET module ranks the alternatives, the second shows the user’s sustainability map of the study area, and the third shows the user’s management plan [43,44].
This study was carried out in the Sierra de Guadarrama National Park. The park is managed according to the 2009–2019 Sierra de Guadarrama Management Plan (DECRETO 96/2009). The collaboration of all the stakeholders, including administration, experts, the local community and the general public is essential for the design of this ordination plan and for any future modifications. This is why it is necessary to use the most appropriate tools to design the public participation processes when there is a wide variety of stakeholders, and to consider the objectives of the management plan in these processes.
For the choice of the SFM indicators used in this study we also considered the objectives of the plan: improvement of the forest structure, regulated exploitation of timber, the park’s function to reduce CO2 by increasing biomass. Finally, these indicators were: structural diversity, timber yield, and amount of biomass [43].
The main aim of this article is to contribute to determining the most suitable method for SFM assessment at the local level through stakeholder participation. Specifically, the objective is to analyze the differences and similarities in the results by comparing two methods based on pairwise comparison: one hierarchical (AHP), and another in which the sustainability of forest sites is directly compared (UTB method) and how their properties affect the results when assessing the sustainability of forest management at the local level in the Sierra de Guadarrama National Park.

2. Material and Methods
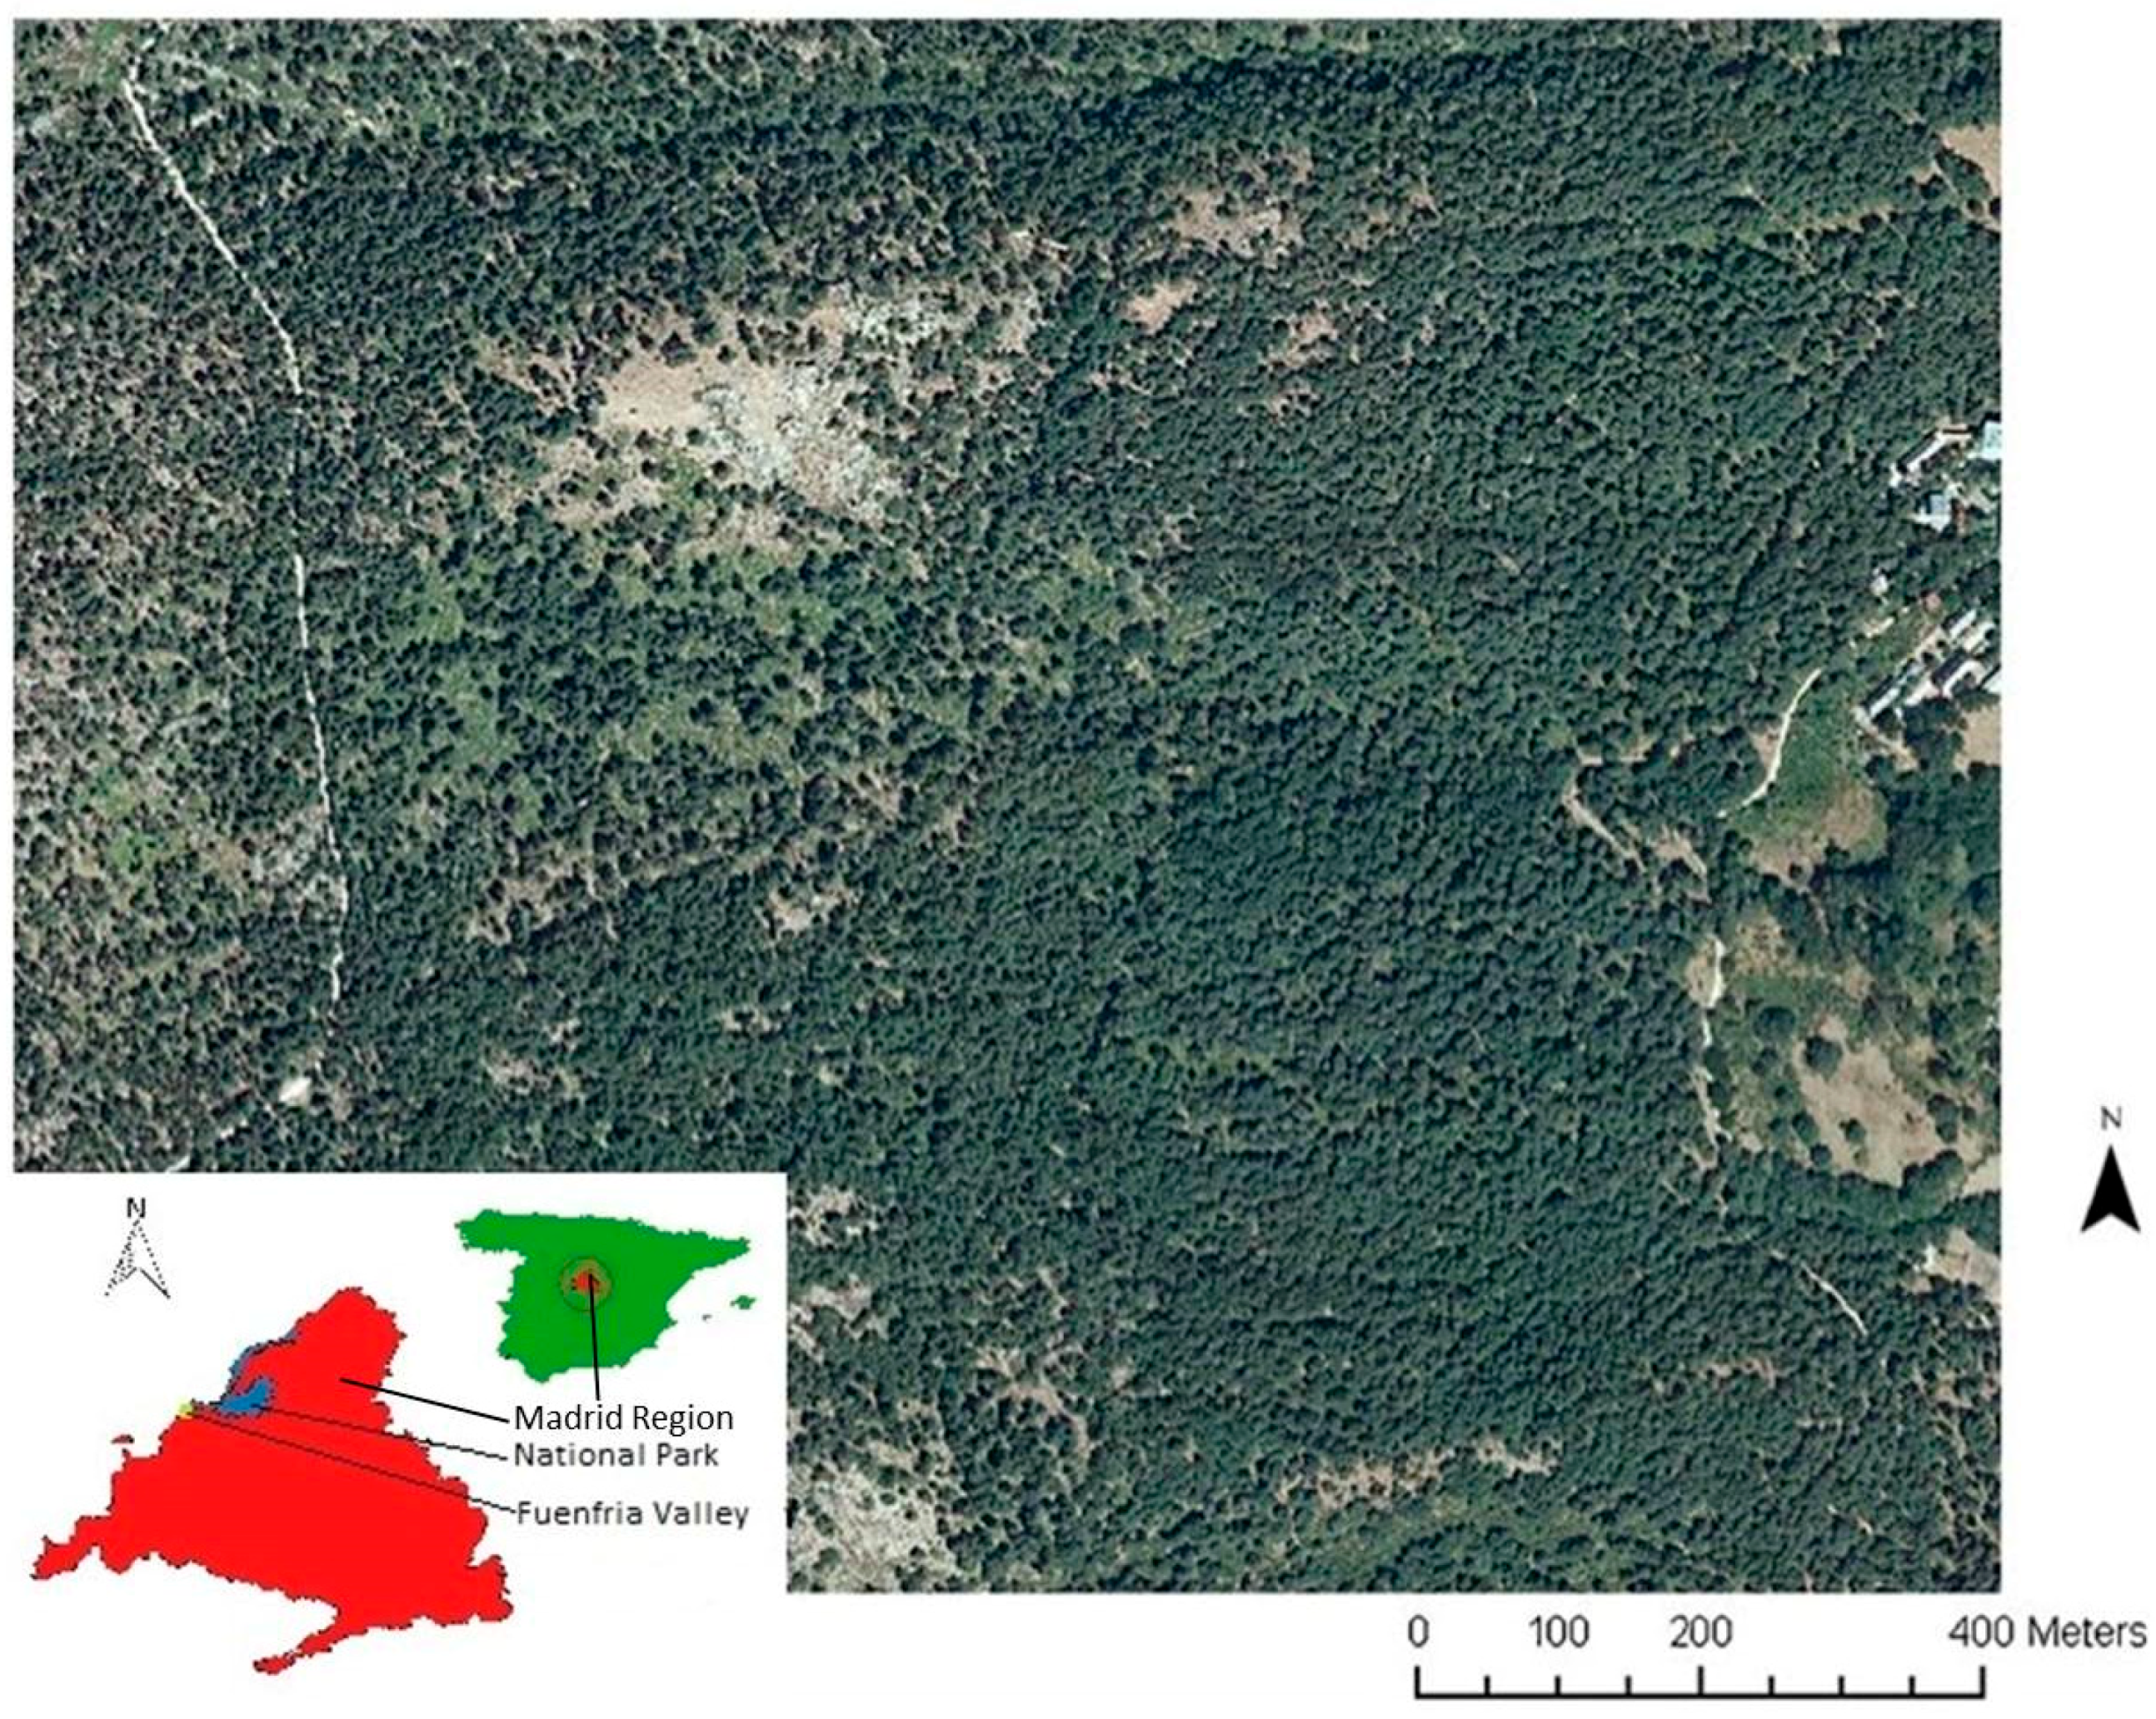
2.1. Study Area

The study area is located in the Fuenfría Valley in the Sierra de Guadarrama National Park (Madrid, Spain); see Figure 1. This park covers 34,000 ha in the northwest of the Madrid region and the south of the Castile-León region. The uses of the national park are recreational, conservational and productive.
The study area covers 127 ha (40°45′ N, 4°5′ W) of the national park in the Fuenfría Valley. Average altitude is 1520 m, average annual temperature is 9.4 °C, and average annual rainfall is 1180 mm.
The main species is Scots pine (Pinus sylvestris L.), with five different types of structure, as described by Pascual et al. (2008) [46]:
  • “Type 1: Uneven-aged forest (multi-layered canopy) with very high crown cover. Area: 26 ha.
  • Type 2: Multi-diameter forest with high crown cover. Area: 24 ha.
  • Type 3: Multi-diameter forest with medium crown cover. Area: 29 ha.
  • Type 4: Even-aged forest (single-story) with low crown cover. Area: 37 ha.
  • Type 5: Zones with scarce tree cover. Area: 11 ha.”
Table 1 shows a summary of the dendrometric characteristics of the forest [46].

2.2. Identifying the Alternatives

The sites or alternatives needed to represent the different management types in the study area. In our case we selected the six different forest sites or alternatives (N = 6) considered in the preference identification module in the SILVANET computer program. A method of similarity to an ideal point [47,48] was used to identify the alternatives. The ideal point (IP) was defined by Martin-Fernández and Martinez-Falero, 2018 [44] as “the theoretical point where the sustainability indicators would have the highest possible value of 100”. The value of the “Mahalanobis distance” [49] between the values of the sustainability variables (which ranged from 0 to 100) at any point, and the ideal point (IP) was obtained.
Table 2 shows the distances between all the alternatives finally selected and the IP.

2.3. Utility Theory Based Method

In this method, the participants directly compared the pairs of alternatives and indicated which one was more sustainable according to their preferences.
Pairwise comparison is represented by a binary relation (P) in the set of meaningful locations (Ω) with Ω Ω , which here designated the preference relation. This relation is expressed by a {1, 2, 3} matrix (pxy = 1 if, and only if, xPy (sustainability in alternative x is greater than in y); pxy = 2 if, and only if, yPx (sustainability in alternative y is greater than in x); otherwise, pxy = 3 if, and only if xIy (sustainability in x and in y is indifferent)). Figure 2 shows a participant’s preference matrix.
The individual’s preference type was then determined by analyzing the properties of the preference matrix. The properties fulfilled revealed the type of objective function. Table 3 shows which properties are fulfilled by each preference type. A detailed description can be seen in [45].
Since this method is based on the utility theory, it is necessary to formulate a value function. The value function used is described in Martinez-Falero et al. [45] as “the number of pairs in which the forest site, x, was considered by an individual to be more sustainable than the other element in the pair of alternatives. The value of u(x) may be from 0 to N − 1, so from 0 to 5”.
If the binary relation (P) was a linear order, then u ( x ) u ( y ) x y , x , y Ω . Therefore u(x) is the objective function for the participant. In another case, “the transitive closure” was applied to improve the linearity of the preference [50].
S 0 ( P ) = [ I P P I ] c d [ I P P I ] ; ;   S i ( P ) = S 0 ( S i 1 ( P ) )   for   i = 1 ,   2 ,  
where:
  • I P = { ( x , y ) : x I z   and   z P y   for   some   z Ω } ;
  • c ( P ) = { ( x , y ) : x   no P   y }   and   d ( P ) = { ( x , y ) : y P x }
“Transitivity closure” did not modify the individual’s preferences, so the value function could be calculated with the new matrix.

2.4. AHP Method

The analytic hierarchy process (AHP) was developed by Thomas L. Saaty (1977) [51], and is based on humans’ ability to use their own experience and knowledge to produce relative magnitudes through pairwise comparison [52]. According to Saaty (1977) [51]: “The purpose of the method is to enable the decision maker to structure a multi-criteria problem by building a hierarchical model”. In our case the structure had three levels: objective, criteria, and alternatives. The hierarchy structure of the objectives in our study is shown in Figure 3. In this figure, the first level of the structure corresponds to the objective of the AHP model in our study: “Ordering alternatives according to their sustainability”. This objective is broken down into three criteria corresponding to the indicators for structural diversity, timber yield and amount of biomass. Finally, the third level corresponds to the six alternatives, namely the six forest sites described in Section 2.2.
Pairwise comparisons were then performed between the criteria and the alternatives. The participants completed square matrices with the numerical values representing their preferences. The scale for the comparisons in this work was the nine-point scale developed by Saaty [39]. The values ranged from 1, “indifference in the preference” to 9 “much greater preference”.
Any comparison matrix, A, has three properties:
  • aij > 0, for all i, j
  • aij = 1, if there is indifference in the preference between elements i and j and aii = 1 for each i;
  • aji = 1/aij for each i, j.
To obtain the weights of the criteria and alternatives from the matrices we applied the eigenvector method proposed by Saaty [51].
Finally, weights and preferences are integrated through the following expression for each alternative:
X i   =   j = 1 3 W j X i j
where:
  • Xi is the integrated preference of alternative i.
  • Wj is the weight obtained for criteria j.
  • Xij is the preference of alternative i for criteria j.

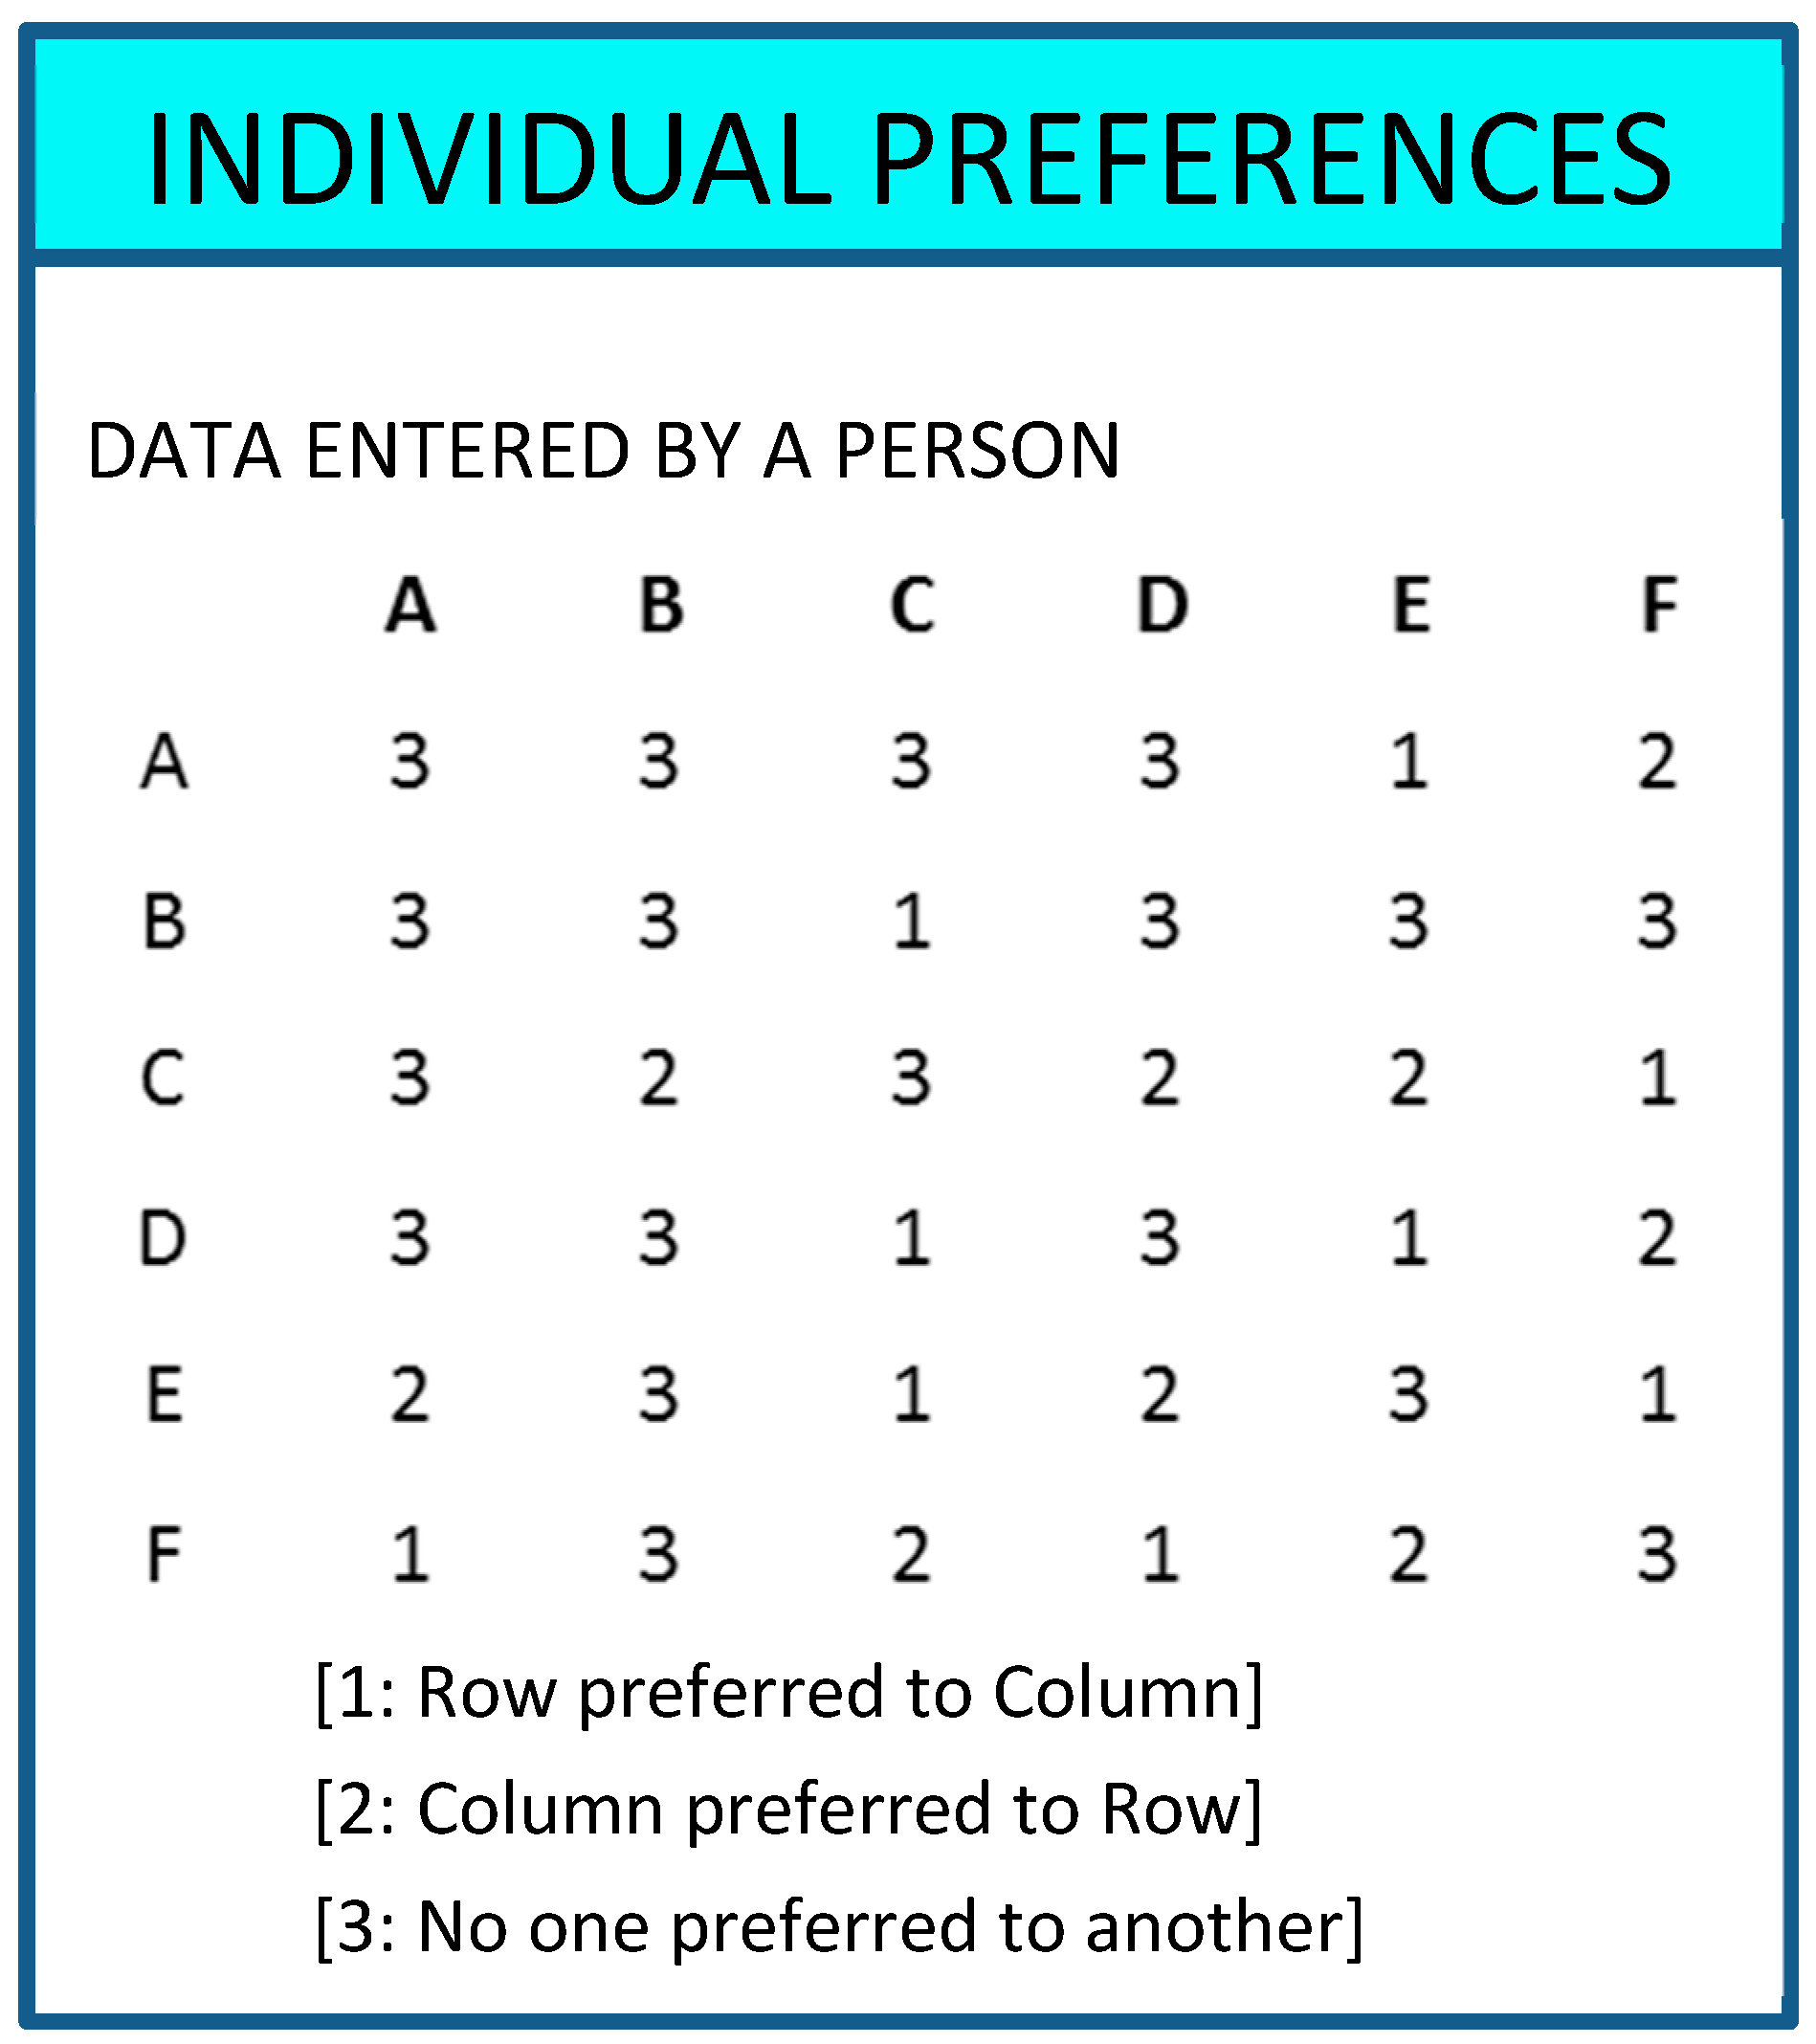
2.5. Transitivity of the Preference

In the case of Fishburn’s method, consistency was measured through the property of semitransitivity. The results for each participant were input in the SILVANET software [45] to verify the semitransitivity of each participant. For semitransitivity to exist, the preference matrix must meet the following conditions [42]:
1 : x P y   e   z P t   x P t   ó   t P y ,   x , y , z , t     Ω .   Also : 2 : x P y P z   x P t   ó   z P y ,   x , y , z , t     Ω  
This software incorporates algorithms that assess this property and indicate whether each participant has semitransitivity in their preferences or not.
In the AHP method, the property consistency expresses the degree of coherence in the judgments about the elements in a set.
A positive nxn matrix is consistent if aik = aijajk, for all i, j, k, so lmax = n, where lmax is the maximum eigenvalue of the matrix.
As a measure of consistency, Saaty (1980) [39] proposes the consistency ratio CR = CI/RI, where CI = (lmax − n)/(n − 1) is the consistency index, and RI was calculated using DeSchutter’s conjecture based on Saaty’s developments. According to DeSchutter, the relation between RI and n is:
R I   =   1.98 ( n 2 ) n
where 1.98 is the average consistency index when n goes from n = 3 to n = 15. In this study, as there are six alternatives (n = 6), RI is equal to 1.32.
If CR < 0.1, the preference is consistent and the estimate is accepted.
Consistency in the AHP method was calculated using the Microsoft Excel Professional 2010 program.

2.6. Preference Scoring

In this study the participative process took place without any interaction between the participants [22]. It was therefore necessary to control and monitor the results of the process, and not only to establish the method correctly [20]. 26 students (11 men and 15 women) were involved in this choice. The use of students to test participatory methods is an accepted research method [53]. The students were enrolled in the “Decision Support Systems” course in the master’s program on “Project planning in rural development and sustainable management” (Universidad Politécnica de Madrid) in the spring semester of 2016. 26.92% of the students were environmental or forest engineering graduates and 72.08% business administration or economics graduates. All the students were familiar with the methods applied in this study and with stakeholder participation in forest management, as recommended [19].
The choice problem and the indicators were initially presented to the students in the classroom. The students were shown specific information on each alternative, such as the indicator value, indicator maps and photographs of the forest sites, through the SILVANET computer application [43,45]. They were also provided with a handout summarizing this information.
Next, the students started the participatory process based on Fishburn’s developments. All the pairs of alternatives were compared in the same order as they appear in the SILVANET program. With the previous information available, the students were individually asked to complete the questionnaire shown in Table 4. The photographs of the alternatives can be seen in Figure 3.
The students then addressed the same decision case using AHP. Each student was given a form with the corresponding pairwise comparison tables: one table to compare the three indicators, and three 6 × 6 matrices to compare the alternatives for each indicator. The participants individually assigned their preference values using the AHP’s standard 1 through 9 scale.
The time required to complete the process was three hours in total.
The participants’ preference scores were returned to the researchers. The scores corresponding to the UTB method were input in the SILVANET program [45] to obtain the preference order of the alternatives and characterize each participant’s preference system. The scores corresponding to the AHP method were analyzed with Microsoft Excel Professional 2010 program to obtain the preference order of the alternatives for each student and the consistency of the preference.
After obtaining the results, the students were re-assembled for two purposes:
  • In the first meeting, students with an inconsistency of over 0.1 in the AHP method revised their preference matrices to reduce this inconsistency.
  • In the second meeting, they were presented with the results and asked their opinion of them and of the methods used.

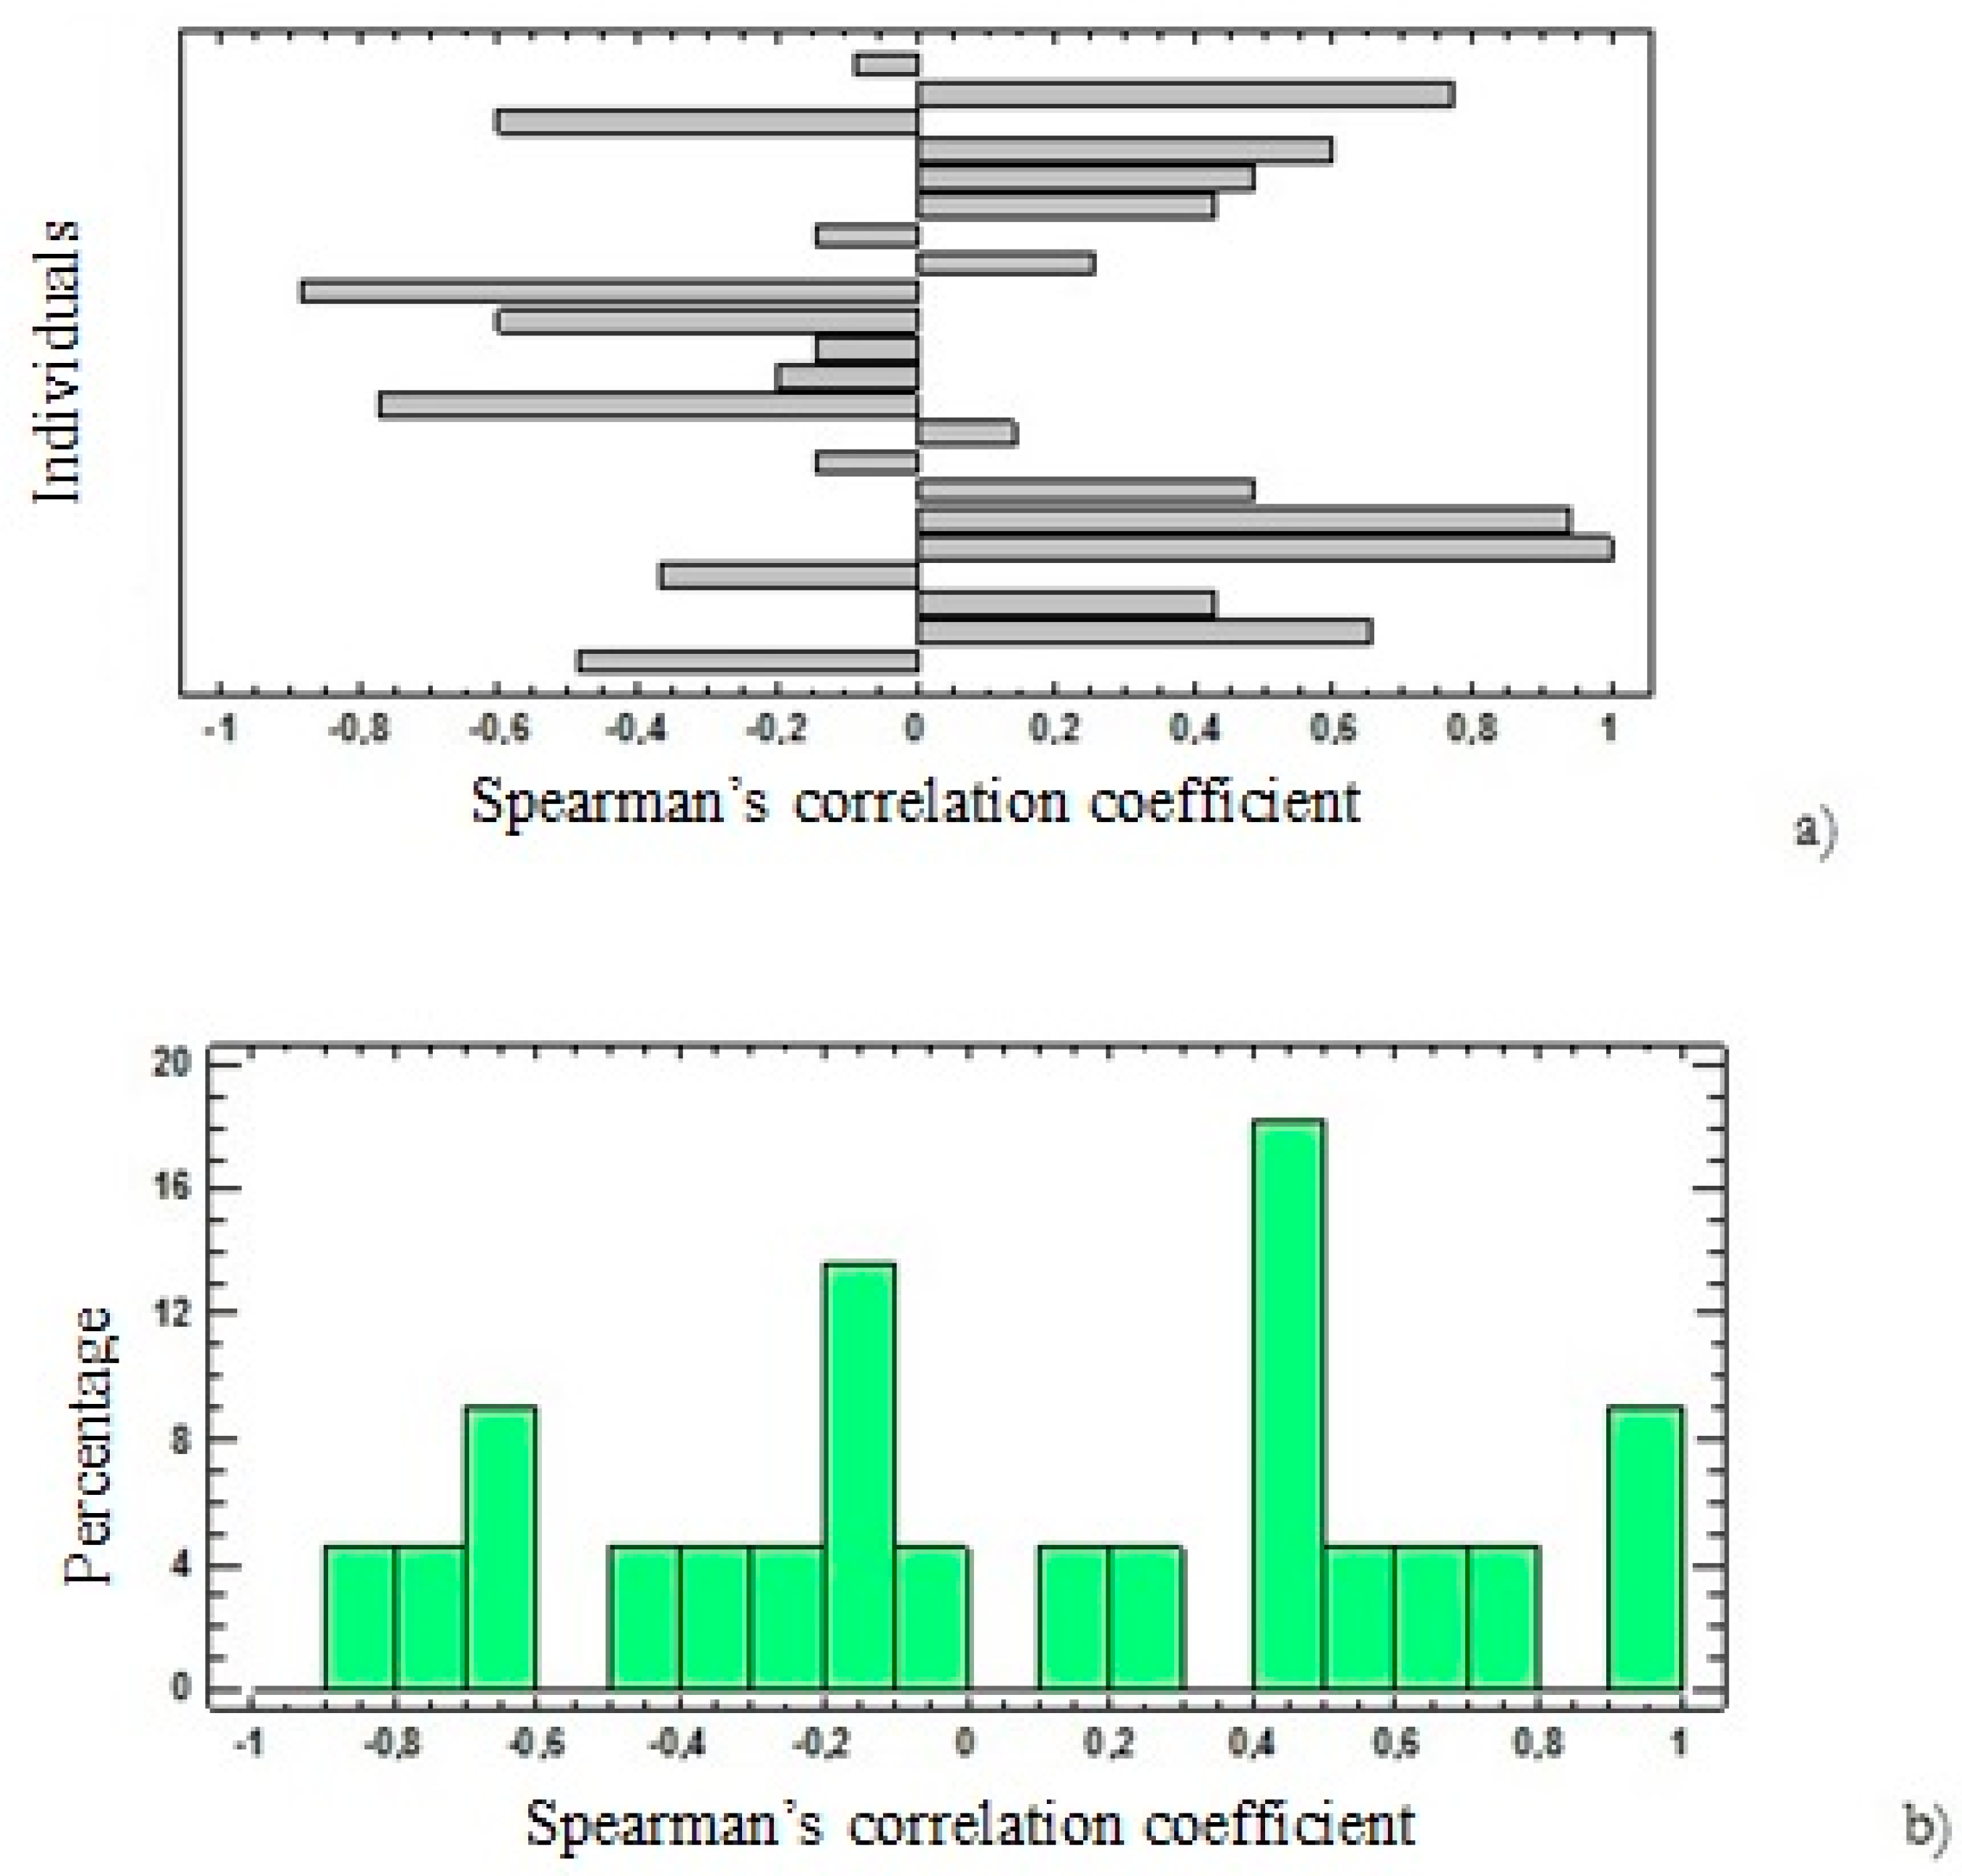
2.7. Quantifying the Differences in Results between Both Methods

After analyzing each participant’s preferences with each tool, the results were compared. The global results between the two methods were first verified. For each of the six orders of preference, the coincidences in percentage alternatives were calculated between the two methods, along with the distribution of the alternatives according to the method and order of preference.
The analysis was then done by calculating the Spearman’s rank correlation coefficient for each individual.
r i = 1 6 j = 1 M ( u i j v i j ) 2 M ( M 2 1 )
where uij and vij are the ranks of alternative j for participant i, M is the number of alternatives, and ri takes values from −1 to 1.
For a more detailed analysis, the number of coincidences in the place of any of the alternatives in both methods was calculated for each individual. An analysis of variance was also done to verify whether gender or education had influenced the results.
The Statgraphics Centurion XVII computer program was applied to obtain the statistical results of the study.

3. Results

The size of the final sample was 22 participants, nine men (40.91%) and 13 women (59.09%), as four of the participants did not use the AHP correctly. In terms of academic qualifications, six participants had qualifications in the environmental field (27.27%) and 16 in other fields (72.73%).
With regard to the global results of the study, Table 5 shows the distribution of the alternatives according to the order of preference for the two methods and for all the participants. The most preferred alternatives are highlighted in bold in Table 5.
In the case of the UTB method, the alternative chosen as the most sustainable was C together with D, followed by B and A in second place and F in third place. C once again appears in fourth place together with D. A appears again in fifth place, while the options considered least sustainable were E followed by F.
In the case of the AHP method, the alternative chosen as most sustainable was A, the second most sustainable was B, the third was C, fourth D, fifth E and the alternative considered by most users as the least sustainable was once again E, followed by F (chosen by 13 people).
In the analysis of the percentage of global coincidences (see Table 6), according to the order of preference, 63.6% of the 22 individuals coincide in their preferred alternative (order 1); 72.7% in the alternative in the second order of preference; and 54.5%, 81.8%, 72.7% and 77% in the third, fourth, fifth and sixth order respectively.
A comparison of the results of the two methods for each individual shows that the alternative considered most sustainable coincides in only eight of the 22 participants, 36% of the total (three chose A, three B and one C and D). Five of these eight participants were women and three men. Figure 4a shows the value of the Spearman’s rank correlation coefficient for each individual, and the histogram of the Spearman’s rank correlation coefficient variable (Figure 4b).
The Spearman’s rank correlation coefficients vary between −0.88 and 1, with a mean value of 0.08 and a standard deviation of 0.56. As can be seen in Figure 4, there are six cases in which the correlation coefficient is greater than 0.6 and two cases in which the coefficient is below −0.6, so the preferred alternative in one method is the least preferred in the other. According to the results of the Spearman’s rank correlation coefficient, only five participants showed a statistically significant correlation between the UTB and AHP methods, (p-value less than 0.05 for the null hypothesis, H0: r = 0). The rankings of the remaining 17 participants were uncorrelated.
The analysis of variance revealed that gender had no influence on the value of the Spearman’s rank correlation coefficient for a p-value of 0.702; and education had no effect for a p-value of 0.86. Residual hypotheses were also tested.
For the 22 individuals, the number of matching alternatives for each individual in any order between the two methods is shown in Figure 5.
With regard to the parameters for each method, the values for the value function of the UTB method were easy to obtain from the ranking of the alternatives. There were six individuals for whom the utility function attained the highest value for alternative C. u(C) = 5, and was the alternative most frequently assessed as the most sustainable for this method. In terms of the alternatives considered the least sustainable, there were three individuals for whom u(F) = 1 and u(E) = 0 at the same time, and three for whom u(E) = 1 and u(F) = 0.
With regard to the transitivity of the preference, in the case of Fishburn the preference of 70% of the participants complied with the property of transitivity or semitransitivity [42]. The chi-square test of homogeneity was used to analyze whether there was any relation between the presence of transitivity and gender and education, and in both cases the variables were independent for a p-value of 0.0002.
In the case of the AHP method, 73% of the participants initially presented inconsistency in some of the preference matrices. After revising the preference matrices, 72% of the participants’ CR < 0.1.
Comparing the results in the evaluation process, in the UTB method, the participants considered which forest management alternative was most likely to maintain biodiversity and productivity in the future, so which one was most sustainable; while in the AHP method they explained that it was easier to focus only on the criteria rather than on the relation between sustainability and criteria. For 70% of the participants, both methods adequately reflected their preferences, although the rankings did not always match. They considered AHP to be time-consuming, and became distracted, which was the main reason they failed to keep track of the evaluations of some alternatives compared to others. Finally, they were asked which method they preferred. 15% preferred the UTB method, 25% AHP, and both methods were preferred equally by 60%.

4. Discussion

This article compares the AHP and utility based methods for measuring the sustainability of forest management at the stand level. One significant advantage of applying these tools is that they can gather both objective and qualitative information, expert knowledge, and subjective preferences [19,42]. The results of the application of the two tools allow us to conclude that there is a clear difference between them. The percentage of coincidence is low in both the alternatives indicated as the most sustainable and in the comparison of the order of all the alternatives.
The process began with a sample size of 26 individuals, but due to errors by four participants in the AHP method and their unavailability to review these errors, the final sample size was 22 individuals. For the case of the AHP method, this reduction in sample size does not affect the reliability of the results. Several studies can be found in the literature that apply the AHP method with a fewer than 25 participants [54,55,56]. In the case of the UTB method, in a previous work [44] the sample size was fifty individuals, and the sampling error was 13%. In that case the participants were visitors to the Sierra of Guadarrama National Park, with significant differences in their backgrounds. In our study the participants’ profile is quite similar, although there is more variability in the preferences compared to AHP results. Further research is needed to identify the appropriate sample size for this method.
Knowledge of the methods and objectives of the participation process makes it easier to obtain convergent results [57]. In the case of the UTB method, the SILVANET program provides comprehensive information on SFM, indicators and alternatives, and the use of the program is self-explanatory. The users do not require any previous knowledge of SFM [44]. However, when working with AHP the user will need to be familiar with the decision scale and the properties of the method, and with the objective, criteria and alternatives to be assessed. In the study case, all the participants were familiar with both the methods and SFM, and were also supported by the researchers during the experiment.
In regard to the global results when applying the UTB method, the preference of the alternatives does not follow any specific pattern. The preferred alternative (order 1) is almost uniformly distributed between alternatives A, B, C, and D. Second-order preferences are A and B, and the least preferred are clearly E and F. However, there is no clearly preferred alternative in the third, fourth and fifth order. The users were able to distinguish two sets of alternatives, one formed by the alternatives in which the value of the indicators is highest (A, B, C) and another with the alternatives whose indicators had the lowest value in terms of the ideal point, IP (E and F). In the case of AHP, there is convergence and a pattern in the combined opinion. The order of preference of the alternatives is the same as the order of proximity of the alternatives to the ideal point. That is, alternative A was the most preferred, and is the closest to the ideal point, followed by B, C, D; alternatives E and F are in fifth and sixth place, and are farthest from the ideal point.
AHP therefore makes it possible to distinguish the differences between the alternatives more accurately. When comparing alternatives to indicators, the participants’ comments suggest that the AHP method is more structured and the concept of indicators is easier to understand than sustainability, indicating that the criterion prevails over the objective. The characteristics of each method therefore influence the order of the alternatives.
This conclusion may help in the choice of method, the number and differences among alternatives in a participatory process in the Guadarrama National Park.
The results of the Spearman’s rank correlation showed that the rankings of 17 of the participants were uncorrelated, demonstrating again that the method influenced the decision outcome [21,58].
Since preferences are expressed in a subjective manner in both methods, it is reasonable for there to be some kind of inconsistency [59]. The results concurred particularly in the case of the UTB method, since the participants could consider sustainability as a whole and make a more context-based comparison. In previous public participatory processes with the UTB method, the participants’ results also concurred [44]. 70% of the participants fulfilled the transitivity requirements for this method. However, inconsistency problems were found in the AHP method. Due to the high number of comparisons—96 per individual—the process was excessively long and produced conflicting judgments when weighting indicators and alternatives [19]. Saaty (2006) points out that most AHP respondents are never consistent [60]. In the case of inconsistency, the AHP recommends inviting the respondents to rethink their opinion of the elements evaluated, as in this study. When choosing between these methods, the decision-makers must consider the problems of inconsistency, the time required in the SFM process, the participants’ previous knowledge of the AHP method and the lack of precision of the UTB method to distinguish the characteristics of each alternative in detail.

5. Conclusions

There is currently no standard public participation method in SFM. Our paper focuses on assessing and comparing individual preferences using two methods, AHP and UTB, to evaluate and order alternatives for forest management at the stand level according to sustainability. AHP is a very useful method when the number of criteria and alternatives is not very high. The structuring of objectives facilitates the evaluation. The main conclusion of this study is that the AHP method is more suitable for use with participants who are experts or closely involved with the objective to be assessed, which avoids problems of inconsistency and distinguishes the differences between the alternatives more accurately. The UTB method is very useful in online public participation processes that are open to all types of stakeholders, but is less precise to identify differences among alternatives compared to AHP.

Author Contributions

Conceptualization, S.M.-F. and E.M.-F.; Data curation, A.G.-S. and C.P.; Formal analysis, S.M.-F. and A.G.-S.; Writing—original draft, A.G.-S. and C.P.; Writing—review & editing, S.M.-F. and E.M.-F.

Funding

This research received no external funding.

Acknowledgments

We would like to thank the students involved in the participatory process for their important contribution to this research, and the three anonymous reviewers for their constructive comments and suggestions to improve the quality of the paper.

Conflicts of Interest

The authors declare no conflict of interest.

References

  1. United Nations. Earth Summit Agenda 21, The United Nations Program of Action from Rio; United Nations: Bali, Indonesia, 1992; Available online: https://sustainabledevelopment.un.org/content/dsd/agenda21/index.shtml (accessed on 12 October 2018).
  2. CPFE. Resolution H1 General Guidelines for the Sustainable Management of Forests in Europe. In Proceedings of the Second Ministerial Conference on the Protection of Forests in Europe, Helsinki, Finland, June 1993; Available online: https://foresteurope.org/ministerial-conferencies/ (accessed on 12 October 2018).
  3. Montréal Process Working Group. Montréal Process Criteria and Indicators for the Conservation and Sustainable Management of Temperate and Boreal Forests. Technical Notes on Implementation of the Montréal Process Criteria and Indicators Criteria. 2009, pp. 1–7. Available online: https://www.montrealprocess.org/documents/publications/general/2009/2009p_4.pdf (accessed on 13 September 2018).
  4. Linser, S.; Wolfslehner, B.; Asmar, F.; Bridge, S.R.J.; Gritten, D.; Guadalupe, V.; Jafari, M.; Johnson, S.; Laclau, P.; Robertson, G. 25 Years of Criteria and Indicators for Sustainable Forest Management: Why Some Intergovernmental C&I Processes Flourished While Others Faded. Forests 2018, 9, 515. [Google Scholar] [CrossRef]
  5. Linser, S.; Wolfslehner, B.; Bridge, S.R.J.; Gritten, D.; Johnson, S.; Payn, T.; Prins, K.; Raši, R.; Robertson, G. 25 Years of Criteria and Indicators for Sustainable Forest Management: How Intergovernmental C&I Processes Have Made a Difference. Forests 2018, 9, 578. [Google Scholar] [CrossRef]
  6. Kates, R.W.; Clark, W.C.; Corell, R.; Hall, M.J.; Jaeger, C.C.; Lowe, I.; McCarthy, J.J.; Schellnhuber, H.J.; Bolin, B.; Dickson, N.M. Sustainability science. Science 2001, 292, 641–642. [Google Scholar] [CrossRef] [PubMed]
  7. Zijp, M.C.; Heijungs, R.; Van der Voet, E.; Van de Meent, D.; Huijbreggrs, M.; Hollander, A.; Posthuma, L. An identification key for selecting methods for sustainability assessment. Sustainability 2015, 7, 490–512. [Google Scholar] [CrossRef] [Green Version]
  8. Ness, B.; Urbel-Piirsalu, E.; Anderberg, S.; Olsson, L. Categorising tools for sustainability assessment. Ecol. Econ. 2007, 60, 498–508. [Google Scholar] [CrossRef]
  9. Reynolds, K.M.; Thomson, A.J.; Köhl, M.; Shannon, M.A.; Ray, D.; Rennolls, K. Sustainable Forestry from Monitoring and Modelling to Knowledge Management & Policy Science; CAB International: Wallingford, UK, 2007; p. 527. [Google Scholar]
  10. Forest Europe; UNECE; FAO. State of Europe’s Forests 2011: Status and Trends in Sustainable Forest Management in Europe; Forest Europe Liaison Unit: Oslo, Norway, 2011; ISBN 978-82-92980-05-7. [Google Scholar]
  11. UNECE; FAO. Pilot Project on the System for the Evaluation of the Management of Forests (SEMAFOR); United Nations: Geneva, Switzerland, 2017; p. 167. ISBN 978-92-1-117123-5. [Google Scholar]
  12. Appelstrand, M. Participation and societal values: The challenge for lawmakers and policy practitioners. For. Policy Econ. 2002, 4, 281–290. [Google Scholar] [CrossRef]
  13. FAO-ECE-ILO. Public Participation in Forestry in Europe and North America: Report of the FAO/ECE/ILO 163; International Labor Organization: Geneva, Switzerland, 2000; p. 119. [Google Scholar]
  14. Bruña-García, X.; Marey-Pérez, M.F. Public participation: A need of forest planning. iForest 2014, 7, 216–226. Available online: http://www.sisef.it/iforest/contents/?id=ifor0979-007 (accessed on 10 November 2018). [CrossRef]
  15. Bruña-García, X.; Marey-Pérez, M.F. El proceso de participación pública forestal en un contexto rural sin experiencia previa en participación. In Montes, Servicios y Desarrollo Rural, 6th Congreso Forestal Español; Sociedad Española de Ciencias Forestales: Vitoria Gasteiz, Spain, 2013; pp. 2–14. ISBN 978-84-937964-9-5. [Google Scholar]
  16. Bettelini, D.; Cantiani, M.G.; Mariotta, S. Experiences in participatory planning of designated areas: The Bavona Valley in Switzerland. Forestry 2000, 73, 187–198. [Google Scholar] [CrossRef]
  17. Renn, O.; Webler, T.; Wiedemann, P. Fairness and Competence in Citizen Participation: Evaluating Models for Environmental Discourse; Springer: New York, NY, USA, 1995; p. 367. ISBN 978-94-011-0131-8. [Google Scholar]
  18. Vidueira, P.; Díaz-Puente, J.M.; Afonso, A. The Worldwide Expansion of Evaluation: A World of Possibilities for Rural Development. Cuadernos de Desarrollo Rural 2013, 10, 159–180. [Google Scholar]
  19. Kangas, J.; Kangas, A. Multiple criteria decision support in forest management—The approach, methods applied, and experiences gained. For. Ecol. Manag. 2005, 207, 133–143. [Google Scholar] [CrossRef]
  20. Cantiani, M.G. Forest planning and public participation: A possible methodological approach. iForest 2012, 5, 72–82. Available online: http://www.sisef.it/iforest/contents/?id=10.3832/ifor0602-009 (accessed on 20 July 2018). [CrossRef]
  21. Linder, W.; Lanfranchi, P.; Schnyder, D.; Vatter, A. Procédures et Modèles deParticipation–Propositions pour une Politique de Participation de la Confédération Selon l’art. 4 LAT; Office Fédéral de l’Aménagement du Territoire, OCFIM: Berne, Switzerland, 1992; p. 130. [Google Scholar]
  22. Loikkanen, T.; Simojoki, T.; Wallenius, P.; Metsaehallitus, V. Participatory Approach to Natural Resource Management: A Guide Book; Finnish Forest and Park Service, Suomen Graafiset Pavelut Oy Ltd.: Kuopio, Finland, 1999; p. 96. ISBN 952-446-130-7. [Google Scholar]
  23. Vainikainen, N.; Kangas, A.; Kangas, J. Empirical study on voting power in participatory forest planning. J. Environ. Manag. 2008, 88, 173–180. [Google Scholar] [CrossRef] [PubMed]
  24. Stenseke, M. Local participation in cultural landscape maintenance: Lessons from Sweden. Land Use Policy 2009, 26, 214–223. [Google Scholar] [CrossRef]
  25. Abee, A. Application of criteria and indicators of sustainable resource management in the United States. In Sustainable Forestry from Monitoring and Modelling to Knowledge Management & Policy Science; Reynolds, K.M., Thomson, A.J., Köhl, M., Shannon, M.A., Ray, D., Rennolls, K., Eds.; CAB International: Wallingford, UK, 2007; pp. 75–102. ISBN 1845931742. [Google Scholar]
  26. Duffy, D.M.; Roseland, M.; Gunton, T.I. A preliminary assessment of shared decision-making in land use and natural resource planning. Environments 1996, 23, 1–16. Available online: https://search.proquest.com/docview/207672879?pq-origsite=gscholar (accessed on 13 September 2018).
  27. Forestry Commission. Summary Results of the 2003 UK Survey of Public Opinion of Forestry; Forestry Commission: Edinburgh, UK, 2003; p. 34. [Google Scholar]
  28. Hiltunen, V.; Kangas, J.; Pykäläinen, J. Voting methods in strategic forest planning—Experiences from Metsähallitus. For. Policy Econ. 2008, 10, 117–127. [Google Scholar] [CrossRef]
  29. Kouplevatskaya, I. Participation as a new mode of governance? Scientists and policymakers linked in a double spiral. In Sustainable Forestry from Monitoring and Modelling to Knowledge Management & Policy Science; Reynolds, K.M., Thomson, A.J., Köhl, M., Shannon, M.A., Ray, D., Rennolls, K., Eds.; CAB International: Wallingford, UK, 2007; pp. 35–56. ISBN 1845931742. [Google Scholar]
  30. Laukkanen, S.; Palander, T.; Kangas, J.; Kangas, A. Evaluation of the multicriteria approval method for timber-harvesting group decision support. Silva Fenn. 2005, 39, 249–264. [Google Scholar] [CrossRef]
  31. Sheppard, R.J.; Meitner, M. Using multi-criteria analysis and visualisation for sustainable forest management planning with stakeholder groups. For. Ecol. Manag. 2005, 207, 171–187. [Google Scholar] [CrossRef]
  32. Díaz-Balteiro, L.; Romero, C. Sustainability of forest management plans: A discrete goal programming approach. J. Environ. Manag. 2004, 71, 351–359. [Google Scholar] [CrossRef] [PubMed]
  33. Mendoza, G.A.; Prabhu, R. Qualitative multi-criteria approaches to assessing indicators of sustainable forest resource management. For. Ecol. Manag. 2003, 174, 107–126. [Google Scholar] [CrossRef]
  34. Mendoza, G.A.; Prabhu, R. Combining participatory modeling and multicriteria analysis for community-based management. For. Ecol. Manag. 2005, 207, 145–156. [Google Scholar] [CrossRef]
  35. Sugimura, K.; Howard, T.E. Incorporating social factors to improve the Japanese forest zoning process. For. Policy Econ. 2008, 10, 161–173. [Google Scholar] [CrossRef]
  36. Thomson, A.J. How should we manage knowledge ecosystems? Using additive knowledge management. In Sustainable Forestry from Monitoring and Modelling to Knowledge Management & Policy Science; Reynolds, K.M., Thomson, A.J., Köhl, M., Shannon, M.A., Ray, D., Rennolls, K., Eds.; CAB International: Wallingford, UK, 2007; pp. 461–480. ISBN 1845931742. [Google Scholar]
  37. Mustajoki, J.; Saarikoski, H.; Marttunen, M.; Ahtikoski, A.; Hallikainen, V.; Helle, T.; Hyppönen, M.; Jokinen, M.; Naskali, A.; Tuulentie, S.; et al. Use of decision analysis interviews to support the sustainable use of the forests in Finnish Upper Lapland. J. Environ. Manag. 2011, 92, 1550–1563. [Google Scholar] [CrossRef] [PubMed]
  38. Ocampo-Melgar, A.; Bautista, S.; de Steiguer, J.E.; Orr, B.J. Potential of an outranking multi-criteria approach to support the participatory assessment of land management actions. J. Environ. Manag. 2017, 195, 70–77. [Google Scholar] [CrossRef] [PubMed]
  39. Saaty, T.L. The Analytic Hierarchy Process; McGraw Hill: New York, NY, USA, 1980; p. 286. [Google Scholar]
  40. Esmail, B.A.; Geneletti, D. Multi-criteria decision analysis for nature conservation: A review of 20 years of applications. Methods Ecol. Evol. 2017, 42–53. [Google Scholar] [CrossRef]
  41. Díaz-Balteiro, L.; Romero, C. Making forestry decisions with multiple criteria: A review and an assessment. For. Ecol. Manag. 2008, 255, 3222–3241. [Google Scholar] [CrossRef]
  42. Fishburn, P.C. Interval Orders and Interval Graphs: A Study of Partially Ordered Sets; John Wiley: New York, NY, USA, 1985; p. 230. ISBN 978-0471812845. [Google Scholar]
  43. Martínez-Falero, J.E.; Ayuga-Tellez, E.; Gonzalez-Garcia, C.; Grande-Ortiz, M.A.; Sánchez De Medina, A. Experts’ Analysis of the Quality and Usability of SILVANET Software for Informing Sustainable Forest Management. Sustainability 2017, 9, 1200. [Google Scholar] [CrossRef]
  44. Martín-Fernández, S.; Martinez-Falero, E. Sustainability assessment in forest management based on individual preferences. J. Environ. Manag. 2018, 206, 482–489. [Google Scholar] [CrossRef] [PubMed]
  45. Martinez-Falero, E.; Martín-Fernández, S.; García-Abril, A. SILVANET: Participación Pública Para la Gestión Forestal Sostenible; Fundación Conde del Valle de Salazar: Madrid, Spain, 2010; p. 106. ISBN 978-84-96442-36-8. [Google Scholar]
  46. Pascual, C.; García-Abril, A.; GarcÍa-Montero, L.G.; Martín-Fernández, S.; Cohen, W.B. Object-based semi-automatic approach for forest structure characterization using lidar data in heterogeneous Pinus sylvestris stands. For. Ecol. Manag. 2008, 255, 3677–3685. [Google Scholar] [CrossRef]
  47. Zeleny, M. Multiple Criteria Decision Making; McGraw-Hill: New York, NY, USA, 1982; p. 563. ISBN 9780070727953. [Google Scholar]
  48. Zhiqiang, L.; Xue, Y.; Qiu, Z.; Xu, Z.; Zhang, X.; Zhou, B.; Wang, X. AHP-Ideal Point Model for Large Underground Petroleum Storage Site Selection: An Engineering Application. Sustainability 2017, 9, 2343. [Google Scholar] [CrossRef]
  49. Mahalanobis, P.C. On the Generalised Distance in Statistics; National Institute of Science of India: Brahmapur, India, 1936; Volume 2, pp. 49–55. [Google Scholar]
  50. Nishimura, H. The transitive core Inference of welfare from nontransitive preference relations. Theor. Econ. 2018, 13, 579–606. [Google Scholar] [CrossRef]
  51. Saaty, T.L. A scaling method for priorities in hierarchical structures. J. Math. Psychol. 1977, 15, 234–281. [Google Scholar] [CrossRef]
  52. Saaty, T.L. How to make a decision: The analytic hierarchy process. Interfaces 1994, 24, 19–43. [Google Scholar] [CrossRef]
  53. Davis, D.; Holt, C.A. Experimental Economics; Princeton University Press: Princeton, NJ, USA, 1993; p. 584. ISBN 9780691043173. [Google Scholar]
  54. Kil, S.-H.; Lee, D.K.; Kim, J.-H.; Li, M.-H.; Newman, G. Utilizing the Analytic Hierarchy Process to Establish Weighted Values for Evaluating the Stability of Slope Revegetation based on Hydroseeding Applications in South Korea. Sustainability 2016, 8, 58. [Google Scholar] [CrossRef]
  55. Armacost, R.L.; Componation, P.J.; Mullens, M.A.; Swart, W.W. An AHP framework for prioritizing customer requirements in QFD: An industrialized housing application. IIE Trans. 1994, 26, 72–79. [Google Scholar] [CrossRef]
  56. Mawapanga, M.N.; Debertin, D.L. Choosing between alternative farming systems: An application of the analytic hierarchy process. Rev. Agric. Econ. 1996, 18, 385–401. [Google Scholar] [CrossRef]
  57. Perini, A.; Ricca, F.; Susi, A. Tool-supported requirements prioritization: Comparing the AHP and CBrank methods. Inf. Softw. Technol. 2009, 51, 1021–1032. [Google Scholar] [CrossRef]
  58. Mau-Crimmins, T.; Steiguer, J.E.; Dennis, D. AHP as a means for improving public participation: A pre-post experiment with university students. For. Policy Econ. 2003, 7, 501–514. [Google Scholar] [CrossRef]
  59. Arroyo, P.; Tommelein, I.D.; Ballard, G. Comparing AHP and CBA as decision methods to resolve the choosing problem in detailed design. J. Constr. Eng. Manag. ASCE 2015, 141. [Google Scholar] [CrossRef]
  60. Saaty, T.L. Fundamentals of Decision Making and Priority Theory with the Analytic Hierarchy Process; RWS Publ.: Pittsburgh, PA, USA, 2006; ISBN 978-0962031762. [Google Scholar]
Figure 1. Study area in the Fuenfría Valley, Sierra de Guadarrama National Park, Madrid Region.
Sustainability 10 04101 g001
Figure 2. Participant’s preference matrix in the utility theory based (UTB) method.
Sustainability 10 04101 g002
Figure 3. Hierarchical structure of the objective, criteria, and alternatives. SFM: sustainable forest management.
Sustainability 10 04101 g003
Figure 4. (a) Spearman’s rank correlation coefficient/individual. (b) Histogram for Spearman’s rank correlation coefficient.
Sustainability 10 04101 g004
Figure 5. Percentage of matching alternatives for all participants.
Sustainability 10 04101 g005
Table 1. Dendrometric characteristics of the forest.
Forest Attributes
MaximumMinimum
Density (tree/ha)850.075.6
Basal area (m2/ha)40.76.6
Mean height (m)14.78.7
Table 2. Location of the alternatives and distances between the alternatives and the ideal point (IP).
AlternativesABCDEF
Distance to IP1.16%23.77%43.46%60.91%62.87%89.11%
UTM-X coordinate 409,016.5408,716.5409,096.5409,116.5408,316.5408,616.5
UTM-Y coordinate 4,512,872.54,512,272.54,512,552.54,512,732.54,512,312.54,512,732.5
Table 3. Mathematical properties of the preference.
Type of Preference Relation in Alphabetical OrderMathematical Properties Required
BiorderStrong Intervality
Interval orderIrreflexivity, Strong intervality
Linear orderAsymetric; Negatively transitive; Complete
Partial orderIrreflexivity; Transitivity
SemiorderIrreflexivity; Semitransitivity; Strong intervality
Weak orderIrreflexivity; Negatively transitive; Transitivity
Table 4. UTB method questionnaire.
Alternative 1Alternative 2Which Alternative Do You Consider More Sustainable?
Alternative 1Alternative 2Equal
BA
BE
CA
BC
EA
EF
CD
FD
DB
CE
FB
AF
DA
FC
DE
Table 5. Relation of alternatives and orders of preference for the UTB and analytic hierarchy process (AHP) methods.
ABCDEF
OrderUTBMAHPUTBMAHPUTBMAHPUTBMAHPUTBMAHPUTBMAHP
1485464611203
2845931341222
3245217354074
4123164682344
5613324434833
61313420110766
Table 6. Global coincidences for each alternative according to the order of preference.
Alternative OrderABCDEFPercent. of Coincidences
144411063.6%
245131272.7%
322130454.5%
411462481.8%
513234372.7%
611207677%

