1. Introduction
Environmental education and sustainable-development education came into being at different times. The former was conceived in the 1960s–1970s, and the latter in the 1990s. However, both of them were put forward under the background of the worsening global environment and the deepening social crisis. With people’s greater understanding of the environment and environmental issues, environmental education has expanded from the field of ecology and nature studies to a broader field, gradually bringing economic and social culture into its consideration, and attaching great importance to their inter-relationship, which is also the concern of sustainable development education. As a result, the relationship between environmental education and sustainable development education has become a hot issue [
1].
Gro Harlem Brundtland is known for having chaired the Brundtland Commission that presented the Brundtland Report on sustainable development. She stated that the “environment” is where we all live, and “development” is what we all do in attempting to improve our lot within that abode.” Learning to look beyond cultural and historical barriers is essential. Chapter 2 of the Brundtland Report defines the concept of sustainable development [
2]. It is a genuine belief that the Bruntland Report constitutes a big step forward for the environmental/green movement, as environmental education aims to address and solve environmental problems. It teaches the need to understand the environment, make good use of resources, protect the natural ecological balance, and prevent or deal with environmental problems. Environmental science, ecological introduction, resource conservation, pollution prevention, and environmental impact are all important contents of environmental education, which is a kind of value education, education for all, and lifelong education [
3].
The triple bottom line (otherwise noted as TBL or 3BL) is an accounting framework with three parts: social, environmental (or ecological), and financial. Some organizations have adopted the TBL framework to evaluate their performance with a broader perspective in order to create greater business value [
4]. Elkington’s TBL is intended to advance the goal of sustainability in business practices in which the focus of companies is extended in measuring the total cost of doing business. In effect, TBL is the idea that it is possible to run an organization in a way that not only earns financial profits, but also improves people’s lives and helps the planet. The elements of the triple bottom line are referred to as “people, profits, and planet.” The TBL is a concept that broadens the traditional business focus on the financial bottom line to include social and environmental considerations [
5]. Therefore, from the perspective of pursuing the sustainable development of human beings, it is an effective way to reawaken the potential conscience of human beings through environmental education.
In 1975, the International Conference on Environmental Education of United Nations Educational, Scientific, and Cultural Organization (UNESCO) [
6] issued the Belgrade Charter environmental education, which was divided into formal and nonformal education. It is universal, lifelong, and community-based; the concepts of value and environmental integrity are similar to those applicable to museum audiences, and cover all strata, community building and preservation of culture. Its value orientation is similar. Tilbury [
7] pointed out that mounting concern over environment and development problems has greater support for an educational approach, which not only considers immediate environmental improvement as its goal, but also addresses educating for ‘sustainability’ in the long term. Merrivan [
8] pointed out that the main function of museums is to bring together the values of local, regional, or national culture. In the same year, De Backer et al. [
9] further proposed that the museum experience showed that the new museum is oriented toward diversified management and is an important cultural carrier, as well as a key dispenser of nonformal education.
Environmental crises, such as global warming and ecological destruction, are having a profound impact on human beings. Most of the specialists in various fields have devoted themselves to environmental education. In the past, many studies on environmental education focused on the protection of ecoenvironmental education in formal educational fields [
10,
11,
12,
13,
14,
15]. Museums, in the field of non-formal education, offer relatively few missions related to the environment. During the Western Age of Discovery period to the establishment of the Republic of China, Tamsui’s location on the route relay between Nanyang and East Asia attracted attention. After nine countries’ influence and its political baptism, Tamsui developed a rich natural ecological landscape and livable places; many cultural assets that witnessed past history have remained largely intact and are an important field for cross-cultural environmental education. This study takes environmental education in the protection of cultural assets as a case study to explore the environmental education channels of museums, and to predict audience perceptions of the environment. Potential factors and the possibility of implementing environmental education diversity and sustainable development are also examined. The above problem explains the motivation of this study. According to UNESCO’s interpretation, in order to achieve good results in environmental education, formal and informal education (UNESCO, 1980) must be properly combined. As an important nonformal social-education institution, museums are duty-bound to promote environmental education in society.
Shiang [
16] indicates that museums promote the idea of environmental education by means of activity planning and design, guided tours, and so forth; carrying out their mission of environmental education counts on the professional competencies of educators. In order to ensure the achievement of environmental education, the museum carries the heavy responsibility of social education and plays an important role in social environmental education. Museums play an important role in nonformal environment education because of their professional manpower, equipment, and original work orientation requirements. Their functional direction includes: information propagation, personnel training, and research development. The related educational plan includes: environmental ethics, environmental management, interrelations, population and quality of life, and resource conservation. In addition to attracting audiences to their museum and participating in special study activities, seeking reference services, and other activities, museum officials can also make use of field visits outside the museum, as well as onsite observations, lectures, and knowledge-construction activities to promote an understanding of the environment. They can also inspire more people to love the environment and take actions to protect it [
17]. Museums use displays, collections, and environmental and other factors to achieve a professional level, and then convey knowledge to audiences, hoping to achieve the benefits of education. Recently, educational institutions have realized that museums are ideal educational settings that can support active learning [
18]. Studies in the field of outdoor education also conclude that such learning environments could positively influence students’ knowledge, attitudes, interests, or motivation [
19,
20,
21].
This study examines the relevant literature to list key factors affecting the sustainable development of environmental education. The goal is to assess audiences’ satisfaction with museums as environmental education channels. A questionnaire was used to indicate the audience’s background, which uses virtual hypotheses to explore audiences’ needs, as well as hidden intrinsic factors, in exploring ways to improve the total operations. The purposes of this study are as follows:
Taking the museum as the venue for nonformal environmental education, with audience satisfaction transformed into a field where the audience acquires knowledge outside of school education, and determining how to strengthen the environmental significance of the museum as a global community. The means to extend the possibility of sustainable development are also discussed.
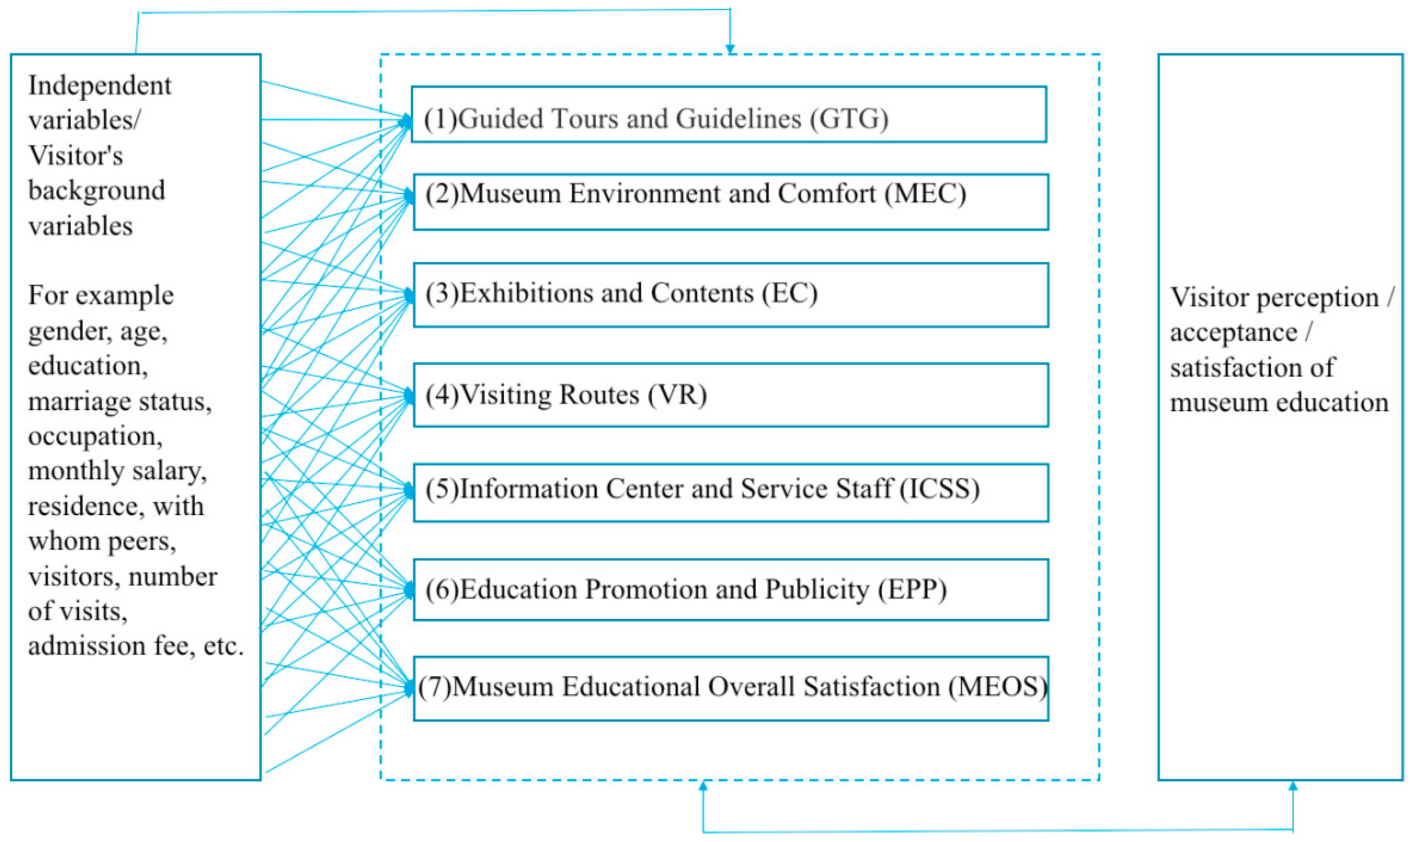
This study takes audience background data as an independent variable, and the problem of museum environmental education as a dependent variable, adopts a gradual regression analysis, and cross-correlation and correlations to estimate the audience’s demands and expectations for environmental education, and to use the results for revising museum strategy. Achieving people-oriented care, a positive environmental attitude and a sense of an environmental education mission expresses a consensus of the museum’s goals.
4. Data Analysis
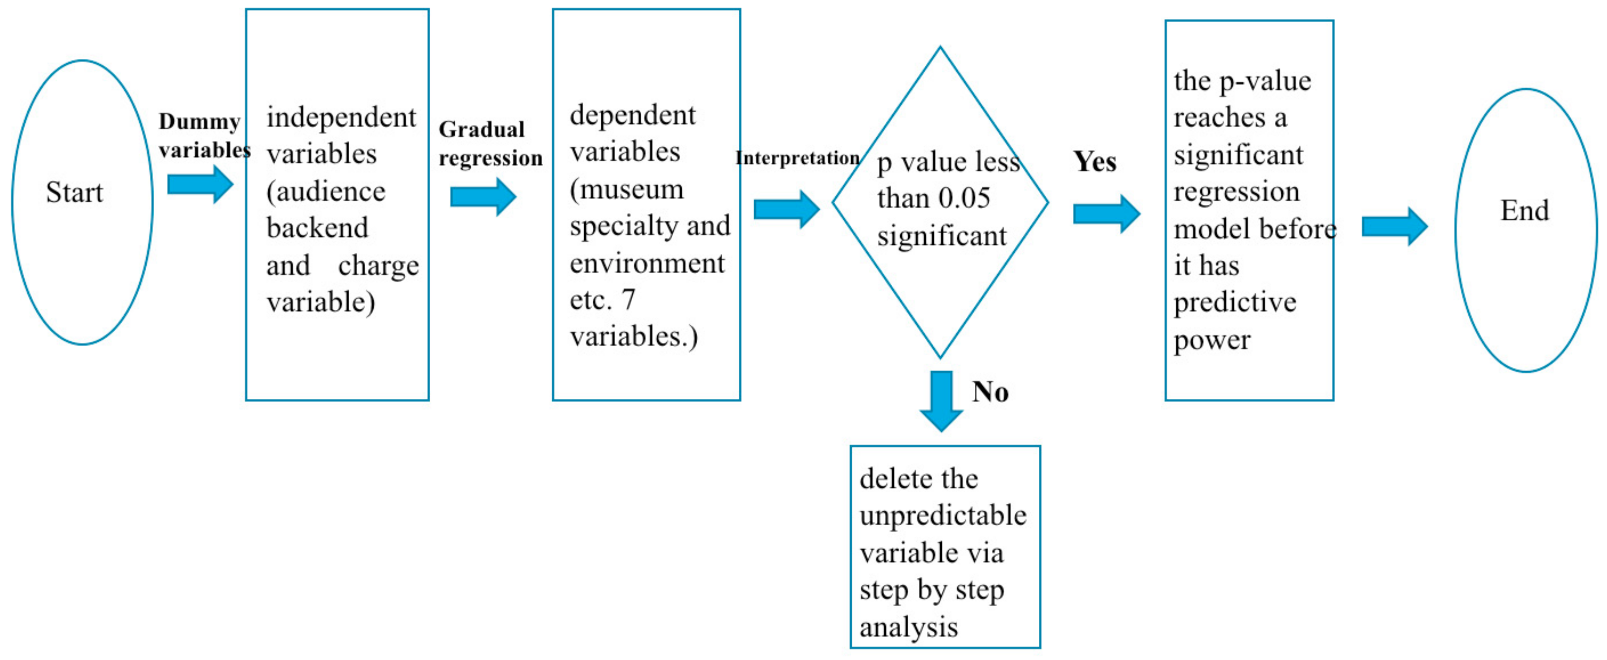
In this paper, we used SPSS version 22 [
52] of the social science statistics as the data statistical analysis tool to explore whether the independent and dependent variables have explanatory power, based on gradual regression analysis. A quantitative test survey was conducted from 1 August 2017 to 10 September 2017, for a total of 40 days. The survey was conducted via 666 questionnaires in Fort San Domingo [
53]. During the survey, there were 64,680 visitors in Fort San Domingo. The mathematical theoretical basis of the sampling theory in Equation (1) shows a population of N = 64,680 with a sample size of n = 666, for a total of 645 valid questionnaires with a sampling rate of 0.99%, which is equivalent to one sample of participants in a sample of 95% confidence level. It is equivalent to a sample of one-hundred visitors, and reliability is the measure of the error degree and the degree of consistency of the test results. The reliability coefficient of this study is 0.908. The higher the Cronbach’s alpha coefficient is, the higher the internal consistency of the representative scales; the alpha value of the main facet being greater than 0.8 is ideal.
4.1. Audience Background Investigation Information
The following detail the main audience background investigation information.
- (1)
Overview of gender: Subjects were mostly females, 397, comprising 61.6%, and 248 males, comprising 38.4%.
- (2)
Overview of age composition: Subjects aged from 21 to 30 totaled 166 (25.7%); 31 to 40 totaled 148 people (22.9%); 20 years and below totaled 69 persons (10.7%).
- (3)
Overview of educational composition: The degree of academic education was mainly college degree or above, with a total of 646 (56.4%), followed by high-school education, which was 206 (18.0%).
- (4)
Overview of marital status: Most of the subjects were married with children, 307 (47.6%), followed by singles, totaling 256 (39.7%).
- (5)
Overview of employment: A total of 167 were in the business-service industry (25.9%), followed by 151 students (23.4%).
- (6)
Overview of monthly income: Most people, 206 (31.9%), had a monthly income of 39,999 NTD, followed by 199 persons (30.9%) with no income.
- (7)
Overview of demographics: Mostly Taipei citizens, totaling 166 (25.7%).
Descriptive analysis of the relevant audience background variables is shown in
Table 4. In addition, the seven facets of the museum as an environmental educational channel were GTG, MEC, EC, VR, ICSS, EPP, and MEOS. In the satisfaction analysis, the mean ICSS of the highest mean was 4.52, and the average of EC 4.24 was the lowest of the seven facets. We show the satisfaction analysis of the seven facets of the museum for environmental education channel. In
Table 5, the results show that overall satisfaction was generally good in the sampling of the Tamsui Historical Museum, so the effectiveness of environmental education can be used as a reference case.
4.2. Regression Analysis Results
This study used gradual regression analysis (
Figure 1 and
Figure 2).
Table 6 is a list of significant explanations (significant < 0.05), including professional, military service, below 20 years old, and unemployed, which had positive explanatory power for GTG; professional had positive explanatory power for MEC; married with children has negative explanatory power for MEC; professional, below 20 years old, and military service had positive explanatory power for EC, Taipei City citizen had negative explanatory power for EC; etc.
Results are shown in
Table 7, with the independent variables of this study for gender, education, number of visits, and visitors corresponding to the dependent variables that have no explanatory power; independent variables below 20 years old hd positive explanatory power for GTG, EC, ICSS, EPP, and MEOS; military service had positive explanatory power for GTG, EC, EPP, MEOS, EC, ICSS, and EPP; MEOS variables had positive explanation; the above signifies the mode of positive explanatory power. In addition, marital status, married, and married with children for MEC, service section and retired for VR, residence in Taipei City for EC and MEOS, friends or classmates, etc., had negative explanatory power for EPP.
To sum up, among the seven factors: under 20 years old, GTG, EC, ICSS, EPP, MEOS, etc., five factors had positive explanatory power. This study further verified that below 20 years old accounted for 10.7% and students accounted for 23.4% (refer to
Table 4). According to the official website of the Tamsui Historical Museum, there are more than 6000 guided tours a year, of which nearly 50% are academic. Students’ outdoor visiting groups, including junior-, elementary-, and high-school and University students, mainly publicize the protection of Tamsui culture and history, and continue to conduct various monumental activities, which is also the purpose of the establishment of the Tamsui Historical Museum. Therefore, continuing to conduct these activities would result in better performance. However, because it is the museum that leads the students to visit, students are unable to independently arrange the route, and this one has no explanatory power on the route.
Professional, a self-variable, had positive explanatory power among the seven factors, including GTG, MEC, EC, ICSS, EPP, and MEOS. The Tamsui area is famous for its numerous historic sites. In the past literature discussions, the traditional residents of Taiwan live in Tamsui settlements, creating a rich Tamsui culture, and meeting a pluralistic one [
53]; local cultural heritage is both a resource and evidence of changes in local history and identity. Tamsui has been built at different times by the West Dutch, Japanese, British, and Han nationalities. In addition to regular tourists, professionals also like to visit Tamsui, so it can be a key factor for the sustainable development of environmental education.
In addition, for married with children for MEC, service section and retired for VR, residence for EC and MEOS in Taipei City, and friends or classmates for EPP, museums can examine the relevance of the mission and purpose of museums. For example, in order to preserve the integrity of historic sites, it is difficult to have innovative plans for new technology and mobility arrangements. In this case, more guided tours or educational activities are needed to promote the correct conservation concept. The cultural resources in Taipei are abundant, and appreciation of culture is relatively high. Therefore, the negative explanatory power of EC and MEOS can be used as a reference for revising the operation and management of museums.
5. Conclusions and Suggestions
Museums have different types of presentations due to different collections. Museums of different types perform their functions according to their respective mission objectives. The collection of the Tamsui Historical Museum includes all kinds of buildings. Since the rise of environmental education in the 1970s, museums have recognized their mission to protect the environment and have pondered the role of environmental education. However, as there are many methods of environmental education, determining how to use appropriate environmental education methods to various types of museums while strengthening the characteristics of museums is indeed a problem worthy of discussion. The museum experience shows that the museum is a cultural carrier as well as an educational purveyor. This study interprets the needs of the audience from the perspective of the environmental education channel of the museum in order to realize the trend of people-oriented museums. The experimental analysis and literature analysis are as follows:
- (1)
Experimental analysis:
The results showed the number of population
N = 64,680; 645 valid scale questionnaires were sampled, and the sampling ratio was 0.99%. At 95% confidence level, the reliability coefficient was 0.908, representing the high internal consistency of the scale. Therefore, overall satisfaction was above 4.24 (in
Table 5) in the five scale tests. The environmental education effectiveness of its cultural assets is one of the reference cases. In addition, in the analysis of
Section 4.2, if the causal relationship between the independent and dependent variables is not obvious, the museum can continuously observe its changes. Among the seven factors, the independent variables below 20 years old and professional have significant positive explanatory powers; this is closely related to the museum’s purpose, promoting the historical protection of Tamsui culture, and continuing to conduct various historical activities. Local cultural heritage is not only a resource, but also evidence of changes in local history and identity. Besides Tamsui local residents, tourists and professionals also like to visit the museum. Therefore, it can be a key factor for sustainable local development of environmental education. In view of the negative explanatory power, in order to preserve the integrity of the historic sites, it is difficult to make innovative plans for new technology and movement arrangements. It is necessary to use more guided tours or educational activities to publicize, so that audiences have a correct concept of preservation. The inadequate part can be used as a reference for the revision of the museum’s operation and management.
- (2)
Literature analysis:
In this paper, the TBL concept was analyzed. As mentioned above, it consists of three parts: society, environment (or ecology), and economy.
“Society”: the triple bottom line of society means people. This study uses the concept of museum “audience” to cover all strata, community building, and cultural protection. Its value orientation is similar. In line with the 1975 UNESCO definition of environmental education, it is universal, lifelong, and community-based, signifying the concepts of value and environmental integrity.
“Economy”: the triple bottom line economy refers to profit; this study takes the Taiwan Tamsui Museum, a nonprofit organization, as a case study; it is an important informal social education institution. Museums have the responsibility to promote social environmental education. Apart from expressing cross-cultural and cultural equality, it is also an effective way to reconfigure it through environmental education.
“Environment (or ecology)”: The TBL indicates environment as the planet itself. In fact, TBL’s view is to operate an organization in a way that not only makes economic profit, but also improves people’s lives and helps the earth by preventing or dealing with environmental problems; environmental science, ecology, conservation of resources, prevention of public hazards, and environmental impact are all important parts of environmental education, which is a value education, education for all people, lifelong education, and a good manifestation of sustainable development.
As implementation of the United Nations Environment Program (UNEP), World Conservation Union (IUCN) and World Wide Fund for Nature (WWF) [
54] published Caring for the Earth—A Strategy for Sustainable Living in 1991. The book proposed to establish world ethics based on people-centered and conservation-based education. The global community is made up of all living things; it integrates human society and nature. This study takes the Tamsui community museum with many cultural assets as an example to enhance the quality of visits and achieve sustainable management. In fact, audience satisfaction is a key factor for constructing the sustainable development of environment education, as this study attests.
The contributions of this study are as follows:
Explored the causal relationship between audiences’ background variables and satisfaction, as well as the potential factors of museum environmental education at different audience levels. It can rethink the goals and practices of promoting social environmental education and serve as a research reference of the cultural-type museum.
Discussed the different audience views regarding the museum as an environment education channel; the findings can be used as reference for the museum management strategy, including museum audience analysis, the key factors of sustainable development, and as a field of cross-cultural learning, to achieve a people-oriented sustainable development strategy.
Because the results of this study significantly differ from each other through causal relationships between independent variables and dependent variables, both positive and negative responses can be explored in depth, while negative explanations do not necessarily lead to poor responses, especially when testing for homogeneity problems. In other words, the fault of management can be corrected in time, or inspections made as to whether or not the objectives of the museum’s environmental education are consistent. This study analyzed the implicit but inconspicuous key factors by means of quantitative test questionnaires, and suggests that further indepth interviews for explanatory variables be conducted in future studies. Thus, the combination of data and implementation can help to better understand audience demand for knowledge and provide a reference for managers to revise their business strategies.