Empirical Study on Structural Safety Diagnosis of Large-Scale Civil Infrastructure Using Laser Scanning and BIM


Abstract
:1. Introduction
2. Literature Review
2.1. Laser Scanning Technology
2.2. Role of BIM in Facility Management
3. Structural Safety Inspection of Civil Infrastructure Using Laser Scanning and BIM
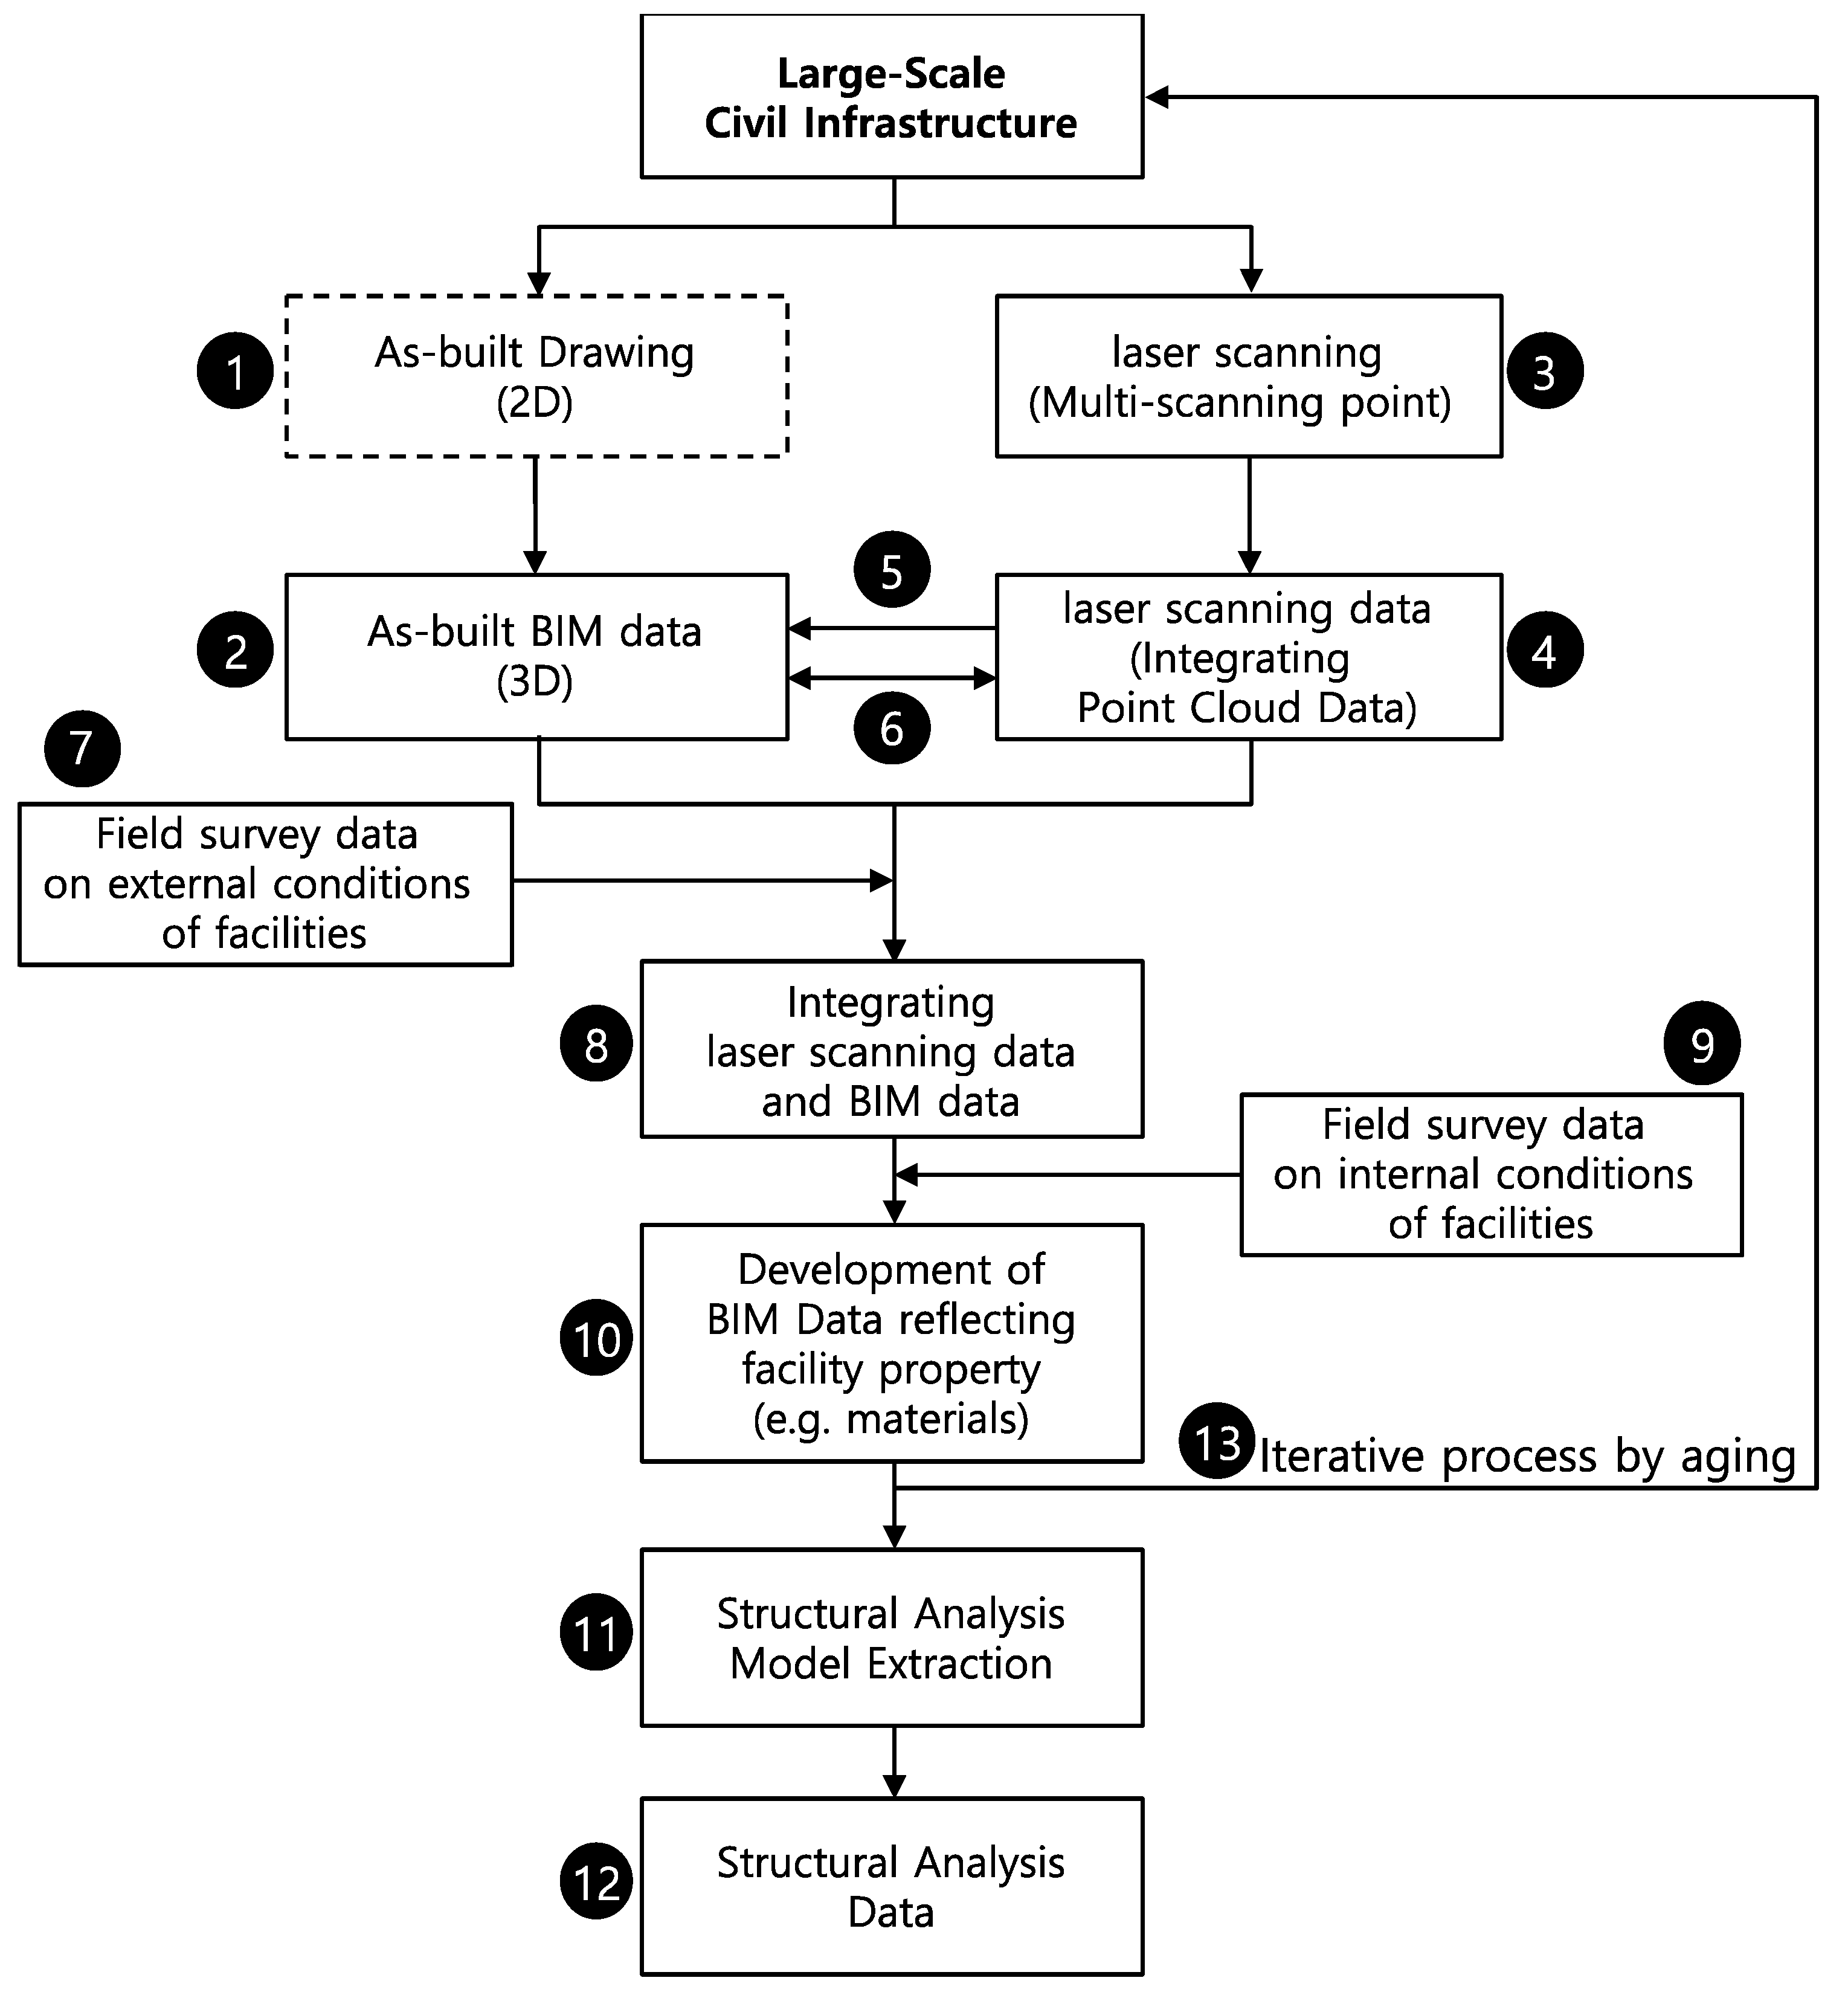
Generation of Safety Diagnostic Information for Large-Scale Civil Infrastructure
- (1)
- The as-built drawing contains the completion information of a facility [17]. In the case of civil infrastructure, however, the drawings can be lost during operation, or they do not match the status at the given time in many cases. Therefore, it is difficult to use this information for safety diagnosis.
- (2)
- The as-built BIM data refer to the 3D model built based on the completed drawings of a facility, and contain information concerning the shape of the facility. As-built BIM data are generated based on as-built drawings. However, if there is no as-built drawing, the as-built BIM data should be prepared before the transformation by referring to the laser scanning data [15].
- (3)
- Three-dimensional laser scanning refers to scanning a facility in operation in three dimensions using a 3D laser scanner. When the given facility is large or complex, laser scanning can acquire accurate information concerning its status by designating scanning points at various positions [5].
- (4)
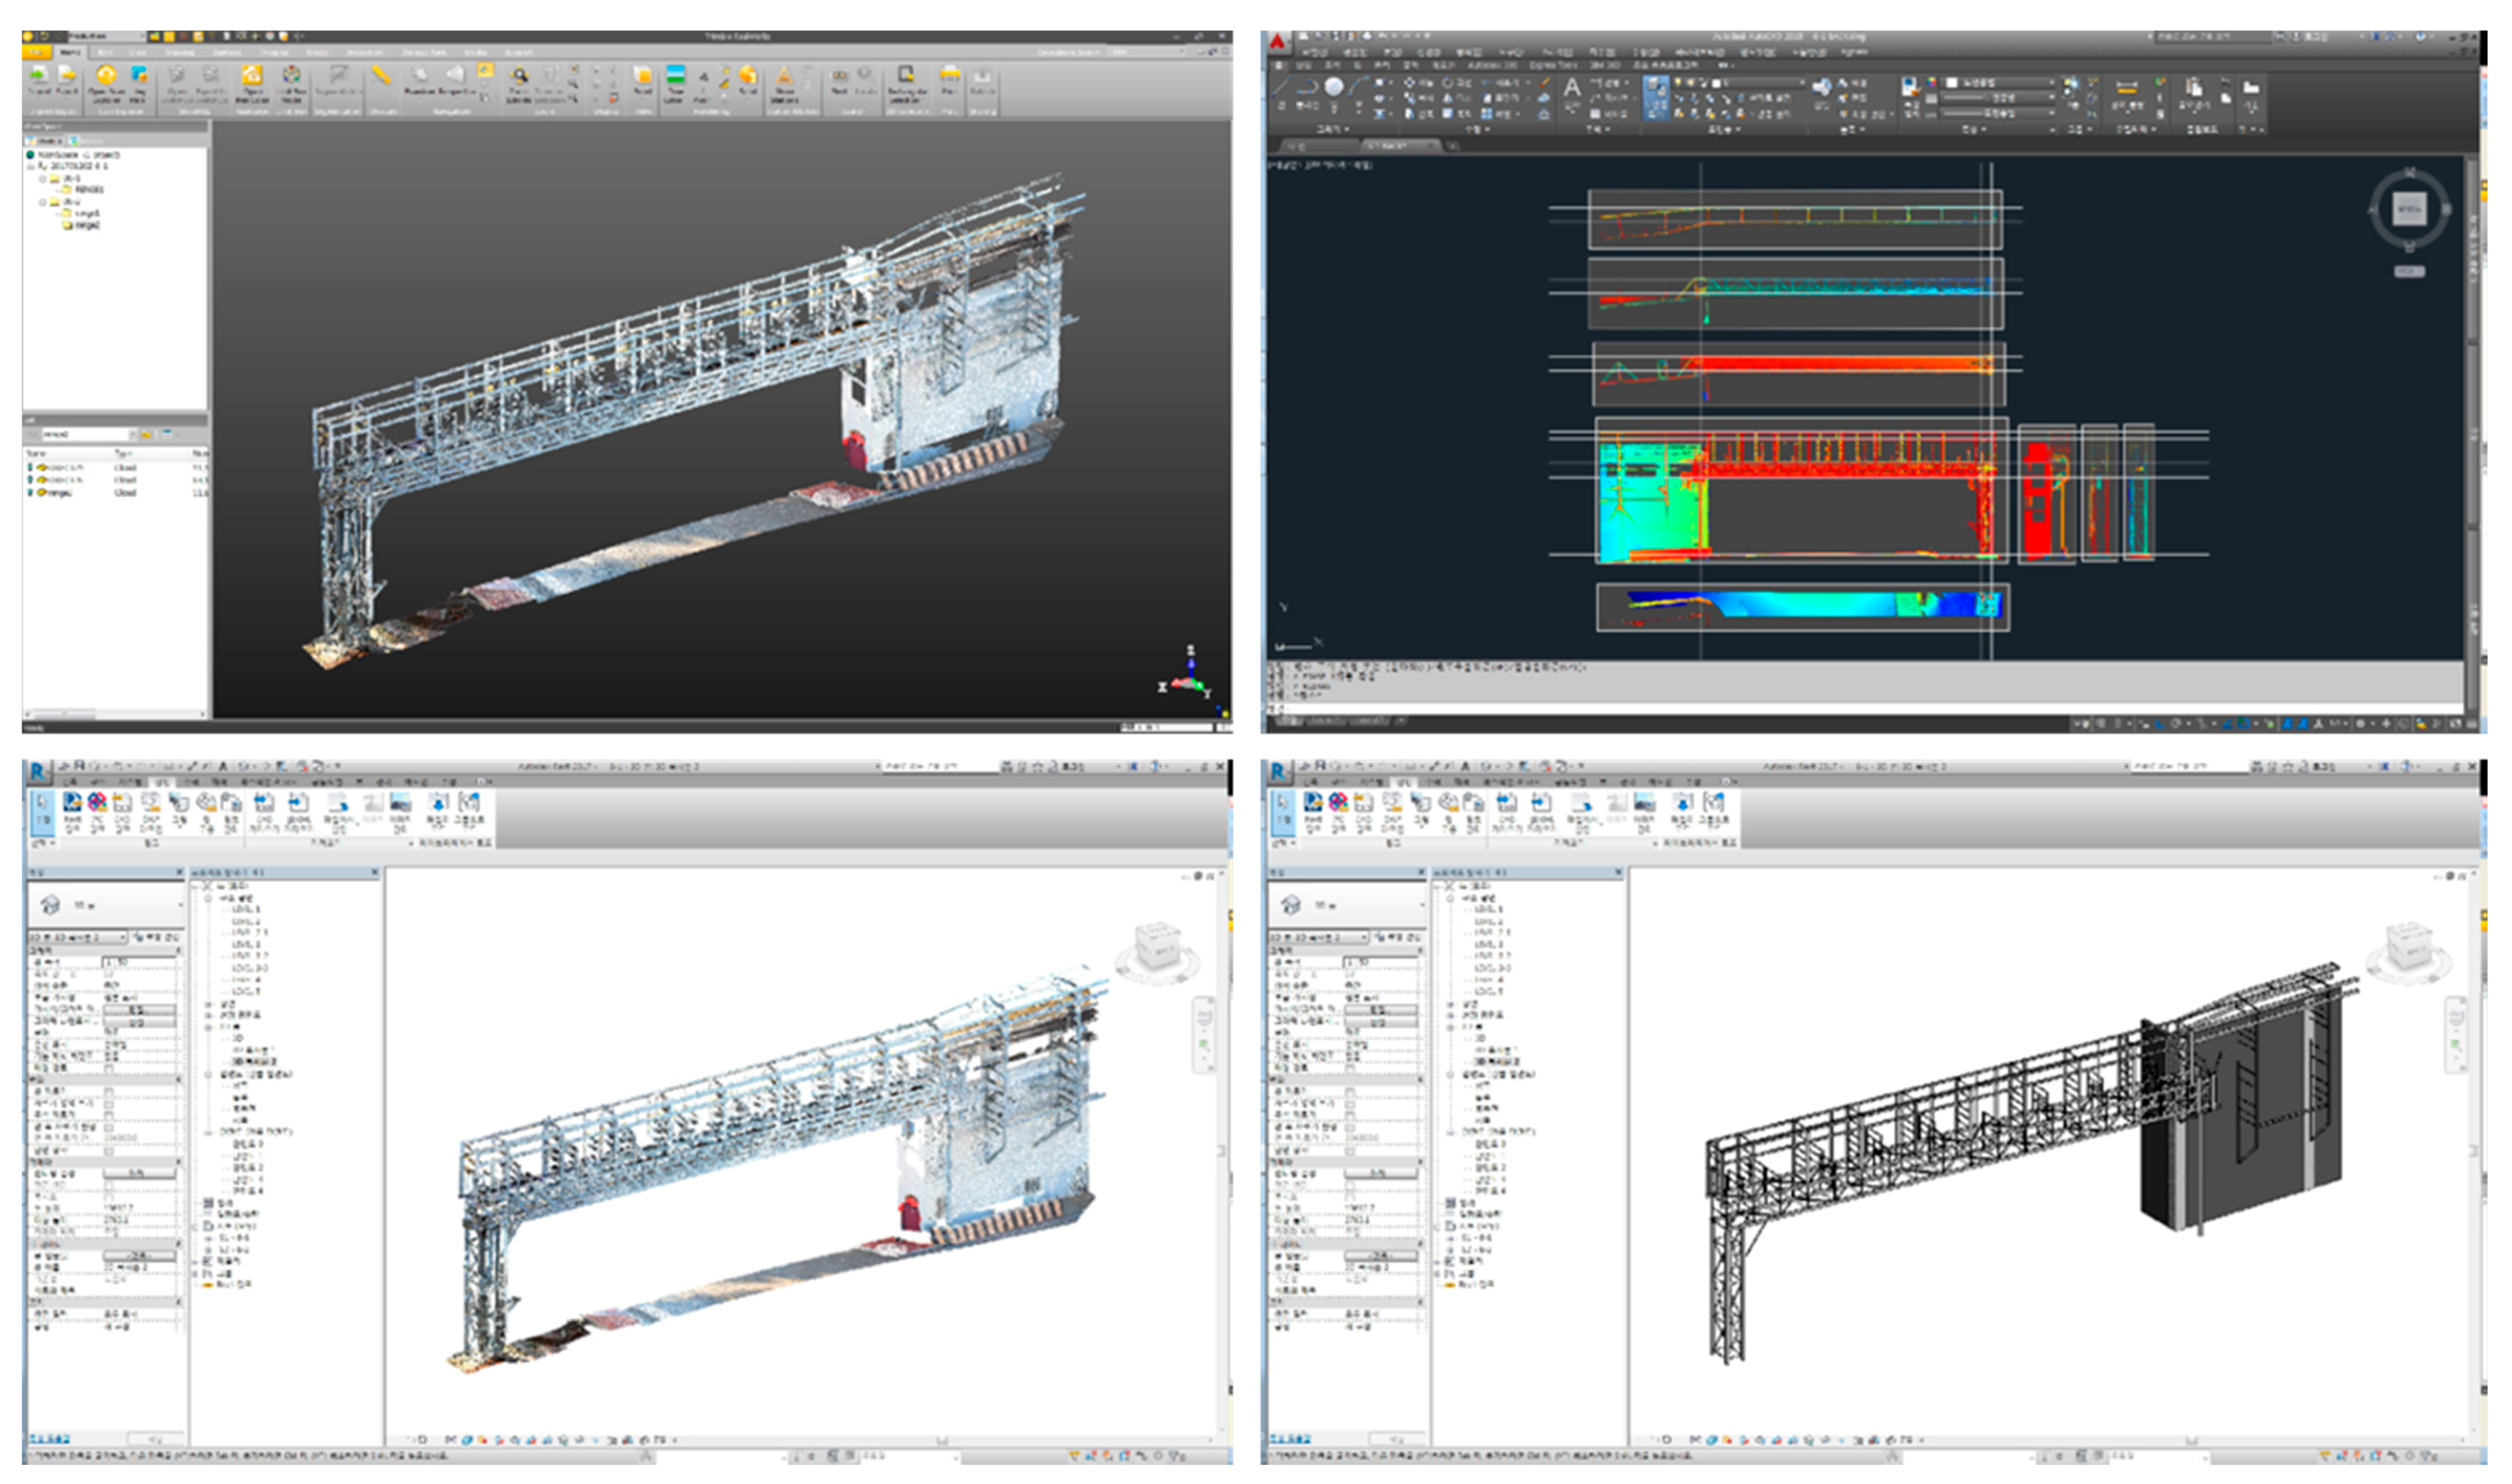
- Three-dimensional laser scanning data can be generated by integrating data scanned from multiple positions [23]. The data contain accurate information concerning the surface of the facility in a point cloud data format. From the data, accurate information concerning shape required for the safety diagnosis of the facility can be obtained. In other words, laser scanning data contain status information, which reflect construction errors and displacement, that is unknown in the as-built BIM data.
- (5)
- The accurate as-built BIM data must be modeled based on laser scanning data [33]. Safety diagnosis must be performed consistently instead of once. The BIM model should be a criterion for determining the degree of deformation of the laser scanning data that accurately reflects the deformation state.
- (6)
- If laser scanning is repeated in the future for the safety diagnosis of a facility, the modifications in it can be consistently monitored by directly comparing laser scanning data generated in the previous safety diagnosis and the as-built BIM data [12].
- (7)
- Field survey data relating to the external conditions of facilities are obtained by investigating the design documents and related materials, the damage status of the components of the facility, their deformation status, and the application status of the load. The data include the tilt, displacement, crack, and surface damage information of the components [10].
- (8)
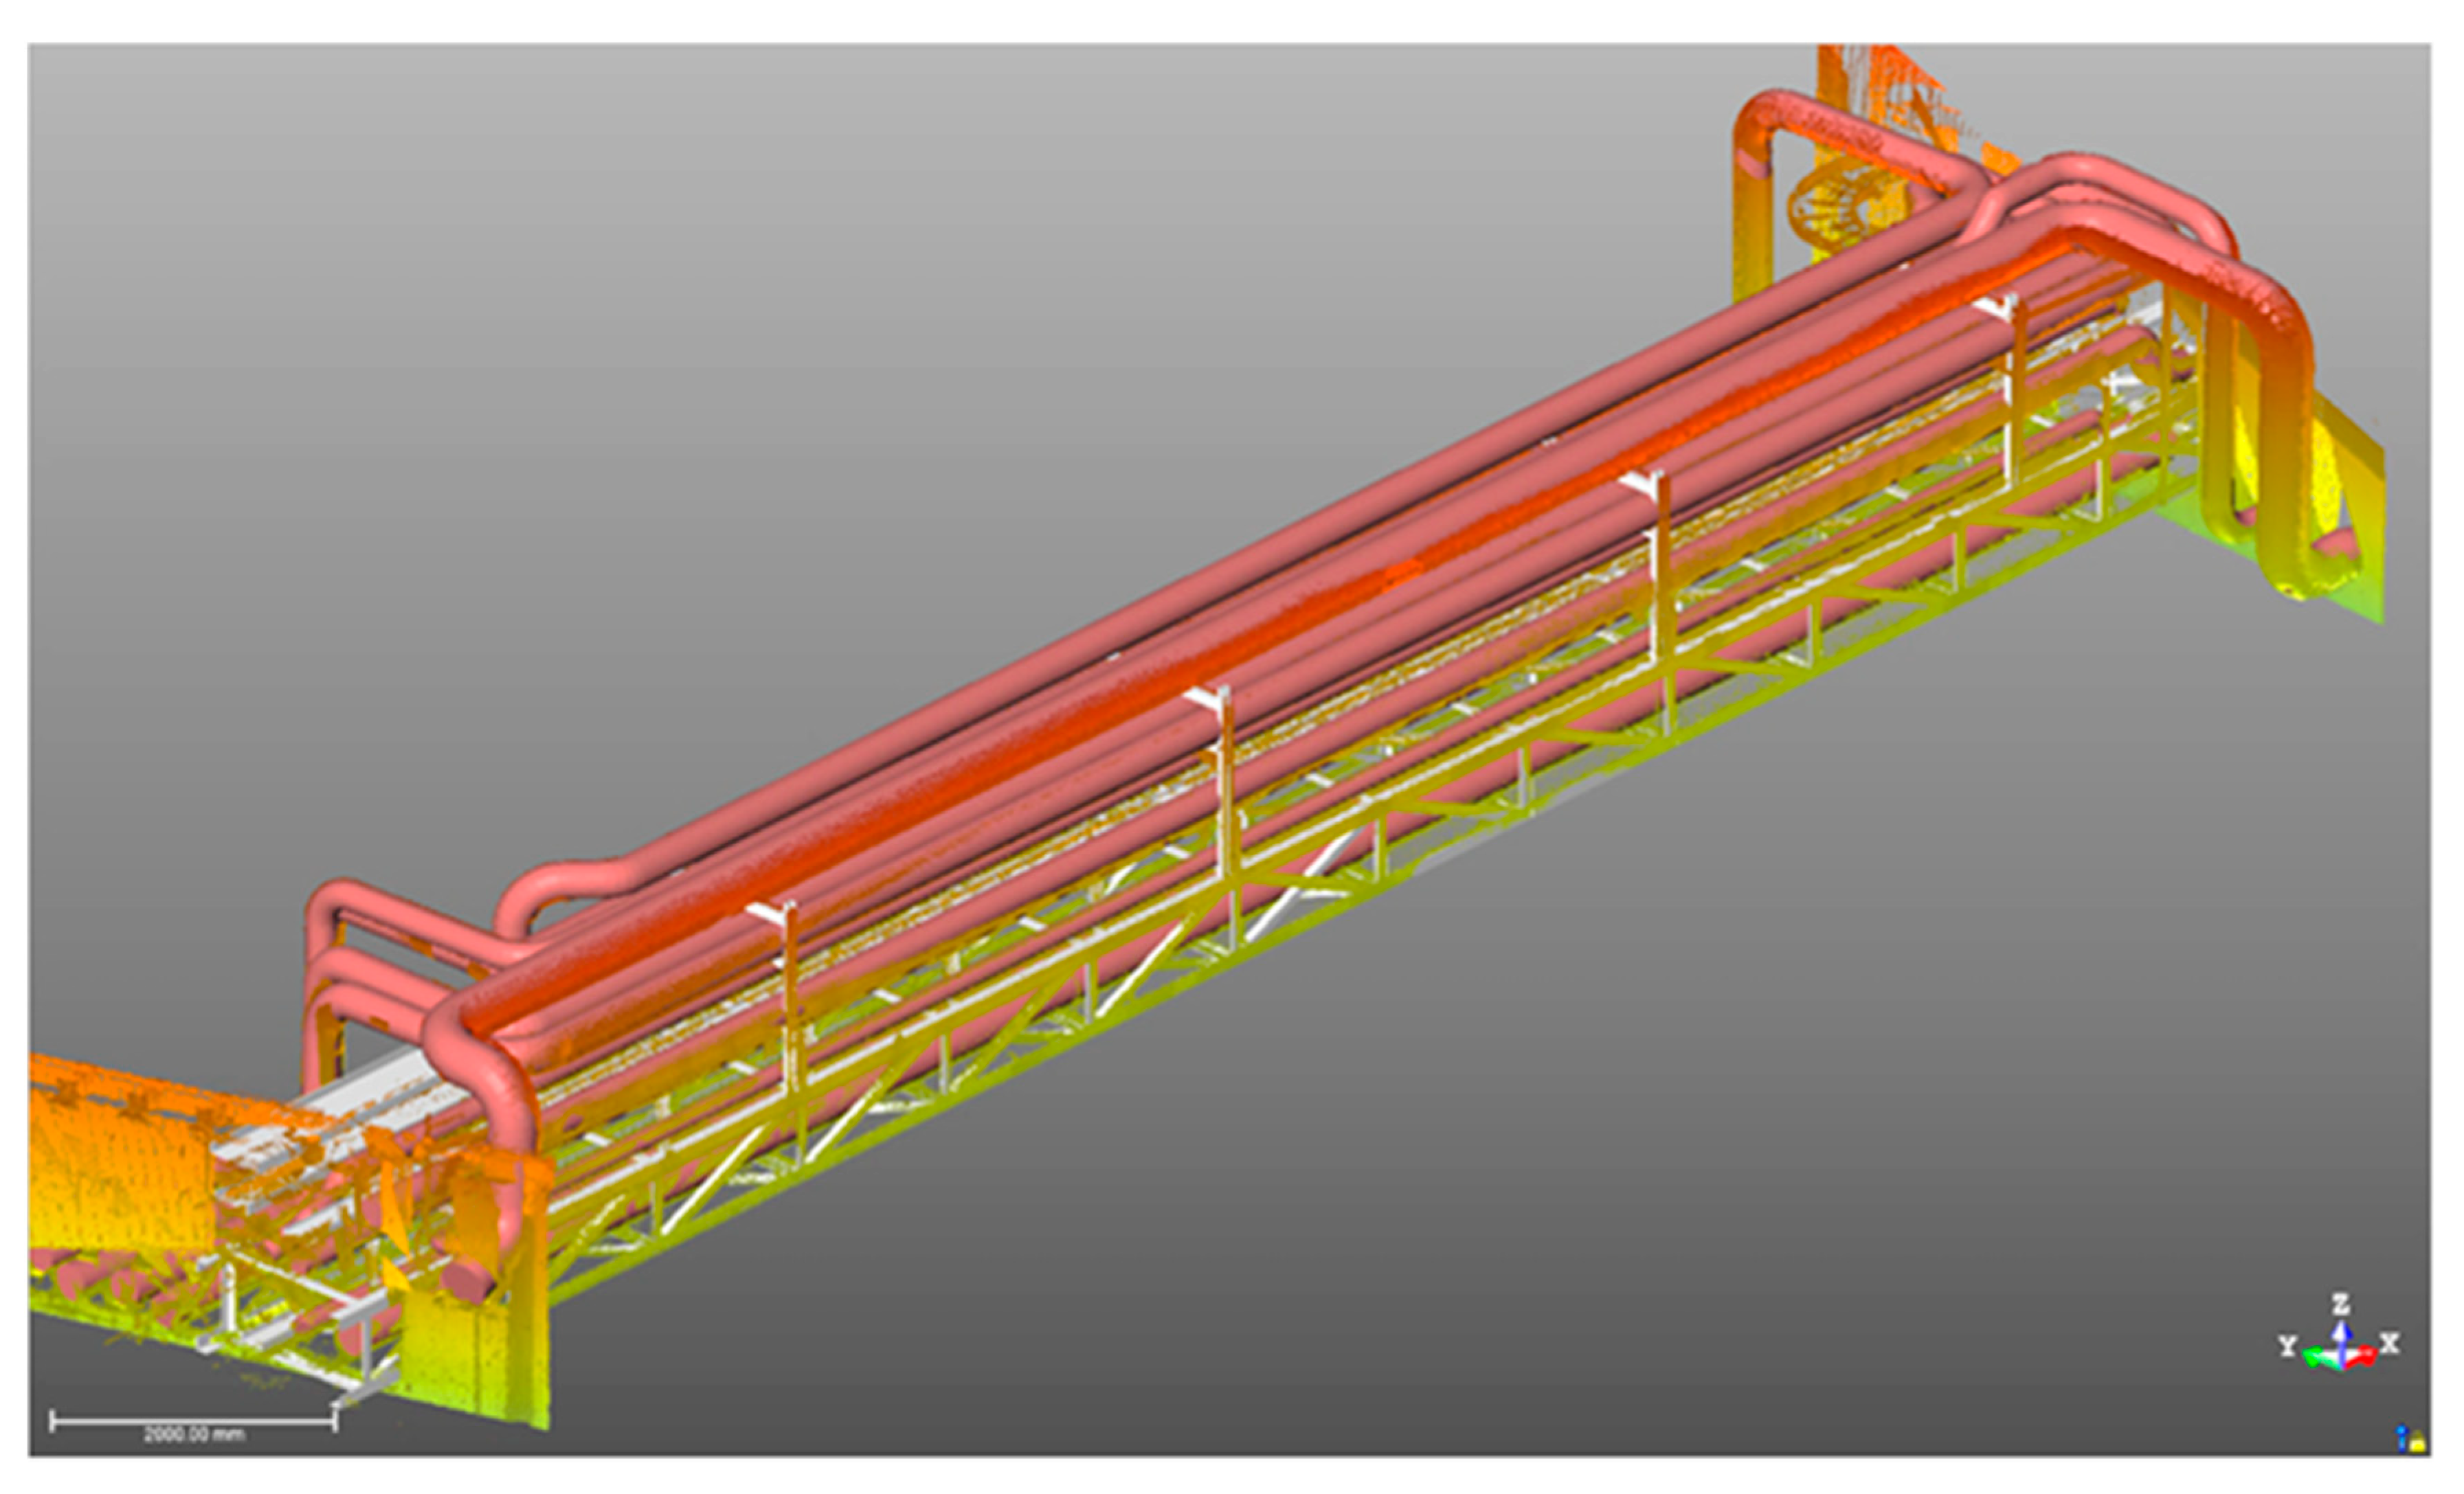
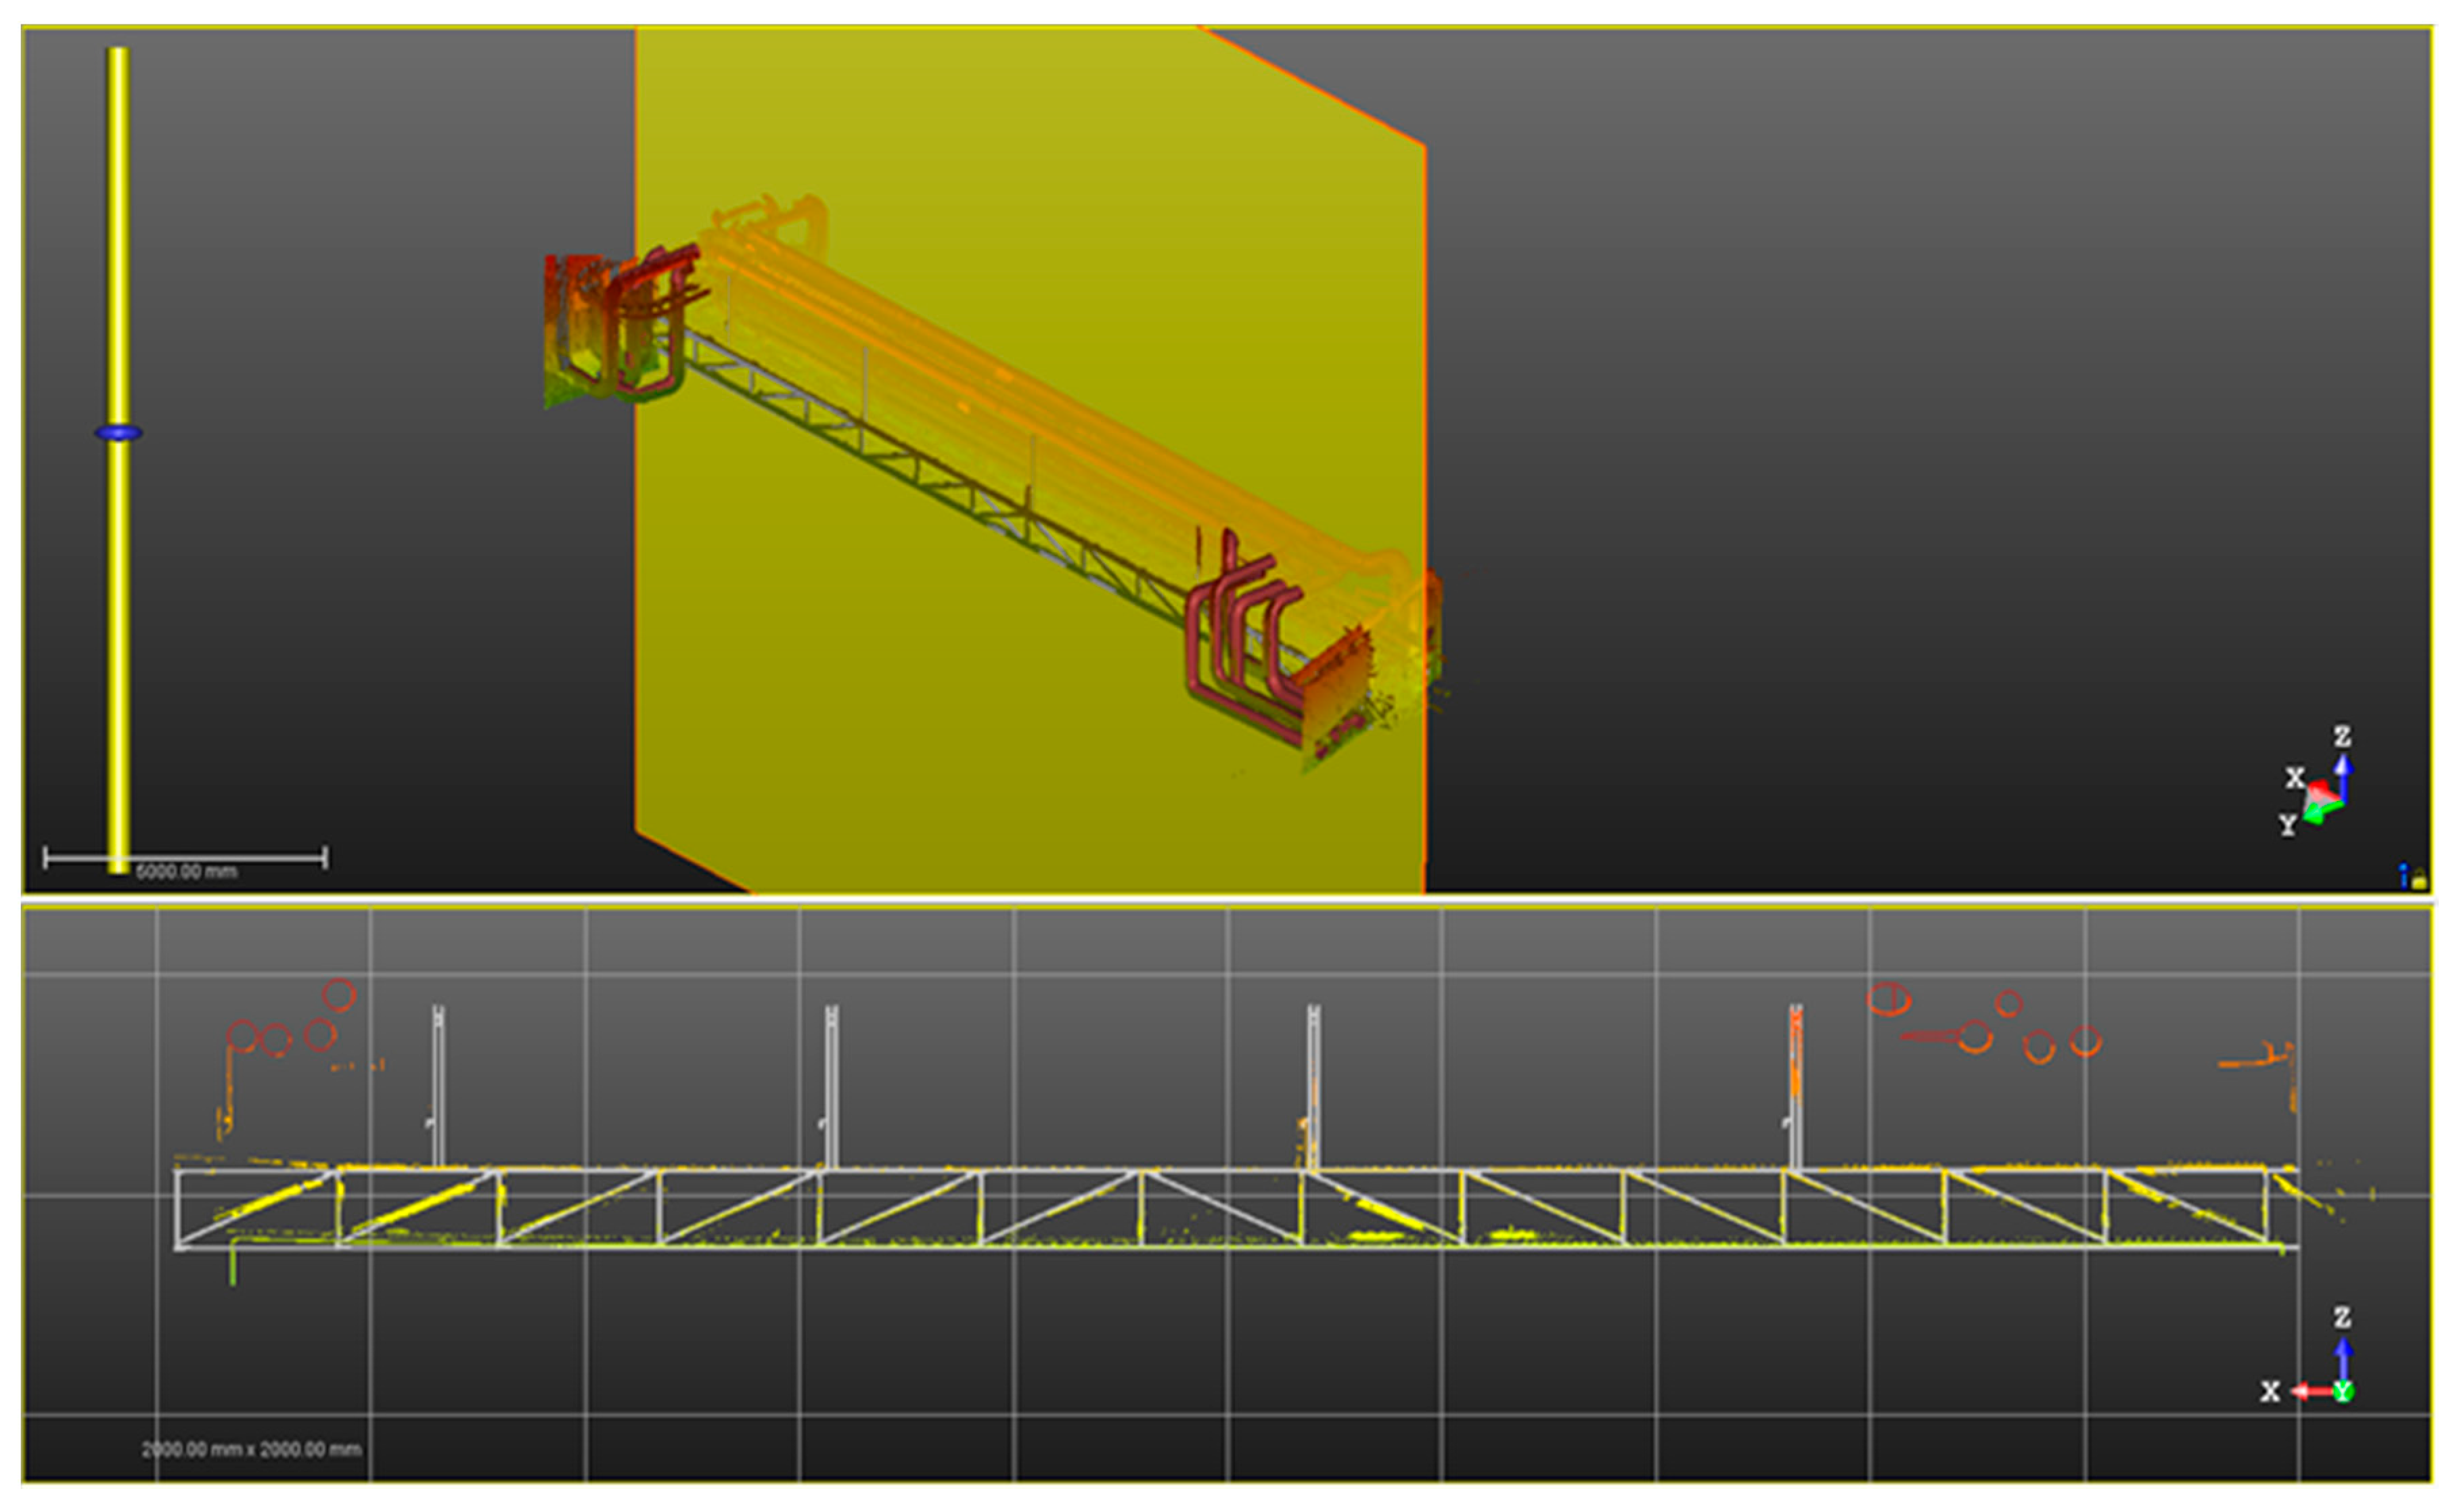
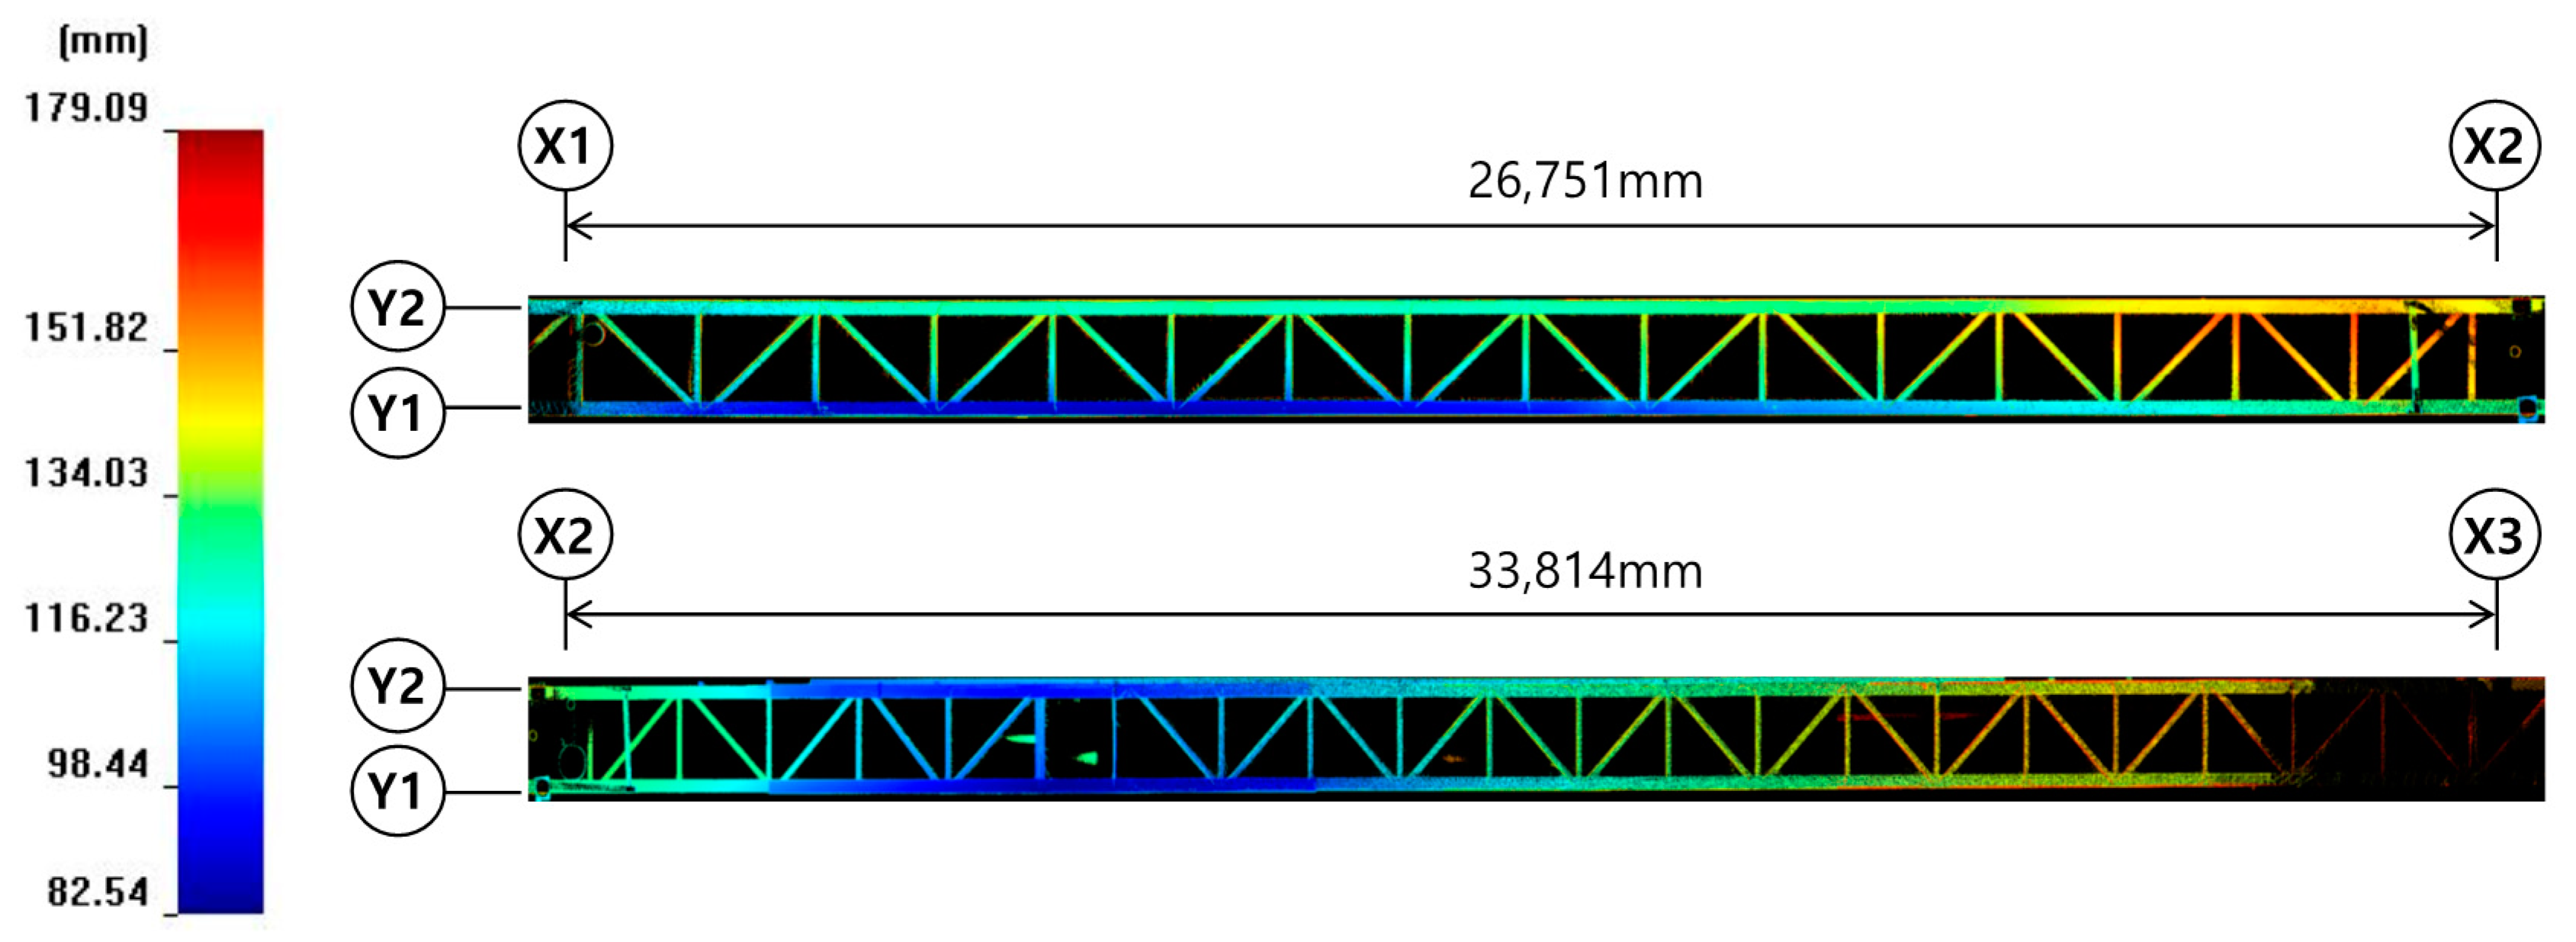
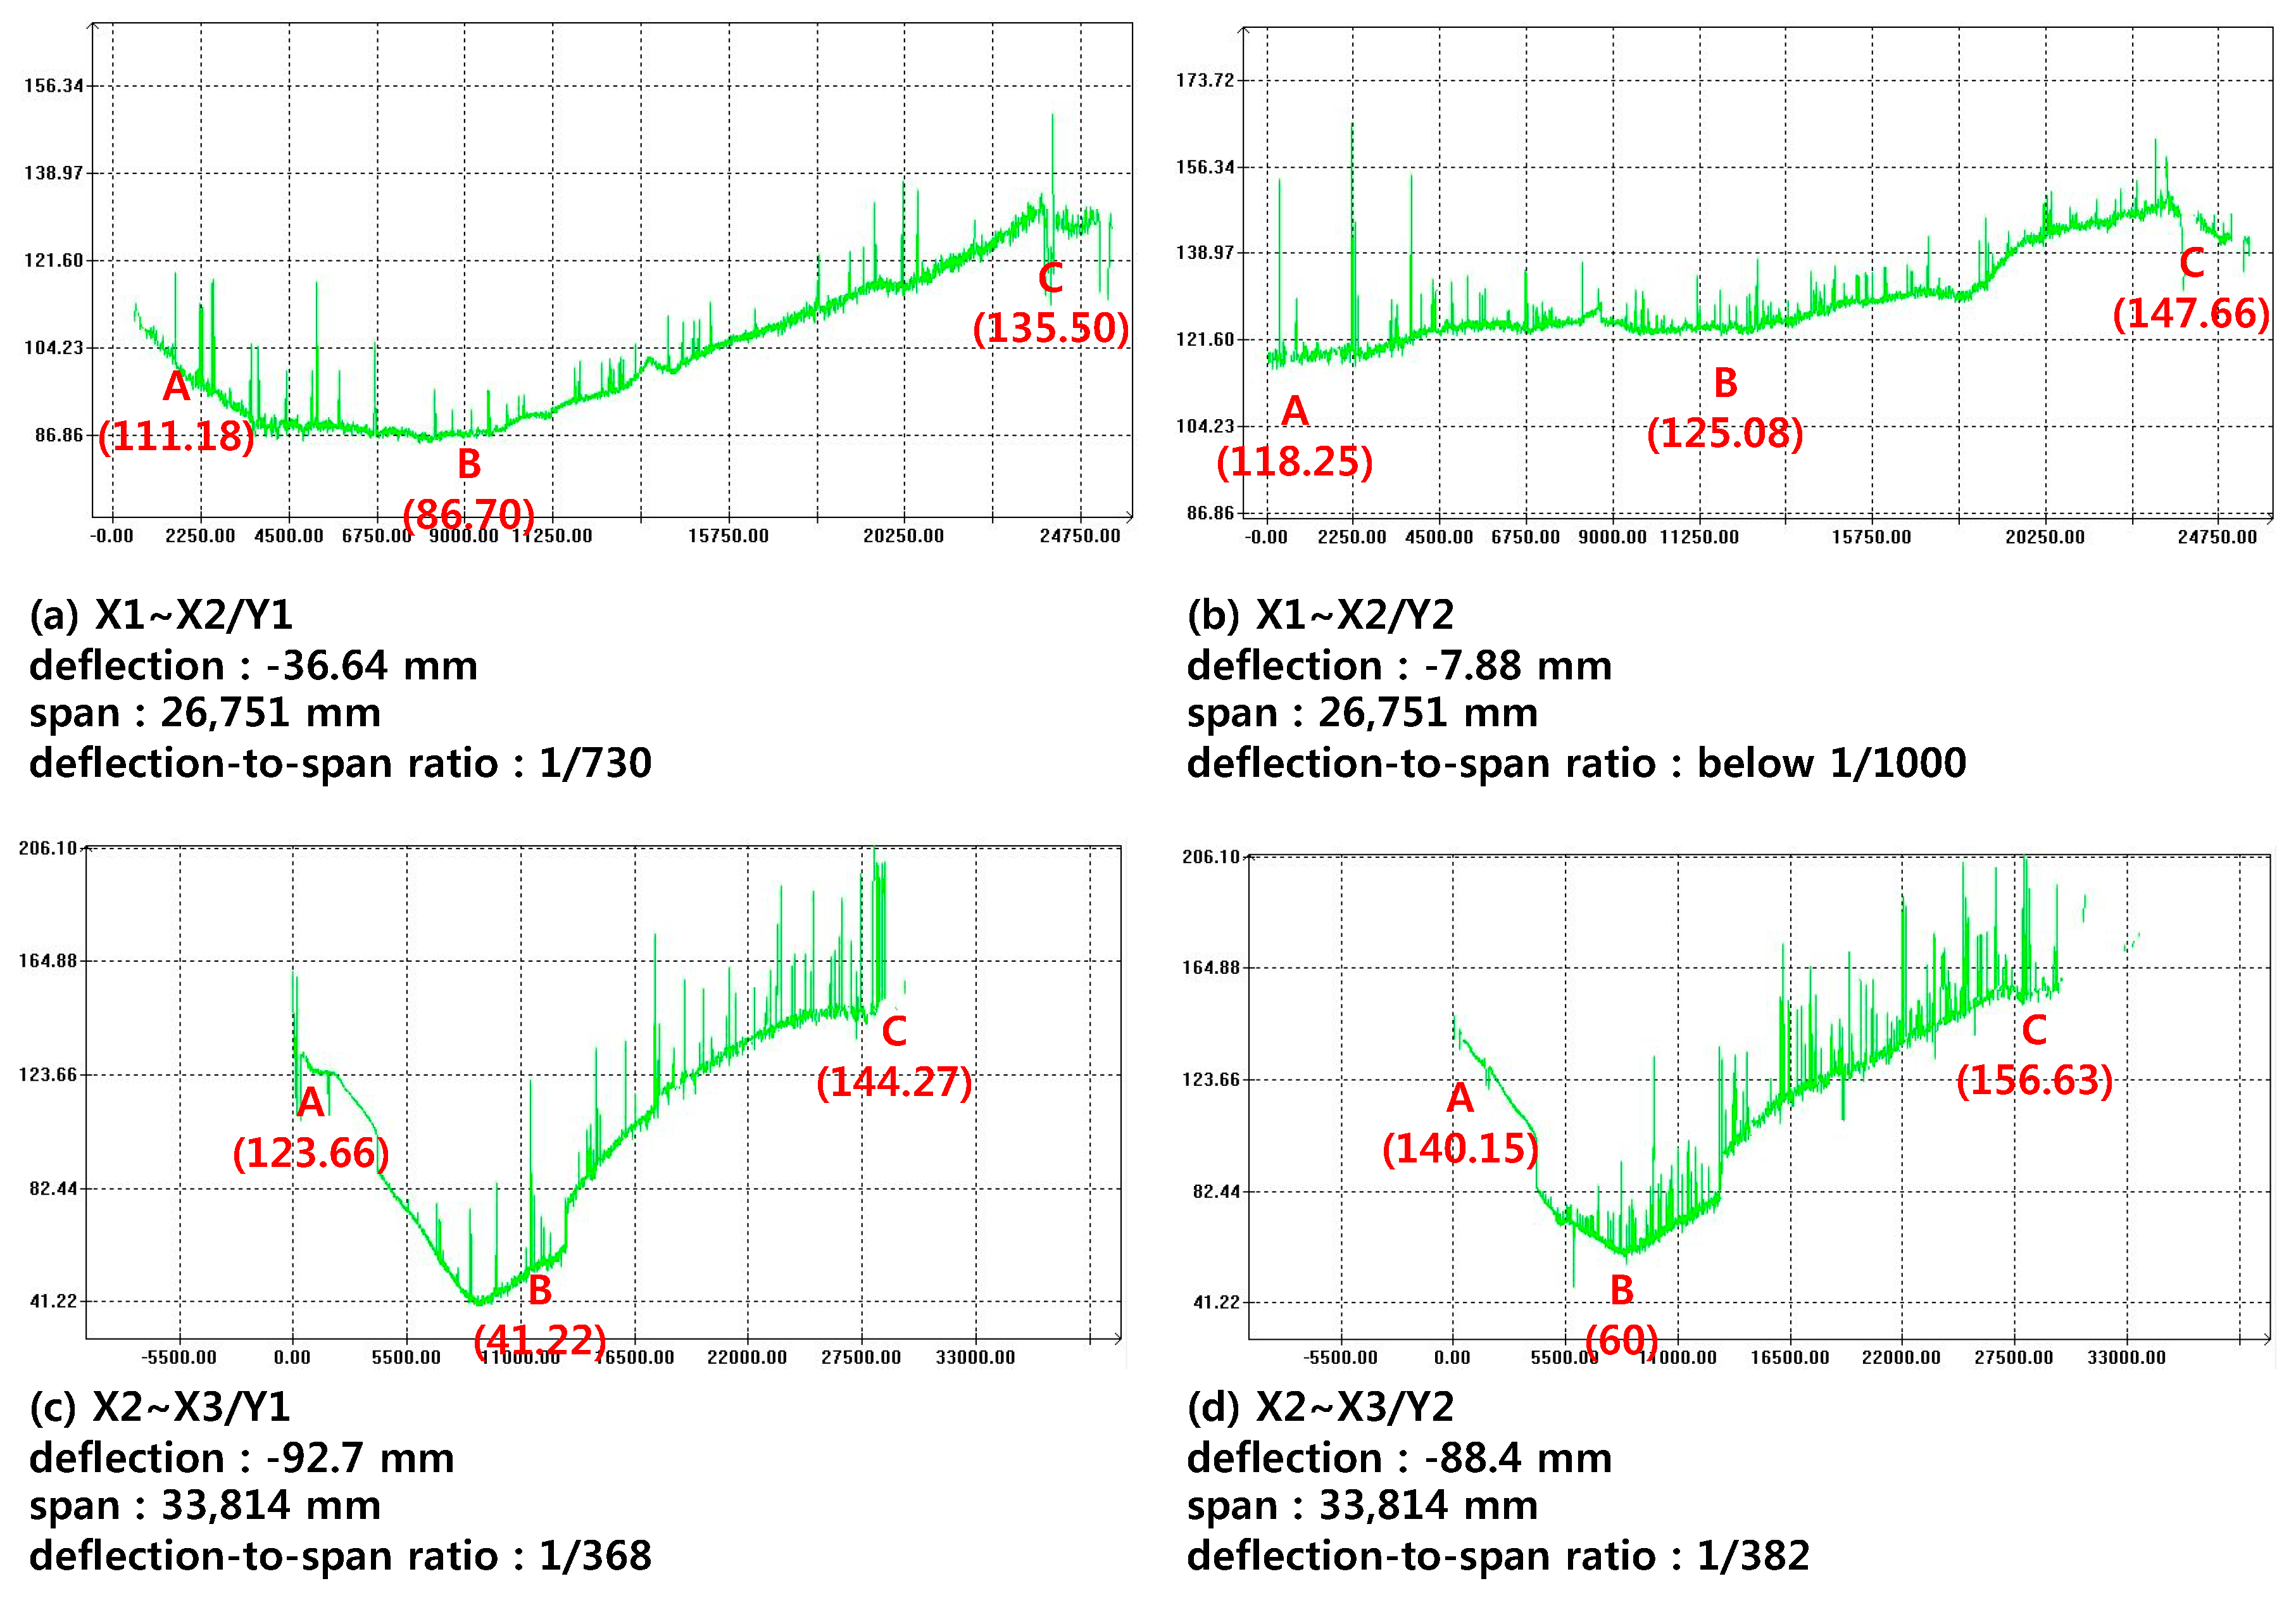
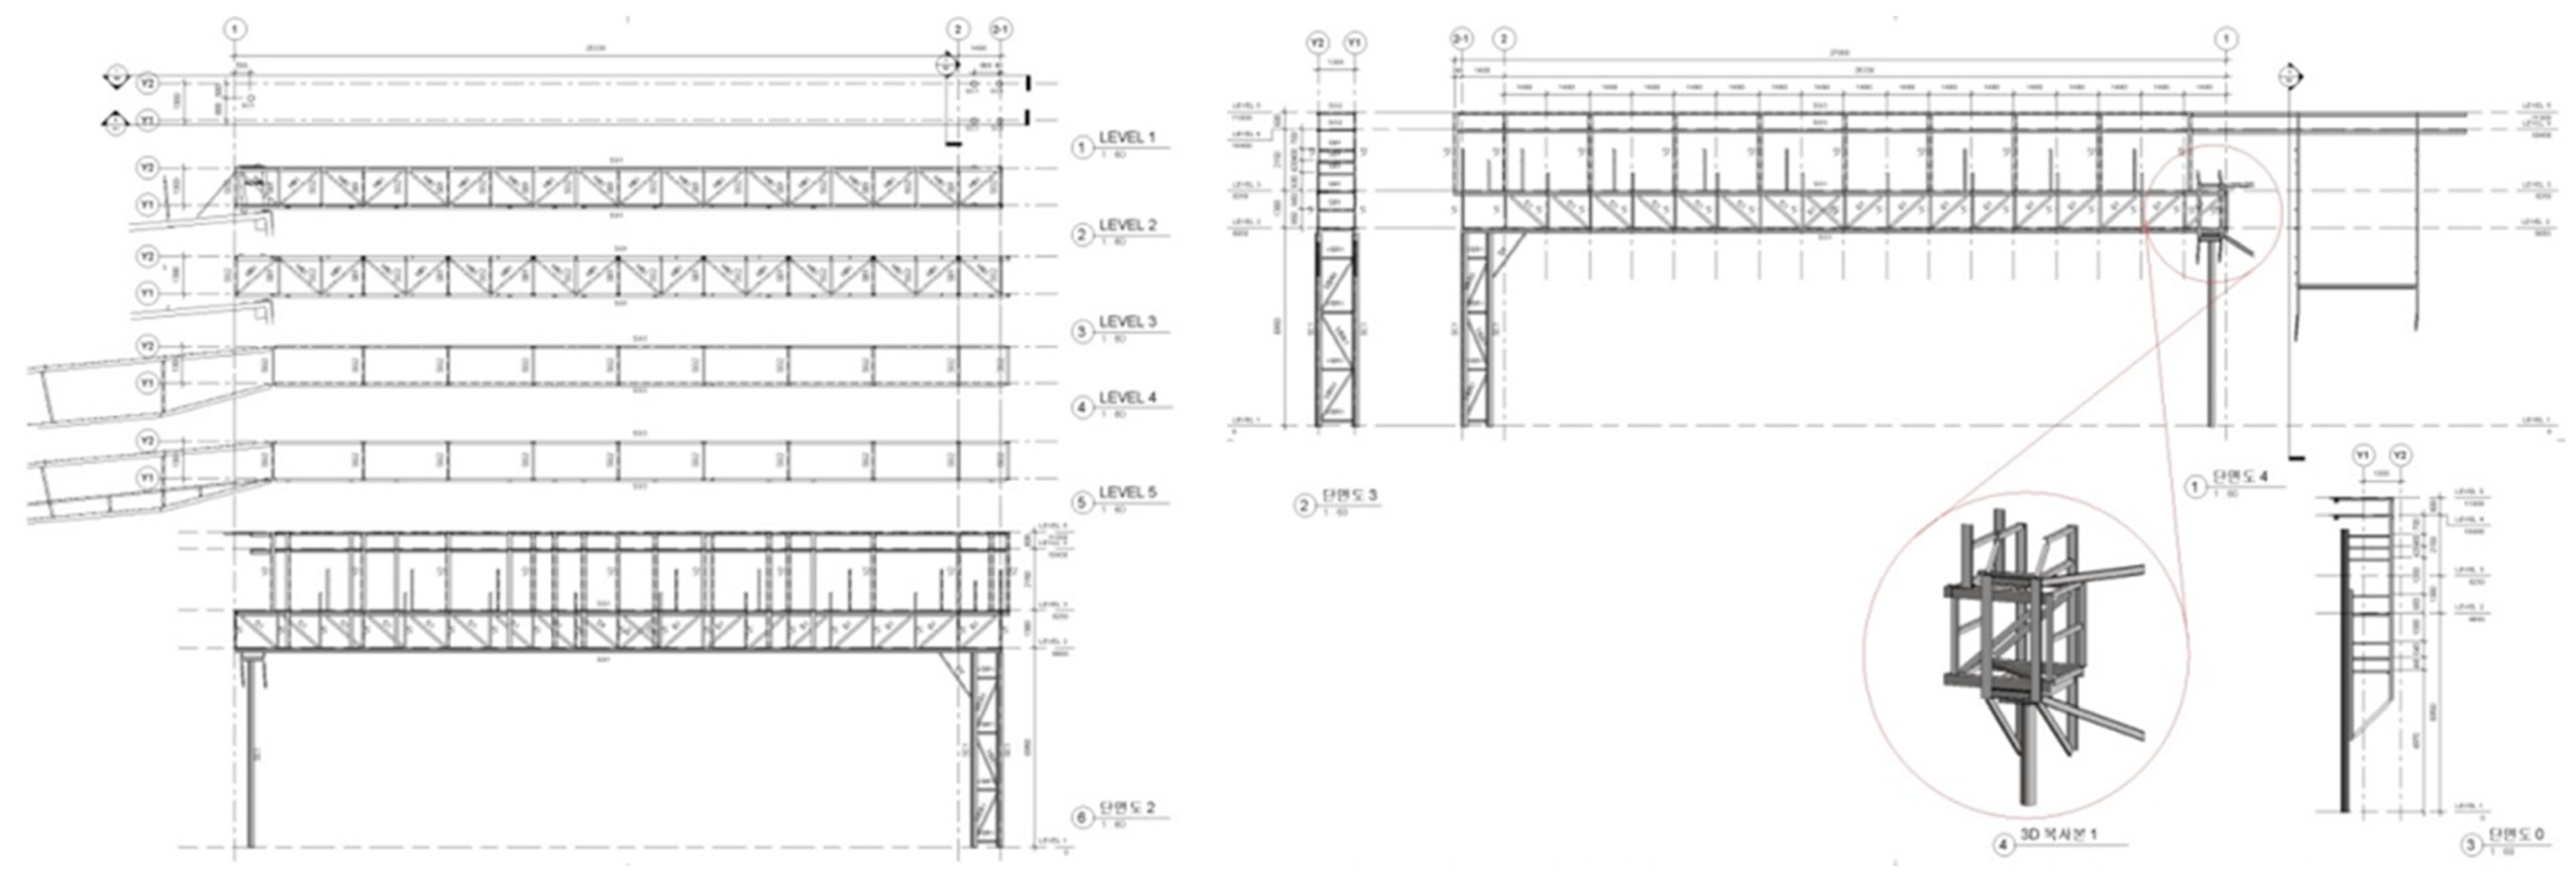
- The laser scanning data and the BIM model should be integrated on the basis of specific coordinates to more accurately analyze the results of the external condition of the large-scale civil infrastructure [18,26]. The integrated 3D model is used to determine the degree of displacement through cross-sectional analysis.
- (9)
- The field survey data concerning the internal conditions of a facility include information concerning the cross-section of constituents of the facility. The data include information concerning the cross-sectional status and performance of the components, such as the fire-resistant covering of steel components, film thickness, bolt-tightening force, neutralization information for reinforced concrete components, and compressive strength. Such information is directly surveyed from the field [10].
- (10)
- BIM data develops by reflecting the field survey data in terms of the internal conditions (e.g., material, size, etc.) of facilities [29].
- (11)
- The BIM model reflecting the internal characteristics of the facility can be utilized as a structural analysis model for accurate structural safety diagnosis [45]. Therefore, it is possible to easily extract a model for accurate structural analysis using BIM authoring tool (e.g., revit).
- (12)
- Data for accurate structural analysis can be generated using this model. Such data are used to repair and reinforce facilities [37].
- (13)
- Facilities are subject to deformation over time owing to the aging of the constituent materials or the effect of external forces. Therefore, the information generation process for facilities can be repeatedly used according to the period of safety inspection of the corresponding facility [13]. Through this, it is possible to consistently manage safety and secure the data.
4. Case Study
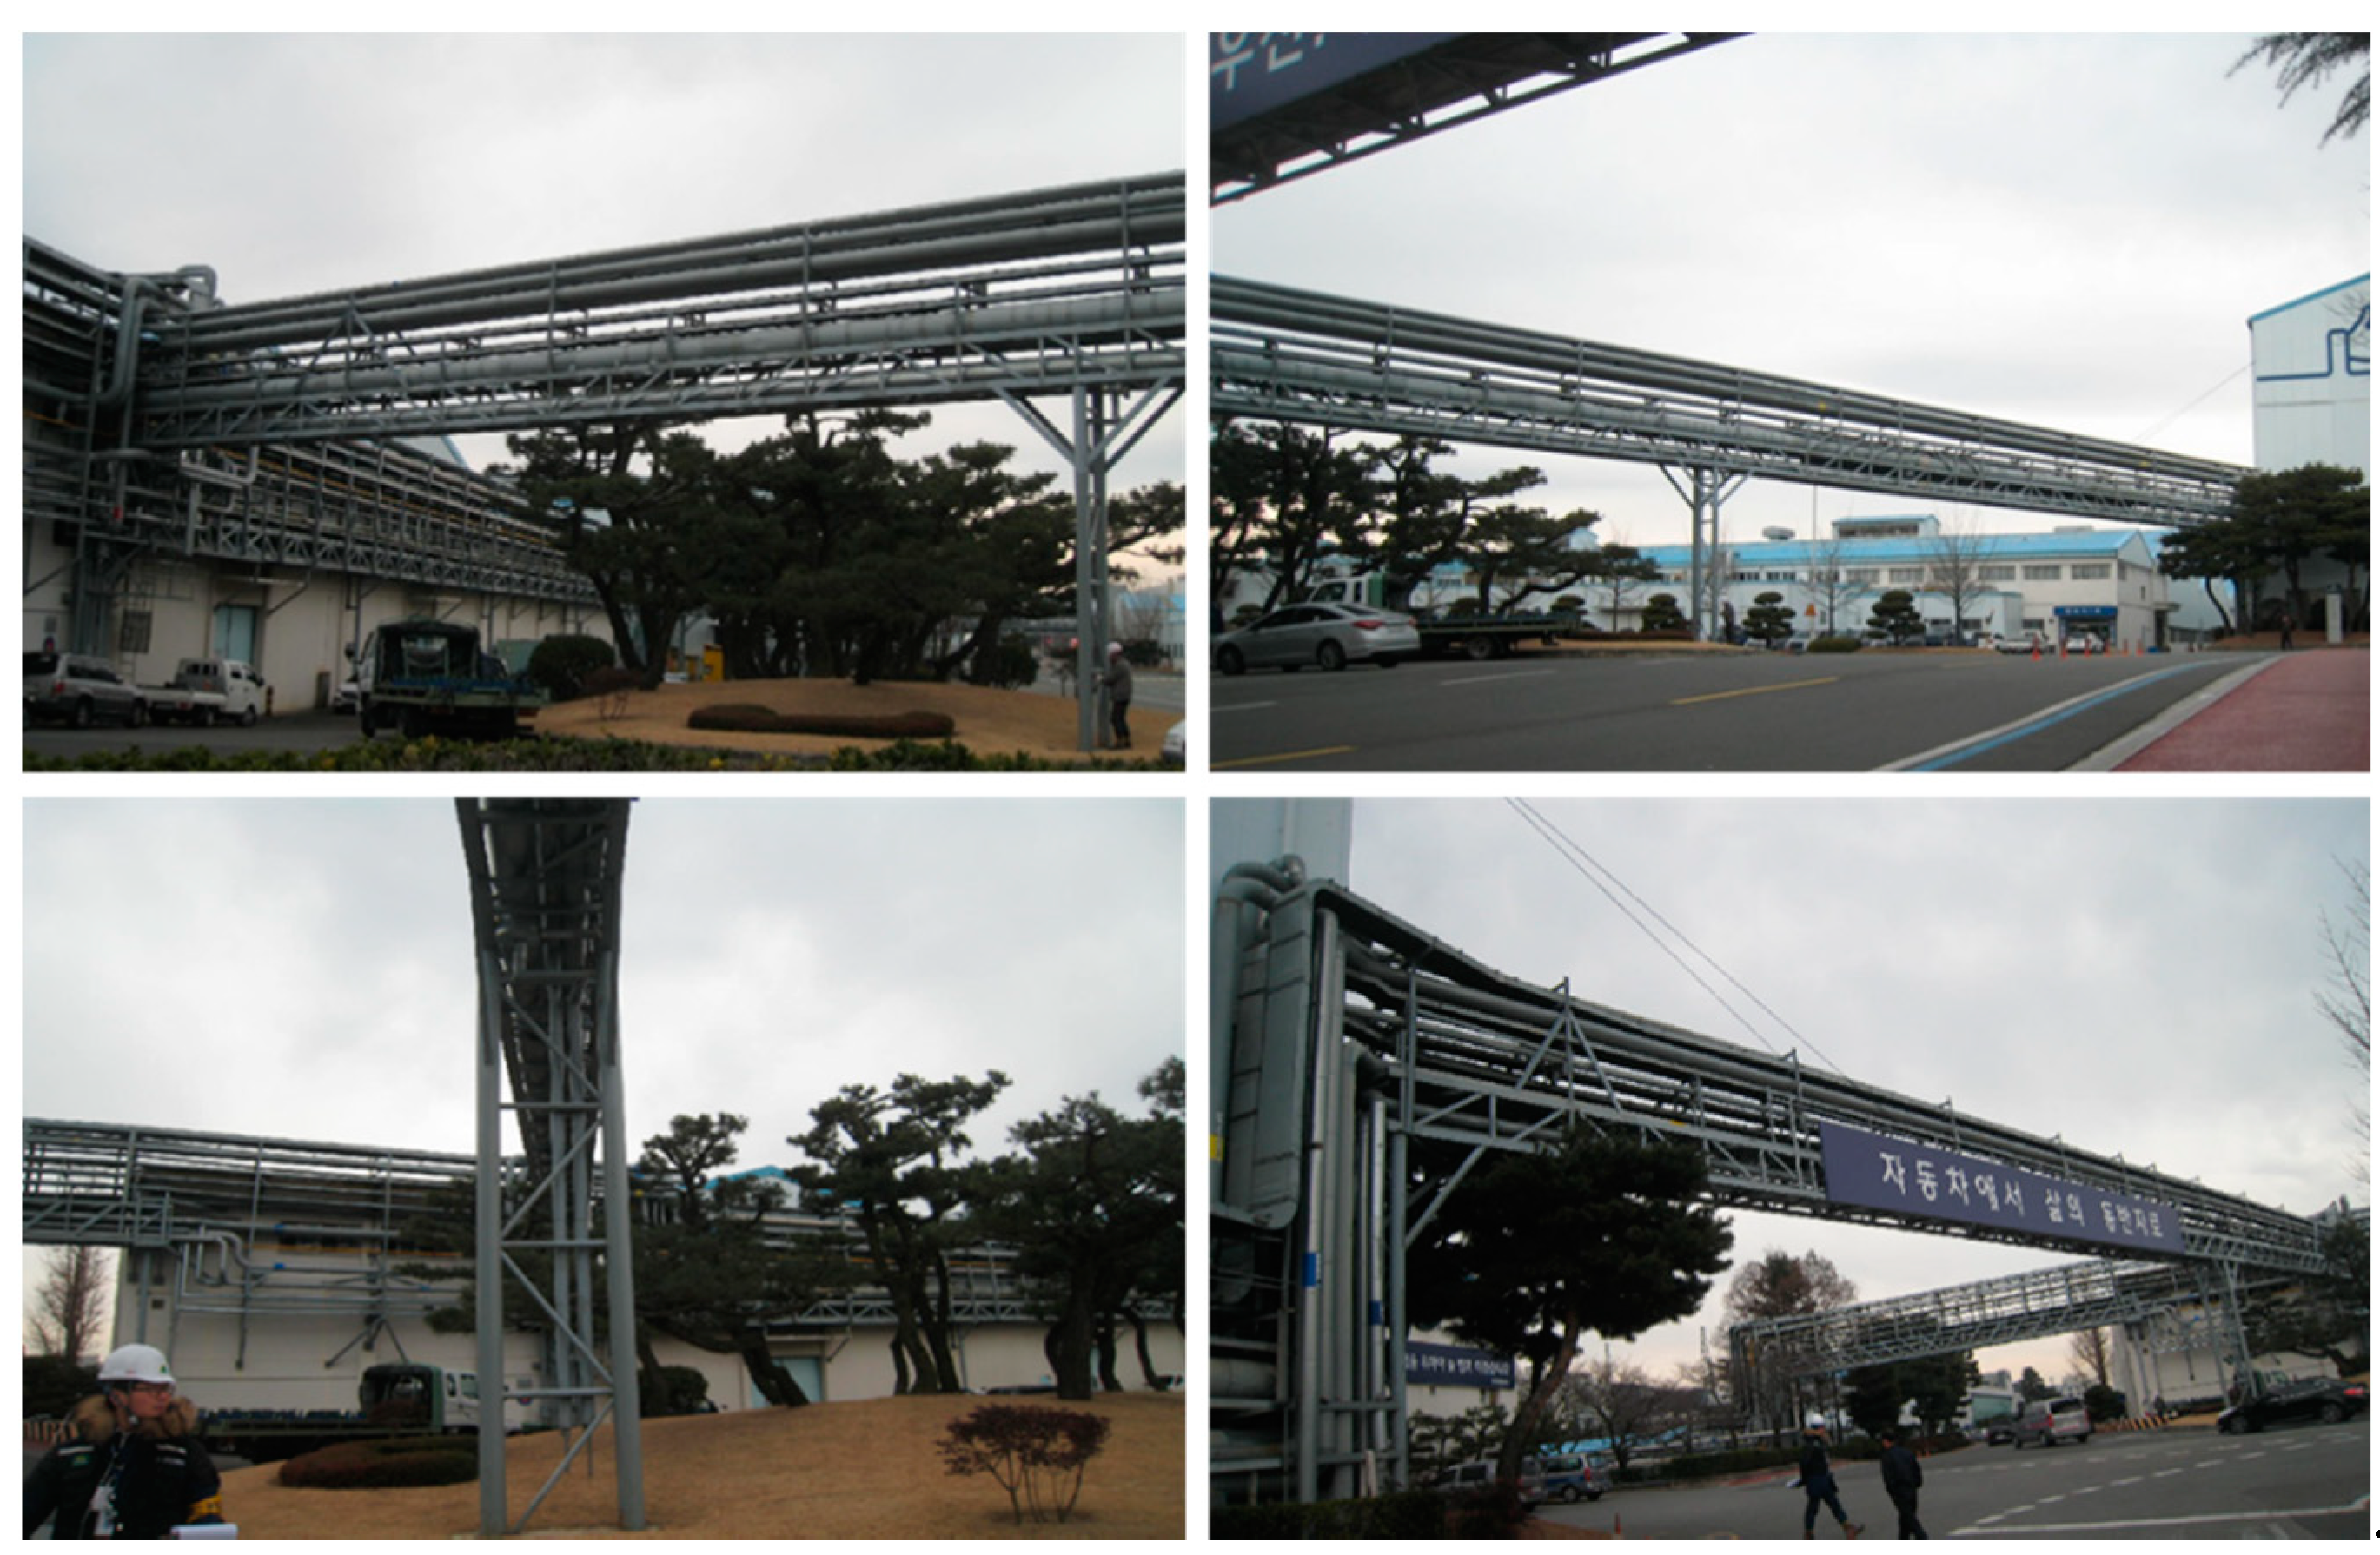
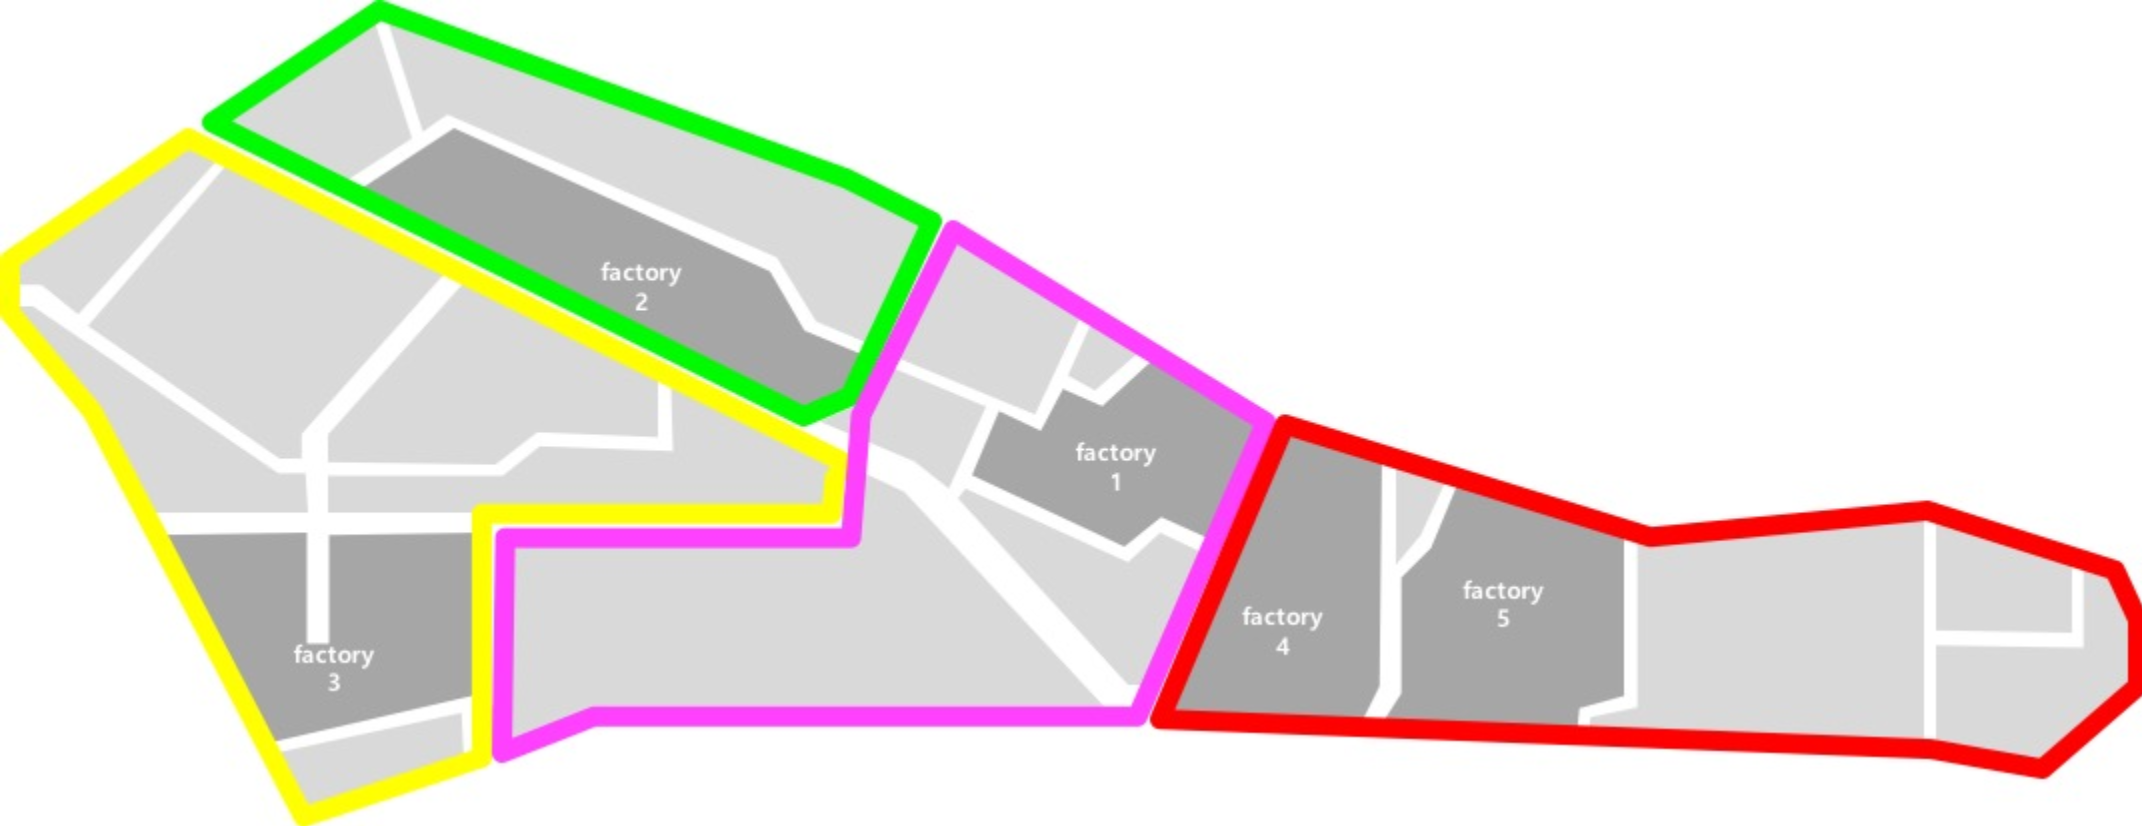
4.1. Project Description
4.2. Laser Scanning- and BIM-Based Civil Infrastructure Safety Inspection
4.2.1. Equipment
4.2.2. Process
Preliminary Field Survey
Preliminary Survey of the Location and Status of Target Building
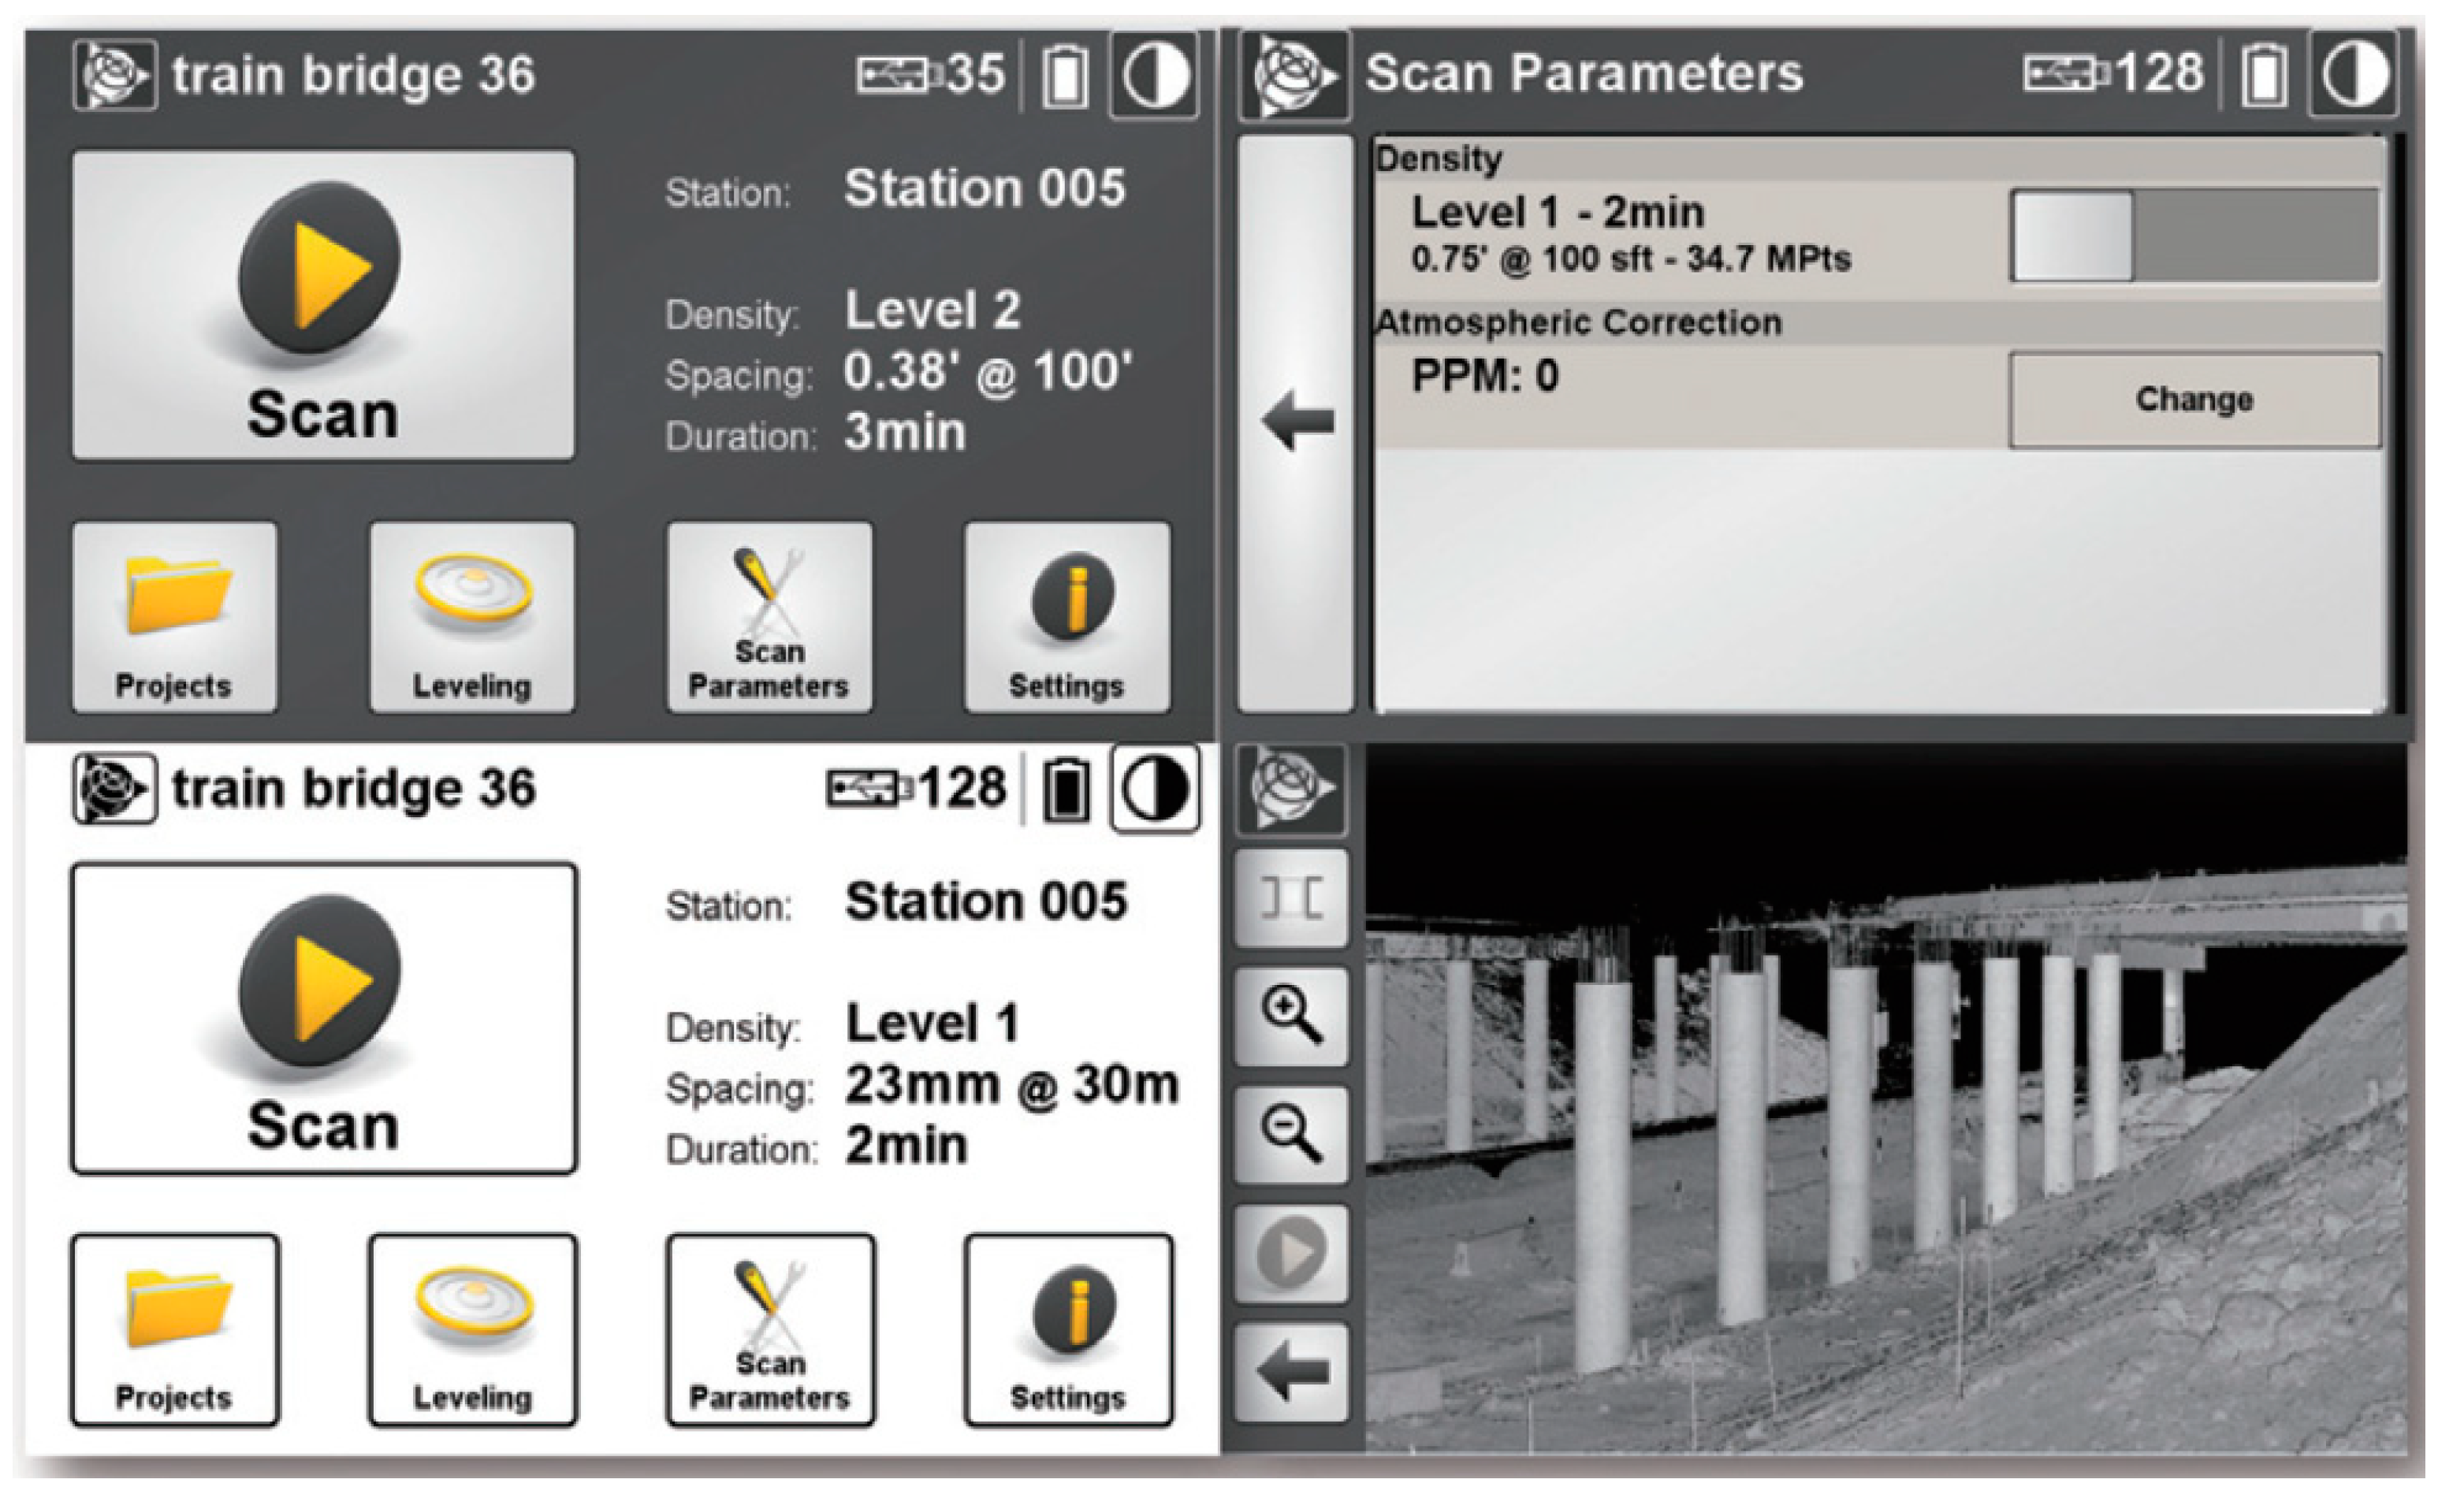
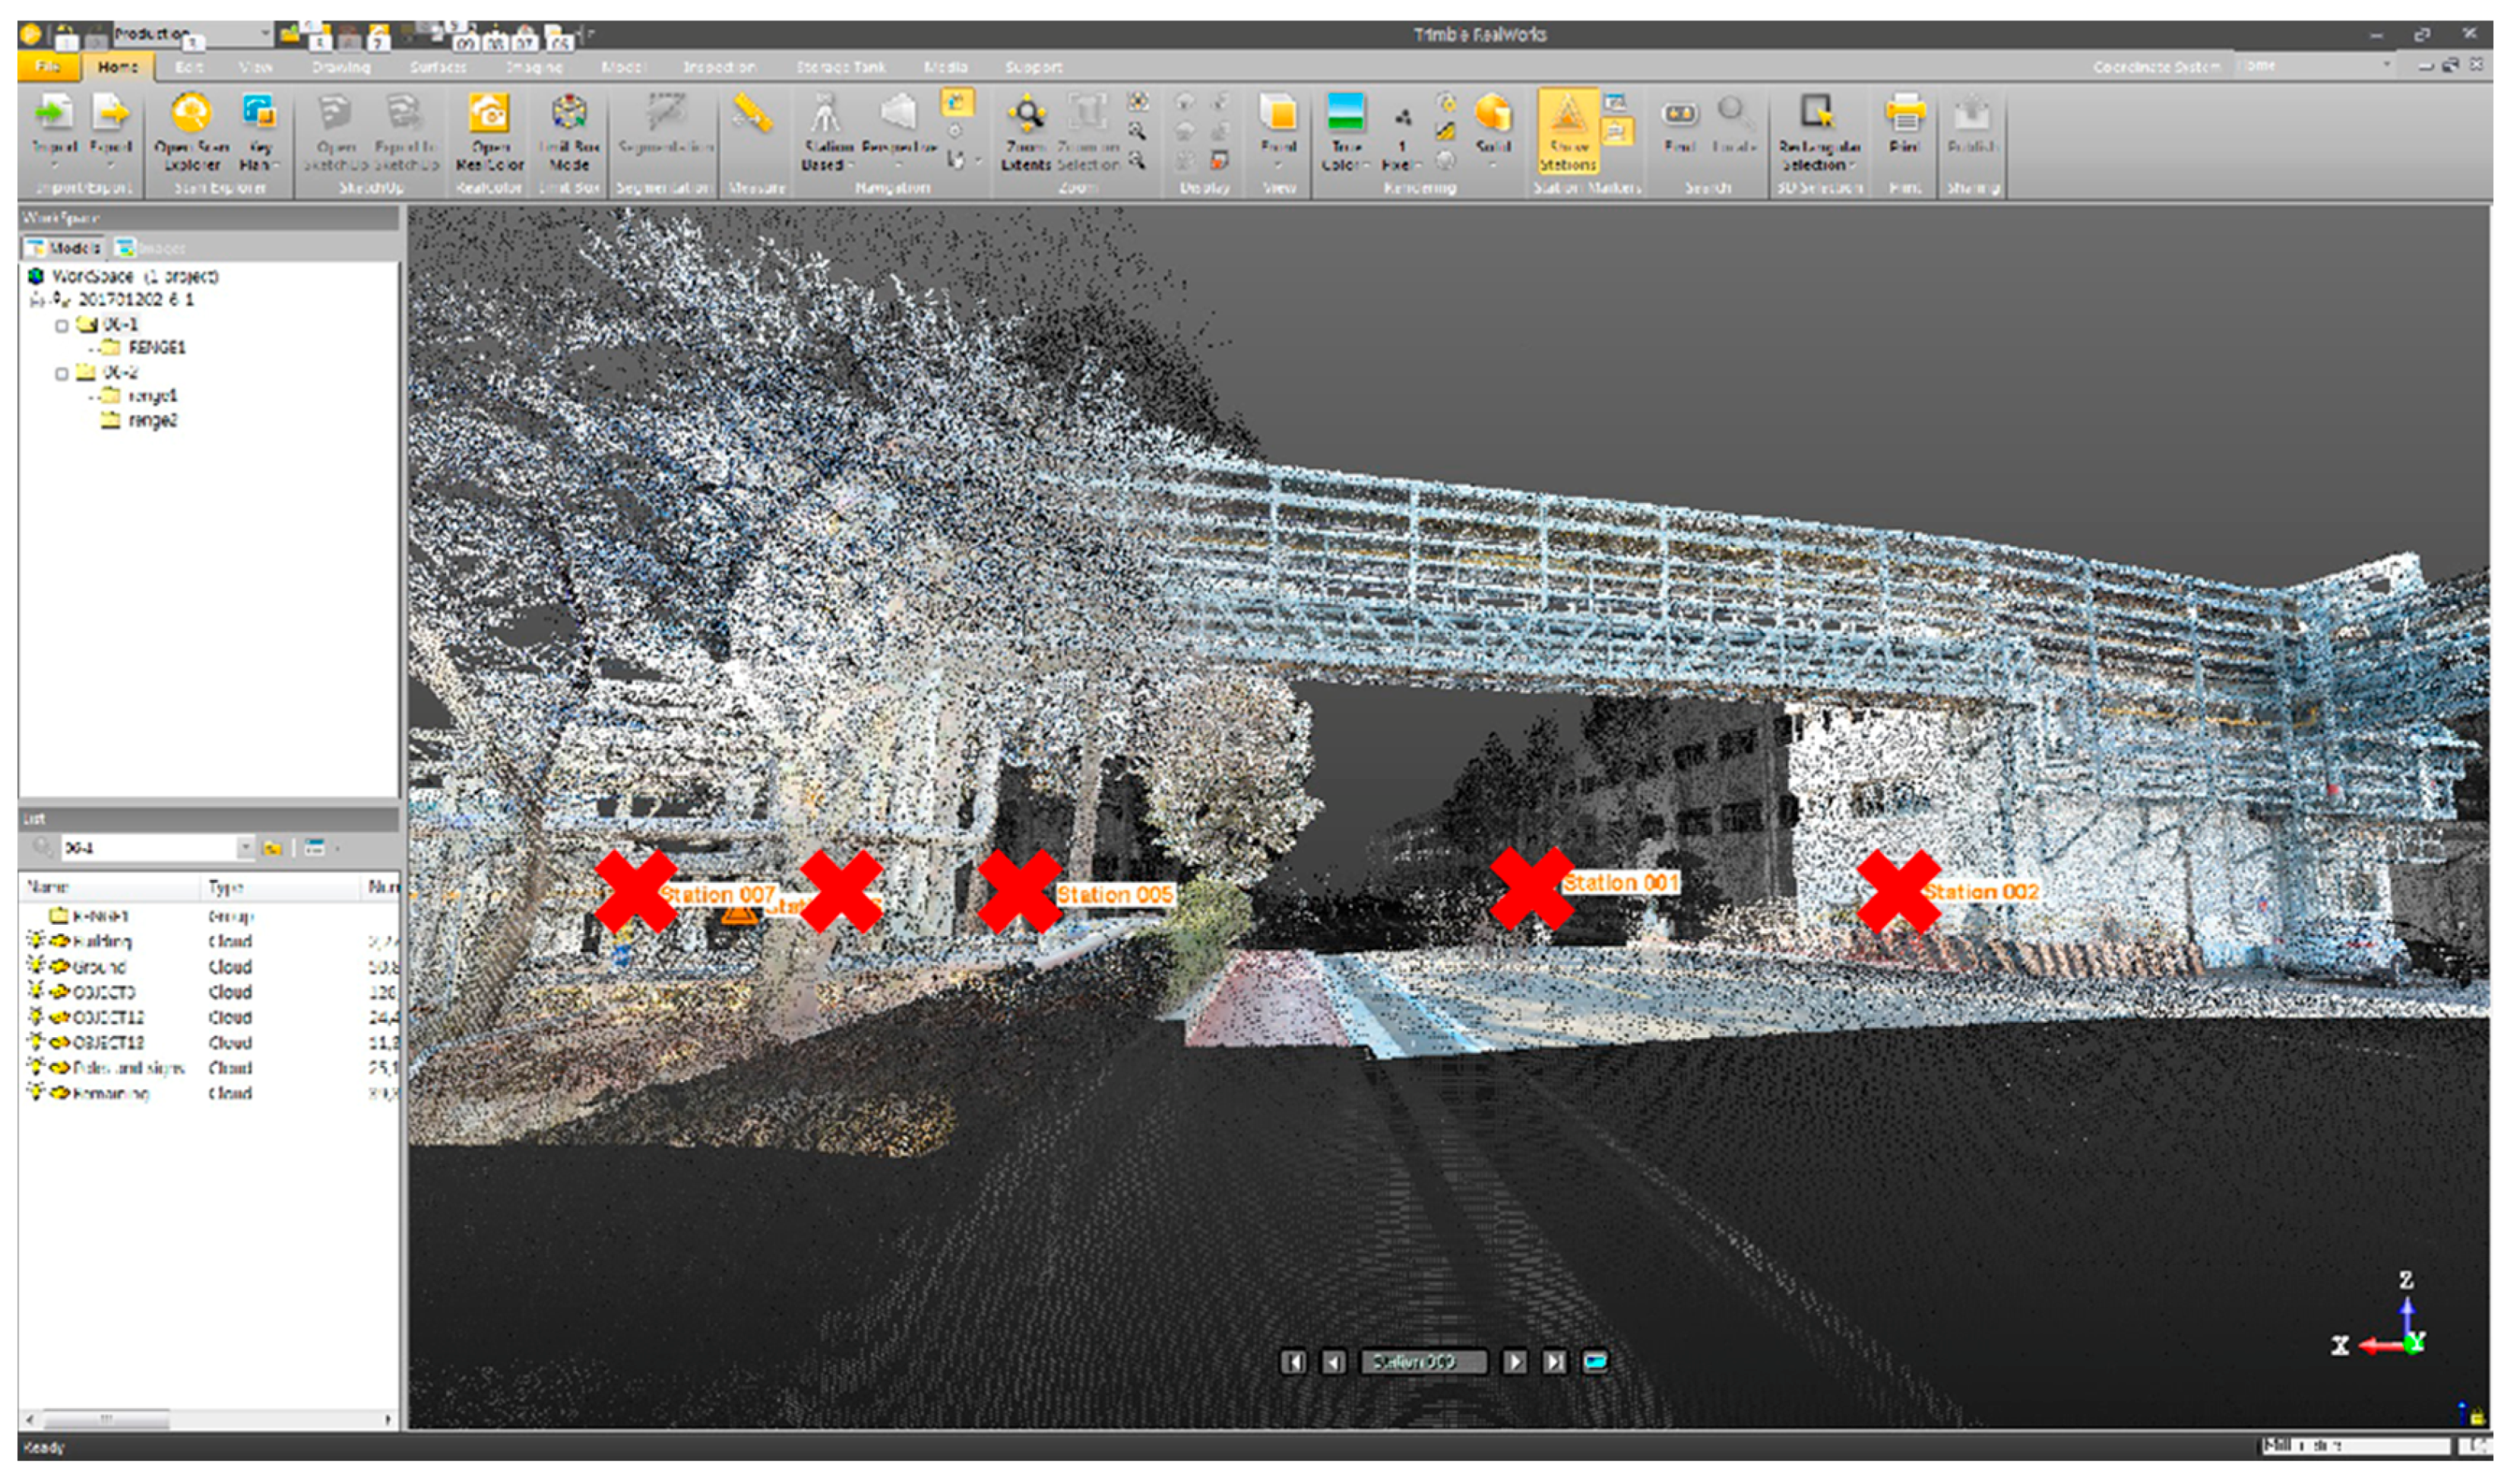
Laser Scanning
Generating BIM Data for Given Conditions
Method of Structural Safety Diagnosis
Facility Management Using Laser Scanning Data and a BIM Model
5. Discussion
6. Conclusions
Author Contributions
Funding
Acknowledgments
Conflicts of Interest
References
- Noor, M.N.M.; Pitt, M. A critical review on innovation in facilities management service delivery. Facilities 2009, 27, 211–228. [Google Scholar] [CrossRef]
- RICS. Royal Institute Chartered Surveyor (RICS). 2010. Available online: http://www.rics.org/my/knowledge/ (accessed on 13 January 2016).
- Turkan, Y.; Laflamme, S.; Tan, L. Terrestrial Laser Scanning-Based Bridge Structural Condition Assessment; Iowa State University: Ames, IA, USA, 2016. [Google Scholar]
- 3D Laser Mapping. The Road to Recovery: Using Mobile Laser Scanning for Highways & Rail. 2016 Copyright© 1999–2018 3D Laser Mapping. All Rights Reserved|Registered in England & Wales No. 03851557. Registered Office: Innovation House, Mere Way, Ruddington Fields Business Park, Nottingham. Available online: https://www.3dlasermapping.com/blog-post/lidarforhighwaysandrail/ (accessed on 24 October 2018).
- Weixing, W.; Weisen, Z.; Lingxiao, H.; Vivian, V.; Zhiwei, W. Applications of terrestrial laser scanning for tunnels: A review. J. Traffic Transp. Eng. 2014, 1, 325–337. [Google Scholar]
- Michael, S. Guidelines on Laser Scanning in Plant Design 201, 5th ed.; Fraunhofer Institute for Factory Operation and Automation IFF: Freiburg, Germany, 2018; pp. 1–22. Available online: https://www.iff.fraunhofer.de/content/dam/iff/en/documents/publications/guidelines-on-laser-scanning-in-plant-design.pdf (accessed on 24 October 2018).
- Mark, O. How to Use 3D Laser Scanning for Industrial Plant Design: An Engineer’s Guide—Part 3: Estimating Scanning Costs. Insights from the Engineers of Matrix Technologies. 2018. Available online: http://matrixti.com/matrix-on-manufacturing/how-to-use-3d-laser-scanning-for-industrial-plant-design-an-engineers-guide-part-3-estimating-scanning-costs/ (accessed on 24 October 2018).
- KISTEC. Facility Management System. 2018. Available online: https://www.fms.or.kr/ (accessed on 24 October 2018).
- Kang, T. Study on 3D image scan-based MEP facility management technology. J. KIBIM 2016, 6, 18–26. [Google Scholar] [CrossRef]
- KISTEC. Detailed Guidelines on the Safety and Maintenance of Facilities (Safety Inspection and Diagnosis); KISTEC: San Diego, CA, USA, 2018. [Google Scholar]
- Nuttens, T.; Stal, C.; Backer, H.D.; Schotte, K.; Bogaert, P.V.; Wulf, A.D. Methodology for the ovalization monitoring of newly built circular train tunnels based on laser scanning: Liefkenshoek Rail Link (Belgium). Autom. Constr. 2004, 43, 1–9. [Google Scholar] [CrossRef]
- Ryu, J. Development of an Automation System for Enhancing Infrastructure Safety Inspection Efficiency. Ph.D. Thesis, Incheon National University, Incheon, Korea, 2015. [Google Scholar]
- Park, H.S.; Lee, H.M.; Adeli, H. A new approach for health monitoring of structure: Terrestrial laser scanning. J. Comput. Aided Civ. Infrastruct. Eng. 2007, 22, 19–30. [Google Scholar] [CrossRef]
- Alsafouri, S.; Ayer, S.K. Review of ICT implementations for facilitating information flow between virtual models and construction project sites. Autom. Constr. 2018, 86, 176–189. [Google Scholar] [CrossRef]
- Kim, M.-K.; Cheng, J.C.; Chih-Chen Chang, H.S. A framework for dimensional and surface quality assessment of precast concrete elements using BIM and 3D laser scanning. Autom. Constr. 2015, 49, 225–238. [Google Scholar] [CrossRef]
- RIEGL VZ-6000. Technical Specification, RIEGL Inc. 2014. Available online: http://www.riegl.com/nc/products/terrestrial-scanning/ (accessed on 5 September 2018).
- Bernardini, F.; Rushmeier, H. The 3D model acquisition pipe line. Comp. Graph. Forum 2002, 21, 149–172. [Google Scholar] [CrossRef]
- Son, S.; Park, H.; Lee, K.H. Automated laser scanning system for reverse engineering and inspection. Int. J. Mach. Tool. Manuf. 2002, 42, 889–897. [Google Scholar] [CrossRef]
- Kim, C.; Son, H.; Kim, C. Automated construction progress measurement using a 4D building information model and 3D data. Autom. Constr. 2013, 31, 75–82. [Google Scholar] [CrossRef]
- Priestnall, G.; Jaafar, J.; Duncan, A. Extracting urban features from LiDAR digital surface models. Comput. Environ. Urban Syst. 2000, 24, 65–78. [Google Scholar] [CrossRef]
- Hajian, H.; Becerik-Gerber, B. A research outlook for real-time project information management by integrating advanced field data acquisition systems and building information modeling. Comput. Civ. Eng. 2009, 83–94. [Google Scholar] [CrossRef]
- Teizer, J.; Caldas, C.H.; Haas, C.T. Real-time three-dimensional occupancy grid modeling for the detection and tracking of construction resources. J. Constr. Eng. Manag. 2007, 133, 880–888. [Google Scholar] [CrossRef]
- El-Omari, S.; Moselhi, O. Integrating 3D laser scanning and photogrammetry for progress measurement of construction work. Autom. Constr. 2008, 18, 1–9. [Google Scholar] [CrossRef]
- FARO. Focus-3D Technical Specification. Available online: http://www.farocom/products/3d-surveying/laser-scanner-faro-focus-3d/overview/ (accessed on 5 September 2018).
- Olsen, M.J.; Kuester, F.; Chang, B.J.; Hutchinson, T.C. Terrestrial laser scanning-based structural damage assessment. J. Comput. Civ. Eng. 2010, 24, 264–272. [Google Scholar] [CrossRef]
- Nahangi, M.; Czerniawski, T.; Haas, C.T. Automated 3D Shape Detection and Outlier Removal in Cluttered Laser Scans of Industrial Assemblies. In Proceedings of the International Conference of Innovation in Construction, Beijing, China, 24–26 May 2015; pp. 1–10. [Google Scholar]
- Son, H.; Na, J.; Kim, C. Semantic As-built 3D Modeling of Buildings under Construction from Laser Scan Data Based on Local Convexity without an As-planned Model. In Proceedings of the ISARC International Symposium on Automation and Robotics in Construction, Oulu, Finland, 15–18 June 2015; Volume 32, pp. 1–6. [Google Scholar] [CrossRef]
- Gimenez, L.; Hippolyte, J.L.; Robert, S.; Suard, F.; Zreik, K. Review: Reconstruction of 3D building information models from 2D scanned plans. J. Build. Eng. 2015, 2, 24–35. [Google Scholar] [CrossRef]
- Bosche, F.; Ahmed, M.; Turkan, Y.; Haas, C.T.; Haas, R. The value of integrating scan-to-BIM and scan-vs-BIM techniques for construction monitoring using laser scanning and BIM: The case of cylindrical MEP components. Autom. Constr. 2015, 49, 201–213. [Google Scholar] [CrossRef]
- Reeder, G.D.; Nelson, G.A. Implementation Manual 3D Engineered Models for Highway Construction: The IOWA Experience. 2015. Available online: https://lib.dr.iastate.edu/intrans_reports/130/ (accessed on 1 September 2018).
- Murphy, K.; van Ginneken, B.; Klein, S.; Staring, M.; de Hoop, B.J.; Viergever, M.A.; Pluim, J.P. Semiautomatic construction of reference standards for evaluation of image registration. Med. Image Anal. 2011, 15, 71–84. [Google Scholar] [CrossRef] [PubMed]
- Bhatla, A.; Choe, S.Y.; Fierro, O.; Leite, F. Evaluation of accuracy of as-built 3D modeling from photos taken by handheld digital cameras. Autom. Constr. 2012, 28, 116–127. [Google Scholar] [CrossRef]
- Bosche, F. Automated recognition of 3D CAD model objects in laser scans and calculation of as-built dimensions for dimensional compliance control in construction. Adv. Eng. Inform. 2010, 24, 107–118. [Google Scholar] [CrossRef] [Green Version]
- Shih, N.J.; Wang, P.H. Using Point Cloud to Inspect the Construction Quality of Wall Finish. In Proceedings of the 22nd eCAADe Conference, Copenhagen, Denmark, 15–18 September 2004; pp. 573–578. [Google Scholar]
- Akinci, B.; Boukamp, F.; Gordon, C.; Huber, D.; Lyons, C.; Park, K. A formalism for utilization of sensor systems and integrated project models for active construction quality control. Autom. Constr. 2006, 15, 124–138. [Google Scholar] [CrossRef] [Green Version]
- Han, S.; Choe, H.; Kim, S. Automated and efficient method for extraction of tunnel cross-sections using terrestrial laser scanned data. J. Comput. Civ. Eng. 2013, 27, 274–281. [Google Scholar] [CrossRef]
- Gordon, S.; Lichti, D. Modeling terrestrial laser scanner data for precise structural deformation measurement. J. Surv. Eng. ASCE 2007, 133, 72–80. [Google Scholar] [CrossRef]
- Teza, G.; Galgaro, A.; Moro, F. Contactless recognition of concrete surface damage from laser scanning and curvature computation. NDTE Int. 2009, 42, 240–249. [Google Scholar] [CrossRef]
- Tang, P.; Huber, D.; Akinci, B. Characterization of laser scanners and algorithms for detection flatness defects on concrete surfaces. J. Comput. Civ. Eng. 2011, 25, 31–42. [Google Scholar] [CrossRef]
- Liu, W.; Chen, S.; Hauser, E. Lidar-based bridge structure defect detection. Exp. Tech. 2011, 35, 27–34. [Google Scholar] [CrossRef]
- Golparvar-Fard, M.; Bohn, J.; Teizer, J.; Savarese, S.; Peña-Mora, F. Evaluation of image-based modeling and laser scanning accuracy for emerging automated performance monitoring techniques. Autom. Constr. 2011, 20, 1143–1155. [Google Scholar] [CrossRef]
- Brilakis, I.; Lourakis, M.; Sacks, R.; Savarese, S.; Christodoulou, S.; Teizer, J.; Makhmalbaf, A. Toward automated generation of parametric BIMs based on hybrid video and laser scanning data. Adv. Eng. Inform. 2010, 24, 456–465. [Google Scholar] [CrossRef]
- Zeibak-Shini, R.; Sacks, R.; Ma, L.; Filin, S. Towards generation of as-damaged BIM models using laser-scanning and as-built BIM: First estimate of as-damaged locations of reinforced concrete frame members in masonry infill structures. Adv. Eng. Inform. 2016, 30, 312–326. [Google Scholar] [CrossRef]
- Akcamete, A.; Akinci, B.; Garrett, J.H. Potential Utilization of Building Information Models for Planning Maintenance Activities. In Proceedings of the International Conference on Computing in Civil and Building Engineering, Nottingham, UK, 3 June–2 July 2010; Tizani, W., Ed.; Nottingham University Press: Nottingham, UK, 2010; pp. 151–157. [Google Scholar]
- Arayici, Y.; Onyenobi, T.; Egbu, C. Building information modelling (BIM) for facilities management (FM): The mediacity case study approach. Int. J. Inform. Model. 2012, 1, 55–73. [Google Scholar] [CrossRef]
- Barlish, K.; Sullivan, K. How to measure the benefits of BIM–A case study approach. Autom. Constr. 2012, 24, 149–159. [Google Scholar] [CrossRef]
- Becerik-Gerber, B.; Jazizadeh, F.; Li, N.; Calis, G. Application areas and data requirements for BIM-enabled facilities management. J. Constr. Eng. Manag. 2012, 138, 431–442. [Google Scholar] [CrossRef]
- Volk, R.; Stengel, J.; Schultmann, F. Building information modeling (BIM) for existing buildings—Literature review and future needs. Autom. Constr. 2014, 38, 109–127. [Google Scholar] [CrossRef]
- Ani, A.I.C.; Johar, S.; Tawil, N.M.; Razak, M.Z.A.; Hamzah, N. Building Information Modeling (BIM)-based building condition assessment: A survey of water ponding defect on a flat roof. J. Teknol. Sci. Eng. 2015, 9, 25–31. [Google Scholar]
- Smith, D.K.; Tardif, M. Building Information Modelling: A Strategic Implementation Guide for Architects, Engineers, Contractors, and Real Estate Asset Management; John Wiley & Sons: Hoboken, NJ, USA, 2009. [Google Scholar]
- Berahim, N.; Jaafar, M.N.; Razali, M.N. A Review on the Principle of Governance in Asset Management to Enhance the Performance of Local Authority in Malaysia. In Proceedings of the Global Conference on Business, Economics and Social Sciences 2013, Kuala Lumpur, Malaysia, 25–26 June 2013; pp. 262–273. [Google Scholar]
- Lee, H.J.; Kang, S.Y.; Lee, S.H.; Song, S.H. 3D Laser Scanner for Reverse Engineering. Magazine of KIBIM, 29 September 2015; 25–41. [Google Scholar]
- Kim, K.Y.; Chae, J.H. Introduction to Reverse Engineering Process and Practical Examples: BIM Practice 4. Magazine of KIBIM, 29 September 2015; 67–79. [Google Scholar]
- Speed, V. How to Laser Scan a Bridge in Five Days. 2015. Available online: http://lidarmag.com/wp-content/uploads/PDF/LiDARNewsMagazine_Speed-ScanABridgeInFiveDays_Vol5No3.pdf (accessed on 24 October 2018).


| Category | Specification |
|---|---|
| Scan speed | 1,000,000 pts/s |
| Scan range | Horizontal 360°/vertical 317° |
| Scan distance | 0.6–340 m |
| Scan time | 2–14 min |
| IP rating | IP 54 |
| Accuracy | 1 mm (2–80 m) |
| Laser class | Class 1 |
| RGB | External camera |
| Tilt sensor | O (0.5″) |
| Operating temperature | 0–40 °C |
| No. of Survey Sections | Scope of Structural Safety Diagnosis Using Laser Scanning: Straight Length (mm) |
|---|---|
| No. 1 | 50,000 |
| No. 2 | 133,200 |
| No. 3 | 79,180 |
| No. 4 | 96,240 |
| No. 5 | 57,300 |
| No. 6 | 143,130 |
| No. 7 | 144,700 |
| No. 8 | 26,820 |
| No. 9 | 61,130 |
| No. 10 | 55,780 |
| No. 11 | 38,240 |
| No. 12 | 39,200 |
| No. 13 | 34,280 |
| Total | 959,200 |
| Location of Measurement | Column Height | Direction of Displacement | Angle of Displacement | Degree of Displacement | Displacement Ratio |
|---|---|---|---|---|---|
| X1/Y2 | 7700 | 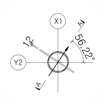 | 0.09 | 12 | Below 1/1000 |
| X1-1/Y1 | 7700 | 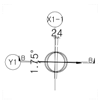 | 0.18 | 24 | 1/320 |
| X2/Y2 | 6300 |  | 0.86 | 95 | 1/66 |
| X2-1/Y1 | 6300 | 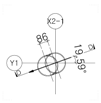 | 0.78 | 86 | 1/73 |
| X3/Y2 | 5855 | 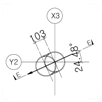 | 1.01 | 103 | 1/57 |
| X3-1/Y1 | 5855 | 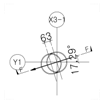 | 0.61 | 63 | 1/93 |
| Location of Measurement | X1/Y2 | X1-1/Y1 | X2/Y2 | X2-1/Y1 | X3/Y2 | X3-1/Y1 |
|---|---|---|---|---|---|---|
| Section view of column | 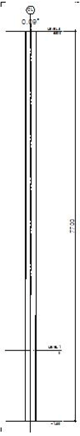 | 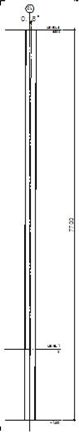 | 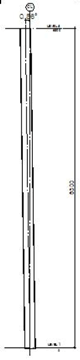 | 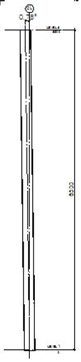 | 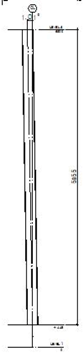 | 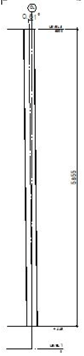 |
© 2018 by the authors. Licensee MDPI, Basel, Switzerland. This article is an open access article distributed under the terms and conditions of the Creative Commons Attribution (CC BY) license (http://creativecommons.org/licenses/by/4.0/).
Share and Cite
Ham, N.; Lee, S.-H. Empirical Study on Structural Safety Diagnosis of Large-Scale Civil Infrastructure Using Laser Scanning and BIM. Sustainability 2018, 10, 4024. https://doi.org/10.3390/su10114024
Ham N, Lee S-H. Empirical Study on Structural Safety Diagnosis of Large-Scale Civil Infrastructure Using Laser Scanning and BIM. Sustainability. 2018; 10(11):4024. https://doi.org/10.3390/su10114024
Chicago/Turabian StyleHam, Namhyuk, and Sang-Hyo Lee. 2018. "Empirical Study on Structural Safety Diagnosis of Large-Scale Civil Infrastructure Using Laser Scanning and BIM" Sustainability 10, no. 11: 4024. https://doi.org/10.3390/su10114024
APA StyleHam, N., & Lee, S.-H. (2018). Empirical Study on Structural Safety Diagnosis of Large-Scale Civil Infrastructure Using Laser Scanning and BIM. Sustainability, 10(11), 4024. https://doi.org/10.3390/su10114024