Article

Shrinkage Characteristics of Boulder Marl as Sustainable Mineral Liner Material for Landfill Capping Systems

by
Steffen Beck-Broichsitter
1,*,
Horst H. Gerke
1 and
Rainer Horn
2
1
Research Area 1 “Landscape Functioning”, Working Group “Hydropedology”, Leibniz-Centre for Agricultural Landscape Research (ZALF), Eberswalder Straße 84, 15374 Müncheberg, Germany
2
Institute of Plant Nutrition and Soil Science, Christian Albrechts University Kiel, Christian-Albrechts-Platz 4, 24118 Kiel, Germany
*
Author to whom correspondence should be addressed.
Sustainability 2018, 10(11), 4025; https://doi.org/10.3390/su10114025
Submission received: 24 September 2018 / Revised: 30 October 2018 / Accepted: 31 October 2018 / Published: 2 November 2018
(This article belongs to the Section Environmental Sustainability and Applications)

Abstract

:
The soil shrinkage behavior of mineral substrates needs to be considered for engineering long-term durable mineral liners of landfill capping systems. For this purpose, a novel three-dimensional laser scanning device was coupled with (a) a mathematical-empirical model and (b) in-situ tensiometer measurements as a combined approach to simultaneously determine the shrinkage behavior of a boulder marl, installed as top and bottom liner material at the Rastorf landfill (Northern Germany). The shrinkage behavior, intensity, and geometry were determined during a drying experiment with undisturbed soil cores (100 cm3) from two soil pits; the actual in-situ shrinkage was also determined in 0.2, 0.5, 0.8, and 1.0 m depth by pressure transducer tensiometer measurements during a four-year period. The volume shrinkage index was used to describe the pore size dependent shrinkage tendency and it was classified as low (4.9%) for the bottom liner. The in-situ matric potentials in the bottom liner ranged between −100 and −150 hPa, even during drier periods, thus, the previously highest observed drying range (pre-shrinkage stress) with values below −500 hPa and −1000 hPa was not exceeded. Therefore, the hydraulic stability of the bottom liner was given.

1. Introduction

The growing world population is the major reason for an increasing amount of municipal solid waste (MSW), and therefore, engineered landfills with its low operation costs are still the first choice for global waste disposal in most areas of the world (i.e., Eastern Europe, India, China) [1]. From the environmental point of view, landfills protect the main emitting waste body from the surrounding area, including agricultural land and inhabited regions [2]. In order to ensure these protective functions, the technical standards of landfill capping systems when considering the potential environmental impact of methane emissions and leachate percolation in the groundwater through leaking bottom liner are necessarily fixed in the country-specific statutory requirements [3]. Essentially, landfill capping systems are installed to restrain gas emissions (methane) and to minimize the leachate generation (infiltrated water contaminated with for example heavy metals) through (a) high available water capacity for the top liner (≥0.14 cm3/cm3 per meter) and (b) low permeation rates (<5 × 10⁻⁹ m/s equal to 0.5 m thickness and a hydraulic gradient of i = 0.3) and (c) low shrinkage tendency (VSI < 5%) for the bottom liners [4,5,6]. Hence, mineral substrates (i.e., clay, marl) are often used as top and bottom liners of landfills in combination with synthetic polymers, but they can also substitute the latter to enable the sustainable use of natural resources. As notified before, annually recurring wetting and drying cycles potentially limit the long-term performance of landfill liners due to shrinkage crack formation [7].
Therefore, the sealing function of bottom liner is not guaranteed if the observed field matric potential through tensiometer measurements within the mineral substrates is more negative than the pre-shrinkage strength (in-situ matric potentials during liner installation, marsh clay: −100 to −150 hPa, boulder marl: −300 to −500 hPa) [2,8], resulting in the preferential flow of water or solutes through newly formed shrinkage cracks [9]. The consequences of this would be increasing diffuse methane emissions and leachate generation rates, while the bottom liner as last barrier before the waste body would be permanently disabled; the landfill must be recovered in a cost-intensive way. Accordingly, the choice of appropriate materials and knowledge about its chemical and physical properties are essential for installing sustainable and long-term steady landfill capping systems.
For this purpose, the Rastorf landfill (Schleswig-Holstein, Germany) was temporary capped (from 2007 until today) with locally available boulder marl with a degree of compaction of 85% of Proctor density (2.02–2.7 g/cm3) in the top liner (0–0.7 m) and ≥95% in the bottom layer (0.7–1.0 m) when considering its less pronounced shrinkage crack potential, even in drier periods, as mentioned follows [2]. The temporary system was installed to slowly shut-down the ′bioreactor’ through microbial decomposition of the heterogeneous structured waste body subsiding the settlements before the installation of the final capping systems [3,8]. Therefore, the legal standards of the latter should be generally respected if transferring the temporary system or parts of it into the final capping system.
This study presents combined field and laboratory measurements to evaluate the shrinkage behavior, geometry, and tendency of the installed boulder marl in its function as top and bottom liner material of a landfill capping system. The objective of the study was to establish a consistent approach using the concept of critical matric potentials to evaluate the capability of a mineral liner material when considering a new three-dimensional measurement device to analyze the matric-potential induced shrinkage-crack formation combined with a mathematical-empirical model and in-situ tensiometer measurements. The authors hypothesized that the pre-shrinkage stress strongly affects the in-situ matric potential characteristics of the top and bottom liner, and therefore the matric potential induced shrinkage-crack formation of the tested material.
In the author’s opinion, the proposed approach may contribute to the actual research when considering soil chemical and physical knowledge for engineering landfill capping systems in a sustainable way using mineral liner materials.

2. Materials and Methods

2.1. Study Site

The Rastorf landfill (lat. 54°16′ N, long. 10°19′ E) in Schleswig-Holstein (Northern Germany) was actively operated from February 1977 to May 2005 and about 2.0 million tons of municipal domestic wastes were deposited in it. The cross section consists of a 1.0 m thick mineral, temporary capping system with a partially permeable top liner (humus topsoil: 0.4 m, humus-poor subsoil: 0.3 m). Below this liner, is a low permeable 0.3 m thick bottom liner, which serves as a water and root barrier to prevent leachate generation and groundwater contamination (Figure 1).
A high-density polyethylene layer of 2.5 mm thickness and an added drainage system above the clayey bottom layer collect the leachate before treatment by reverse osmosis.
The landfill surface is covered with a mixture of locally occuring grass species: perennial ryegrass (Lolium perenne), meadow fescue (Festuca pratensis), red fescue (Festuca rubra), sheep fescue (Festuca ovina), and orchard grass (Dactylis glomerata) with a surface distribution up to 90–95%. The rest is distributed among white clover (Trifolium repens) and red clover (Trifolium pratense) and several meadow herbs with, for example, yarrow (Achillea millefolium), while two cuts per year are essential for avoiding deeper-rooting bush or shrub species.

2.2. Laboratory Analysis

In 2015, more than 120 undisturbed soil cores (diameter: 5.5 cm, height: 4 cm) and disturbed soil material were collected from two soil pits at a slightly sloped culmination area in the north-east area of the landfill (54°28′ N, 10°32′ E) in depths of 0.05, 0.2, 0.5, and 0.8 m. The disturbed material was used to determine following soil physical and chemical parameters (i.e., soil organic carbon, soil texture, pH value, particle density), and dry bulk density (ρt) with standardized methods [10], n = 4 repeated measurements per depth. On the other hand, the undisturbed soil cores were used to determine the saturated hydraulic conductivity (Ks) by the falling head method [11]; total porosity (TP) was calculated from the ratio between ρt and the particle density (2.61–2.65 g/cm3).
The water retention characteristics including the legally fixed air capacity (AC) and plant available water capacity (AWC) were estimated with a combined pressure plate (saturated, −30, −60, −150, −300, −500, and −1000 hPa) and ceramic vacuum outflow (−15,000 hPa) method, as well as being oven-dried for 16 h at 105 °C, respectively [10],
AC = θ s θ FC
AWC = θ FC θ PWP
where θs is the saturated water content (cm3/cm3) and the subscripted symbols FC (field capacity) and PWP (permanent wilting point) indicate the water content at −60 hPa and −15,000 hPa, respectively, n = 10–15 undisturbed soil cores per depth.
Simultaneous, the soil volume change at the different drying stages was estimated with the laser triangulation method [12,13], more in more detail described in Section 2.3.

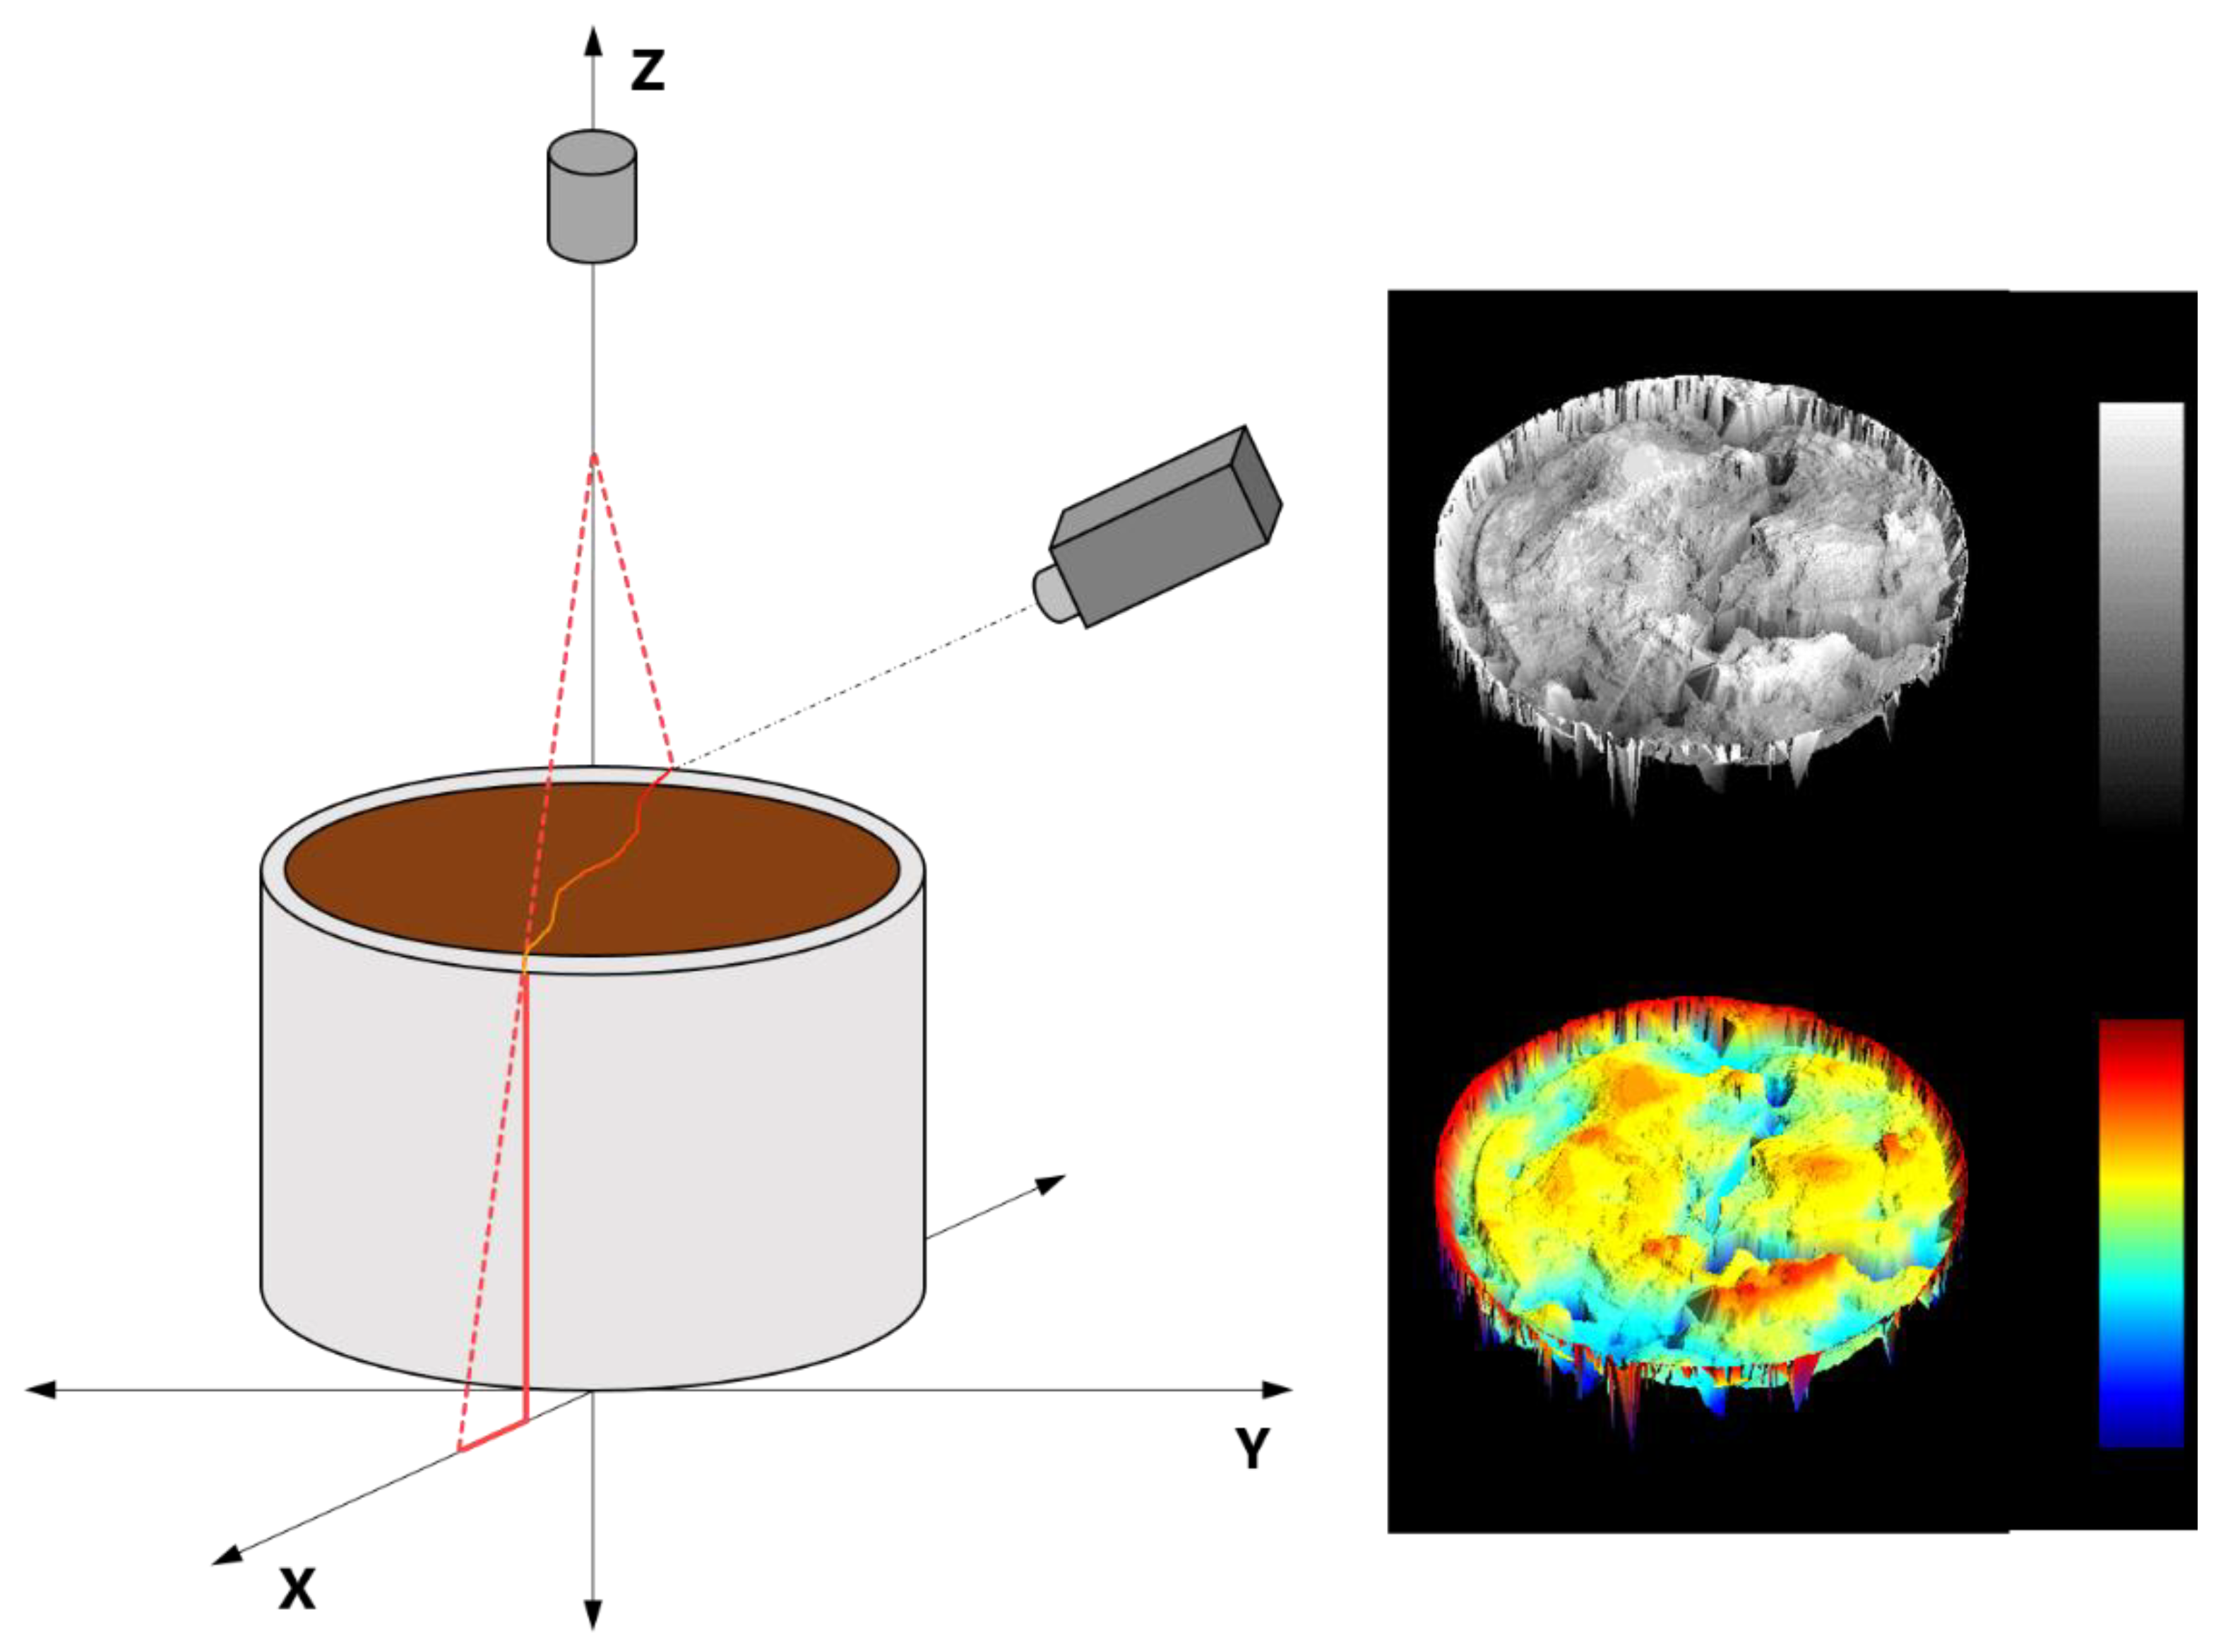
2.3. Shrinkage Behavior and Volume Shrinkage Index

Several noninvasive methods to evaluate the shrinkage behavior of mineral substrates are described as follows [12]. The laser triangulation (LT) principle and the technical functioning of the Soil-LT 100 (Umwelt-Geräte-Technik GmbH, Müncheberg, Germany) are well described, as follows [13,14] and the method was also proved in a past paper [8]. The used line laser CMS 106 with a wavelength of 0.66 µm (Control Micro Systems, Orlando, FL, USA) illuminates a soil sample along the soil sample cylinders surface (rotation center at the z-axis), depending on the scan area (Figure 2). During the rotation process, a digital camera captures a predefined number of profiles, while the camera is provided with a band-pass filter to segregate the laser signal (highlighted profile) in the captured image from the background. For the soil volume calculation, the measurement point on the sample surface will be meshed to a surface and the crack will be closed, thus, Soil-LT software version 2.0 (Umwelt-Geräte-Technik GmbH, Müncheberg, Germany) features a tool defining crack areas. Additionally, shrinkage cracks can be indirectly recognized in regions of no data, because there is no surface to reflect the laser beam [14].
Soil shrinkage curves are defined by the relation between the void ratio (e) and the moisture ratio (ϑ) [11,15],
e = V f V s
ϑ = V w V s
where Vw, Vf, and Vs are the volumes of water, pores, and soils (cm3/cm3), respectively.
There is also a wide range of mathematical-based statistic models [16,17], while the model in this study was selected when considering its validation standard for different soils, as described in several studies [18,19], even for compacted soils. Thus, the modified van Genuchten equation (1980) was applied to mathematically adjust the shrinkage curve [15],
e ( ϑ ) = { e r ϑ = 0 s e r + e s e r [ 1 + ( χ ϑ ) p ] q 0 ϑ ϑ s ; n > 0 e s ϑ = ϑ s }
where χ, p, and q are dimensionless fitting parameters, es and er are the saturated and residual void ratios fulfilling the following boundary conditions [15],
ϑ 0 ; ϑ e s θ 0 ; e e s
ϑ ϑ s ; ϑ e s ϑ ; e e s
A standard soil shrinkage curve can be divided into four phases: (a) structural shrinkage, (b) proportional shrinkage, (c) residual shrinkage, and (d) zero shrinkage, which were determined mathematically using Equation (5) [19,20].
The two extreme curvatures at the wet side (ϑshw and eshw) and dry side (ϑshd and eshd) of a sigmoidal shaped shrinkage curve are well described, as follows [15]. Furthermore, the maximum of the curve at the wet side (ϑshw and eshw) is determined as the transition point between the structural and the proportional shrinkage phase [20,21], and therefore the transition point is the critical matric potential value (ψmcrit) for the boulder marl in the mineral top and bottom liner [22].
The volume shrinkage index (VSI) describes the pore size dependent shrinkage tendency for wide coarse pores (wCP, > 50 µm, 0 to −60 hPa), narrow coarse pores (nCP, 50–10 µm, −60 to −300 hPa), medium pores (MP, 10–2 µm, −300 to −15,000 hPa), and fine pores (FP, < 2 µm, < −15,000 hPa), following [23,24],
VSI i = Δ V ti Δ V pi 1
where ∆Vt is the soil volume in relation to the drained water-filled pore volume (∆Vp) and i corresponds to the pore size of the respective drying stage, as mentioned before. The shrinkage tendency (VSI) can also be ranked into four classes: low (<5%), moderate (5–10%), high (10–15%), and very high (>15%), as follows [23]. Therefore, the lower the VSI, the higher the pre-shrinkage stress and the lower the amount of three-layer clay minerals (i.e., smectite), and also the self-healing potential through re-swelling.
The conversion of vertical shrinkage measurements into soil water content changes [25,26],
r s = ln V i V 0 ln z i z 0
where z is the layer thickness under quasi-saturated conditions (cm) and V is the volume change upon shrinkage (cm³), 0 is the initial volume (saturated condition), i corresponds to the pore size of the respective drying stage as mentioned before, and rs is the dimensionless geometry factor. The geometry factor can be described as follows: isotropic shrinkage, rs = 3; dominance of vertical shrinkage over shrinkage cracking, 1 < rs < 3; and, dominance of shrinkage cracking over vertical shrinkage, rs > 3.
The coefficient of activity (IA) describes the relationship between the Atterberg limits and the clay content [23,27],
I A = I P %   clay
where IP is the plasticity index. The IA values can be ranked into three classes: IA < 0.75 (inactive material), 0.75 < IA < 1.25 (normal active material), and > 1.25 (active material). The clay mineralogy was determined with X-ray diffraction analysis (D8 Discover, Bruker AXS, Billerica, MA, USA).

2.4. Continuous Measurements of Soil Hydrological Parameters

During January 2012 and December 2015, pressure transducer tensiometers with a stainless-steel membrane being continuously recorded on an hourly basis the matric potentials at depths of 0.2, 0.5, 0.8, and 1.0 m with three replications per depth to quantify the soil moisture dynamics of the temporary capping system as mentioned in Figure 1. The measuring range was between +200 and −850 hPa (Tensio 151; Umwelt-Geräte-Technik GmbH, Müncheberg, Germany) that were connected to a standard data logger DL 200 (Umwelt-Geräte-Technik GmbH, Müncheberg, Germany).
Additionally, a local weather station recorded the weather data (i.e., precipitation, wind speed, relative humidity) and the actual evapotranspiration was estimated according to the following literature [28]. Together with these time and depth-dependent changes of measured matric potential values, the in-situ shrinkage of the capping system was finally quantified while considering the concept of a critical matric potential range.

2.5. Statistical Analysis

The mean values and standard deviations were calculated for each sampling depth. An analysis of variance (ANOVA) with p < 0.05 verified the effect of (a) fine pores (FP) on the volume shrinkage indices (VSI) and (b) dry bulk density ( ρ t) on void ratio (e). Differences of means were assessed by Tukey’s HSD test (p < 0.05), according to the following literature [29]. The coefficient of correlation (r2) is an index of goodness of fit between the observed and modelled data.

3. Results

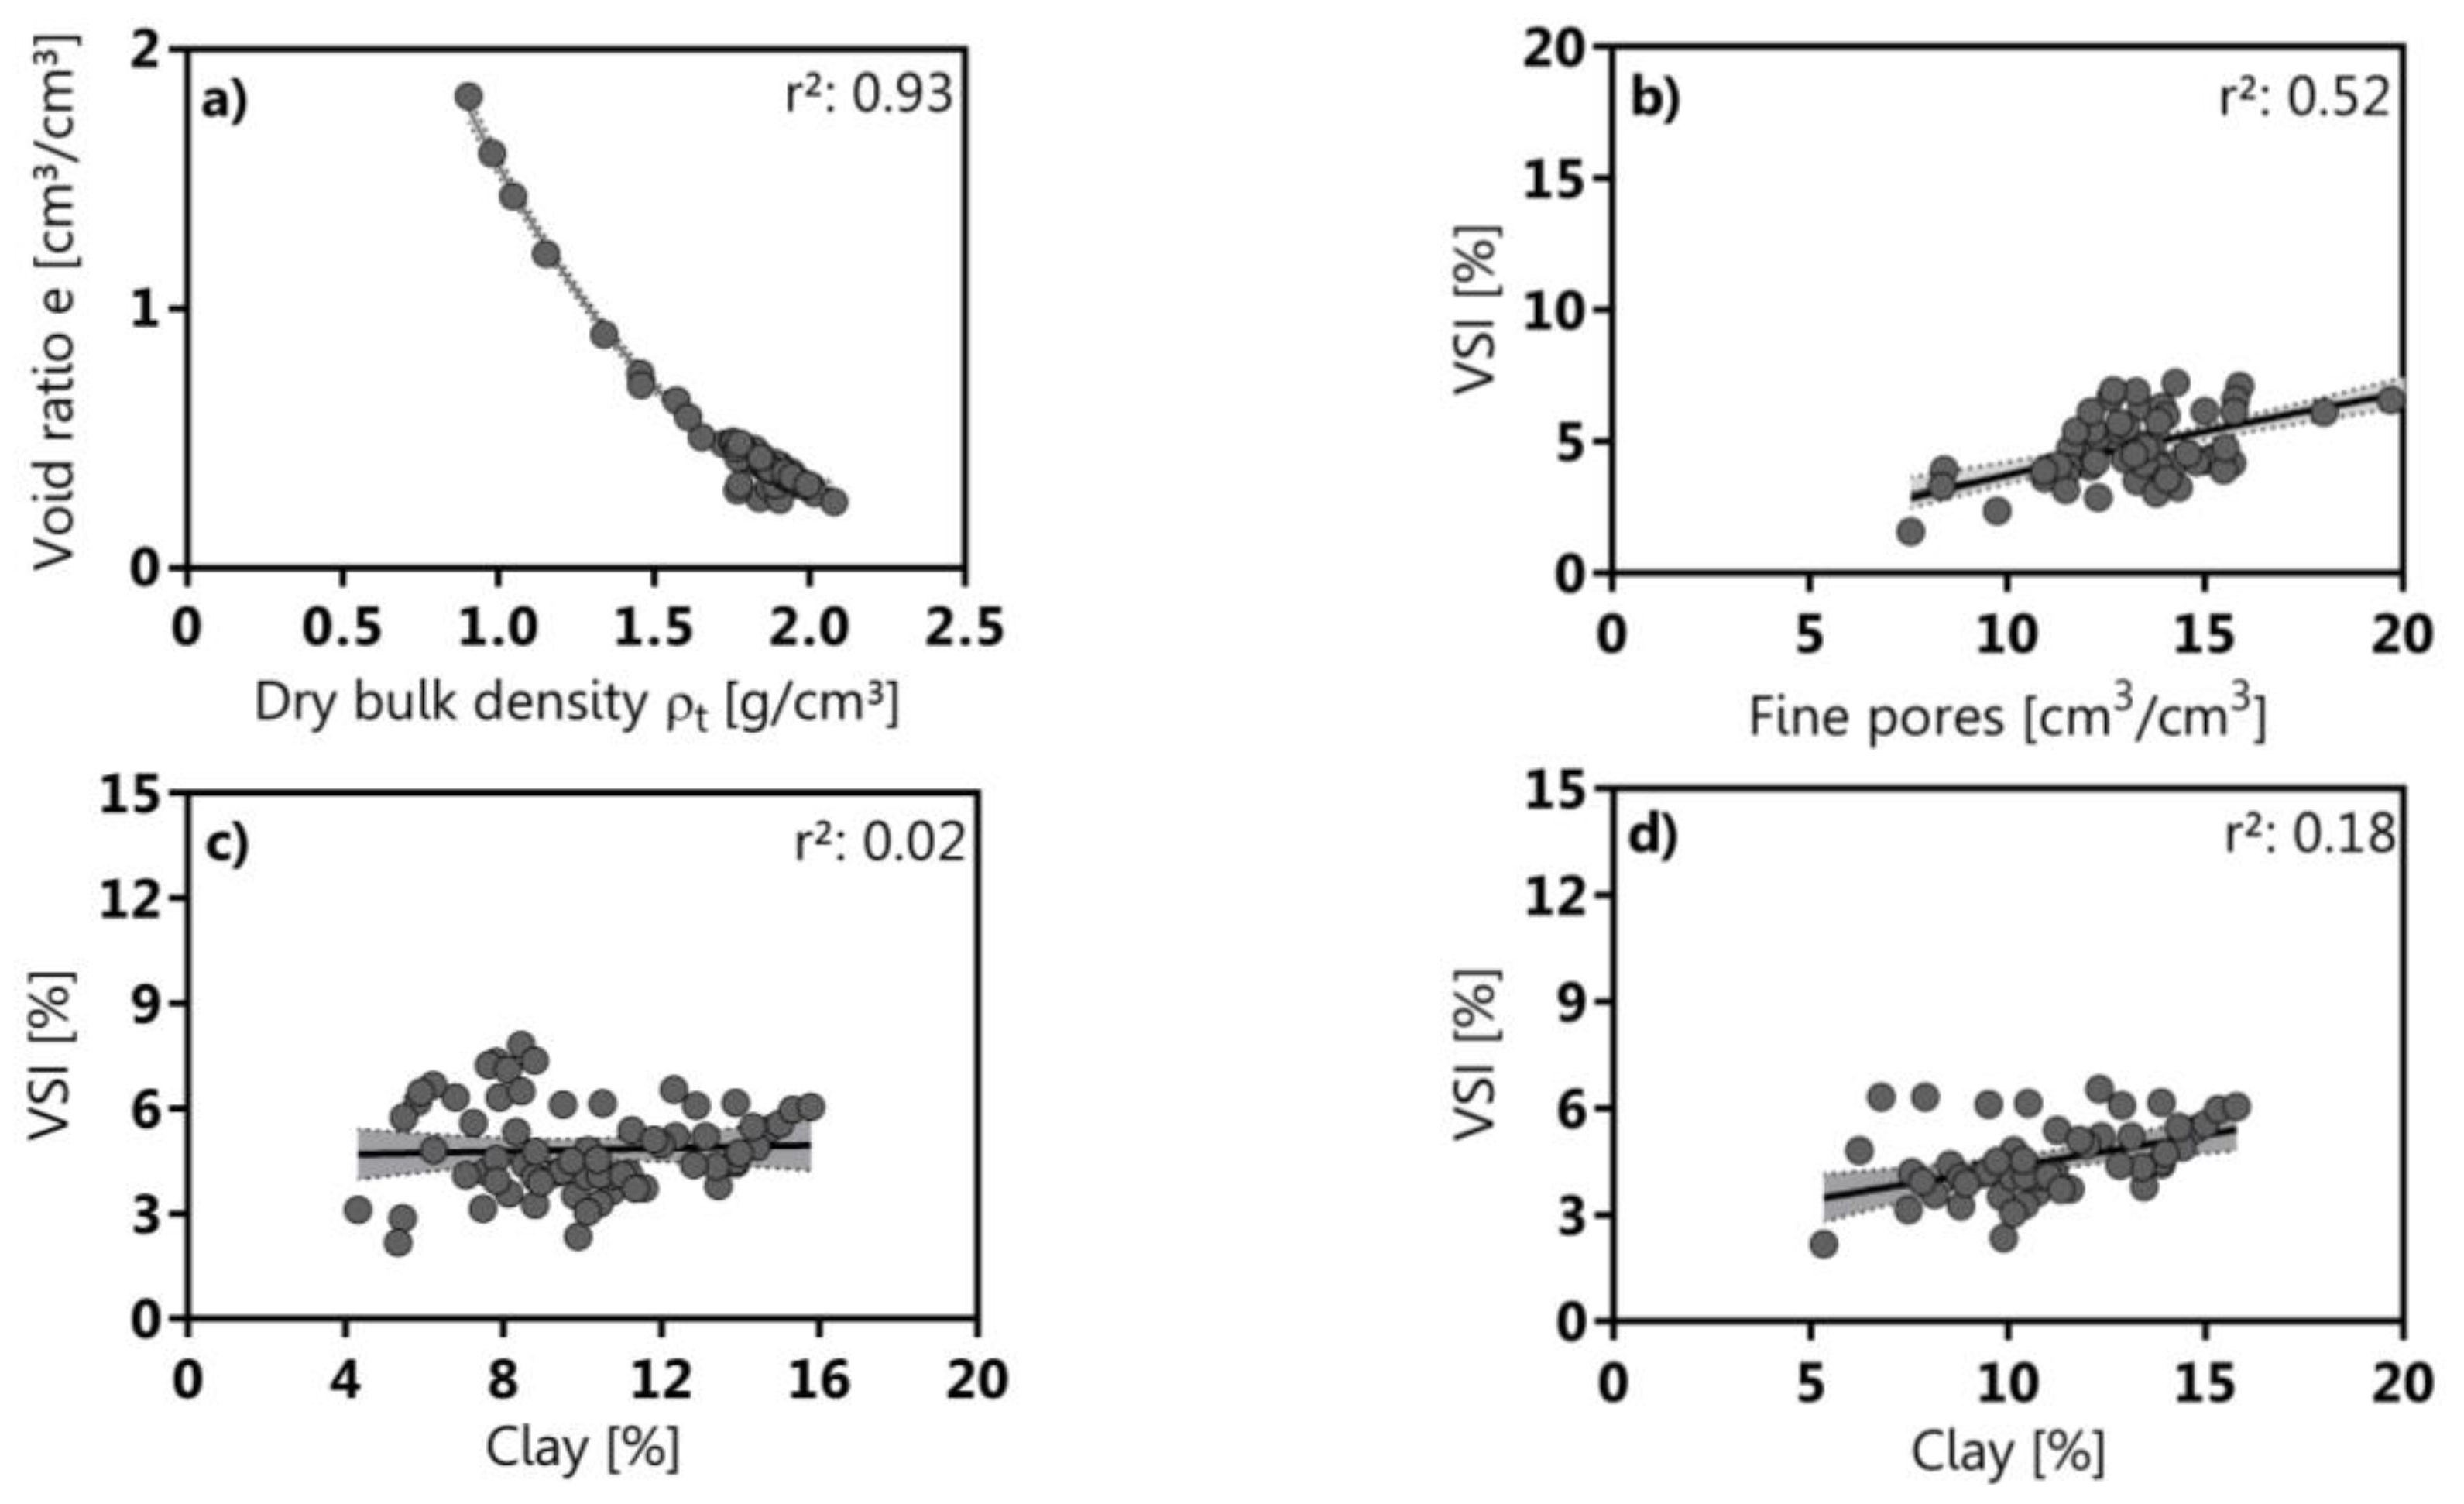
3.1. Basic Soil Characteristics

The boulder marl consists is characterized by a sandy loam (SL) with a clay content between 9 wt% and 14 wt%, a slightly alkaline character (pH 7.4–7.7) with an organic carbon content (OC) between 0.02% and 0.12%; the Ks values decreased from 7.3 × 10⁻⁶ m/s to 4.1 × 10⁻⁷ m/s with increasing soil depth (Table 1). Additionally, the bottom liner thickness must be 15.4 m to reach the same permeation rate like a 0.5 m thick layer with a Ks value of 5.0 × 10⁻⁹ m/s, while the Ks value was two-orders in magnitude higher.
The TP and AC values proceeded inversely proportional to the intermediate to high ρt values between 1.77 g/cm3 and 1.86 g/cm3, while the AWC values varied between 0.105 and 0.125 cm3/cm3. However, there are no clear differences in the AWC and PWP values (Table 2). Additionally, the AWC of the top liner (0–0.7 m) with 0.093 cm3/cm3 per meter is lower than the statutory requirement of 0.14 cm3/cm3 per meter.
The coefficients of activity varied between 0.15 ± 0.1 and 0.28 ± 0.1 that corresponds to an inactive material (Table 3). Additionally, the boulder marl mainly consists of quartz (85–95%) and calcite (2–5%) and the clay fraction is dominated by smectite (2–11%) and vermiculite (1–4%).

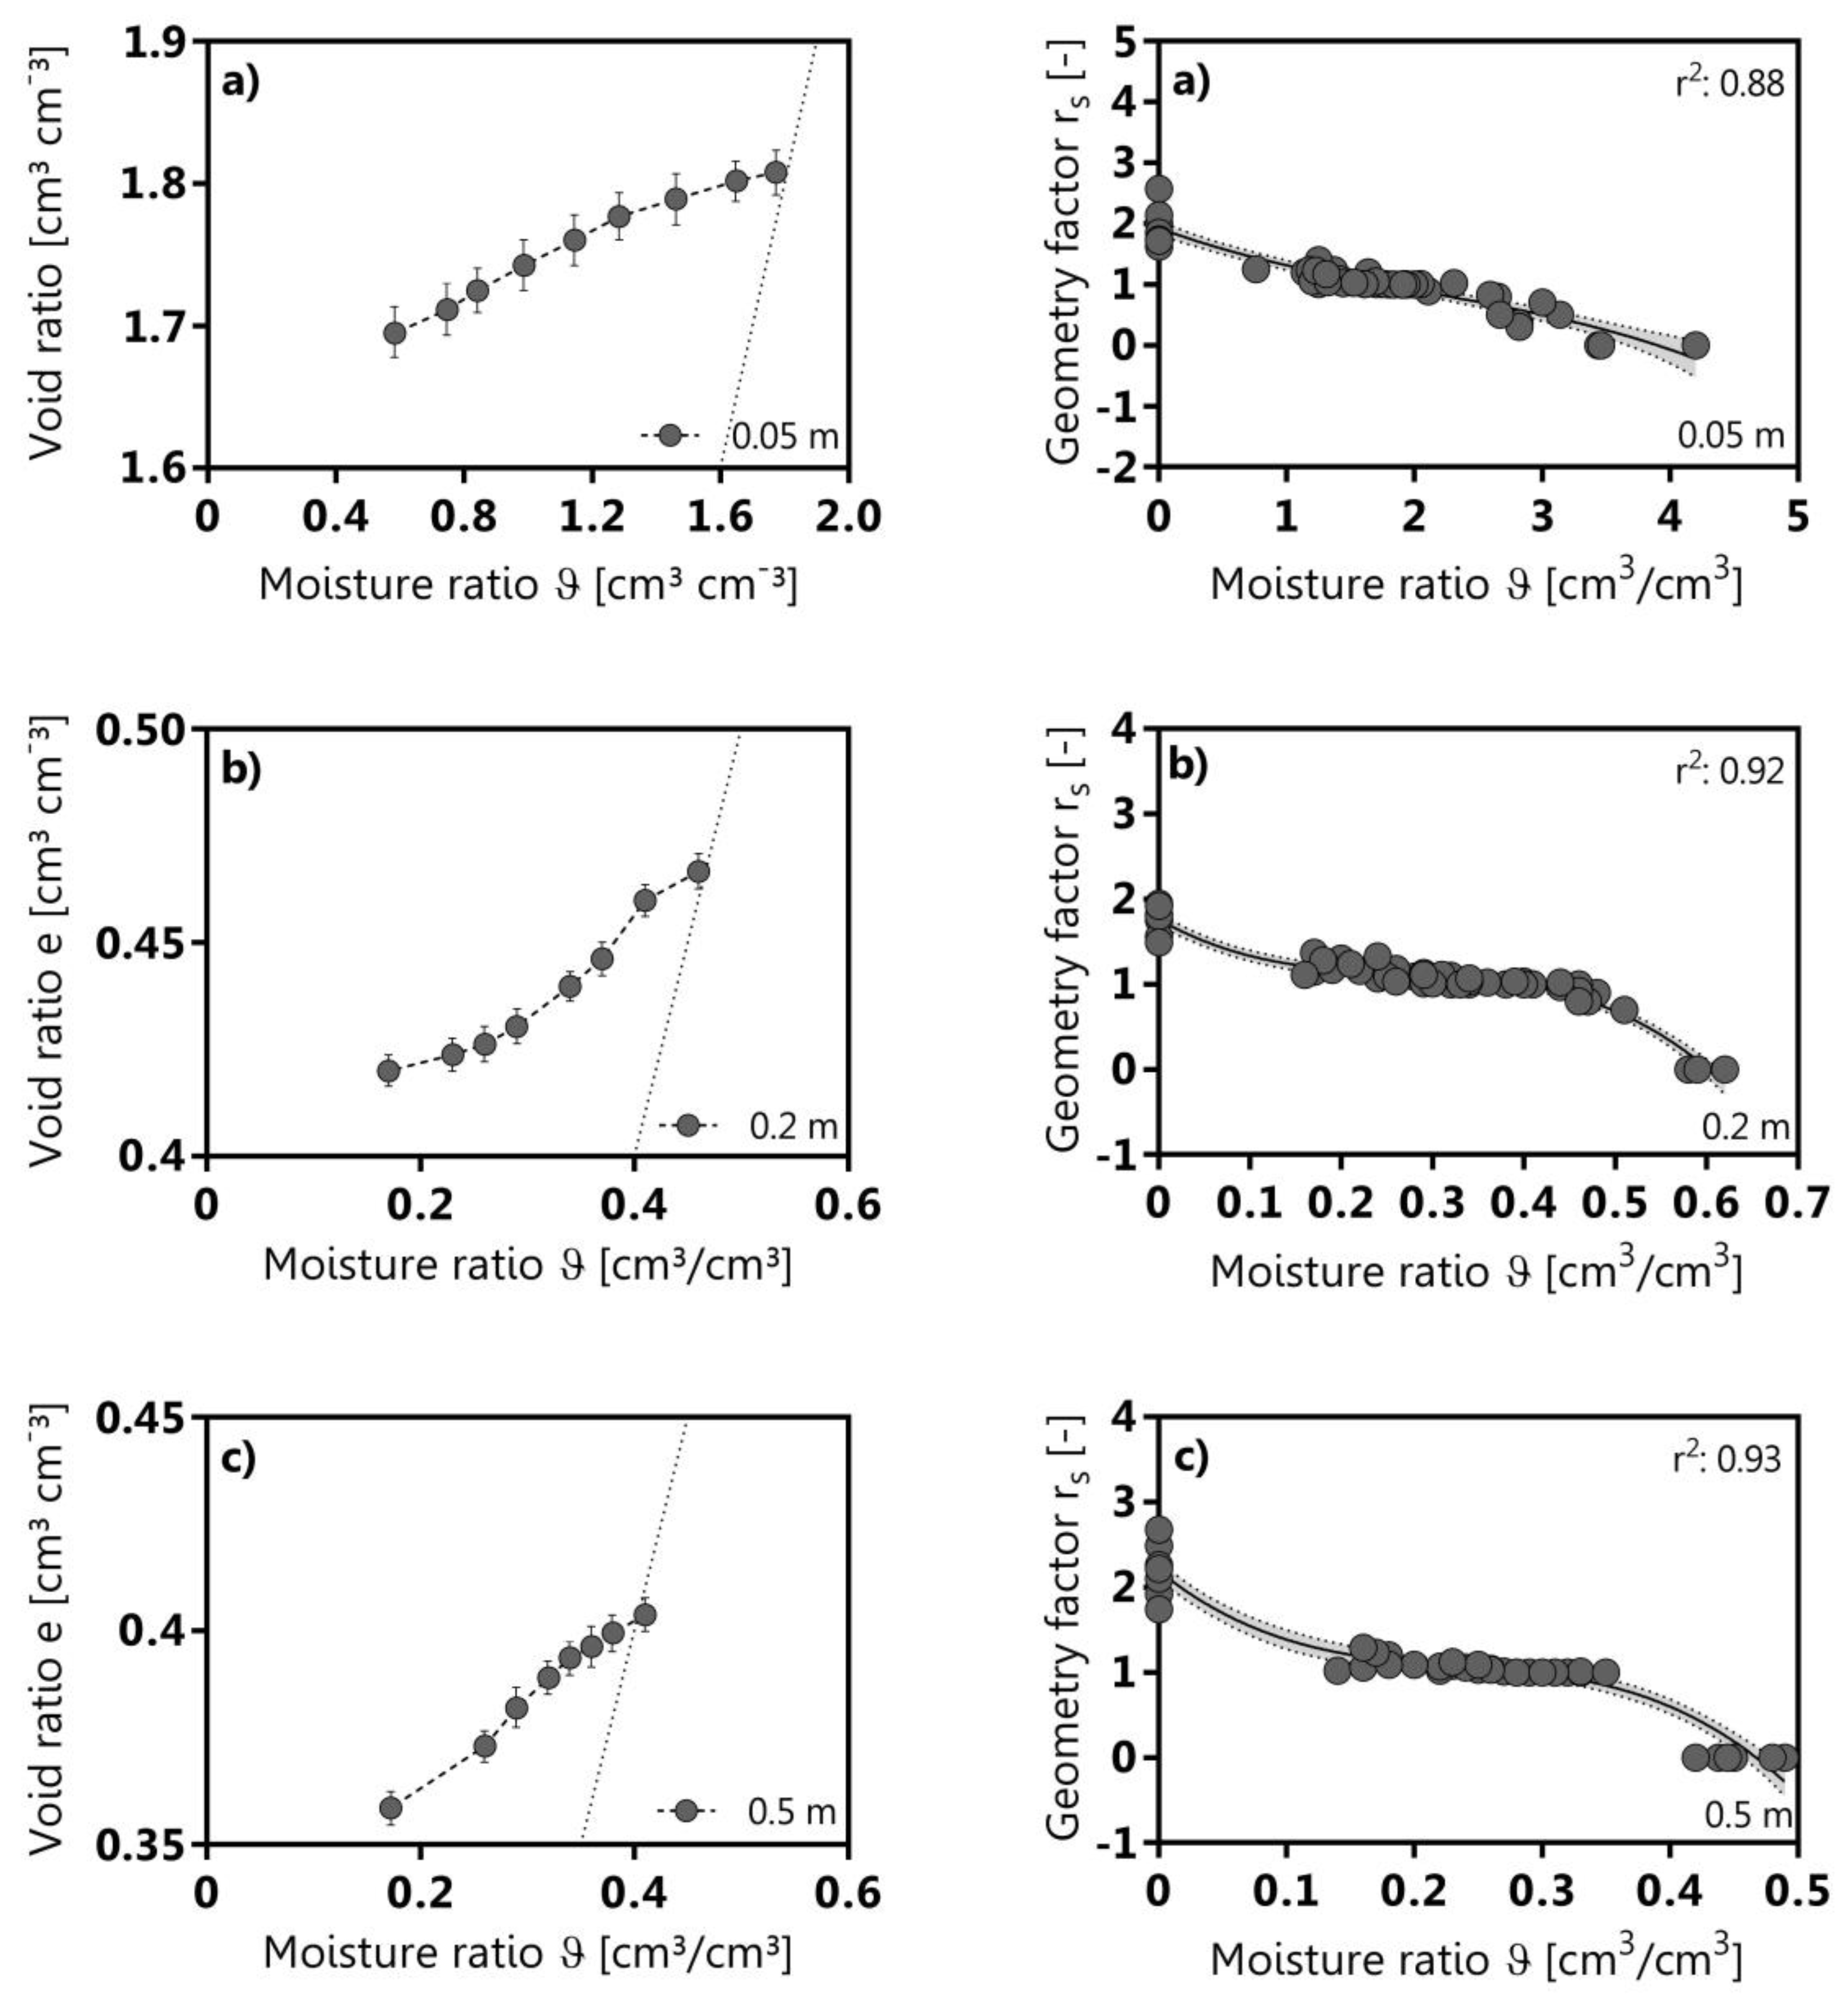
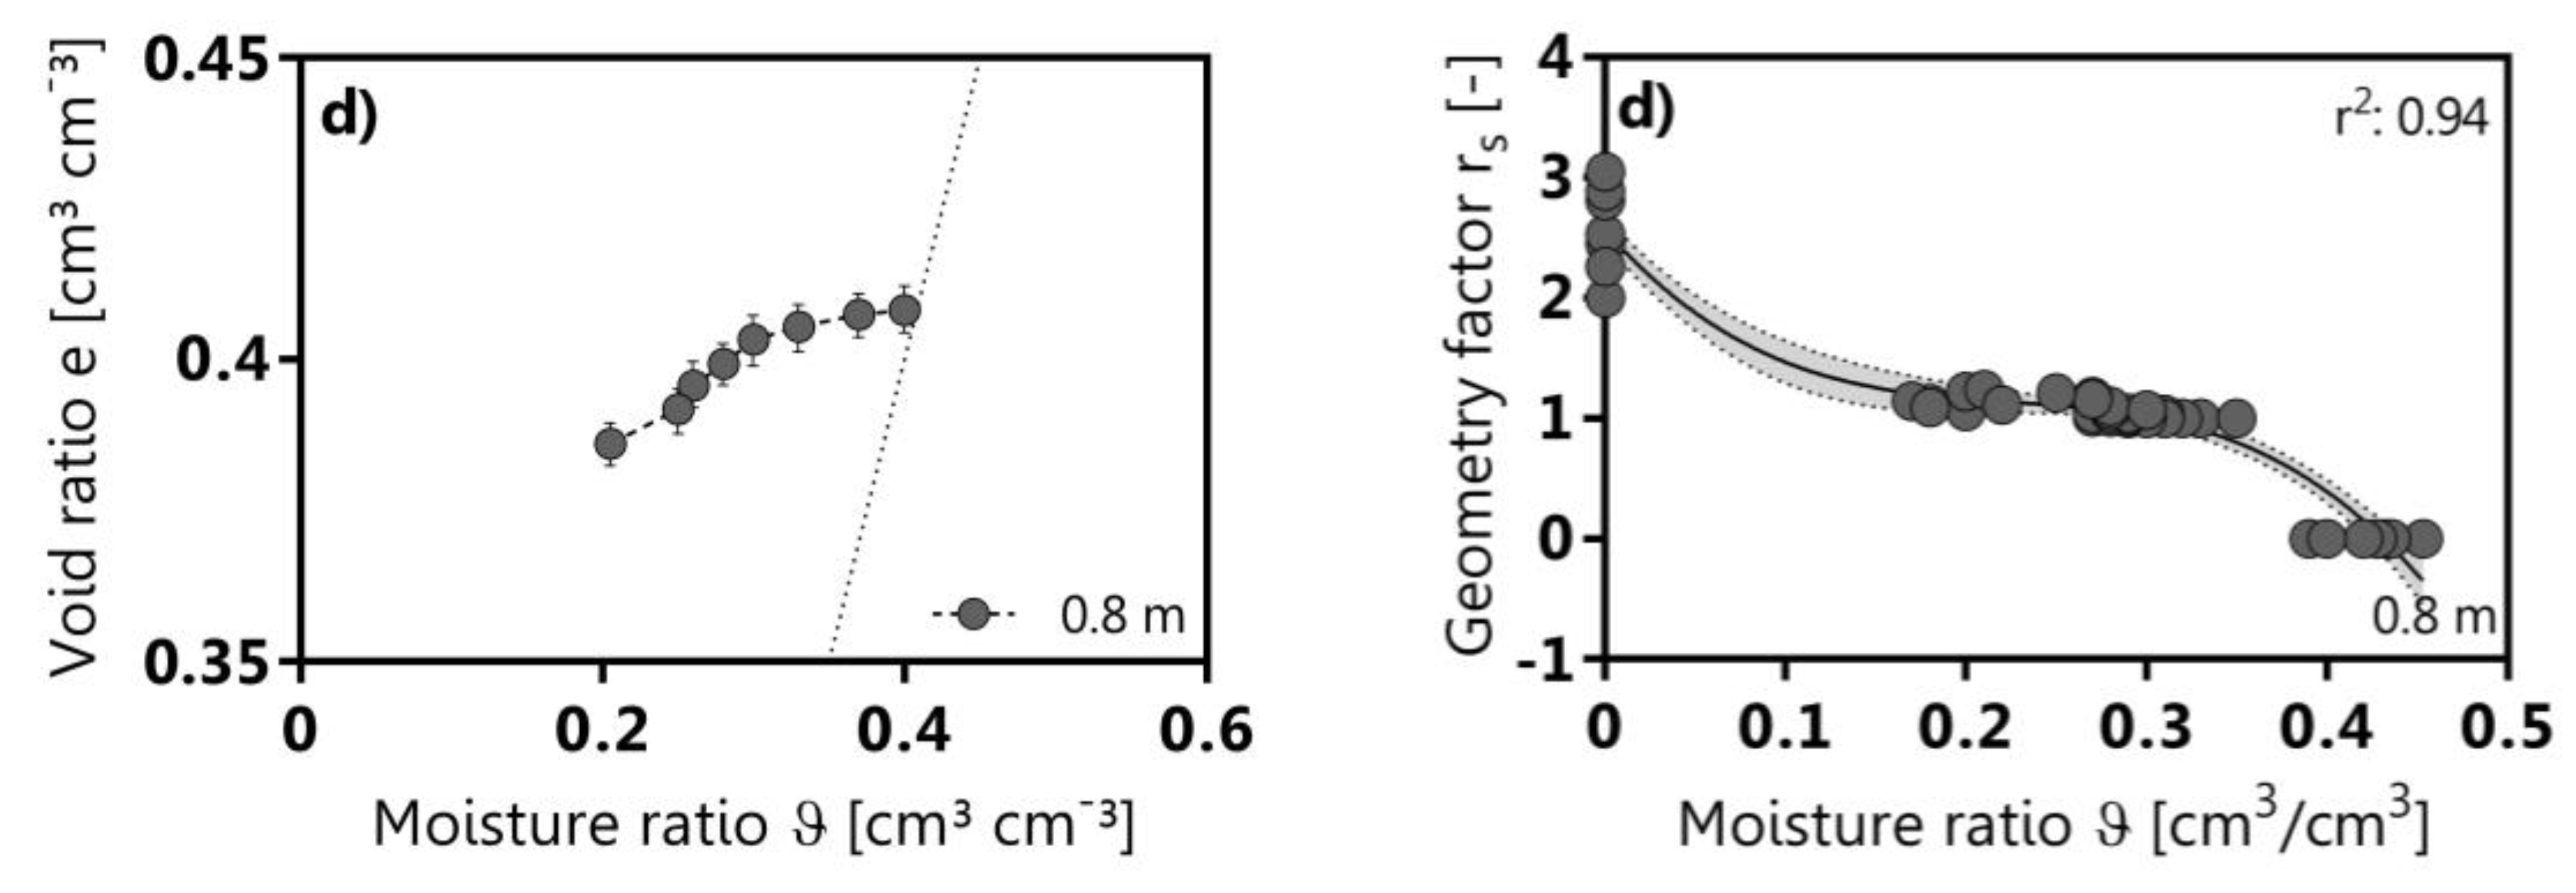
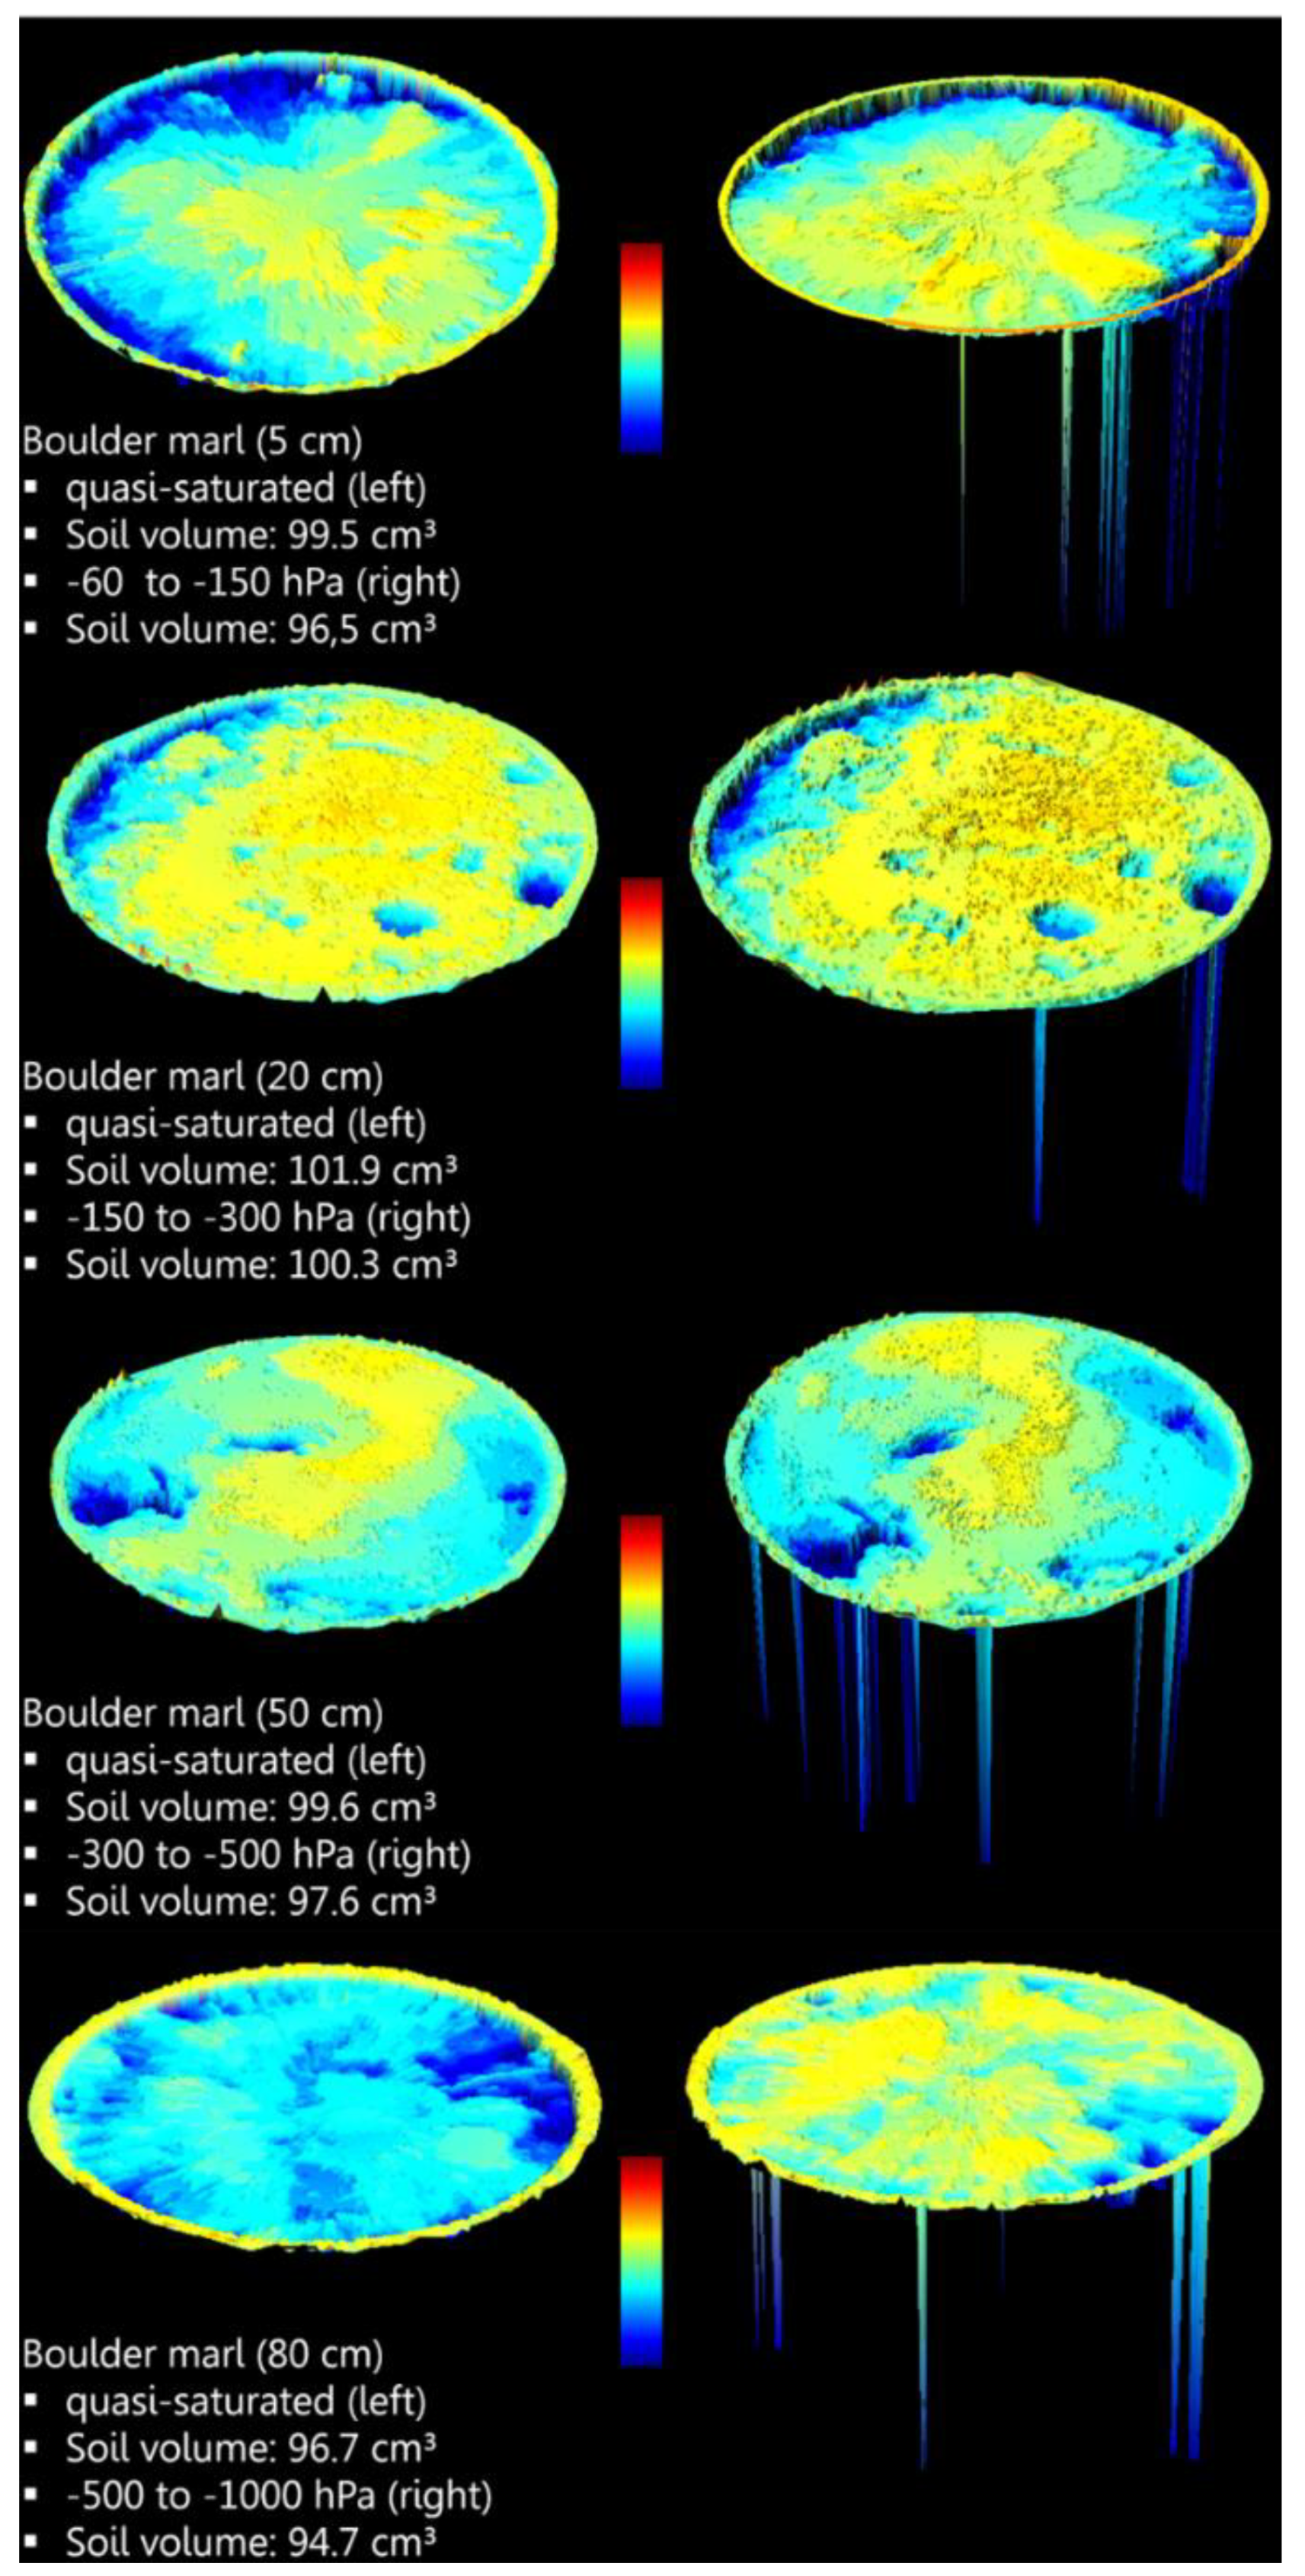
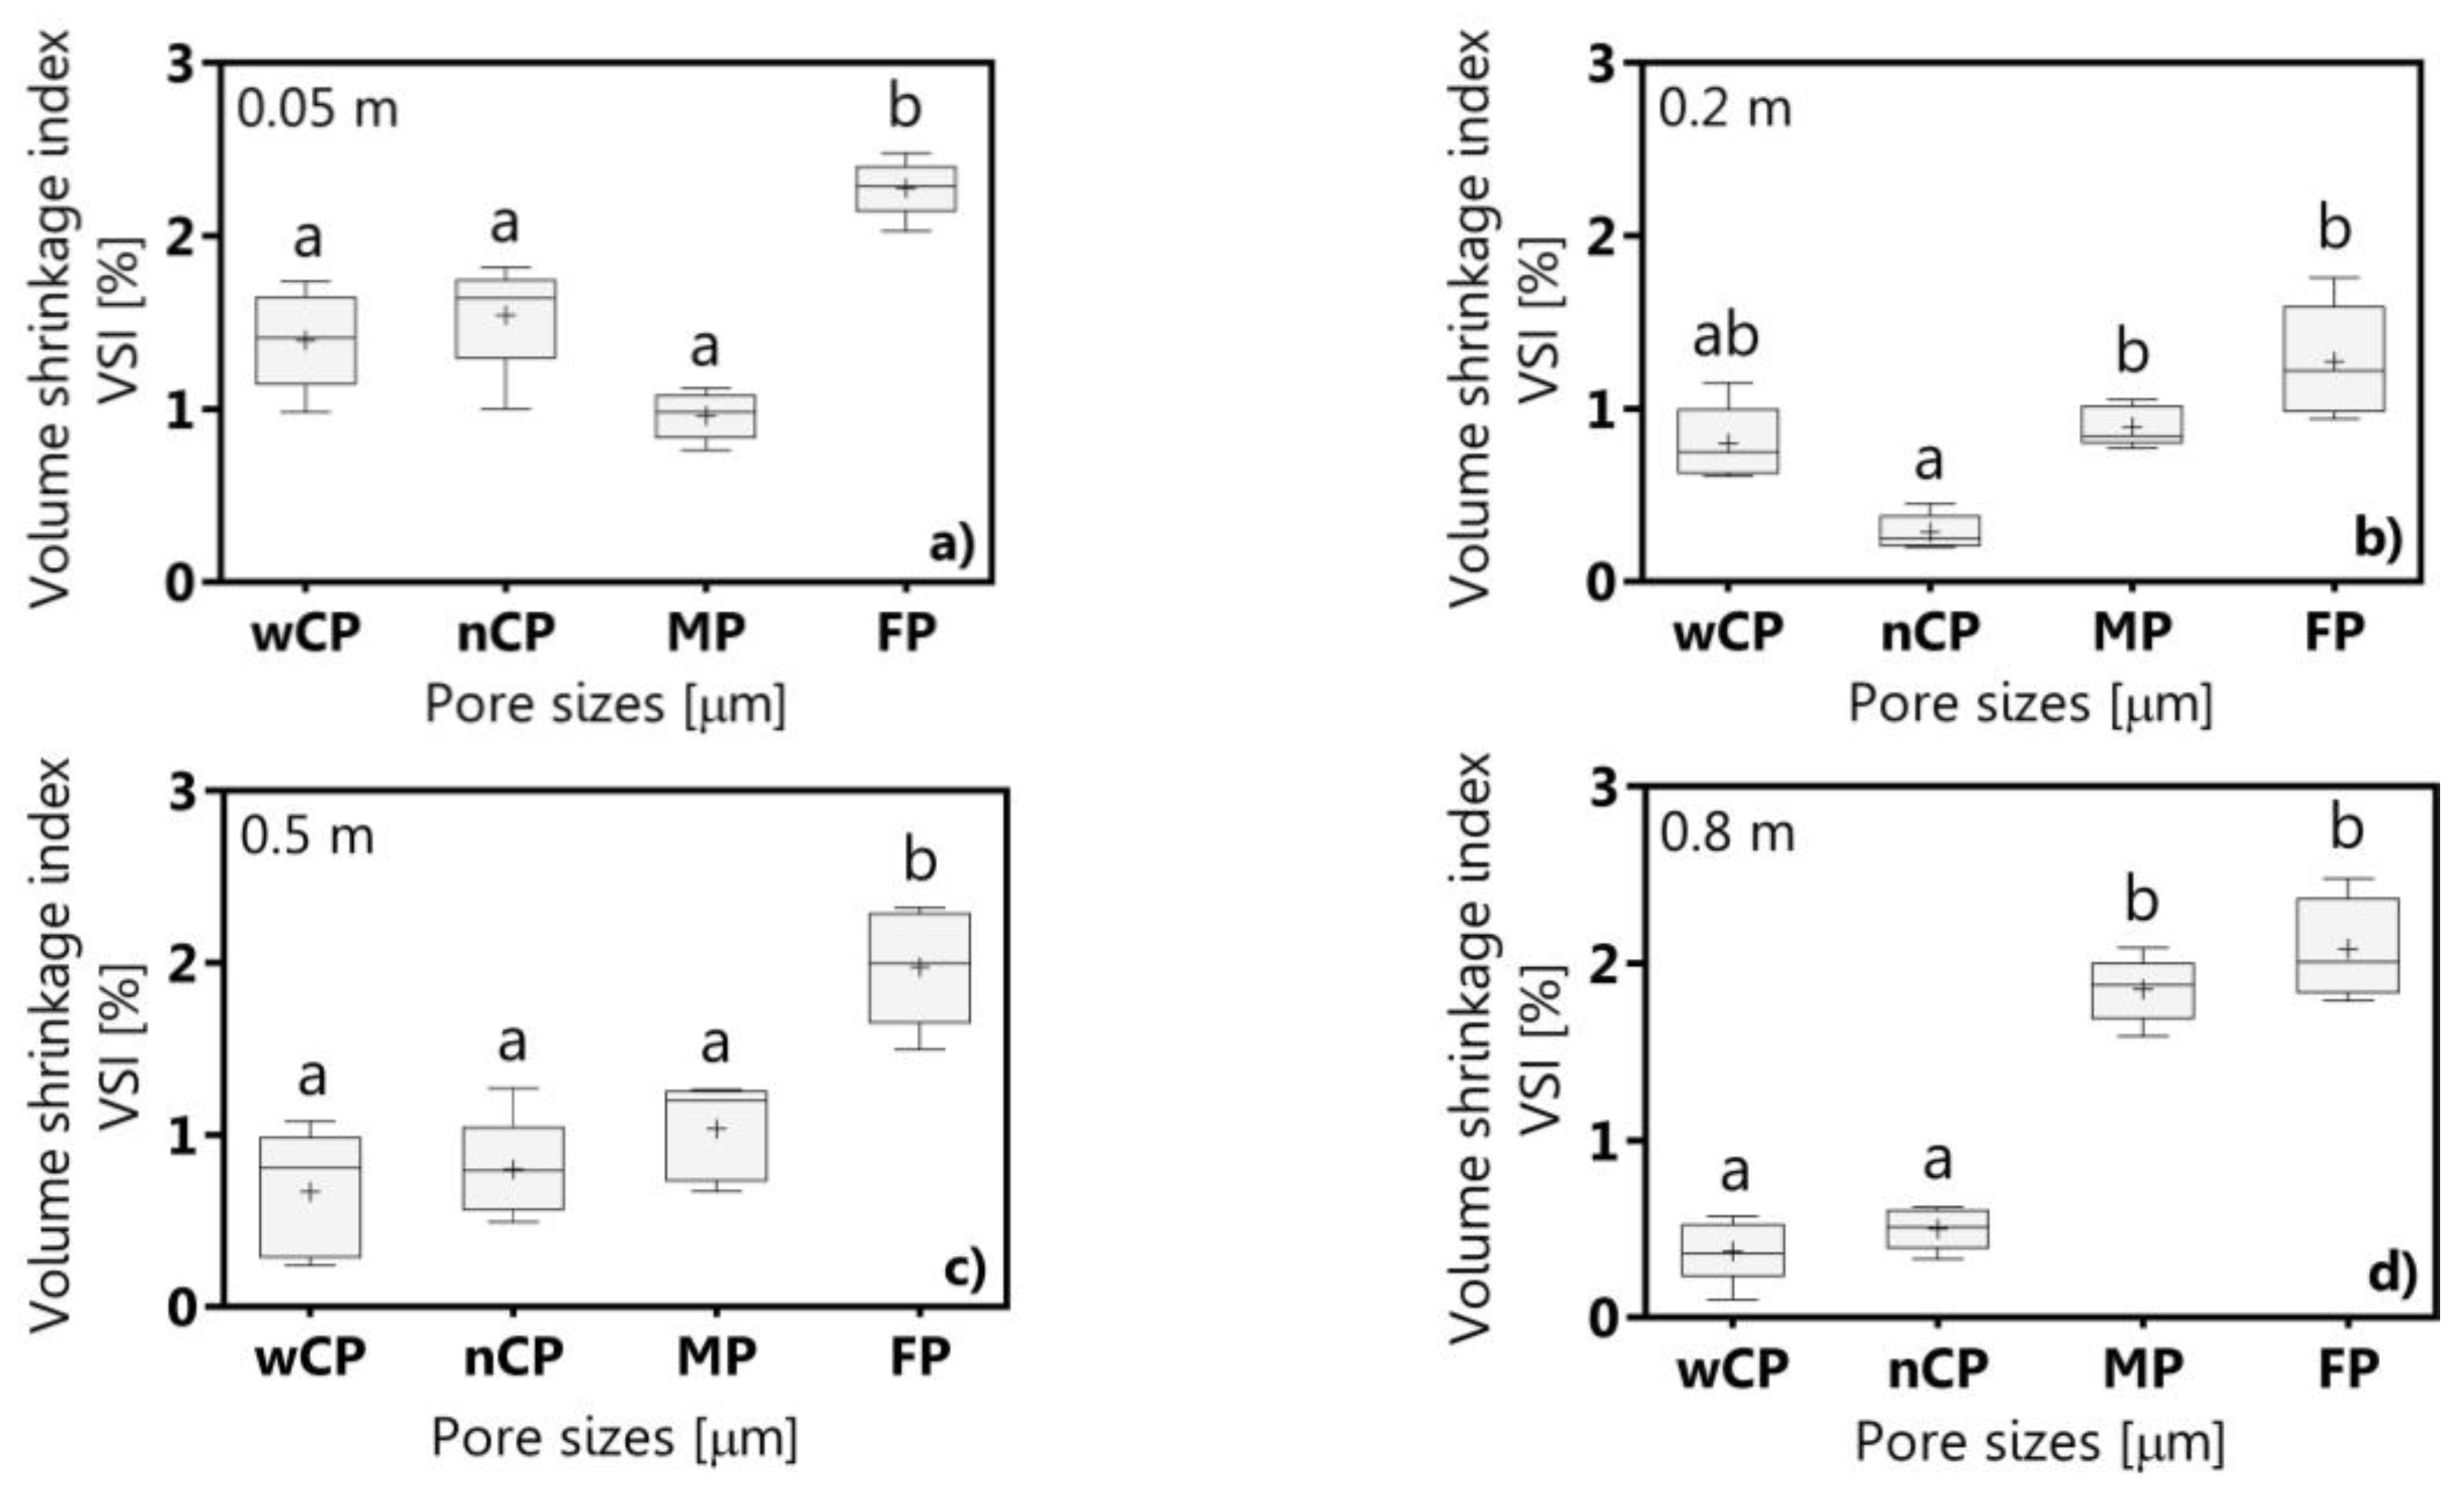
3.2. Shrinkage Behavior and Volume Shrinkage Index

The structural shrinkage was the major shrinkage phase in all three layers under continuous drying. The pattern of the shrinkage curves of the more compacted top and bottom liner showed similar deformation during the drying process, except the humic topsoil (0.05 m) (Figure 3).
The latter had greater moisture and void ratios and a more pronounced proportional shrinkage phase than the more compacted layer (es = ϑs < 0.42 cm3/cm3). The structural shrinkage phase was characterised by geometry factor values ≤ 1, which define the dominance of vertical shrinkage. When the pre-shrinkage stress was exceeded due to continuing dehydration, the geometry factor increased, but it remained smaller than 3.0 (Figure 3). Therefore, both vertical and horizontal shrinkage occurred, but the vertical shrinkage was still dominant throughout the whole drying range.
In particular, continuous circumferential cracks along the soil core edges were observed, while only a few secondary cracks in the soil cores of the humic topsoil developed.
The critical matric potential (ψmcrit) at the transition from the structural to the proportional shrinkage phase, as described by the wet side maximum curvature point (eshw, ϑshw), can be outlined as follows: −60 to −150 hPa (0.05 m), −150 to −300 hPa (0.2 m), −300 to −500 hPa (0.5 m), and −500 to −1000 hPa in the bottom liner (0.8 m), which define the predictable rigidity limits of the boulder marl in different depths (Figure 4).
The shrinkage model well described the shrinkage curves, including void ratio (e) and moisture ratio (ϑ) r2 values between 0.96 and 0.98. Therefore, the more pronounced volume and water loss in the structural shrinkage phase, the higher was the fitting parameter χ (Table 4). The volume loss during the structural shrinkage phase (es-eshw) and the proportional shrinkage phase (eshw-eshd) proceeded proportional to the liner-dependent ρt values, while the corresponding water loss (ϑsshw, ϑshwshd) during both phases was most pronounced in the bottom liner (0.8 m: 0.070 cm3/cm3) and top liner (0.2 m: 0.077 cm3/cm3), respectively (Table 4). Therefore, the exceedance of the pre-shrinkage stress (ψmcrit) resulted in a more pronounced volume change (eshw-eshd) and water loss (ϑshwshd) during the proportional shrinkage than in the structural shrinkage phase.
The irreversible volume decrease (∆e) due to the maximum-shrinkage between the quasi-saturated condition and the drying stage of −1000 hPa (lowest in-situ measurable matric potential) proceeded proportional to the ρt values (Table 4). Thus, the more compacted the soil material, the smaller the volume increase during wetting. As a result, the boulder marl did not regain its initial volume.
The volume shrinkage indices, added up from the wide and narrow coarse pores, as well as medium and fine pores, indicated a low to medium shrinkage tendency between 4.9% in the bottom liner (0.8 m) and 7.2% in the top liner (0.05 m) (Figure 5). Thus, the more compacted the soil the less pronounced was the shrinkage-induced volume change in the full dehydration range. However, the VSI index varied significantly (p < 0.05) among the pore sizes and it was most pronounced with the fine pores with values between 1.27% and 2.28%.
The volume shrinkage index correlated positively with the fine pore content (r2: 0.52), and the void ratios decreased with increasing ρt (r2: 0.93). The r2 values between VSI and the clay content with (a) and without (b) the more humus topsoil (0.05 m) varies between 0.02 and 0.18 (Figure 6).

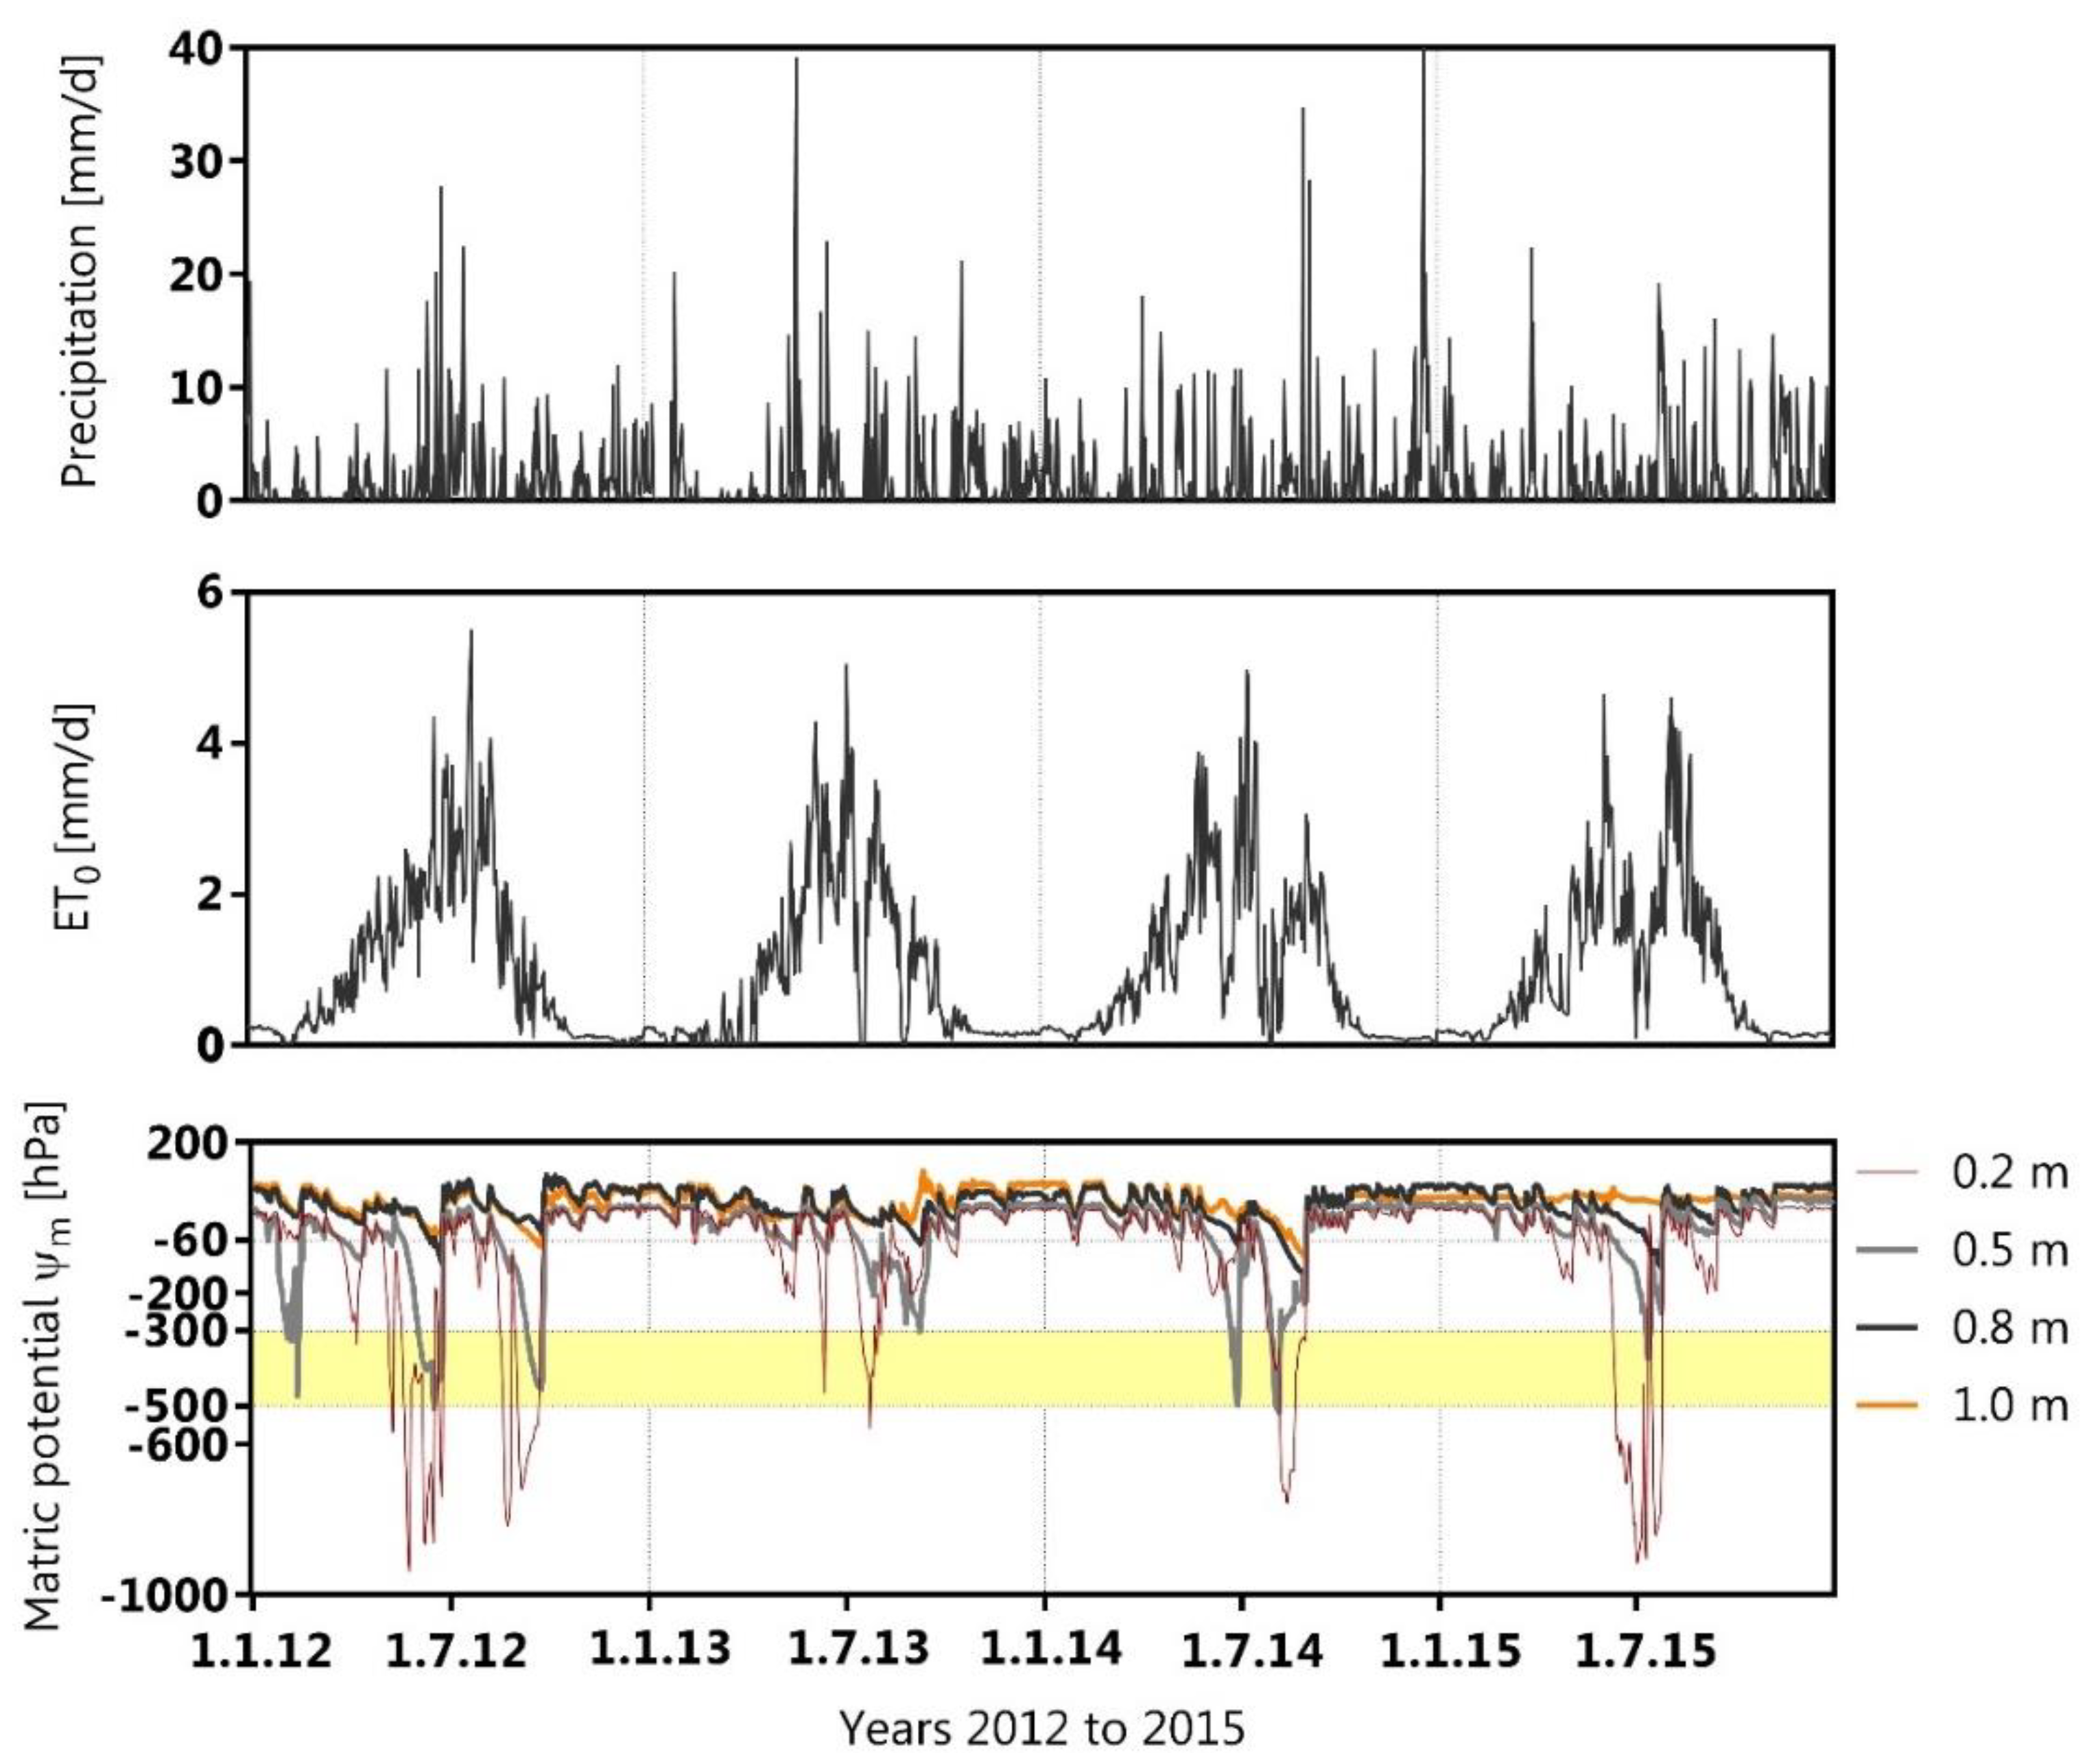
3.3. In-Situ Matric Potential Measurements

The year 2014 was exceptionally warm with an average annual temperature of 10.4 °C, 1 °C above the long-term average temperature of 9.4 °C. The years 2012 and 2013 with annual precipitation rates of 655 and 669 mm were comparatively drier than 2014 and 2015 with 753 and 767 mm, respectively. The average precipitation rates varied between 1.8 mm/d and 2.2 mm/d, the maximum precipitation rates between 22.2 mm/d and 29 mm/d, and as an exception to these values, in May 2013 and December 2014, the values increased up to 40 mm/d. The ET0 values increased from < 0.2 mm/d during the winter months up to 5.5 mm/day during the vegetation period due to the vegetation growth (Figure 7).
The seasonal dynamics of precipitation and evapotranspiration caused variations in soil water storage, including swelling and shrinkage periods. The minimal matric potentials reached values down to −557 hPa in 2013 and −937 hPa in 2015 in the upper 0.2 m of the top liner, while values between −300 and −514 hPa were observed in 0.5 m depth as result of temporary capillary rise (Figure 7). Thus, the upper part of the top liner (0–0.4 m) showed further shrinkage crack formation of the platy structure creating a new prismatic structure. Consequently, the vertical infiltration rates are expected to increase due to the newly formed macro porosity.
However, even after four years of wetting and drying the matric potential values in the bottom liner remained nearly constant and reached a minimum of −70 to −150 hPa in 0.8 m depth and −20 to −100 hPa in 1.0 m depth during short periods in the drier spring and summer months (May−August).
The measured in in-situ matric potentials in the bottom liner (0.7–1.0 m) did not exceed the previously highest observed drying range between −300 and −500 hPa under conservative treatment.
Thus, only a small range of the volume shrinkage potential was actively reached, and thus, the hydraulic stability is still given

4. Discussion

4.1. Statutory Requirements of the German Landfill Directive

The statutory requirements of the German Landfill Directive, enacted in 2009, includes the following engineering standards for closed landfill capping system: AC and AWC values of the top liner of at minimum 0.08 cm3/cm3 and 0.14 cm3/cm3 per meter, respectively, and the Ks values of values of at least 5.0 × 10⁻⁹ m/s equal to 0.5 m thickness and a hydraulic gradient of i = 0.3.
The required threshold value for the air capacity could not be reached, even in the upper part (0.05 m) of the less compacted top liner, thus, an optimal plant growth cannot be guaranteed resulting in a limited transpiration potential, as mentioned in the following literature [28]. This is however uncertain, because the rigidity of such construction is limited and is expected to collapse as soon as seasonal drying becomes more pronounced. Additionally, the AWC of the top liner with 0.093 cm3/cm3 per meter is lower than the statutory required and it may be related to the smaller number of narrow coarse pores and medium pores, as mentioned in the following literature [11,31].
Alternatively, an increasing AWC could be realized with a soil-compost mixture (i.e., green waste compost) or by additional mechanical compaction [32,33]. Thus, an increased water storage capacity could enable higher transpiration rates and therefore a reduced amount of infiltrating water, as described previously [28,34]. However, the boulder marl is an appropriate material for top and bottom liner when considering the low to medium shrinkage-crack formation potential.
In legal terms [2], the Ks values suggest that the boulder marl is not suitable as bottom liner under natural conditions as hypothesized before. Thus, the natural permeability must be reduced and the natural ρt values increased through additional compaction [35,36,37] resulting in a reduced number of wide coarse pores, especially in the bottom liner. The addition of three-layer clayey minerals (i.e., illite) could decrease the Ks values [37,38] and also increase the ‘self-healing’ potential. However, it is important to note that the high-water absorption strength and capacity of these clayey materials can increase the moisture content for crack initiation, also resulting in a higher coefficient of activity [23].
In summary, there are several conflicts of interests exist (i.e., shrinkage intensity versus water storage capacity) and the boulder marl is usable for a semipermeable capping system, but not as statutory approved bottom liner for final capping systems with an exclusive purchase on the soil physical properties. It should also be taken in mind that the temporary capping system in Rastorf was provided with semipermeable mineral liner to slowly shut down the so-called ‘bioreactor’. Therefore, the boulder marl with its permeability characteristics was the material of choice as mentioned follows [35].

4.2. Shrinkage Behavior of the Boulder Marl

The shrinkage characteristics determine the possible applications of mineral substrates in multi-liner landfill capping system and under certain weather conditions, even if not legally fixed. So, this study is focused on the soil shrinkage behavior, intensity, and geometry.
The shrinkage behavior of natural soil strongly depends on its texture, structure, and compaction, while mechanic and hydraulic stress resulting in changes in pore diameter and continuity are less attended as mentioned in past papers [39,40].
Therefore, the shrinkage behavior and tendency were affected through the rearrangement of soil particles and pores by both types of stress, as mentioned before [41,42]. Thus, the shrinkage-crack formation impacts the pore size distribution and the pore volume, the structural pores rather than the textural pores [43,44], while the shrinkage intensity strongly depends on the amount and type of swelling clay and the OC content.
In this point, the low to medium volume shrinkage tendency (4.9–7.1%) of the differently compacted boulder marl could also be attributed to the limited presence of smectite and vermiculite (three-layer minerals), while the percentage of non-swelling and shrinking calcite does not alter the volume change patterns [45].
The comparatively higher amount of MP and FP in the top liner, especially in 0.05 m depth, is strongly influencing the volume change during the shrinkage phases [19] and the lower χ (top liner < bottom liner) the more pronounced is the proportional shrinkage, as mentioned follows [15].
Moreover, the shrinkage curves of the compacted boulder marl in the top and bottom liner were, therefore, nearly parallel to each other with slightly varying volume shrinkage indices, which are typical for compacted soils [41]. Thus, the intermediate to firm ρt values are the major reason for initial and already small void ratios (0.3–0.4 cm3/cm3), except for 0.05 m depth [19], because the more compacted the layer and the higher the pre-shrinkage stress are the higher is the resilience capacity towards dehydration [31,41]. Otherwise, the effect of organic (≤1.2 wt%) or clay (<14 wt%) on the shrinkage behavior is subordinate [31], accentuated by a very low relationship between the clay content and the volume shrinkage index (r2 ≤ 0.18). On the other hand, the mineral composition and therefore the limited amount of three-layer clay minerals (i.e., smectite) describes the restricted shrinkage and the swelling characteristics of the boulder marl better than the clay content or the number of fine pores [7].
In contrast, natural soils, like Silandic Andosols with 12% organic carbon, and Histic Gleysols with 26.5% organic carbon and lower ρt values presented void ratios of nearly 2 to 4 cm3/cm3 resulting in a more pronounced proportional shrinkage phase [46,47].
Weather-dependent drying cycles can lead to dehydration events exceeding the previously highest one or the matric potential can be more negative than the critical matric potential (pre-shrinkage-stress) due to the higher hydraulic stress of the menisci forces in the micropores [11,12].
In those cases, not only a vertical volume movement but also a higher horizontal shrinkage crack formation and increasing geometry factors (rs > 1) can be expected [26], which was also proofed by our results. Therefore, vertical shrinkage causes subsidence of the soil surface, and the involved horizontal shrinkage results in soil shrinkage cracks [44]. Thus, the geometry factor strongly depends on the mechanical and hydraulic history [31], the water content during dehydration [48], and the number of wetting/drying cycles [19].
Furthermore, the changes in the void ratios (∆e) due to swelling after re-wetting (−1000 hPa to quasi-saturated condition) could also show that only a certain part of shrinkage is reversible. These findings also confirm the theory of non-rigid pore systems, even for soils with a high pre-shrinkage stress [40].

4.3. Seasonal In-Situ Soil Water Dynamics

The in-situ measurements of the soil water dynamics link the actual in-situ shrinkage of the boulder marl with the given in-situ matric potential when considering the concept of critical matric potentials. Considering the tensiometer data, in-situ matric potentials more negative than ψmcrit or rather exceeding the pre-shrinkage stress, as mentioned before, can cause further shrinkage-crack formation and generation [39].
These potential preferential flow paths can increase the amount of infiltrating water (i.e., contaminated with heavy metals) resulting in higher leachate rates by a factor of 3 to 4 [28,49], especially during intensive precipitation events. Therefore, the presence of shrinkage cracks is a key factor for the long-term hydraulic stability of mineral liners [38,50], when considering, for example, the cracked mineral liner of the ′Georgswerder landfill’ (Hamburg, Germany) in humid climates [48].
As promising technical solution, the repeated desiccation of the material and/or in combination with previous compaction can increase the impermeability of mineral liner in a long term [45].
The structure deformation cannot be avoided within the top liner, considering annually occurring negative matric potential values of up to −850 hPa [28]. This statement, however, does not contradict the requirements for an impermeable bottom liner, because, in combination with a high evapotranspiration rate and a greater water storage capacity, there is a reduction in the amount of infiltrating water, as described in following literature [34]. This is especially true, if the upper part of top liner is well rooted by small plants or grass, so that we can concentrate shrinkage and swelling in this rooted soil volume, which protects the deeper bottom liner from drying and root penetration.
In the study period and beyond, the in-situ matric potentials of the bottom liner reached at minimum values between −100 and −150 hPa, even during drier periods, thus, the hydraulic stability of the Rastorf landfill was preserved, accentuated by constant annual leachate rates between 10% and 14% [28]. In this regard, the boulder marl in the bottom liner reached only a small range of its shrinkage potential. The total volume change was <2%, despite the potential volume change of up to 4.9%. These results emphasize the hydraulic stability of the temporary capping system. The reason why sandy loam textured soils do not crack distinctly can be considered to a low tensile strength, including a less pronounced shrinkage strain energy [9].

5. Conclusions

The results allow to conclude that the shrinkage characteristics of the boulder marl including shrinkage behavior, geometry and tendency are mainly affected by the installation conditions and therefore by the mechanical and hydraulic stresses. The less compacted top liner enabled the concentration of the shrinkage and swelling cycles in the rooted soil volume, while the bottom layer was slightly affected during the annual wetting and drying periods.
Therefore, the shrinkage-crack formation resistance of the bottom liner was ensured until the end of the study in 2015, because the pre-shrinkage stress (−500 to −1000 hPa) was more negative than the previous reached matric potentials in the field (−100 to −150 hPa), also provided through a suitable material selection. On the other hand, the Ks values, even in the most compacted bottom liner, were up to two orders of magnitude higher than the statutory required values. Furthermore, the bottom liner was sufficiently moistened, even in drier periods, and it enabled a constant supply of the ‘bioreactor’ with infiltrating water, while avoiding shrinkage crack formation and therefore preferential flow paths through its soil hydraulic characteristics under the given climatic conditions.
The concept of critical matric potentials complimented by in-situ field measurements is valuable to investigate the hydraulic stability of mineral liner substrates under realistic conditions.
In summary, the soil chemical and physical properties of mineral liner materials, including the shrinkage and swelling capabilities should be studied before installation in final capping systems. However, the aftercare (i.e., field measurements) of mineral capping systems is also necessary to assess the effect of settlements (post-compaction), root growth and aging (bioturbation, carbonate leaching), and on the material properties ensuring the hydraulic stability in the long term.

Author Contributions

S.B.-B., H.H.G., and R.H. conceived the presented idea. S.B.-B. contributed the methodology, software, validation, and the formal analysis of the presented data. R.H. and H.H.G. supervised the findings of this study including conceptualization, editing, reviewing, and supervision.

Funding

This research was founded by the Innovation Foundation of the federal state of Schleswig-Holstein and the ZMD Rastorf GmbH, Germany.

Acknowledgments

I thank the Innovation Foundation of Schleswig-Holstein for the financial support of the current study.

Conflicts of Interest

The funders had no role in the design of the study; in the collection, analyses, or interpretation of data; in the writing of the manuscript, or in the decision to publish the results.

References

  1. Hoornweg, D.; Bhada-Tata, P. What a Waste: A Global Review of Solid Waste Management; Urban Development Series, Knowledge Papers (15); The World Bank: Washington, DC, USA, 2012. [Google Scholar]
  2. Horn, R.; Stępniewski, W. Modification of mineral liner to improve its long-term stability. Int. Agrophys. 2004, 18, 317–323. [Google Scholar]
  3. Hauser, V.L. Evapotranspiration Covers for Landfills and Waste Sites; CRC Press, Taylor & Francis: Boca Raton, FL, USA, 2008. [Google Scholar]
  4. The German Federal Government. Degree on Landfills (Ordinance to Simplify the Landfill Law)—Germany, in the Form of the Resolution of the Federal Cabinet; The German Federal Government: Berlin, Germany, 2009. [Google Scholar]
  5. Arnold, S.; Schneider, A.; Doley, D.; Baumgartl, T. The limited impact of vegetation on the water balance of mine waste cover systems in semiarid Australia. Ecohydrology 2014, 8, 355–367. [Google Scholar] [CrossRef]
  6. Widomski, M.K.; Stępniewski, W.; Horn, R.; Bieganowski, A.; Gazda, L.; Franus, M.; Pawlowska, M. Shrink-swell potential, hydraulic conductivity and geotechnical properties of clay materials for landfill liner construction. Int. Agrophys. 2015, 29, 365–375. [Google Scholar] [CrossRef] [Green Version]
  7. Widomski, M.K.; Stępniewski, W.; Musz-Pomorska, A. Clays of different plasticity as materials for landfill liner in rural systems of sustainable waste management. Sustainability 2018, 10, 2489. [Google Scholar] [CrossRef]
  8. Beck-Broichsitter, S.; Gerke, H.H.; Horn, R. Suitability of Boulder Marl and Marsh Clay as Sealing Substrates for Landfill Capping Systems—A Practical Comparison. Geosciences 2018, 8, 356. [Google Scholar] [CrossRef]
  9. Costa, S.; Kodikara, J.; Shannon, B. Salient factors controlling desiccation cracking of clay in laboratory experiments. Géotechnique 2013, 63, 18–29. [Google Scholar] [CrossRef]
  10. Hartge, K.H.; Horn, R. Essential Soil Physics—An Introduction to Soil Processes, Structure, and Mechanics; Horton, R., Horn, R., Bachmann, J., Peth, S., Eds.; Schweizerbart Science Publishers: Stuttgart, Germany, 2016. [Google Scholar]
  11. Hartge, K.H. Ein Haubenpermeameter zum schnellen Durchmessen zahlreicher Stechzylinderproben. Z. Kulturtech. Flurbereinigung 1966, 7, 155–163. [Google Scholar]
  12. Peng, X.; Horn, R.; Peth, S.; Smucker, A. Quantification of soil shrinkage in 2D by digital image processing of soil surface. Soil Tillage Res. 2006, 91, 173–180. [Google Scholar] [CrossRef]
  13. Seyfarth, M.; Holldorf, J.; Pagenkemper, S.K. Investigation of shrinkage induced changes in soil volume with laser scanning technique and automated soil volume determination—A new approach/method to analyze pore rigidity limits. Soil Tillage Res. 2012, 125, 105–108. [Google Scholar] [CrossRef]
  14. Umwelt-Geräte-Technik GmbH. Soil-LT 100—Device for Combined Volume, Weight and Water Tension Measurement; Operating Instructions; Umwelt-Geräte-Technik GmbH: Müncheberg, Germany, 2015. [Google Scholar]
  15. Peng, X.; Horn, R. Modelling soil shrinkage curve across a wide range of soil types. Soil Sci. Soc. Am. J. 2005, 69, 584–592. [Google Scholar] [CrossRef]
  16. Chertkov, V.Y.; Ravina, I.; Zadoenko, V. An approach for estimating the shrinkage geometry factor at a moisture content. Soil Sci. Soc. Am. J. 2004, 68, 1807–1817. [Google Scholar] [CrossRef]
  17. Braudeau, E.; Frangi, J.P.; Mothar, R.H. Characterizing non-rigid dual porosity structured soil medium using its characteristic SC. Soil Sci. Soc. Am. J. 2004, 68, 359–370. [Google Scholar] [CrossRef]
  18. Gebhardt, S.; Fleige, H.; Horn, R. Anisotropic shrinkage of mineral and organic soils and its impact on soil hydraulic properties. Soil Tillage Res. 2012, 125, 96–104. [Google Scholar] [CrossRef]
  19. Peng, X.; Horn, R. Identifying six types of soil shrinkage curves from a large set of experimental data. Soil Sci. Soc. Am. J. 2013, 77, 372–381. [Google Scholar] [CrossRef]
  20. Peng, X.; Horn, R. Anisotropic shrinkage and swelling of some organic and inorganic soils. Eur. J. Soil Sci. 2007, 58, 98–107. [Google Scholar] [CrossRef]
  21. Groenevelt, P.H.; Grant, C.D. Curvature of shrinkage lines in relation to the consistency and structure of Norwegian clay soil. Geoderma 2002, 106, 235–245. [Google Scholar] [CrossRef]
  22. Horn, R.; Baumgartl, T. Dynamic properties of soils. In Soil Physics Companion; Warrick, A.W., Ed.; CRC Press LLC: Boca Raton, FL, USA, 2002; pp. 17–48. [Google Scholar]
  23. Skempton, A.W. The Colloidal “Activity” of Clays. In Proceedings of the Third International Conference on Soil Mechanics, Zürich, Swiss, 16–27 August 1953; pp. 57–61. [Google Scholar]
  24. Alaoui, A.; Lipiec, J.; Gerke, H.H. A review of the changes in the soil pore system due to soil deformation: A hydrodynamic perspective. Soil Tillage Res. 2011, 115–116, 1–15. [Google Scholar] [CrossRef]
  25. Bronswijk, J.J.B. Relation between vertical soil movements and water content changes in cracking clays. Soil Sci. Soc. Am. J. 1991, 55, 1220–1226. [Google Scholar] [CrossRef]
  26. Te Brake, B.; van der Ploegl, M.J.; Rooij, G.H. Water storage change estimation from in situ shrinkage measurements of clay soils. Hydrol. Earth Syst. Sci. 2013, 17, 1933–1949. [Google Scholar] [CrossRef] [Green Version]
  27. Terzaghi, K.; Peck, R.B. Soil Mechanics in Engineering Practise; John Wiley: New York, NY, USA, 1967. [Google Scholar]
  28. Beck-Broichsitter, S.; Gerke, H.H.; Horn, R. Assessment of leachate production from a municipal solid waste landfill through water balance modelling. Geosciences 2018, 8, 356. [Google Scholar] [CrossRef]
  29. R Development Core Team. R: A Language and Environment for Statistical Computing; R Foundation for Statistical Computing: Vienna, Austria, 2008. [Google Scholar]
  30. FAO. Guidelines for Soil Description; FAO-ISRIC Press: Rome, Italy, 2006. [Google Scholar]
  31. Schäffer, B.; Schulin, R.; Boivin, P. Changes in shrinkage of restored soil caused by compaction beneath heavy agricultural machinery. Eur. J. Soil Sci. 2008, 59, 771–783. [Google Scholar] [CrossRef]
  32. Anlauf, R.; Rehrmann, P. Effect of compaction on soil hydraulic parameters of vegetative landfill covers. Geomaterials 2012, 2, 29–36. [Google Scholar] [CrossRef]
  33. Adani, F.; Genevini, P.; Ricca, G.; Tambone, F.; Montoneri, E. Modification of soil humic matter after 4 years of compost application. Waste Manag. 2007, 27, 319–324. [Google Scholar] [CrossRef] [PubMed]
  34. Stępniewski, W.; Widomski, M.K.; Horn, R. Hydraulic conductivity and landfill construction. In Developments in Hydraulic Conductivity Research, Rijeka, Croatia, 2011; Dikinya, O., Ed.; Intech: Rijeka, Croatia, 2011; pp. 249–270. [Google Scholar]
  35. Beck-Broichsitter, S.; Fleige, H.; Horn, R. Waste capping systems processes and consequences for the longterm impermeability. In Soils within Cities; Levin, M., Kim, H.J., Morel, J.L., Burghardt, W., Charzynski, P., Shaw, R.K., Eds.; Catena Soil Sciences: Stuttgart, Germany, 2018; pp. 148–152. [Google Scholar]
  36. Zhang, S.L.; Grip, H.; Lovdahl, L. Effect of soil compaction on hydraulic properties of two loess soils in China. Soil Tillage Res. 2006, 90, 117–125. [Google Scholar] [CrossRef]
  37. Hamdi, N.; Srasra, E. Hydraulic conductivity study of compacted soils used as landfill liners for an acidic waste. Waste Manag. 2013, 33, 60–66. [Google Scholar] [CrossRef] [PubMed]
  38. Ajayi, A.; Horn, R. Comparing the potentials of clay and biochar in improving water retention and mechanical resilience of sandy soil. Int. Agrophys. 2016, 30, 391–399. [Google Scholar] [CrossRef] [Green Version]
  39. Priyankara, N.H.; Abeyrathne, W.K.A.P.; Alagiyawanna, A.M.W.; Kawamoto, K. Investigation of suitability of expansive soil to use as clay liners. In Proceedings of the 14th International Waste Management and Landfill Symposium, Sardinia, Italy, 30 September–4 October 2013; pp. 55–62. [Google Scholar]
  40. Habib, A.S. Effect of compaction characteristics on shrinkage of expansive clay. Res. J. Eng. Appl. Sci. 2013, 2, 439–445. [Google Scholar]
  41. Horn, R.; Peng, X.; Fleige, H.; Dörner, J. Pore rigidy in structured soils—Only a theoretical boundary condition for hydraulic properties. J. Soil Sci. Plant Nutr. 2014, 60, 3–14. [Google Scholar]
  42. Peng, X.; Dörner, J.; Zhao, Y.; Horn, R. Shrinkage behavior of transiently- and constantly-loaded soils and its consequences for soil moisture release. Eur. J. Soil Sci. 2009, 60, 681–694. [Google Scholar] [CrossRef]
  43. Oleszczuk, R.; Brandyk, T. The analysis of shrinkage-swelling behavior of peat-moorsh soil aggregates during drying-wetting cycles. Agron. Res. 2008, 6, 131–140. [Google Scholar]
  44. Chertkov, V.Y. The physical effects of an inter-aggregate structure on soil shrinkage. Geoderma 2008, 146, 147–156. [Google Scholar] [CrossRef]
  45. Gebhardt, S.; Fleige, H.; Horn, R. Shrinkage processes of a drained riparian peatland with subsidence morphology. J. Soils Sediments 2010, 10, 484–493. [Google Scholar] [CrossRef]
  46. Beck-Broichsitter, S.; Fleige, H.; Goebel, M.-O.; Dörner, J.; Bachmann, J.; Horn, R. Shrinkage potential and pore shrinkage capacity of differently developed volcanic ash soils under pastures in southern Chile. J. Plant Nutr. Soil Sci. 2016, 179, 799–808. [Google Scholar] [CrossRef]
  47. Markgraf, W.; Watts, C.W.; Whalley, W.R.; Hrkac, T.; Horn, R. Influence of organic matter on rheological properties of soil. Appl. Clay Sci. 2012, 64, 25–33. [Google Scholar] [CrossRef]
  48. Huang, C.; Shao, M.; Tan, W. Soil shrinkage and hydrostructural characteristics of three swelling soils in Shaanxi, China. J. Soils Sediments 2011, 11, 474–481. [Google Scholar] [CrossRef] [Green Version]
  49. Melchior, S.; Sokollek, V.; Berger, K.; Vielhaber, B.; Steinert, B. Results from 18 years of in-situ performance testing of landfill cover systems in Germany. J. Environ. Eng. 2010, 136, 815–823. [Google Scholar] [CrossRef]
  50. Li, J.H.; Li, L.; Chen, R.; Li, D.Q. Cracking and vertical preferential flow through landfill clay liners. Eng. Geol. 2016, 206, 33–41. [Google Scholar] [CrossRef]
Figure 1. Figure 1. Schematic cross section through the Rastorf landfill including the water balance components (Equation (1)) and installation positions of the tensiometers in 0.2, 0.5, 0.8, and 1.0 m depth; HDPE means high-density polyethylene.
Sustainability 10 04025 g001
Figure 2. Soil-LT scanning operation with an undisturbed soil sample (100 cm3) rotating along the x-z plane (mm) while a coupled CCD camera and a line laser (Control Micro Systems, Orlando, FL, USA) detect and record the soil sample surface (sample left) to generate a three-dimensional structure (samples right) using software tools (Umwelt-Geräte-Technik GmbH, Müncheberg, Germany).
Sustainability 10 04025 g002
Figure 3. Shrinkage curves and corresponding shrinkage geometry factors for the investigated boulder marl in depths of (a): 0.05 m, (b): 0.2 m, (c): 0.5 m, and (d): 0.8 m. The bars indicate the standard deviation (n = 10) at each drying stage. The r2 indicates the coefficient of determination and the dashed lines indicate the confidence limits for a confidence level of 95%. The dashed lines (eshw, ϑshw) indicate the transition point between the structural and the proportional shrinkage phase.
Sustainability 10 04025 g003aSustainability 10 04025 g003b
Figure 4. Three-dimensional (3D) structure of the detected soil core surface including the shrinkage-crack structure of the boulder marl in 0.05, 0.2, 0.5 and 0.8 m depth in a quasi-saturated condition and dehydrated down to the critical matric potential (0.05 m: −60 to −150 hPa, 0.2 m: −150 to −300 hPa, 0.5 m: −300 to −500 hPa, 0.8 m: −500 to −1000 hPa) using the Soil-LT software version 2.0 (Umwelt-Geräte-Technik GmbH, Müncheberg, Germany).
Sustainability 10 04025 g004
Figure 5. Volume shrinkage index (VSI) of the wide coarse (wCP, 0 to −60 hPa), narrow coarse pores (nCP, −60 to −300 hPa), medium (MP, −300 to −15,000 hPa) and fine pores (FP, < −15,000 hPa) in (a): 0.05 m, (b): 0.2 m, (c): 0.5 m, and (d): 0.8 m, n = 10 soil cores per depth. Different letters indicate statistically significant differences (p < 0.05) of the volume shrinkage index in relation to the pore sizes (μm). The symbol + indicates the mean value.
Sustainability 10 04025 g005
Figure 6. Regression analysis: (a): void ratio as a function of the dry bulk density (ρt), (b): volume shrinkage index (VSI) as a function of the fine pores (FP), (c): volume shrinkage index as a function of the clay content with humus topsoil (0.05 m, n = 70), and (d): volume shrinkage index as a function of the clay content without humus topsoil (0.05 m, n = 50). The r2 indicates the coefficient of determination. The dashed lines indicate the confidence limits for a confidence level of 95%.
Sustainability 10 04025 g006
Figure 7. Daily values of precipitation and potential evapotranspiration (ET0) of the local weather station, matric potentials (ψm) in 0.2, 0.5, 0.8, and 1.0 m depth. The colored section between −300 and −500 hPa corresponds to the critical matric potential range (ψmcrit).
Sustainability 10 04025 g007
Table 1. Soil physical and chemical characteristics of the boulder marl in different depths, n = 4 repeated measurements for organic carbon (OC), pH value, texture, and Ks values. The symbol ± corresponds to the standard deviation. SL = * [30].
DepthOCpHSand *Silt *Clay *Ks
[m][wt%][CaCl2][wt%][wt%][wt%][m/s]
0–0.050.12 ± 0.027.4 ± 0.271 ± 120 ± 29 ± 27.2 ± 2.1 × 10⁻⁶
0.05–0.40.09 ± 0.027.6 ± 0.273 ± 319 ± 18 ± 13.4 ± 1.6 × 10⁻⁶
0.4–0.70.05 ± 0.017.6 ± 0.168 ± 221 ± 211 ± 17.4 ± 3.1 × 10⁻⁷
0.7–1.00.02 ± 0.017.7 ± 0.363 ± 222 ± 114 ± 24.1 ± 1.3 × 10⁻⁷
* SL = sandy loam.
Table 2. Soil physical properties of the boulder marl including the total porosity (TP), air capacity (AC), the plant available water capacity (AWC), and the permanent wilting point (PWP), n = 10–15 soil cores per depth, respectively. The symbol ± corresponds to the standard deviation.
DepthTPACAWCPWPρt
[m][cm3/cm3][cm3/cm3][cm3/cm3][cm3/cm3][g/cm3]
0–0.050.302 ± 0.0050.064 ± 0.0120.118 ± 0.0080.125 ± 0.0031.42 ± 0.1
0.05–0.40.298 ± 0.0.10.056 ± 0.0070.105 ± 0.0140.123 ± 0.0151.77 ± 0.1
0.4–0.70.291 ± 0.0120.054 ± 0.0070.125 ± 0.0140.121 ± 0.0051.82 ± 0.1
0.7–1.00.286 ± 0.0130.049 ± 0.0030.114 ± 0.0070.131 ± 0.0111.86 ± 0.4
Table 3. Coefficients of activity (IA) and mineralogy of the boulder marl in 0.05, 0.2, 0.5, and 0.8 m depth, n = 3 repetitions per depth. The symbol ± corresponds to the standard deviation.
DepthIAQuartzCalciteSmectiteVermiculite
[m][-][%][%][%][%]
0–0.050.16 ± 0.289–933–42–82–3
0.05–0.40.15 ± 0.186–954–52–101–3
0.4–0.70.18 ± 0.185–883–43–113–4
0.7–1.00.28 ± 0.186–913–43–102–3
Table 4. Fitting parameters derived from shrinkage curves of the boulder marl in 0.05, 0.2, 0.5, and 0.8 m depth follows [16]: saturated void and moisture ratio (es and ϑs), the transition point between the structural and the proportional shrinkage phase (eshw and ϑshw), the change of void ratio (e) and moisture ratio (ϑ) during the structural shrinkage phase (es-eshw and ϑsshw), and the proportional shrinkage phase (eshw-eshd and ϑshwshd). The factor ∆e indicates the change in the void ratios (volume loss) due to swelling after the re-wetting from −1000 hPa to a quasi-saturated condition, n = 5 soil cores per depth. The symbol ± corresponds to the standard deviation.
Depthχpqr2 eshw, ϑshwes-eshw, ϑs-ϑshweshw-eshd, ϑshw-ϑshd∆e
[m][-][-][-][-] [cm3/cm3][cm3/cm3][cm3/cm3][cm3/cm3]
0.052.4257.5880.8710.98ϑ0.6270.051 ± 0.0010.049 ± 0.010.017 ± 0.002
e0.6670.001 ± 0.0010.01 ± 0.002
0.22.1606.52510980.98ϑ0.3940.027 ± 0.0010.077 ± 0.040.018 ± 0.002
e0.4100.002 ± 0.0010.012 ± 0.08
0.54.4137.3574.1160.97ϑ0.3550.045 ± 0.0020.051 ± 0.030.027 ± 0.003
e0.3860.006 ± 0.0020.013 ± 0.02
0.87.9747.9933230.96ϑ0.3160.070 ± 0.0020.063 ± 0.030.028 ± 0.005
e0.3730.013 ± 0.0070.027 ± 0.02

