1. Introduction
College education promotes developing students’ competency in the subject matter so that they can apply the materials to make the right decisions both at work and in life. University curricula should be current and include the right courses in the right sequence in order for students to maximize their academic and professional growth. Recently, researchers have paid greater attention to maximizing student performance through improving students’ non-cognitive skills. Non-cognitive skills in education are defined as attitudes, personality, and strategies to accomplish a goal that contributes to students’ academic performance [
1,
2]. Sustainable development of the non-cognitive skills throughout college education can optimize student outcomes such as obtaining a job and being successful at it [
3].
The development and sustainment of these non-cognitive skills require instructors to identify students’ learning style and needs pertaining to the course taught and assess how the development of non-cognitive skills is associated with student performance. However, to date, there has been little information to guide college instructors on how to assess and improve students’ non-cognitive skills and sustain long-term positive student outcomes.
Predictive analytics is a branch of advanced analytics that uses a cause-effect dataset to train and develop models that can predict target variables, as well as gain insights on the important patterns or signals existing within the dataset. The predictive analytics results provide organizations with actionable knowledge to improve decision-making. Our study proposed applying a predictive analytics model as a tool to support instructors in identifying the non-cognitive skills that can effectively improve student performance in the class, as well as sustain the positive outcome into subsequent semesters, even after getting a job. With the emergence of predictive analytics in the last decade, there has been a strong demand for its applications in wide areas to provide stakeholders in various organizations with valuable information to enhance their decision-making [
4,
5]. One of the areas of tremendous growth opportunities for predictive analytics lies in higher education and how universities can leverage student and educational data to extract insights to benefit students, faculty, and administrators alike [
6]. These techniques also provide the ability to predict the future outcomes, such as student performance metrics, based on a set of assumptions as long as robust training data are available to develop a predictive model. Furthermore, the techniques can map input (independent) variables to a target (dependent) variable to understand which input variables are significant to the target variable, compare the several predictive models to determine the best model for the given data, and find value-adding associations between the inputs and target along with an accurate prediction of the target variable.
A sustainable predictive analytics modeling approach that can identify students’ learning styles and non-cognitive skills in the beginning of the semester can be a useful tool for instructors to tailor the teaching contents and environment and subsequently obtain optimal effort and performance from the students. We hypothesized that the application of predictive analytics early in the semester will lead students to earn higher grades compared to those learning in the environment without the analytics. Additionally, we hypothesized that those students benefiting from the student-level tailored teaching for the semester will have a sustained long-term positive effect, such as being more successful in subsequent semesters and beyond their undergraduate years.
Using the predictive analytics approach, we collected self-reported information on student’s non-cognitive skills as input to the analytics model in the first week of the semester to predict students’ final course grades. The non-cognitive skills reported by the students included: career direction; self-perceived popularity level; comfort level as a team member; interest level in the course taught; number of service activities participated; average number of sleep hours per day; average number of doctor visits per semester; class participation level; ability to hold off on immediate gratification, such as using a smartphone during the class; ability to finish the assignment without procrastinating; gender; and energy drink consumption.
Student performance was measured as an outcome of non-cognitive skill improvement. Previous studies have reported environmental factors as significantly associated with student performance. Nancarrow et al. [
7] have found the impact of successful team work leading to successful project outcomes; Bembenutty and Karabenick [
8] found an evidence of self-regulating behavior, such as delayed gratification behavior, along with facilitative beliefs about the future, positively impacting students’ success; Taras and Potts-Datema [
9] revealed that suboptimal sleep as well as poor sleep quality affect how well students are able to learn and consequently perform in class; Kenealy, Frude, and Shaw [
10] showed that the popular and physically attractive students tend to lead groups and get better grades; Davies and Graff [
11] revealed the positive impact of participation on student performance in the learning environment; Tracey and Robbins [
12] found that choosing an academic major that is closely related to students’ interest and personality has a positive impact on their academic success; and Taras [
13] could not substantiate the long-term improvement of academic achievement through vigorous physical activity. We also collected data on students’ health conditions to understand the impact of health on their academic performance [
14], and the number of service activities that the students are involved in to study the effect of time-management on their grades [
15].
This paper is organized as follows.
Section 2 provides the background information and related work of predictive analytics and its application to student performance.
Section 3 describes the predictive analytics and tailored teaching model for this study, and
Section 4 explains the data and details the methodology behind the predictive analytics approach.
Section 5 discusses the performance and results from the predictive analytics analysis.
Section 6 provides the evidence for the feasibility of this approach in enhancing students’ performance. Some concluding remarks and future research direction are offered in the final section.
2. Previous Applications in Student Performance
A number of studies have undertaken predicting academic performance by mapping the academic success with various factors. Many of the studies have gained valuable insights into understanding ways to improve student performance. Both cognitive and non-cognitive skill measures have been examined in predicting student performance with varying successes.
Tam and Sukhatme [
16] assessed the academic performance of high school students grounded on their class rank percentile by collecting data from the enrolling freshmen 1994 cohort at the University of Illinois at Chicago. Their academic advancement was analyzed over the next six years by defining success as earning a degree within the study period. The result of their study revealed that better admissions decisions for the students can be made by using the high school academic quality indicator rather than the traditional college entrance exam in ACT scores. Consequently, the university adopted a modified students’ high school percentile rank as a component for the admissions decision.
Johnson [
17] studied the impact that students’ high school category had on their success rates at a university. Specifically, the research integrated the effects that high school-related individual student variables had on academic success by developing a predictive model to determine the likelihood of graduating from the institution within five years upon enrolling. The research also revealed that the high school category attended by the students does matter in predicting the graduation of students, leading to shaping some high schools across the United States (US) to reconfigure their curriculum.
Naik and Ragothaman [
18] developed predictive models in neural networks, regression, logit, and probit models to analyze the data used in MBA admissions, and found a better way to improve the admissions decisions. The study used 10 independent variables, including measurements in undergraduate institutions, major as an undergraduate, location of their MBA program, and GMAT scores; for the dependent variable, MBA applicants were divided into successful and marginal groups based on their exit GPA from their program. They found that predictive models are effective in being able to identify successful MBA students, and suggested that neural networks models can outperform other well-known traditional models.
Tracey and Robbins [
12] for five years studied 80,574 students in 87 colleges for two different representations of interest-major congruence in Euclidean distance and angular agreement. They concluded that high academic performance in college is related to having a major that is close to one’s interests and personality. Additionally, the study underlined that such congruence predicted students’ GPA better than those standardized exams such as SAT or ACT scores.
Similarly, Allen and Robbins [
19] used a predictive model to help students identify the right major based on students’ interests and abilities. They followed 47,914 students in 25 colleges, and found that the strong relationship between students’ success and academic environment fit their ability and personality. Moreover, the right fit also played a significant role in students staying in a major after selecting it. This study is widely used by academic counselors across the country to help students find the right schools and majors.
Vandamme et al. [
20] studied the relationship between parameters that include chance of success in college, study skills, attendance, and prior academic performance. The study revealed that variation in these factors during a student’s time at the university had a significant impact on their academic performance. Furthermore, they reviewed and worked with various data-mining techniques to predict students’ academic performance, only to find that their performance was disappointing, especially when the task was to categorize students into high-risk, medium-risk, and low-risk groups before their first exam at their university.
Lee et al. [
21] utilized statistical techniques to predict engineering students’ first-year academic achievement. This study found that the more prepared they were coming into university, the more motivated students were to ask for help when materials became difficult, and that tapping into the university’s available learning resources helped them succeed.
Extending the previous research, this study proposed examining the feasibility of using a predictive analytics approach to improve and sustain students’ non-cognitive skills and positive student outcomes.
3. The Predictive Analytics and Tailored Teaching Model
The main purpose of a predictive analytics is to predict the value of a target or dependent variable based on the values of independent or explanatory variables. The first step in predictive analytics is data preparation, which is to review the dataset’s missing values, outliers, and skewed distribution and correction action using imputation and transformation methods to improve the quality of the data. The model-development step used randomly partitioned training and validation datasets to develop a predictive model; this process terminated when the mean squared error value, which is a metric to determine the quality of prediction models by comparing the actual against the predicted value, is minimized without overfitting to the training dataset [
22,
23].
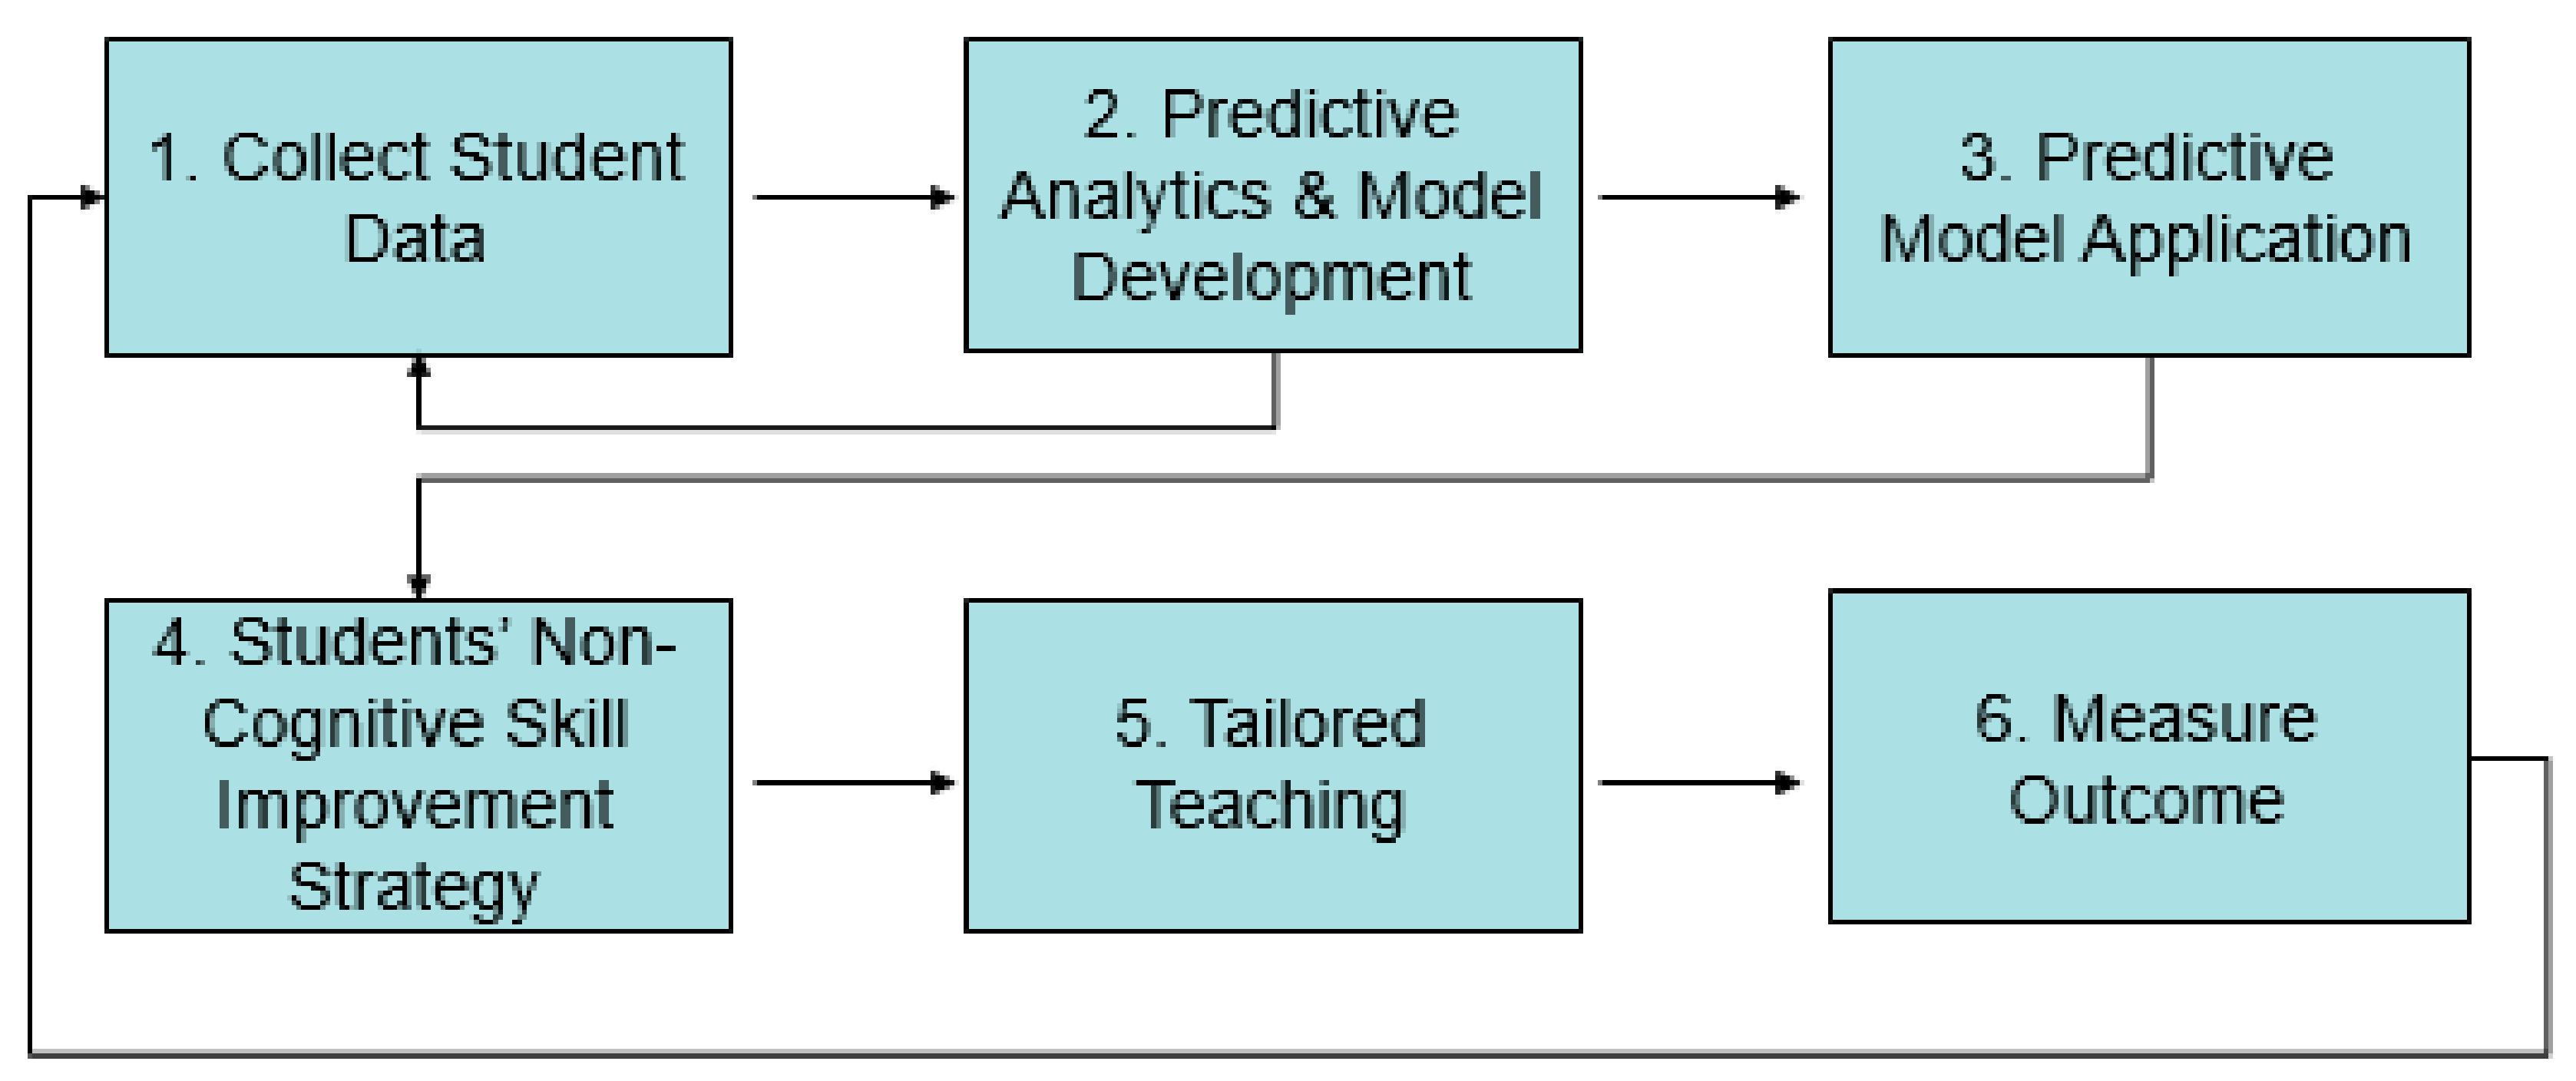
The predictive analytics and tailored teaching model that was used in this study is illustrated in
Figure 1. The first step was collecting data on students’ non-cognitive skills to understand their non-cognitive skills that had potential for improvement by an instructor’s tailored teaching. The next step was analyzing the collected data and developing a predictive model that could accurately predict students’ final grades for the semester. This was an iterative process to identify data that was collected initially that may have been deemed inappropriate or insignificant for the study sample, and continuously feed in new data after each semester from the control group to strengthen and sustain the approach.
Once an accurate and reliable predictive analytics model was developed, the model, in step three, was then used in the first week of the semester to predict students’ final grades. It should be noted that the student data that was collected in the first two semesters of the research were used to serve as a baseline data to develop the model. In step four, the instructor applied the findings into identifying students who could benefit from tailored teaching and devised a strategy, in step five, to improve their non-cognitive skills based on the predictive model result for those students. In the last step, at the end of the semester, for the sections including those that used the approach (test group) and those that did not (control group), the actual final grade was compared against the predicted final grade, within the group and between the groups, to understand the true impact of the approach.
For this study, tailored teaching was defined as the execution of strategies that the instructor used to improve students’ non-cognitive skills and classroom performance; although all of the students receive the benefit of tailored teaching when done as class discussion and guest speakers, the students that were mainly targeted were those the model predicted as doing poorly in the class. All of the students in the test group who were predicted to do poorly in the class were individually invited to an office hour for a conversation. Moreover, of these targeted students, if a lack of career direction was identified as a variable that was significantly associated with a low final semester grade for some students, the instructor would provide career-related materials to the students. Another example would be to invite guest speakers to invigorate the topic covered in the class, discuss work experience, and talk about the importance of staying healthy and developing healthy habits. The tailored teaching practices used in this study have never been specifically studied in any earlier study, but our practices are motivated from the earlier work of Sayer et al. [
24] and Goldman and Schmalz [
25].
Table 1 summarizes the tailored teaching that was most frequently used in this study, the corresponding student attributes that it was designed to help, and the number of students that were targeted for each practice; there were a total of 73 students predicted for low grades of C or below who were targeted for tailored teaching help.
4. Data
A total of 522 students’ data were collected in a business analytics course that was taught in an AACSB-accredited business school. The course sequence recommended by the school is to be taken by all of the business students in their second year, and 78% of the students in the survey were in their second year. Fifty-four percent of the students were males, and the rest were females.
The student data were collected via a survey that was handed out to the students to fill out in the first week of the semester. The data collection in the beginning of semester was to develop a predictive model while minimizing survey-based biases, such as anchoring and/or acquiescence [
26], which are commonly found in survey data. The data were collected from the fall 2009 semester to the fall 2016 semester, with the first two semesters in fall 2009 and spring 2010, consisting of 151 students, used to strictly develop the predictive analytics model. The subsequent semesters of students, totaling 371 students, were used to study the effectiveness of the predictive analytics approach. Although not all of the sections in the time period were used for this study, each semester provided at least two sections of the same course to allow for a test and control group comparison. In addition, the requirements for the course remained consistent for the selected date range. The breakdown of annual student count between the groups in the study is shown in
Table 2.
Table 3 presents the variables collected for the study, the questions asked to the students to collect the data, and the measurements that were used. This study collected the following non-cognitive skills as independent variables: average number of service activities participated per semester; clarity level in career direction; interest level in the course; average number of hours spent exercising; comfort level working as a part of a team; self-perceived popularity; average hour of sleep per night; frequency of doctor visits during a semester; class participation level; ability to hold off on using a smartphone during the class; ability to finish assignments without procrastinating; amount of energy drink consumed; and gender. These variables were used to predict students’ final semester grades. Students’ cumulative GPA were not collected, because some students felt uncomfortable sharing it in the beginning of the semester to the instructor, as that feeling can carry over and bias the instructor [
27].
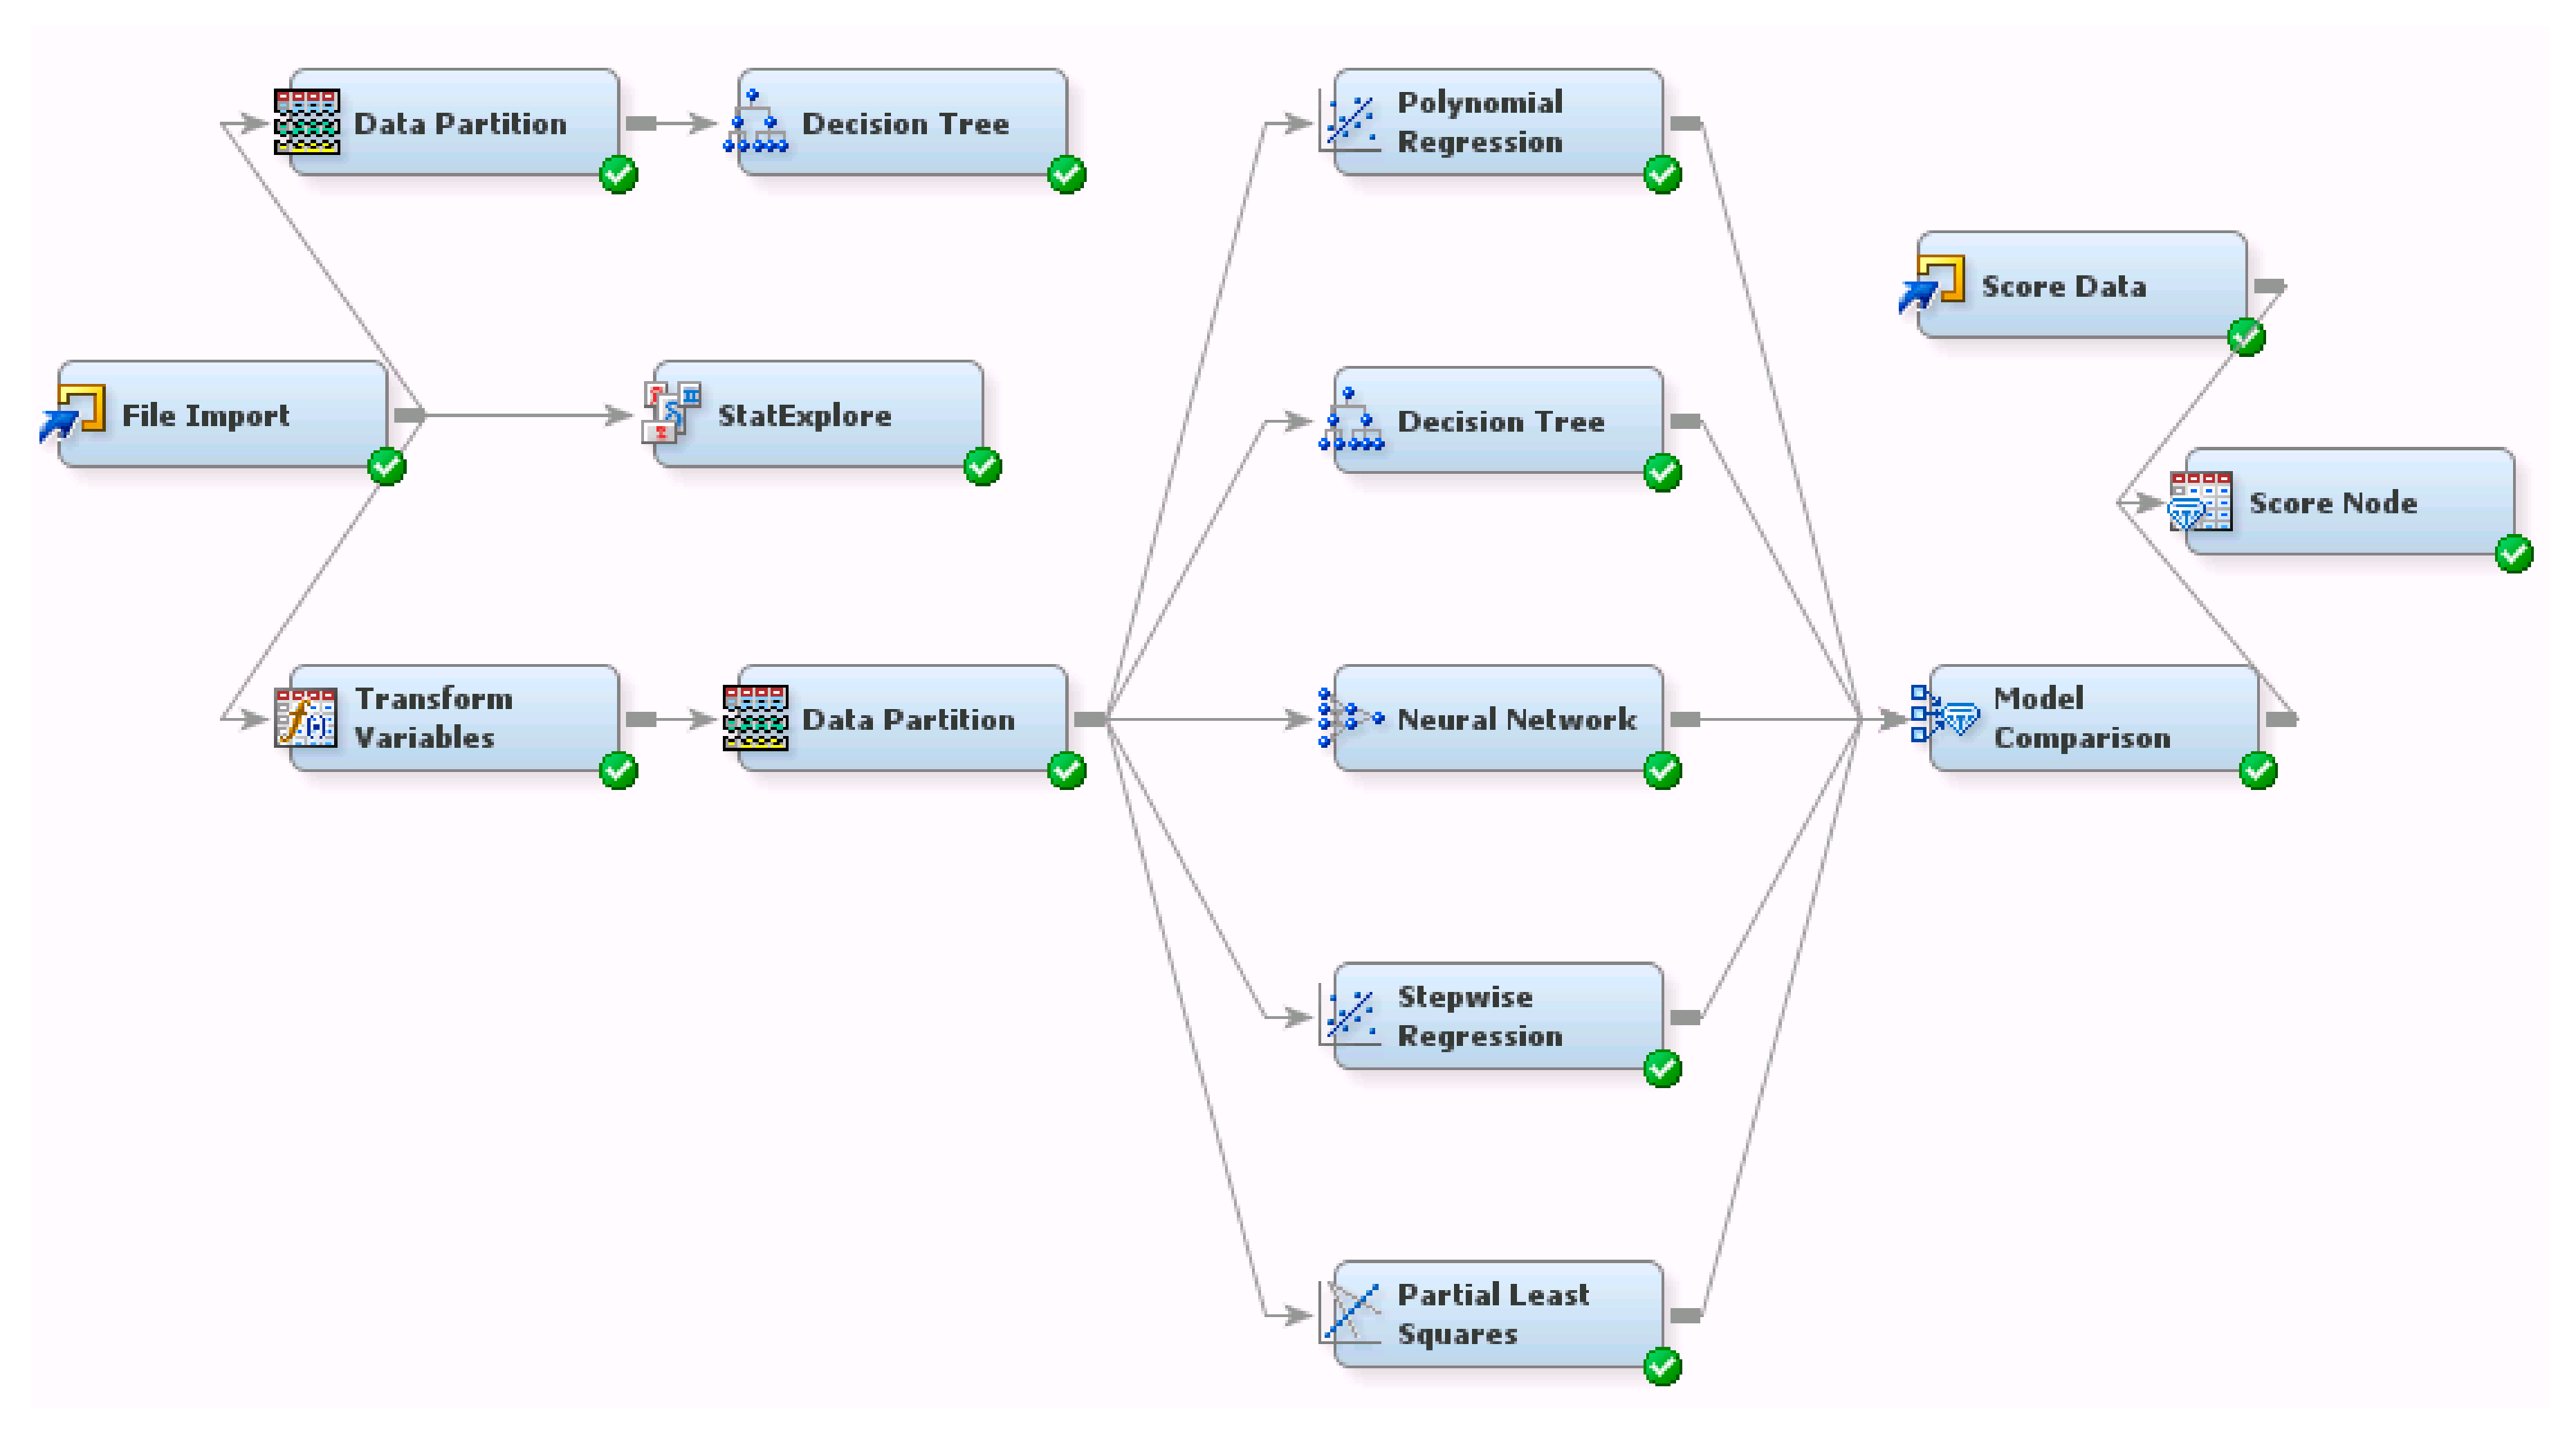
Figure 2 shows the flow of the predictive analytics model that was used in this study. SAS Enterprise Miner was utilized for the predictive modeling and subsequent analyses. In the data-preparation step, we identified the following variables to be log-transformed due to skewness coefficient exceeding ±1: Direction, Energy Drink, Exercise Hours, and Team. Then, we randomly partitioned 70% of the dataset to be the training set and the remaining 30% to be held out for validating the model. The predictive analytics techniques that were used were decision tree, neutral networks, and multiple regression techniques including stepwise regression and partial least squares. In the next step, we compared all of the models’ predictive performance by the average squared error metric (
ASE) based on validation data to identify the best predictive model to use in this study. In the last step, the best model was selected, which was the model with the lowest
ASE value; it was subsequently used to predict the final semester grade for new students taking the class, and the associations between the independent variables and dependent variable were analyzed.
This study used polynomial regression, decision tree, the neural network model, stepwise regression, and the partial least squares method to model the student data. Each of these models has its own pros and cons, and uses different algorithms when predicting dependent variables.
Decision trees are one of the most used techniques in the field of predictive analytics. They are conceptually simple, with a transparent rule-based algorithm allowing users to make predictions and interpret the results with ease. In addition, this technique is widely used for data exploration, which makes it widely applicable and popular [
28].
Decision trees use a splitting rule based on logworth value that is designed to increase purity in the target variable. Using the rule, the dataset repeatedly gets split to find smaller groups that can provide useful insights. One disadvantage of using this method is that the tree may split too many times in order to improve predictive accuracy; it has a propensity to overfit to the training dataset.
The neural networks model is a predictive tool that works by simulating a large number of interconnected processing units that mimic the human brain. It can be thought of as a regression model on a set of derived inputs, which are called hidden units. In turn, the hidden units can be thought of as regressions on the original inputs. The hidden units include an activation function that is based on a hyperbolic tangent function.
Neural networks can predict virtually any continuous association between the independent variables and the dependent variable. Although it is known to be a “black-box” tool due to difficulty in interpreting the model, it is one of the strongest predictive tools out in the industry today with a wide range of useful applications [
29,
30].
The regression models applied in this study were stepwise, polynomial, and partial least squares. Regressions, as parametric models, assume a specific association structure between independent and dependent variables. The coefficients for the independent variables and the intercept that collectively make up the regression equation were derived by minimizing the least squares estimation. The prediction from regression can be viewed as a linear approximation to the average value of a dependent value conditioned on observed independent values.
Stepwise regression is a semi-automated process of building a model by successively adding or removing variables based solely on the
t-statistics of their estimated coefficients. It allows users to identify significant variables from a large number of potential independent variables. Each independent variable that is added has the largest contribution to
adjusted r2 among the independent variables that are considered. Moreover, the procedure also considers dropping independent variables that are not statistically significant in each step. The procedure terminates when the impact of additional independent variables is not statistically significant [
22].
Polynomial regression is an extension of multiple regression in which the relationship between the dependent variable and the independent variables is modeled nonlinearly using an
nth order polynomial. It is widely used in a situation where there are some relationships that can be hypothesized to be curvilinear. A second-order polynomial forms a quadratic expression, a third-order polynomial forms a cubic expression, and a fourth-order polynomial forms a quartic expression [
31].
The partial least squares (PLS) method is specifically developed to correct some weaknesses in the other regression methods. This method is powerful in situations where the independent variables are highly collinear. In addition, this method is also found to be effective when there are more independent variables than the number of observations in the dataset, where overfitting can easily happen. PLS puts emphasis on accurately predicting the dependent variable rather than attempting to find the underlying relationship between the variables [
32].
Once all the models were developed, they were compared with each other; the most accurate model was determined by the lowest average squared error (ASE) and selected for predicting the end-of-semester grades for the students. The results from the other models that were not selected as the best were also used to better understand the relationship between the independent variables and the dependent variable; these results revealed supplementary insights for this study.
5. Results
Table 4 shows the descriptive statistics of the variables that were used in this study from the 151 baseline students from randomly selected sections in the fall 2009 and spring 2010 semesters, who were used to strictly develop the predictive analytics model. On average, the students visited a doctor twice per semester, slept seven hours per day, drank over four energy drinks per semester, and exercised a little less than three hours per week. The average semester grade was 81.0, which equated to the letter grade “B–”. The hypothesis testing between the baseline students and control groups across different semesters and different years tested non-significance at a 0.05 level, demonstrating that there is no statistical difference in semester grade between the groups before tailored teaching.
The lowest
ASE value indicates the most accurate model, and the stepwise regression model performed the best with an
ASE value of 13.01. The next best model is the decision tree model, which has an
ASE value of 14.43.
Table 5 summarizes each model performance and predictive accuracy comparison based on the validation data and corresponding training data.
The result from the stepwise regression model found the following six variables to be significant in predicting students’ semester grade:
Doctor Visit,
Interest,
Direction,
Exercise Hours,
Team, and
Popularity (all variables with
p < 0.01). The adjusted
r2 for the model is 0.70, which means that 70% of variability in the target is explained by the model.
Table 6 shows the full summary of the stepwise regression analysis.
The decision tree, with two branches per node and a maximum depth of six, showed reliable prediction, and its output analysis generated variable importance ranking, as shown in
Table 7. This ranking is calculated based on the logworth values from the tree.
Doctor Visit was the variable of most importance with a value of 1.00. For the second most important variable,
Direction was selected with a value of 0.78.
Team Player and
Smartphone had a value of 0.43 and 0.41, respectively.
Popularity and
Service had values of 0.28 and 0.25, respectively. Not surprisingly, there was a strong overlap of variables found to be significant in both the decision tree analysis and the stepwise regression.
The decision tree rules found the negative impact that the frequency of doctor visit has on student performance. The main rule revealed that a student who has less than three doctor visits per semester with a high career direction has a significantly higher chance of performing well in the course, with an average semester score of 90. Moreover, of those receiving an “A” (semester score of 93 to 100) for the semester, 49% had an average of zero trips to a doctor’s office per semester.
If a student saw a doctor at least three times per semester along with not having a clear career direction, the predicted semester performance for the student was poor. Another tree path revealed that a healthy student with a high degree of clarity for a career direction as well as a high degree of interest in the course content was predicted to receive an “A” in the course. On the other hand, if a healthy student with a high clarity of career direction did not have a high level of interest in the course content, and was highly popular around the campus, the student was predicted to receive a “B” in the course.
The results regarding smartphone usage revealed that 74% of those who did not use smartphone in class had an average of no doctor visits during the semester. Among those who did not use smartphone in class, 67% had at most one doctor visit on average per semester. Of those who had an average of two or more doctor visits per semester, 71% used their smartphone in the class.
The predictive performance of the polynomial regression found some strong interaction effects. The strong positive interactions (p < 0.01) were: Doctor Visit and Energy Drink; Sleep Hours and Energy Drink; Direction and Participation; and Sleep Hours and Service. The strong negative interactions (p < 0.01) were: Energy Drink and Popularity; Participation and Service; Doctor Visit and Direction; Service and Direction; and Sleep Hours and Direction.
The neural networks model, which has multilayer perceptron architecture with three hidden units, and the partial least squares model were also used, but the performance of these models based on ASE were not strong.
6. Application of Predictive Analytics
To help improve these students’ non-cognitive skills and course performance effectively, we applied the Pareto 80/20 principle, where we worked to improve 20% of the targeted students’ most significant non-cognitive skills in an effort to achieve an 80% feasible improvement in their semester grade. Since doctor visit and interest in the course were found to be the top two significant variables determined by stepwise regression, which was the best predictive model for this study, the instructor asked invited guest speakers to talk about the importance of healthy habits and lifestyle, as well as invigorate students’ interest in analytics. Another tailored strategy used was to invite all of the students who were predicted to receive a poor grade to instructor’s office hours to talk specifically about the non-cognitive skills that could help them in class, including the importance of time management, healthy lifestyle, and career direction. Individualized homework based on student’s improvement needs was also used for tailored teaching.
For example, in the 2014 spring semester, our survey revealed a result with 15 students predicted to receive a grade of “C” or lower, and among them: 12 students who were unsure of their career direction, 14 students who indicated using a smartphone while class is in session, seven students who were visiting doctors more than three times per semester, and five students who had a propensity for procrastination. For this test group, all 15 students were invited separately to the instructor’s office hour, where discussion on the non-cognitive skills that would be helpful in the class took place. In one class, a tailored strategy included spending one lecture to prepare students for job fairs; the lecture included information about different majors, the companies that were hiring those majors, the main responsibilities involved when hired as a certain major, the relevance of the course to each major, and the different potential career paths available to business school graduates; these activities increased the clarity in career direction for the students. Another strategy was to assign individualized homework to help students understand the importance of delayed gratification, discourage smartphone usage during class to prevent distraction, and have them summarize an article found in
The Atlantic [
33] that studied the adverse effects of smartphone usage on student health and achievements. At the end of the semester, the control groups’ average semester grade for the semester was 80.6, which was not statistically different from the baseline average of 81.0. However, the test groups’ performance improved by an average of 9%, with the semester grades of 87.8.
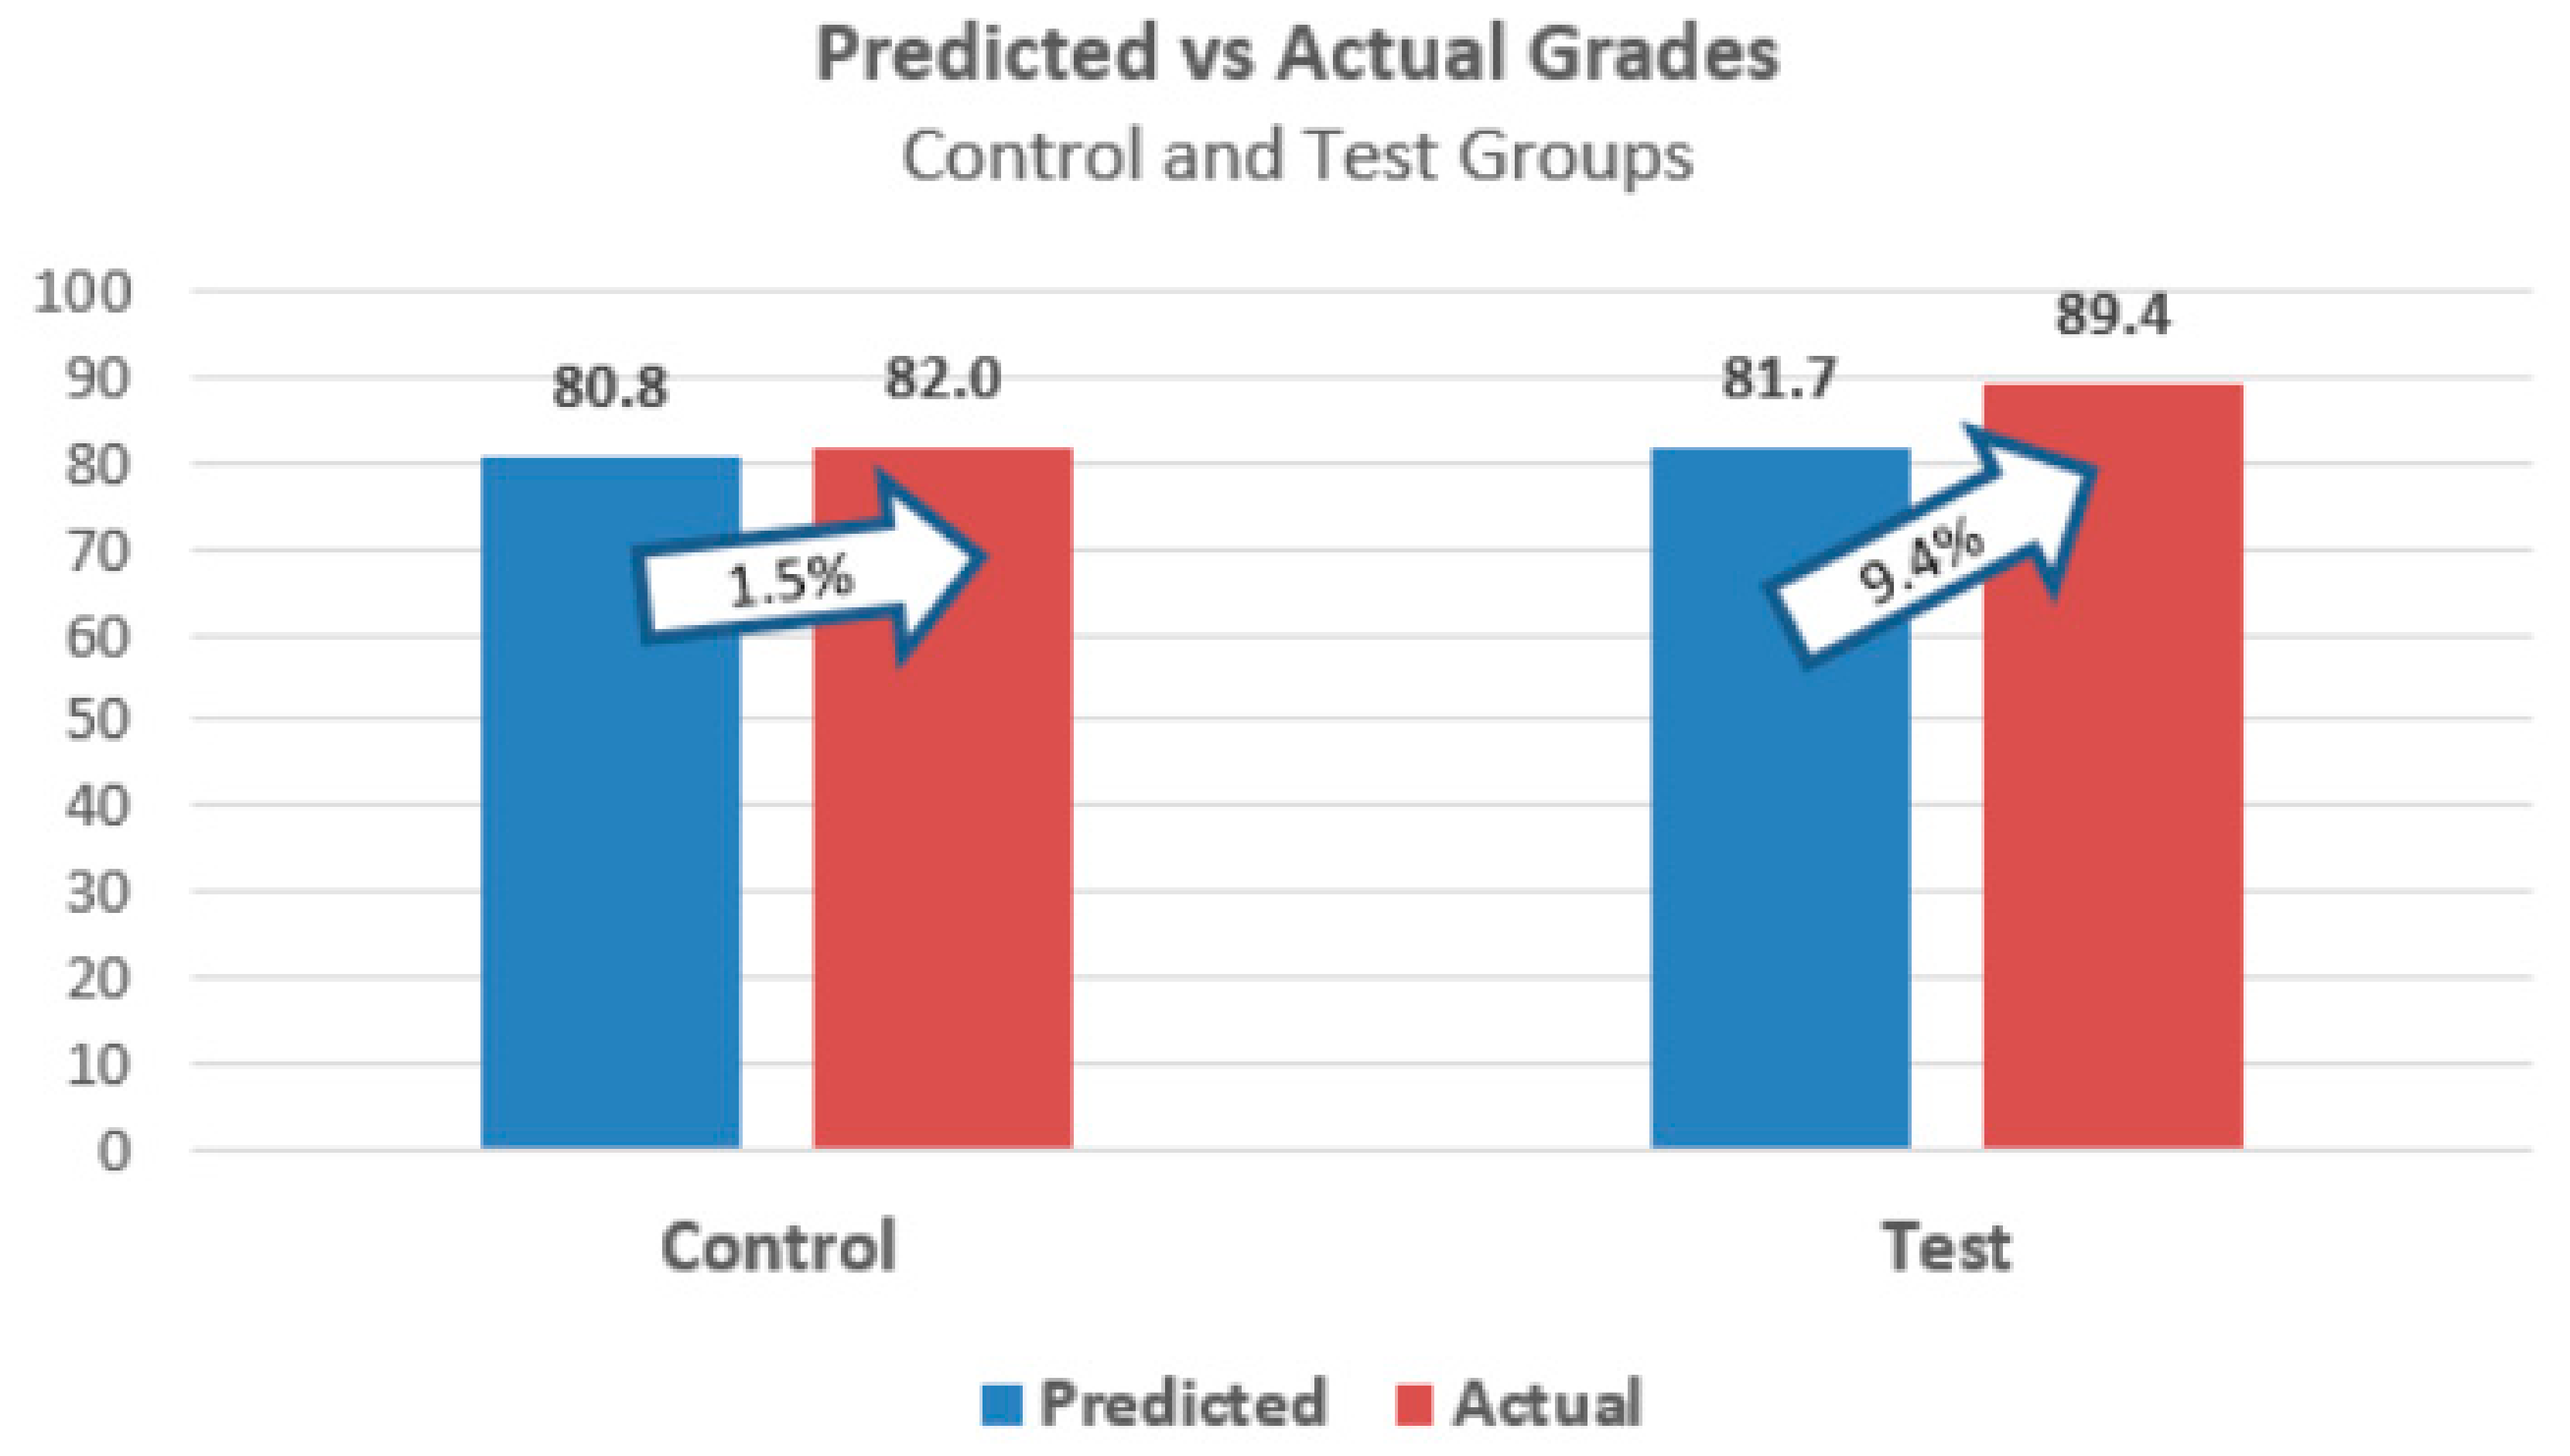
Figure 3 summarizes the actual and predicted grades between the control and test groups for all of the years, also illustrating the percent increase between the groups. It shows that although both groups improved in academic performances, only the test group’s improvement—from an 81.7 average predicted semester grade to an 89.4 average actual grade with tailored teaching practices—was found to be statistically significant (
p < 0.05).
The results across different years were almost identical with 9% improvement, demonstrating the sustainability of this approach. Furthermore, the students who were predicted to receive poor grades all made a significant improvement to their grade, and some even wrote on the class evaluation comment section about how their non-cognitive skills improved over the course of the semester. The students in the test group were also less absent due to sickness compared to the control group by 16%.
Table 8 summarizes the annual improvement results, as well as the corresponding sample size of the students in each group.
In the spring 2016 and fall 2016 semesters, the same instructor taught an upper-level analytics course that required the lower-level analytics courses as prerequisites. Among the students in these courses, 38 students were from the test group of the lower-level courses from spring and fall 2015.
These students’ individually identified dimension scores were significantly higher (p < 0.05) compared to their previous scores that were collected in the first week of their lower-level class. For example, 54% of the students decreased the frequency of their trips to the doctor’s office; 42% stated that they no longer used smartphones in the class, 35% stated that they looked forward to working in a team environment and enjoyed the topic. Their semester grade averaged 90.6, which was significantly higher than those who were not in the instructor’s lower-level course, demonstrating the long-lasting impact applying predictive modeling to improve students’ performance.
7. Conclusions and Future Direction
Similar to how a firm has to produce goods of the utmost quality, or they risk being beaten out by their competition, higher education must find new and creative ways to teach students to perform to their maximum potential by operating their classrooms with end products in mind [
34]. Also, with the fast-changing world we live in, many schools are struggling to adequately and swiftly respond to the demand placed on them by industry and societal needs, as well as making the class room feel more safe [
35]. The higher education has to now focus on educating and improving students’ cognitive and non-cognitive skills in order to optimize students’ potential in the real world.
The variables that were studied in this research were those skills that could be improved by instructors by tailored teaching. For example, an instructor can bring in the relevancy of the class to the real world to provide legitimacy to the course, and invite students to the office hour for individualized discussion. The study findings demonstrate that an instructor using the predictive analytics approach can systematically and effectively enhance the students’ performance in the class by supplementing their traditional teaching with tailored teaching specifically targeting improving students’ non-cognitive skills. There is strong evidence of a long-lasting positive effect to students who have benefited from this approach.
The stepwise regression outperformed other models in this study, and demonstrated that it can accurately predict students’ end-of-semester grades based on the non-cognitive skills data collected from the students in the first week of the semester. Therefore, the model can help faculty identify the students who have a higher likelihood of struggling in the class very early into the semester, as well as those who may need more help from an instructor. The instructor can then have almost an entire semester to improve students’ non-cognitive skills and help them make better connections with the course content and the instructor. Additionally, instructors can partner with the school counselor to design customized and formal interventions to help students get much-needed individual-level support.
One limitation of this research is that the students’ data were all collected from a business analytics class offered from a single university. Therefore, the results may not be generalized to other courses and other universities; nevertheless, this study provides a solid framework for predictive analytics application in higher education to help better prepare our students for the real world, as well as demonstrate the importance of educating non-cognitive skills in improving student performance.
Further studies using predictive models in higher education can increase knowledge-management activities. Also, with more instructors involved in using predictive models to enhance learning environments and improve non-cognitive skills, the integration and transfer of knowledge between courses, instructors, and even universities to better understand the broader effect of student development through open innovation becomes a natural next step [
36,
37]. Such knowledge-integrative and transfer environments can improve students’ decision-making quality, their preparedness coming into the work force, their overall cognitive and non-cognitive skills, and overall organizational performance [
38,
39].


