Abstract
In the age of rapid motorization, walking, as both a green travelling mode and the most common form of daily physical activity, has been given increasing attention in Chinese metropolises. Walkability describes the extent to which a neighborhood environment is walking-friendly and recently has been regarded as a potential impetus for inflated housing prices. In this paper, we develop a walkability measurement model considering residents’ usage characteristics of the amenity, which incorporates three key factors: (1) amenity usage frequency; (2) amenity selection diversity; (3) the distance decay effect. Accordingly, we employ the proposed method to the case of Nanjing City and identify a clear spatial pattern of spatial heterogeneity in walkability among the 4143 dwelling areas within it. The experimental results suggest that the distribution of the residential walkability score varied greatly within Nanjing. It can be seen that dwelling areas with a high walkability score were clustered in the urban central regions and most dwelling areas showed a low walkability. Then, we utilized the hedonic price model to explore the correlation between neighborhood walkability and housing prices. The results show that the effects of community walkability on housing prices were statistically significant in Nanjing. Thus, we can infer that high walkability communities generally have concentrated rich amenity resources, and consequently have high property values.
1. Introduction
During the past few years, the housing market in Chinese metropolises has reached record levels. For example, the average housing price for an apartment in the Nanjing center area was close to $12,000 per square meter in 2017, which is clearly beyond affordability for most families. In addition to rapid urbanization and massive population migration that have brought about the property bubble, determinants that have resulted in the spatial variation of housing prices can be affected by the amenity value in the proximity of neighborhoods, such as access to a metro station, shopping mall, hospital, school and green space [1,2,3]. Accordingly, the benefits of convenience and accessibility will be priced into nearby real estate and those that want to pursue a high-quality living environment will pay more for comfortable accommodation. Though housing prices vary depending on proximity to convenience, the values of such amenities cannot be easily quantified [4,5].
At present, many cities in China are facing two problems caused by increasing population growth, one is a traffic jam and the other is air pollution. The implementation and development of the Green Travel Plan is an important way to address these problems; for it is a green and low carbon travel mode. According to the latest survey, more than 60% of commuters in Nanjing city rely on public transit options (bicycle, bus and subway), while only a limited percentage (10%) utilize private cars [6]. In such a public transit-oriented environment, as public transportation cannot provide door-to-door services, walking plays an important role in supporting the system. In addition, walking as the main form of physical activity also has multiple health benefits for residents of all ages. These health outcomes include increased longevity, reduced major chronic diseases risk (i.e., diabetes, hypertension, obesity and physical inactivity), and improved symptoms of depression. Therefore, walking can be considered the most common form of daily physical activity, as well as regarded as a healthy and active lifestyle [7].
2. Literature Review
2.1. Walkability
The term ‘walkability’ originated from the walking ability of a human being [8]. During the past decades, several scholars and experts have put forward various definitions of walkability. Abley [9] regarded walkability as the extent to which characteristics of the built environment is friendly to residents in the area for living, enjoying, commuting or shopping. Gebel [10] claimed that walkability refers to the extent to which the area helped pedestrians. Moura [11] proposed that the concept of walkability is that people should be more active in walking in open urban environments.
Researchers in different fields have proved various methods to assess walkability. The developed measurements and tools include the geographic information system (GIS), self-reported instruments (e.g., social questionnaires and checklists), in-field surveys, indices and spatial cluster analysis. [12,13]. For example, urban planners develop walkability indices by combining the diversity of variables that denote dwelling density, street connectivity, and land use mix and calculated corresponding values for assessing walkability. Urban geographers classify walkability scales into three types: community (point), street sections (line) and neighborhood (area) level. At the street level, researchers emphasize the suitability aspect of walkability and focus on the pedestrian quality. At the community and neighborhood level, scholars stress the accessibility and connectivity aspects of walkability and measure the convenience in accessing daily amenities. These methods may differ in their implementation; they generate two major types of outcome: One is the number of elements that hinder or promote walking, the other is a value that indicates the high vs low suitability to which the spatial analysis object (street or community) is conducive to walking [14,15]. Now, there have been tools developed to solve different scales, from the community point to the neighborhood area and street segments. The company Walk Score (https://www.walkscore.com, Seattle, WA, USA) ranks cities and neighborhoods according to how walkable they are. The Walk Score system offers scores for cities by calculating walkability at points and weighting these measurements by population densities and the calculated scores are normalized between 0 and 100. The Walkability APP (https://walkabilityasia.org/) allows users to divide the street level walkability through 38 types in the Active Living Research inventory. The developed tools or methods have obtained great advances in walkability assessment. However, one common issue with most methods is the unclear structuring measurement indicators and the arbitrary selection of evaluation criteria [16]. How to effectively quantify and compare the estimated values is another key problem because empirical studies are still limited to provide the answer.
2.2. Walkability and Neighborhood Environment
The neighborhood environment is a key element in assessing neighborhood walkability. A wealth of literature has reported that neighborhood environment indices such as street connectivity, residential density, and community facilities are related to a walking activity. Jacobs [17] argued that the ideal neighborhood is designed to facilitate walkability. Sun [7] emphasized that walkable neighborhood characteristics encourage people to increase their walking distances. These factors are mainly related to safety features, regional structure, comfort and convenience, population density. Ball [18] proposed that environment elements that correlate with walkability include the local neighborhood such as the presence of the parks and green space, convenient facilities and pedestrian amenities. Community facilities are the services or amenities utilized by local communities for various purposes, which may include food retail, transport, education, recreation, social and cultural, financial and health. Diyanah [17] suggested that the supply of community facilities is interrelated with the walking behavior of the neighborhood. For example, the walking distance from a residential area to school must be within 10 min. The neighborhood shops considered as a local convenience service and amenity, which supply the daily needs of the adjacent residential population within the neighborhood catchment area. The location of these shops should be situated on the average walking distance or near major streets and road intersections, which makes it easily accessible by both pedestrians and vehicles.
2.3. Walkability and Housing Prices
Scholars in different fields (e.g., urban planning, real estate economics, geography, social science and public health) have done empirical studies to examine the relationship between walkability and housing prices. Leinberger and Alfonzo [19] conducted a study of walkability in Washington, D.C.; the results indicate that home values in highly walkable neighborhoods in the D.C. area were more expensive on average than housing in less walkable neighborhoods. It also means that buyers have preferences for multi-value neighborhoods, in which various amenities could be accessed by walking. Cortright [20] studied 15 large metropolitan areas and reported 12 cities with a positive relationship between walkability and housing values at the neighborhood level. To understand the complexity of the effect of residential walkability on real estate valuation, home scholars have sought to explore the correlation between the amenity value and housing prices. Zheng [21,22] found that subway transit stations can help increase housing prices in the range of impact is 400–600 m. Yan [23] argued that total home values decreased by 0.5% on average if the distance from a convenience store increased by 200 m and thus housing prices will reduce with the increasing distance from convenience stores. As expected, life service facilities (e.g., commercial circles, primary and elementary schools, hospitals and restaurants) can have a greater impact on housing prices. For example, Lin [24] analyzed the impact of the key primary school regions on housing prices, finding that those home buyers would be affected by their demand for better educational resources in different areas. Song and Knaap [25] pointed out that frequent business activities of commercial circles can promote dwellers’ life convenience and accordingly have a positive impact on neighboring real estate prices. Taede [26] used the accessibility indicator to study the correlation between housing prices and regional accessibility and found that public service accessibility plays an important role in the property transaction price. The above case studies have proven that residents prefer to live in walkable neighborhoods and there is a significant price gap in dwelling unit values between walkable and less walkable areas.
2.4. Current Study
Prior researchers have developed various methods and tools to measure walkability. However, one general problem with most methods and tools is the arbitrary selection of evaluation indicators and the unclear structuring of assessment criteria. An effective and reliable assessment approach needs to consider the residents’ daily usage characteristics of amenities. In addition, in order to obtain objective and fair evaluation results, it is necessary and important to collect the samples within a community, route, block, or neighborhood. According to previous research, the neighborhood environment can generate differential effects on the nearby real estate. However, few studies have investigated the influence of neighborhood walkability on housing prices from the perspective of the metropolis environment. Therefore, the purpose of this paper is twofold: To develop a neighborhood walkability measurement incorporating usage frequency, selection diversity, and distance decay function, and to explore the relationships between neighborhood walkability and housing prices using a hedonic price model. To be specific, we aimed to: (1) propose an integrated walkability assessment method based on the usage characteristics of amenities; (2) employ the proposed method to the case of Nanjing City and explore the spatial variations in dwelling area walkability; (3) utilize the hedonic price model (HPM) to identify a correlation between community walkability and housing prices.
3. Methodology
3.1. Methodological Framework
Neighborhood walkability is affected by both spatial and non-spatial factors simultaneously. In this paper, we propose an integrated walkability assessment method based on the usage characteristics of amenities. More specifically, the model analyzed the walk travel characteristics of residents from several perspectives, including usage frequency, selection diversity, and the distance decay effect. Figure 1 presents the methodological framework for the walkability assessment applied in this study.
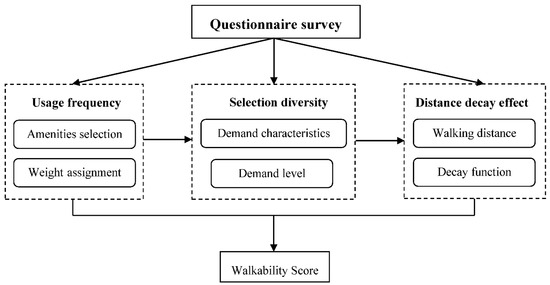
Figure 1.
Methodological framework for walkability assessment.
With respect to the amenities selection, scholars have proposed a variety of indicators to measure neighborhood walkability in previous literature. The Walk Score system selected nine categories of amenities to assess the community level walkability and each of these amenities received a weight value based on its frequency of utilization. In this paper, our study focused on the house estate walkability in Nanjing and thus attempted to put forward an effective method based on the usage characteristics of amenities. Considering the usage of public facilities in the daily life of common Chinese inhabitants, the selected 24 amenity types (or destinations) were structured into seven community resource domains: transport, education, retail, recreation and leisure, financial, medical care, social and cultural. Particularly, the usage characteristics of each amenity were highly sensitive to the walkability assessment. Thus, questionnaire surveys were conducted in Nanjing City and 2000 local residents (across age, sex, education, occupation) were asked to fill in a questionnaire on the utilization of amenities in their daily life. These interviewees reported which amenities were necessary for their daily life. Moreover, the interviewees also reported their utilization frequency (high, moderate and low) for each amenity, which was used for a weight assignment [8].
3.1.1. Amenity Usage Frequency
The amenities usage frequency reflected the demand for various amenities, different usage frequencies also led to differences in the demand for amenities. Based on the amenities usage frequency, amenities were classified into three categories: high frequency (everyday use), medium frequency (weekly use), and low frequency (rarely use). For example, some amenities (e.g., supermarket, bus stop and school) are frequently visited in the daily life of inhabitants in Nanjing, while others (e.g., post office, KTV—Karaoke television) are used less than once a month. In this study, in order to emphasize the frequency-based demand characteristics, the weight values were calculated from the proportion of the 2000 interviewees’ choices for each amenity. Weightings were in the range of 0 and 1, the final selected amenities, as well as their weights, are shown in Table 1.

Table 1.
Amenities for walkability assessment in Nanjing City.
3.1.2. Amenity Selection Diversity
Selection diversity is caused by the variety of amenities, which refers to the difference in the services provided by different amenities of the same type, thus, leading to a variety of options for certain types of amenities. For example, the product difference provided by diverse convenience stores is small, so people will choose the nearest one, and its selection diversity is poor. While the services offered by different restaurants vary greatly, including ingredients, taste, environment and price, thereby its selection diversity is rich. Selection diversity represents the breadth of people’s demand for amenities, the better the diversity of amenities, the greater the number of amenities required to meet such needs and the more choices people have. Here we followed the methodology proposed by Wang [27] to quantify the selection diversity. That is, proximity amenities are responsible for a high demand proportion and as the distance increases, the proportion decreases gradually. Given that amenities selection diversity mainly depends on individual subjective factors (e.g., personal preference and habits), to get a quantitative value of amenity diversity, our study was based on the following assumptions: (1) The same type of multiple amenities can be chosen with equal probability; (2) in the case of the same satisfaction of demand, people prefer to choose a closer amenity. Considering the above assumptions, each amenity of selection diversity value can be achieved by the online questionnaire survey. According to the results from the statistical analysis of the questionnaire responses, we defined that 90% is an optimal threshold for the allocation proportion to determine the selection diversity value for amenities of the same kind.
Table 2 shows that there were significant differences in the selection diversity of different amenities. For example, some amenities with high diversity like shopping malls, restaurants and square, which require at least three amenities to cover most residents’ needs, while for other amenities such as clinics, gyms, and pharmacies, one was sufficient to satisfy demand.

Table 2.
Allocation proportion of diversity demands of amenities.
3.1.3. Distance Decay Effect
The distance decay effect revealed the rule that the satisfaction of amenities to walking travel decreased with the increased walking distance. Specifically, the longer the distance to the destination, the less likely people were to travel to it by walking. Usually, amenities with a high usage frequency require shorter walking distance. The closer the amenity is, the better the walkability will be and as the distance increased, the walkability reduced. When the walking distance reached an upper limit, the walkability was close to zero and few people chose to walk to the amenity. The walking distance was associated with environmental characteristics (physical or social), which include proximity to destinations and social features like street attributes or different population groups. Over the past two decades, a distance of 400 m (5 min walk) was often used as an acceptable walking distance in U.S. research studies. However, some researchers suggested that walking trip distances between 800 m (10 min) and 1200 m (15 min) may be common for different purposes. Inspired by the previous studies on both the distance and duration of walking trips [28,29], we modeled the decay function (see Figure 2) by establishing a distance piecewise function (range: within 400 m = no decay, 400–800 m = 0.6, 800–1200 m = 0.25, 1200–1600 m = 0.08, more than 1600 m = full distance decay).
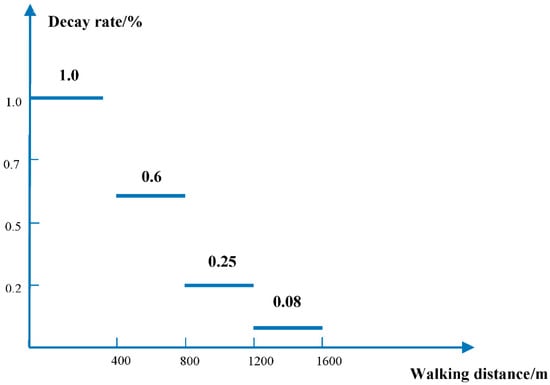
Figure 2.
Distance decay function.
3.2. Measurement of Walkability
With regard to the walkability measurement, previous studies have proposed different alternatives. The purpose of this study was to develop a walkability evaluation model based on the usage characteristics of amenities. The proposed model incorporates three key issues for assessing walkability within a Chinese context: (1) the usage frequency; (2) selection diversity; (3) the distance decay effect. Details of the computational process were implemented in the following steps:
- For each dwelling area, , a search corresponding to the number of various amenities.
- Calculate the road network distance, , between a residential location, , and amenity, , and obtain the corresponding distance decay rate, .
- Compute each category amenity value under both usage frequency and selection diversity considerations:where is the amenity weight value based on its usage frequency, is the assigned demand ratio of amenity , is the selection diversity value ().
- Count the walkability score of a dwelling area, , by adding up various kinds of amenity values:where denotes the walkability score of the dwelling area and the calculated values were normalized into an interval between 0 and 100; is the amenity type.
To further illustrate the computational procedure of the proposed model, two sets of amenities (restaurant and primary school) were used in the following case experiment. In addition, as shown in Table 3, in order to generate more accurate distance measurements, we used the network distance instead of the Euclidean distance.

Table 3.
The sample data for the calculation of neighborhood walkability.
The calculated outputs (restaurant and primary school) were:
3.3. Hedonic Price Model
The hedonic price model (HPM) has been widely used to study the relationship between heterogeneous housing prices and their attributes [30,31]. Prior studies have used the HPM to investigate housing prices traditionally to classify the influential variables into different categories, such as structural variables, neighborhood characteristics, and market and environmental variables and use them as independent variables [32,33]. For example, home-buyers often choose high cost-effective real property because they expect to get shares and comfortableness from the house. For an apartment, the construction area, the number or size of bedrooms, the greening rate and plot ratio are first considered. Then, the location attributes of the house are crucial to dwellers; the distance to public service facilities and the nearest school or transfer station, whether the region is located in the central part of the city are also seriously considered. Besides, the surrounding social and environmental characteristics are also taken into account. The above factors help to determine a home-buyers satisfaction with the house and affect the price they are willing to pay for it. Based on the above considerations, the hedonic regression model was used in this study. Generally, the model has three main forms: linear models, semi-log models and double-log models. In this study, we used a typical hedonic equation of housing prices in a semi-logarithmic form, as presented in Equation (3):
where represents the market price of the housing, represents the housing characteristic variable among all housing variables (e.g., structural attributes, location attributes and surrounding attributes), is the coefficient to be estimated, and is the random error term. To reduce the scale of the dependent variable, this paper utilized the semi-logarithm model instead of a linear model.
4. Data Sources and Processing
4.1. Study Area
Nanjing (31°14′–32°37′ N, 118°22′–119°14′ E) is the capital of the Jiangsu province in Eastern China. It is located in the lower Yangtze River basin and the Yangtze River Delta economic zone. Nanjing serves as one of China’s emerging cities and was rated as one of the most livable cities in 2016. In this paper, our case study focused on the central part of the Nanjing metropolitan area, which covers an area of about 1043 km2, with a total residential population of more than 5.23 million in 2016. As shown in Figure 3, these areas are socioeconomically developed and represent significant residential population clusters in Nanjing.
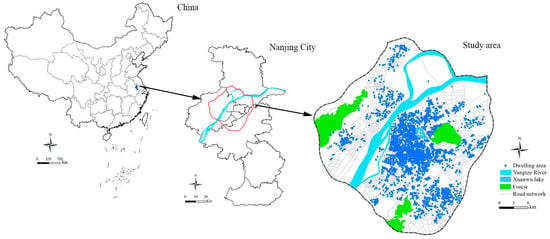
Figure 3.
Location of Nanjing City (China) as well as the dwelling areas within it.
4.2. Data and Processing
Most scholars have used census tract, residential area, postal code, community and block as the geographic unit for defining a neighborhood [34]. In spatial analysis research, a smaller spatial unit is preferable to a large unit due to the impact of the modifiable area unit problem (MAUP). As a result, in this study we used dwelling area as the neighborhood geographic boundary, which is the smallest geographic unit for residential management in China [35]. The datasets for this research mainly include point data of dwelling area (4143 in total) and those of amenities nearby. Specifically, the amenity and dwelling point data were web electronic navigation map data from Baidu Map, and data related to distance were calculated based on the shortest road distance. Then, the basic geographical data (e.g., road networks, rivers, lakes and administrative district polygon shape files) were provided by the Nanjing Planning Bureau. In addition, housing transaction data for 4143 dwelling areas in 2017 were collected by the web crawler tool and attributes regarding the residential name, transaction price, housing size and building type.
Within a walkability research context, accessibility represents the travel distance via walking from a residential location to a specific amenity. In prior studies, GIS (geographic information system) was considered to be a valid and reliable technology to calculate the measures of amenities accessibility. Some earlier studies based on the Euclidean distance, such methodologies were straightforward but ignore the actual travel environment. To capture the walkability of each neighborhood accurately, multiple walking zones within each catchment were acquired utilizing the Network Analyst models of ArcGIS. Figure 4 indicates that a 1600 m buffer computed by the Euclidean and road network distance, respectively, and the difference in service scope between the two methods.
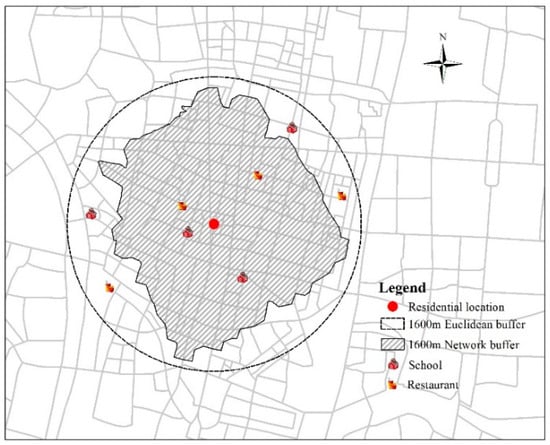
Figure 4.
A comparison between the Euclidean and Network buffers.
5. Results and Discussion
5.1. Spatial Patterns of Walkability and Housing Price
One of the most common and important tasks in Exploratory Spatial Data Analysis (ESDA) is examining the spatial autocorrelation in the data. Therefore, to explore the spatial patterns of the dwelling area walkability score, the Global Moran’s I and LISA (Local Indicators of Spatial Association analysis) were employed to visualize the walkability score. In general, the Global Moran’s I indicates the spatial autocorrelation and LISA identifies whether high or low scores cluster together across space. Specifically, in this paper, we utilized the nearest neighbor distance matrix to conceptualize the spatial relationships, which guaranteed each feature had at least one neighbor.
Spatial patterns of the walkability score are presented in Figure 5a. It can be observed that dwelling areas with a higher walkability score (> 60) were mainly located in the urban central regions (e.g., Gulou, Xjiekou and Fuzimiao) and the majority of the dwelling areas show remarkably lower walkability scores (0–21), which means that the walkability among the 4143 dwelling areas in Nanjing varied greatly. Then, the value of global Moran’s I was found to be 0.884 (p < 0.01), which indicates that high or low walkability scores should be clustered together. Further, we used the LISA index to identify the local clusters of the walkability score (Figure 5b), presenting that the high–high clusters were concentrated in the downtown areas, while the low–low clusters appeared in the dwelling areas within the suburban districts. The above analysis results suggest that there were great spatial inequalities in the walkability among the dwelling areas within Nanjing.
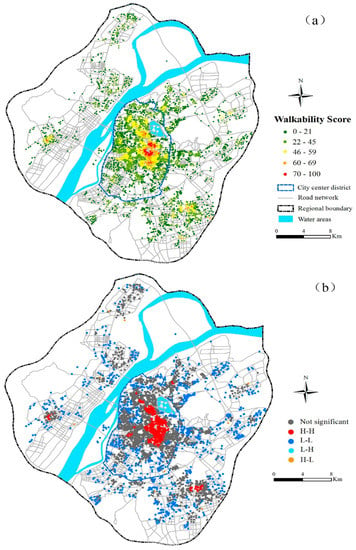
Figure 5.
(a) Spatial pattern of walkability score for the dwelling areas across the study area. (b) Local Moran’s I for dwelling area walkability.
Dwelling-level housing prices are depicted in Figure 6, which were in the range of 4000 to 70,403 Yuan/m2 with a mean of 26,921 Yuan/m2. It can be found that housing prices varied greatly between the north Yangtze river areas and their southern counterparts and the average prices of the central districts were significantly higher than those of the southern and northern districts. In particular, the high price dwelling areas clustered around the city core regions mentioned before. This was consistent with the location of the high walkability score areas.
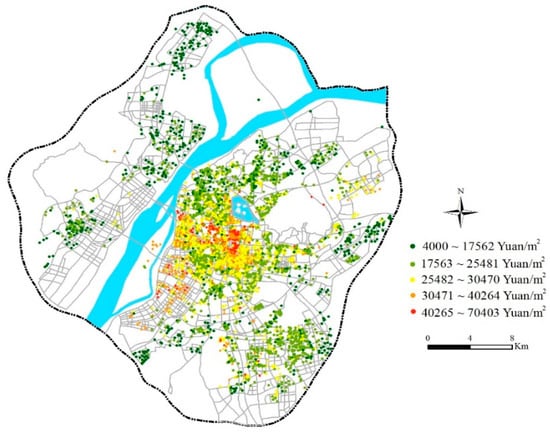
Figure 6.
The spatial pattern of housing prices in Nanjing.
5.2. Neighborhood Walkability and Housing Prices
5.2.1. Spatial Unit of Analysis
The modifiable area unit problem (MAUP) has always been a key issue in spatial analysis. Similarly, the reasonable choice of a spatial unit (scale) can significantly affect the result of the regression analysis. A suitable spatial unit may help to decrease the effect of the MAUP and reveal micro-spatial patterns. In general, socioeconomic characteristics vary greatly with geographic scales, and commonly used urban geographic units can be divided into several levels: community, census tract, block, and district [34,35]. Oberwittler [36] emphasized that a smaller census unit is preferable to a larger unit because data can be less averaged and aggregated. In China, the community is the smallest geographic boundary for defining a neighborhood. Consequently, in this paper community (N = 590) was employed as the geographic neighborhood boundary in the spatial regression analysis. The spatial patterns of walkability at the community scale are implemented in Figure 7.
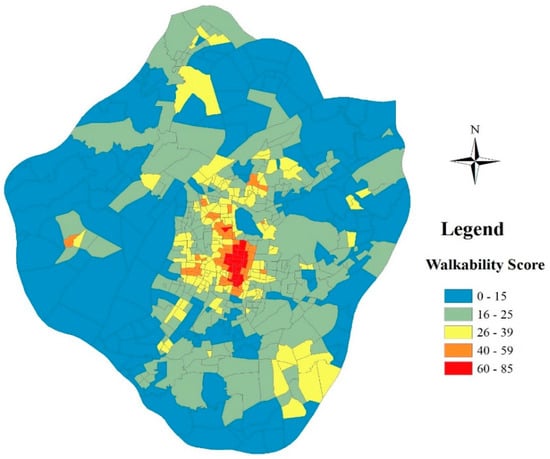
Figure 7.
The spatial pattern of walkability at the community scale.
5.2.2. Variables
Based on previous research and in light of the difficulty in obtaining data, we used the dwelling unit market price (yuan/m2) as the dependent variable P of the hedonic price model. Furthermore, three residential characteristics: housing attributes, location characteristics, and walkability attributes were variables relevant to our study focus and were chosen as independent variables. Housing attributes, which were the internal attributes of the house structure. In this study, the age of the house (AGE), population density (DENSITY) and property management fee (FEE) were selected as housing attributes. Location characteristics include variables associated with the distance to common facilities and neighboring infrastructures, such as the distance to the nearest CBD (D_CBD), commercial circle (D_CC), 3A hospital (D_3AH), square (D_S) and nearby (in the range of 1 km) bus stations (N_BS), subway stations (N_SS), primary schools (N_PS), public facilities (N_PF), commercial services (N_CS) and administrative agencies (N_AA). To explore the contribution of the walkability score to home prices, walkability indicators were divided based on different types of requirements domains (see Table 4) [37]: education resource, transport site, life service, commercial facility and leisure place to support the focus of this research. Table 5 offers a list of the 18 independent variables, along with the description and definition for each variable.

Table 4.
Walkability attributes categories.

Table 5.
Descriptions of the residential characteristic variables used in the Hedonic pricing model.
5.2.3. Effects of Neighborhood Walkability Based on HPM
Table 6 presents the HPM results estimated utilizing an ordinary least squares regression model. The adjusted R-square in the OLS (Ordinary Least Square) model was 0.748 which indicated that the explanatory variables accounted for 74.8% of the housing variance in the HPM. Notably, some key indexes worthy of attention are presented in Table 6. Firstly, the coefficients of these independent variables indicate the relationship between explanatory variables and housing prices. For example, all location characteristic variables like D_CBD, D_CC and D_3AH show a negative correlation with housing prices as expected because residents that live in the downtown areas take less time to obtain more available facility resources and a great convenience than that in the suburbs. Besides, t-statistics can assess the statistical significance of these independent variables and a low p-value can express that these coefficients are not likely to be zero. Among these variables, all housing attribute variables were statistically significant at the 1% level, D_CC and W_LS variables significantly affected the housing prices at the 5% level, while N_PF and W_LP variables show no significance for housing prices.

Table 6.
Estimation results of the regression.
As discussed in the previous section, the effects of neighborhood walkability on housing prices were compared among different walkability attributes. As shown in Table 6, the education resource attribute W_ER in walkability categories had a positive significant effect on the surrounding housing prices at the 1% level, the regression coefficient shows that a dwelling unit price was higher by 11.2% when it was near areas with educational resources. To some extent, education resources indeed can enhance the housing prices. Houses near key primary schools in Nanjing are favored by families with children of school age and most parents prefer to pay a high price for a “school district house” due to its great accessibility and educational level. Furthermore, the distance to the transport site W_TS was also an essential indicator of housing prices. The regression coefficient was 0.275, demonstrating that with a one-degree increase in walkability of a transport site, the housing price increased by 27.5%. This account for why young office workers tend to afford the high housing prices in downtown areas and reside close to public transport where various public facilities concentrate and thus, the high walkability of transport sites contributes to high housing prices in these regions. The W_LS and W_CF variables were positively correlated because these amenities fulfil residents’ daily demands for shopping, lodging and eating. Generally, major supermarkets, financial services and business centers were clustered there. Compared with the suburbs, these areas were very convenient and the residents’ demands for housing were large; as a result, housing prices were relatively high. However, the W_LP variable was identified as not significantly correlated with housing prices, we infer that W_LP did not have a significant effect on housing prices based on our data.
6. Conclusions
This paper aimed to propose a neighborhood walkability assessment method within a Chinese metropolis context. Unlike previous studies under the original Walk Score methodological framework, we measured neighborhood walkability based on the usage characteristics of amenities of Chinese residents. In particular, our advanced model focused on the following three key factors affecting residents walking behavior: (1) Usage frequency (e.g., high, medium and low frequency) was employed to determine the categories of amenities and their relative importance. Within a Chinese city context, 24 categories of amenities and their weights were selected in this paper. (2) Selection diversity was designed to quantify the residents’ demand differences for the same type of amenities. Generally, people preferred to choose the nearest one when such amenity needs can be satisfied simultaneously. In such a conceptual framework, the concrete allocation proportion of diversity demands of amenities and selection diversity values were captured through a questionnaire survey. (3) The distance decay effect was developed for various amenities, which reflects that the neighborhood walkability varied with walking distance. Under the decay function, we calculated the road path distance from the residence to amenities instead of the traditional Euclidean distance. Then, we employed the proposed method to the case of Nanjing and examined the great variations in walkability score among the 4143 dwelling areas with it.
The experimental results suggest that the distribution of the residential walkability score varied greatly within Nanjing. More specifically, dwelling areas with a high walkability score were clustered in the urban central regions and most dwelling areas showed low walkability.
Then, the article examined the effects of community walkability on housing prices using a hedonic price analysis based on community units (N = 590) in Nanjing. Based on previous studies and the conditions in Nanjing, 18 explanatory variables were selected. These variables were divided into three categories: housing attributes, location attributes, and walkability variables. Walkability variables were divided based on different types of requirement domains to support the focus of this study. The regression results show that explanatory variables accounted for 74.8% of the housing variance in the HPM. The effects of community walkability on the housing price were statistically significant in Nanjing based on the results of the HPM. Among all the walkability attributes, W_ER, W_TS, W_LS and W_CF had positive effects on housing prices, while W_LP showed no significance for housing prices.
The methodological framework developed in this study offers new insights into walkability research and enhanced the understanding of walkability inequality within a Chinese city context. The advantages of this paper include considering residents’ usage characteristics of amenities, developing the indicator of amenity selection diversity, and incorporating a distance decay function based on the urban road network environment. Considering the above strengths, the proposed model can be applicable to walkability characterization in other cities or areas in China. However, some limitations should be given priority for future study. Firstly, demographic statistics within the neighborhood were not investigated. Residents of different age, gender, income, education, and backgrounds have divergent preferences for various amenities. Secondly, the capacity of each amenity was not considered or quantified; a larger amenity capacity can accommodate more inhabitants’ demand. Thirdly, in order to provide objective and reasonable findings, the walkability difference between downtown areas and suburbs should be added into the analysis.
Author Contributions
Z.X. and H.L. proposed the methodology; Z.X. and Y.C. performed the experiments and analyzed the results; Z.X. wrote the draft of the manuscript; H.L. guided the research and revised the manuscript.
Funding
This research received no external funding.
Acknowledgments
This study was supported in part by the Strategic Priority Research Program of Chinese Academy of Sciences [No. XDA 20030302], in part by the Open Research Fund Program of Beijing Key Laboratory of Urban Spatial Information Engineering [No. 2018208], in part by the Postgraduate Research & Practice Innovation Program of Jiangsu Province [No. KYCX18_0616], and in part by the Fundamental Research Funds for the Central Universities [No. 2018B693X14].
Conflicts of Interest
The authors declare no conflict of interest.
References
- Cohen, B. Urbanization in developing countries: Current trends, future projections, and key challenges for sustainability. Technol. Soc. 2006, 28, 63–80. [Google Scholar] [CrossRef]
- He, B.; Zhu, J. Constructing community gardens? Residents’ attitude and behaviour towards edible landscapes in emerging urban communities of China. Urban For. Urban Green. 2018, 34, 154–165. [Google Scholar] [CrossRef]
- Jim, C.Y.; Chen, W.Y. External effects of neighbourhood parks and landscape elements on high-rise residential value. Land Use Policy 2010, 27, 662–670. [Google Scholar] [CrossRef]
- Xiao, Y.; Chen, X.; Li, Q.; Yu, X.; Chen, J.; Guo, J. Exploring Determinants of Housing Prices in Beijing: An Enhanced Hedonic Regression with Open Access POI Data. Int. J. Geo-Inf. 2017, 6, 358. [Google Scholar] [CrossRef]
- Lin, D.; Allan, A.; Cui, J. Exploring Differences in Commuting Behavior among Various Income Groups during Polycentric Urban Development in China: New Evidence and Its Implications. Sustainability 2016, 8, 1188. [Google Scholar] [CrossRef]
- Wen, H.; Tao, Y. Polycentric urban structure and housing price in the transitional China: Evidence from Hangzhou. Habitat Int. 2015, 46, 138–146. [Google Scholar] [CrossRef]
- Feuillet, T.; Charreire, H.; Menai, M.; Salze, P.; Simon, C.; Dugas, J.; Hercberg, S.; Andreeva, V.A.; Enaux, C.; Weber, C.; et al. Spatial heterogeneity of the relationships between environmental characteristics and active commuting: Towards a locally varying social ecological model. Int. J. Health Geogr. 2015, 14, 12. [Google Scholar] [CrossRef] [PubMed]
- Su, S.; Pi, J.; Xie, H.; Cai, Z.; Weng, M. Community deprivation, walkability, and public health: Highlighting the social inequalities in land use planning for health promotion. Land Use Policy 2017, 6, 315–326. [Google Scholar] [CrossRef]
- Lwin, K.K.; Murayama, Y. Modelling of urban green space walkability: Eco-friendly walk score calculator. Comput. Environ. Urban Syst. 2011, 35, 408–420. [Google Scholar] [CrossRef]
- Gebel, K.; Bauman, A.; Owen, N. Correlates of non-concordance between perceived and objective measures of walkability. Ann. Behav. Med. 2009, 37, 228–238. [Google Scholar] [CrossRef] [PubMed]
- Moura, F.; Cambra, P.; Gonçalves, A.B. Measuring walkability for distinct pedestrian groups with a participatory assessment method: A case study in Lisbon. Landsc. Urban Plan. 2017, 157, 282–296. [Google Scholar] [CrossRef]
- Leslie, E.; Coffee, N.; Frank, L.; Owen, N.; Bauman, A.; Hugo, G. Walkability of local communities: Using geographic information systems to objectively assess relevant environmental attributes. Health Place 2007, 13, 111–122. [Google Scholar] [CrossRef] [PubMed]
- Azmi, D.I.; Ahmad, P. A GIS Approach: Determinant of Neighbourhood Environment Indices in Influencing Walkability between Two Precincts in Putrajaya. Procedia Soc. Behav. Sci. 2015, 170, 557–566. [Google Scholar] [CrossRef][Green Version]
- Merlin, L.A. Can the built environment influence nonwork activity participation? An analysis with national data. Transportation 2015, 42, 369–387. [Google Scholar] [CrossRef]
- Maghelal, P.K.; Capp, C.J. Walkability: A review of existing pedestrian indices. URISA J. 2011, 23, 5–19. [Google Scholar]
- Park, S.; Deakin, E.; Lee, J.S. Developing perception-based walkability index to test impact of micro-level walkability on sustainable mode choice decision. Transp. Res. Rec. 2014, 2464, 126–134. [Google Scholar] [CrossRef]
- Azmi, D.I.; Karim, H.A. A Comparative Study of Walking Behaviour to Community Facilities in Low-Cost and Medium Cost Housing. Procedia Soc. Behav. Sci. 2012, 35, 619–628. [Google Scholar] [CrossRef]
- Ball, K.; Bauman, A.; Leslie, E.; Owen, N. Perceived environmental aesthetics and convenience and company are associated with walking for exercise among Australian adults. Prev. Med. 2001, 33, 434–440. [Google Scholar] [CrossRef] [PubMed]
- Washington, E. Role of Walkability in Driving Home Values. Leadersh. Manag. Eng. 2013, 13, 123–130. [Google Scholar] [CrossRef]
- Winkelman, S.; Bishins, A.; Kooshian, C. Planning for economic and environmental resilience. Transp. Res. Part A Policy Pract. 2010, 44, 575–586. [Google Scholar] [CrossRef]
- Zheng, S.; Sun, W.; Wang, R. Land Supply and Capitalization of Public Goods in Housing Prices: Evidence from Beijing. J. Reg. Sci. 2014, 54, 550–568. [Google Scholar] [CrossRef]
- He, J.; Zheng, S. Can the new subway raise the price of a house: A Case Study of Beijing Metro Line 13. City Dev. 2004, 11, 36–38. (In Chinese) [Google Scholar]
- Yan, S.; Liu, H.; Hu, L.; Wu, Q. Quantitative Study of Micro Factors Influencing Urban Residential Land Price: A Case Study of Nanjing City. Sci. Technol. Manag. Land Resour. 2011, 28, 7–14. (In Chinese) [Google Scholar]
- Huang, L.X.; Chen, L.J.; Hao, J.M.; Wang, D.C.; Jin, L.G. Study on the relationship between housing price and transportation accessibility in urban district of Tianjin, China. Theor. Empir. Res. Urban Manag. 2017, 12, 48–63. [Google Scholar]
- Song, Y.; Knaap, G. Quantitative Classification of Neighbourhoods: The Neighbourhoods of New Single-family Homes in the Portland Metropolitan Area. J. Urban Des. 2007, 12, 1–24. [Google Scholar] [CrossRef]
- Tillema, T.; Verhoef, E.; van Wee, B.; van Amelsfort, D. Evaluating the effects of urban congestion pricing: Geographical accessibility versus social surplus. Transp. Plan. Technol. 2011, 34, 669–689. [Google Scholar] [CrossRef]
- Wang, D.; Lu, Y.; Zhu, W.; Zhang, J. Development and application of a computer assisted walkability evaluation system at the perspective of daily community service facilities. J. Tongji Univ. (Nat. Sci.) 2015, 43, 1815–1822. (In Chinese) [Google Scholar]
- Yang, Y.; Diez-Roux, A.V. Walking Distance by Trip Purpose and Population Subgroups. Am. J. Prev. Med. 2012, 43, 11–19. [Google Scholar] [CrossRef] [PubMed]
- Hoback, A.; Anderson, S.; Dutta, U. True Walking Distance to Transit. Transp. Plan. Technol. 2008, 31, 681–692. [Google Scholar] [CrossRef]
- Ali, G.; Bashir, M.K.; Ali, H. Housing valuation of different towns using the hedonic model: A case of Faisalabad city, Pakistan. Habitat Int. 2015, 50, 240–249. [Google Scholar]
- Poudyal, N.C.; Hodges, D.G.; Merrett, C.D. A hedonic analysis of the demand for and benefits of urban recreation parks. Land Use Policy 2009, 26, 975–983. [Google Scholar] [CrossRef]
- Wen, H.; Jia, S.; Guo, X. Hedonic price analysis of urban housing: An empirical research on Hangzhou, China. J. Zhejiang Univ. Sci. 2005, 6A, 907–914. [Google Scholar] [CrossRef]
- Wu, J.; Wang, M.; Li, W.; Peng, J.; Huang, L. Impact of urban green space on residential housing prices: Case study in Shenzhen. J. Urban Plan. Dev. 2015, 141, 05014023. [Google Scholar] [CrossRef]
- Anselin, L.; Sridharan, S. Using Exploratory Spatial Data Analysis to Leverage Social Indicator Databases: The Discovery of Interesting Patterns. Soc. Indic. Res. 2007, 82, 287–309. [Google Scholar] [CrossRef]
- Wang, Y.; Wang, S.; Li, G.; Zhang, H.; Jin, L.; Su, Y.; Wu, K. Identifying the determinants of housing prices in China using spatial regression and the geographical detector technique. Appl. Geogr. 2017, 79, 26–36. [Google Scholar] [CrossRef]
- Deng, Y.; Xu, H. International Direct Investment and Transboundary Pollution: An Empirical Analysis of Complex Networks. Sustainability 2015, 7, 3933–3957. [Google Scholar] [CrossRef]
- Maoh, H.; Kanaroglou, P.; Scott, D.; Paez, A.; Newbold, B. IMPACT: An integrated GIS-based model for simulating the consequences of demographic changes and population ageing on transportation. Comput. Environ. Urban Syst. 2009, 33, 200–210. [Google Scholar] [CrossRef]
© 2018 by the authors. Licensee MDPI, Basel, Switzerland. This article is an open access article distributed under the terms and conditions of the Creative Commons Attribution (CC BY) license (http://creativecommons.org/licenses/by/4.0/).