Article

How Physical Environment Impacts Visitors’ Behavior in Learning-Based Tourism—The Example of Technology Museum

1
Department of Architecture, National Cheng Kung University, No. 1, University Road, Tainan City 70101, Taiwan
2
Department of Communications Management, Shih Hsin University, No. 17, Lane 1, Sec. 1 Mu Cha Rd., Taipei 11641, China
*
Author to whom correspondence should be addressed.
Sustainability 2018, 10(11), 3880; https://doi.org/10.3390/su10113880
Submission received: 24 September 2018 / Revised: 21 October 2018 / Accepted: 21 October 2018 / Published: 25 October 2018
(This article belongs to the Special Issue Sustainable Directions in Tourism)

Abstract

:
Visiting a museum is a popular activity in the tourism industry, especially in cultural and learning-based tourism. To help plan museums effectively, this study investigated the underlying motivations and constraints and their impact on the perceived physical environment and visitor satisfaction toward a museum. The results suggest that the physical environment of museums serves as an axial mediator among motivations, constraints and visitor satisfaction. Six essential factors of physical environment are affected by motivations and constraints, further affecting visitor satisfaction in various patterns, in which architectural planning, exhibition, external environment, and entrance are clearly affected by basic motivations and constraints. Under motivations, family education and self-development are the most two profound influences on enhancing visitor satisfaction through the physical environment. Shops and café are worth special attention in meeting motivation of attractiveness, occasion and social interaction. The results could support the planning and design of a satisfactory museum.

Graphical Abstract

1. Introduction

In recent years, the role of the modern museum has transformed from the traditional functions of collection, exhibition and research into an emphasis on leisure, education, aesthetic experiences and entertainment [1,2,3]. On the other hand, a museum may have something different to offer from other leisure and tourism products, through unique features such as outdoor exhibitions or cultural learning experiences [4]. Economic, cultural and social demands also push museums to deal with the issues of visitor experience and profitability [3]. To create a pleasant museum experience, museum planners and managers must pay considerable attention to visitor satisfaction and service quality [5]. The latter has always been regarded as key to gaining a competitive edge in the service industry [6]. However, it is impractical to use the conventional generic assessment scale for service quality to evaluate individual satisfaction and quality of physical environment in a modern museum [7].
As museum managers tackle challenges emerging from limited resources and budget, they have to develop effective strategies to improve the museum’s performance and visitor satisfaction in order to compete with other museums and leisure activities [8]. Tourists’ choice of destination is driven by a variety of factors, such as the potential to learn, the diversity of facilities, the aesthetic experience, and the quality of environment [9]. Hence, to improve the museum services, it is important to understand the market responses [1,2,10,11], namely, what affects visitors’ decision to visit or not and how they evaluate the services delivered by the museum. Visitors’ interest (e.g., motivation and perception) as well as the information provided by the museum (e.g., collection, exhibition and events) are key topics in the performance of a museum [12].
With this background, this study set out to meet three objectives: (1) identify the motivations and constraints that influence the decision to visit a museum; (2) suggest a demand-based list of physical environment which affect visitor satisfaction; and (3) construct a causal relationship among visitors’ interests, physical environment, and visitor satisfaction as a whole.

2. Literature Review

2.1. Motivations to Visit a Museum

Understanding the motivation behind museum visits is essential for the planning, promotion, and pricing of the attractions [13]. Motivation has been characterized as a goal- and value-driven behavior, which can be grounded in biology, or a complex interaction with external stimuli that trigger various individual activities to accomplish a specific goal [14,15]. Derived from different orientations of human psychology theory, two distinct types of motivations have been identified to determine an individual’s cognitive and affective responses, namely intrinsic and extrinsic motivations [16,17]. The former involves one’s internal feelings, such as feeling interested or enjoyable, while the latter involves external incentives and interactions. Similar to intrinsic and extrinsic motivations, another taxonomy applied to travel choices is push and pull motivations [18,19,20,21]. Push motivations are driven by personal and internal psychological forces such as emotion and cognition, while pull motivations are associated with the features of the destination choices [21]. Previous studies indicate that motivations that drive visitors to museums include education, leisure, friends, work, physical facilities, and escapism [22,23,24,25], within which visitors seek to satisfy not only one objective but a variety of leisure incentives [26]. To regular visitors, experiencing the entire museum environment is more appealing than the collections within the museum [27]. Here, motivation is guided by neither internal nor external forces and is mostly self-oriented. Widely-used scales for quality of service may exclude some critical factors that also influence one’s choice of destination, such as the reputation of attractions, perceived entertainment, and the cultural experience [28].
Researchers have not reached a consensus on how to classify the motivations to visit a formal or informal place [29,30,31], but they continue in the efforts to understand the reasons behind an individual’s decision on whether to visit a museum [32].

2.2. Constraints to Visiting a Museum

From the socio-psychological perspective, motivations can be divided into factors of seeking and avoidance [33]. Hence, it is also essential to pay attention to the negative aspect of human psychology. Constraints, as opposed to motivations, hinder people’s decision to visit a place, and have been the subject of another stream of research [34,35,36,37,38,39] which explores intrapersonal (lack of interest), interpersonal (lack of company) and structural factors (lack of time, high cost, crowding, dissatisfaction with or unattractiveness of the destination environment) [40,41,42]. Among them, intrapersonal and structural constraints affect visitors’ intention significantly, while interpersonal ones do not [41].
Constraints are not necessarily barriers to leisure participation because people negotiate them [43,44,45,46] using various strategies [47,48]. Self-efficacy [49], social capital and motivation are factors affecting the negotiation and relative strategies [50].
Constraints that influence people’s decision to visit a museum may comprise psychological and situational factors, as well as those attributed to the museum itself. Factors such as individual psychological status, preference, socioeconomic status, and interpersonal relationship are not dictated or controlled by the museum environment or staff. Other factors, such as promotion, image of the museum, the quality of service, and physical facilities can be manipulated and controlled by the museum, which should have been addressed through planning or management to reduce constraints during the visitors’ museum experience. Although much research has been dedicated to the investigation of leisure constraints, few studies concurrently probe the effect of leisure constraints and motivation factors. To obtain a holistic view of the human decision-making process, researchers should not eliminate the constraining factors as determinants of human behavior.

2.3. Museum Physical Environment (PhE) and Service Quality

Physical environment (PhE) of a museum have not been widely discussed in marketing research. Researchers initially defined and identified the distinct features of service quality [51,52], followed by either verifying the measurement of service quality [52,53,54,55,56,57] or extending its relationship with antecedent and subsequent constructs, such as motivation [18,19,21,58,59], value [54,60,61,62], and satisfaction [63,64,65,66,67].
In marketing practice, service quality has been affirmed as an influencing factor to customers’ evaluation and intention to maintain a relationship with business vendors [68]. Through the attainment of customer satisfaction and repeat purchase, companies obtain sustainable advantages over their competitors [51]. Zeithaml [62] defined perceived quality as “the consumer’s judgment about a product’s overall excellence or superiority.” Researchers argue service quality is largely dependent upon the cognitive gap between expected and perceived performance [69]. The measurement of service quality is thus assessed by the difference between the two and mostly relies on customers’ subjective and cognitive judgment [70]. Service quality is also evaluated by the level of service fulfillment between customers’ expectation and perceived service delivery [71].
Due to difficulties in obtaining objective data on the standard of service and making a comparison between expectation and performance at the same time, most studies apply perceived service quality as the major determinants of behavioral consequences in their frameworks [72,73]. Referring to Swan and Combs’s performance-based model [74], people may perceive both technical quality and functional quality during the delivery of service and consequently form an overall evaluation of service quality [72]. Besides, using only a performance scale to measure the construct of service quality yielded better analytical results than a comparative measurement of expectation versus perceived performance [55]. In studying leisure and tourism, researchers argue it is not precise enough to rely on only service quality scales [52] to study individual perception of service quality. Instead, it is necessary to evaluate the overall experience [7,73,75,76,77]. Acknowledging inconsistent results from different service quality measures, researchers engaged in leisure and tourism studies are inclined to develop their own quality constructs based on perception of service features and emotional experiences [75].
Physical environment (PhE) can be a constraint as well as an attraction for visitors. Hence, to better predict visitors’ decision on whether to visit a museum, the service quality of the museum in this study is measured by using visitors’ evaluation and perception of the quality of a museum’s PhE. To probe the service factors of a museum, the construct “physical environment (PhE)” herein is defined as the service functions embedded in the museum’s facilities, including both internal/external environment and information/exhibition, which can be perceived and evaluated by visitors.

2.4. Visitor Satisfaction

Cardozo [78] first introduced the concept of customer satisfaction into marketing research and concluded high customer satisfaction increases people’s purchase intention, possibly extending it to other similar products or contributing to enhanced reputation through word-of-mouth. Consequently, marketing researchers have devoted efforts to formulate definitions of customer satisfaction [70,79,80,81].
Satisfaction may be represented by different models, such as individual psychological expectation-disconfirmation [82] (CS/D), expectation-desire congruency [83], equity [84], norm [85], and performance [86]. Satisfaction can be generally divided into feature satisfaction and information satisfaction [66]. Feature satisfaction refers to the consumer’s subjective judgment based on the performance of the product features [87]. Information satisfaction, on the other hand, refers to the consumer’s subjective judgment of information in choosing a product, which is outside the focus of this study.
Customer satisfaction can be established through a series of customer evaluations and comparison between their expectation and perceived performance in their use of a product or service. The service quality can be perceived differently based on the quality of product features or psychological outcome. Leisure satisfaction can be measured by how well leisure activities are perceived to fulfill the basic needs and motives that stimulated the desire to participate in an activity [76]. In the museum context, satisfaction can be evaluated via a visitor’s experience in and perception of the museum environment within a certain period, e.g., during the museum visit. Museum visitors perceiving high quality and full satisfaction with the physical environment are more likely to recommend the museum to their friends or disseminate favorable comments to others [28]. Based on these notions, customers’ satisfaction in museum services should be derived from their experience of a museum’s facilities, functional services, and surroundings. Hence, the study concentrates on visitors’ satisfaction with the performance of physical environment.

2.5. Links between Motivation, Constraint, Physical Environment, and Visitor Satisfaction

In the research of service marketing, especially in tourism, customer satisfaction is critical to both business practice and academic interest. Researchers have agreed visitor satisfaction is affected by his or her motivations [88]. Established motivations include seeking variety from the daily routine, recreational opportunities, and leisure experiences [88]. Tourists may share similar patterns of motivation and satisfaction, such as knowledge seeking, social interaction, and escape [89]. Such similarity between motivation and satisfaction may lead to high overall satisfaction [21,90]. Contrary to motivations, visit constraints have not been a major focus of investigation in marketing and management studies [32]. As a negative influence on the willingness to visit a museum, we can expect constraints to influence satisfaction negatively. A combination of various determinants of visitor satisfaction, including motivations and constraints, works together to influence the decision to visit a destination. Aside from museums, prior research on other destinations has also favored an approach that combines motivations and constraints because it provides a holistic view of individual decisions [91]. However, the causal relationship between the role of physical environment, motivations, constraints and satisfaction have been rarely explored. While past discussions focus on the linear relationship between service quality and individual satisfaction, the objective of this study was to delineate multiple factors of motivations, constraints and physical environment that influence one’s satisfaction after a museum visit.

2.6. The Hypothetical Model

Previous studies reveal individual satisfaction is affected by one’s motivations [21,88,89] and is mediated by performance-based service quality [65,66,67,72,75,92]. Researchers have focused on either verifying the causal relationship between service quality and customer satisfaction or confirming the link between individual motivations and satisfaction. Little has been done that postulates a causal relationship between individual motivations, constraints, facility features and satisfaction in a museum context. In this study, motivations and constraints are hypothesized to influence visitor satisfaction in their visit as mediated through their perception of the museum physical environment (Figure 1).

3. Methods

3.1. Design of Questionnaire

A survey questionnaire was used as the instrument of study. The questions were designed based on literature review and were pre-tested to ensure satisfactory content validity [93]. The questionnaire comprised four sections, each measuring one of the four study constructs. All constructs were measured on a five-point Likert scale ranging from strongly disagree (=1) to strongly agree (=5). Demographic variables, i.e., age, gender, education, income, and marital status, were also investigated at the end of the questionnaire.

3.2. Measurement of the Study Constructs

Visitors’ motivations were examined as factors that drive individuals’ decision to visit a museum, with five sub-constructs: learning, leisure/entertainment, environment, social interaction, and promotion [23,94]; there is a total of 24 items (Appendix A, A1–A24). Constraints, on the other hand, were treated as negative influences that hinder individuals’ decision to visit a museum. The constraints comprise 21 items (Appendix A, B1–B21).
For the assessment of physical environment (PhE), we developed a questionnaire to evaluate people’s perception and experience in a museum context, done by synthesizing characteristics from previous studies and common planning features (e.g., a museum’s image, open space, environment, displays, activities and service facilities). Thirty-four items were utilized to measure the PhE of a museum (Appendix A, C1–C34).
Positive recommendation and revisit intention are considered as behavioral responses of visitor satisfaction. For satisfaction measurement, this study rated visitors’ attitudinal and behavioral responses by overall perception of their experience encounters during the time spent within the museum environment. The intention to revisit is another behavioral response that is commonly used in leisure and tourism studies to describe a visitor’s psychological commitment to and preference for a place (or product) [21]. This study measured visitor satisfaction with three items, i.e., overall satisfaction with the museum, possibility of a re-visit, and intention to recommend the museum to friends or acquaintances (Appendix A, D1–D3).

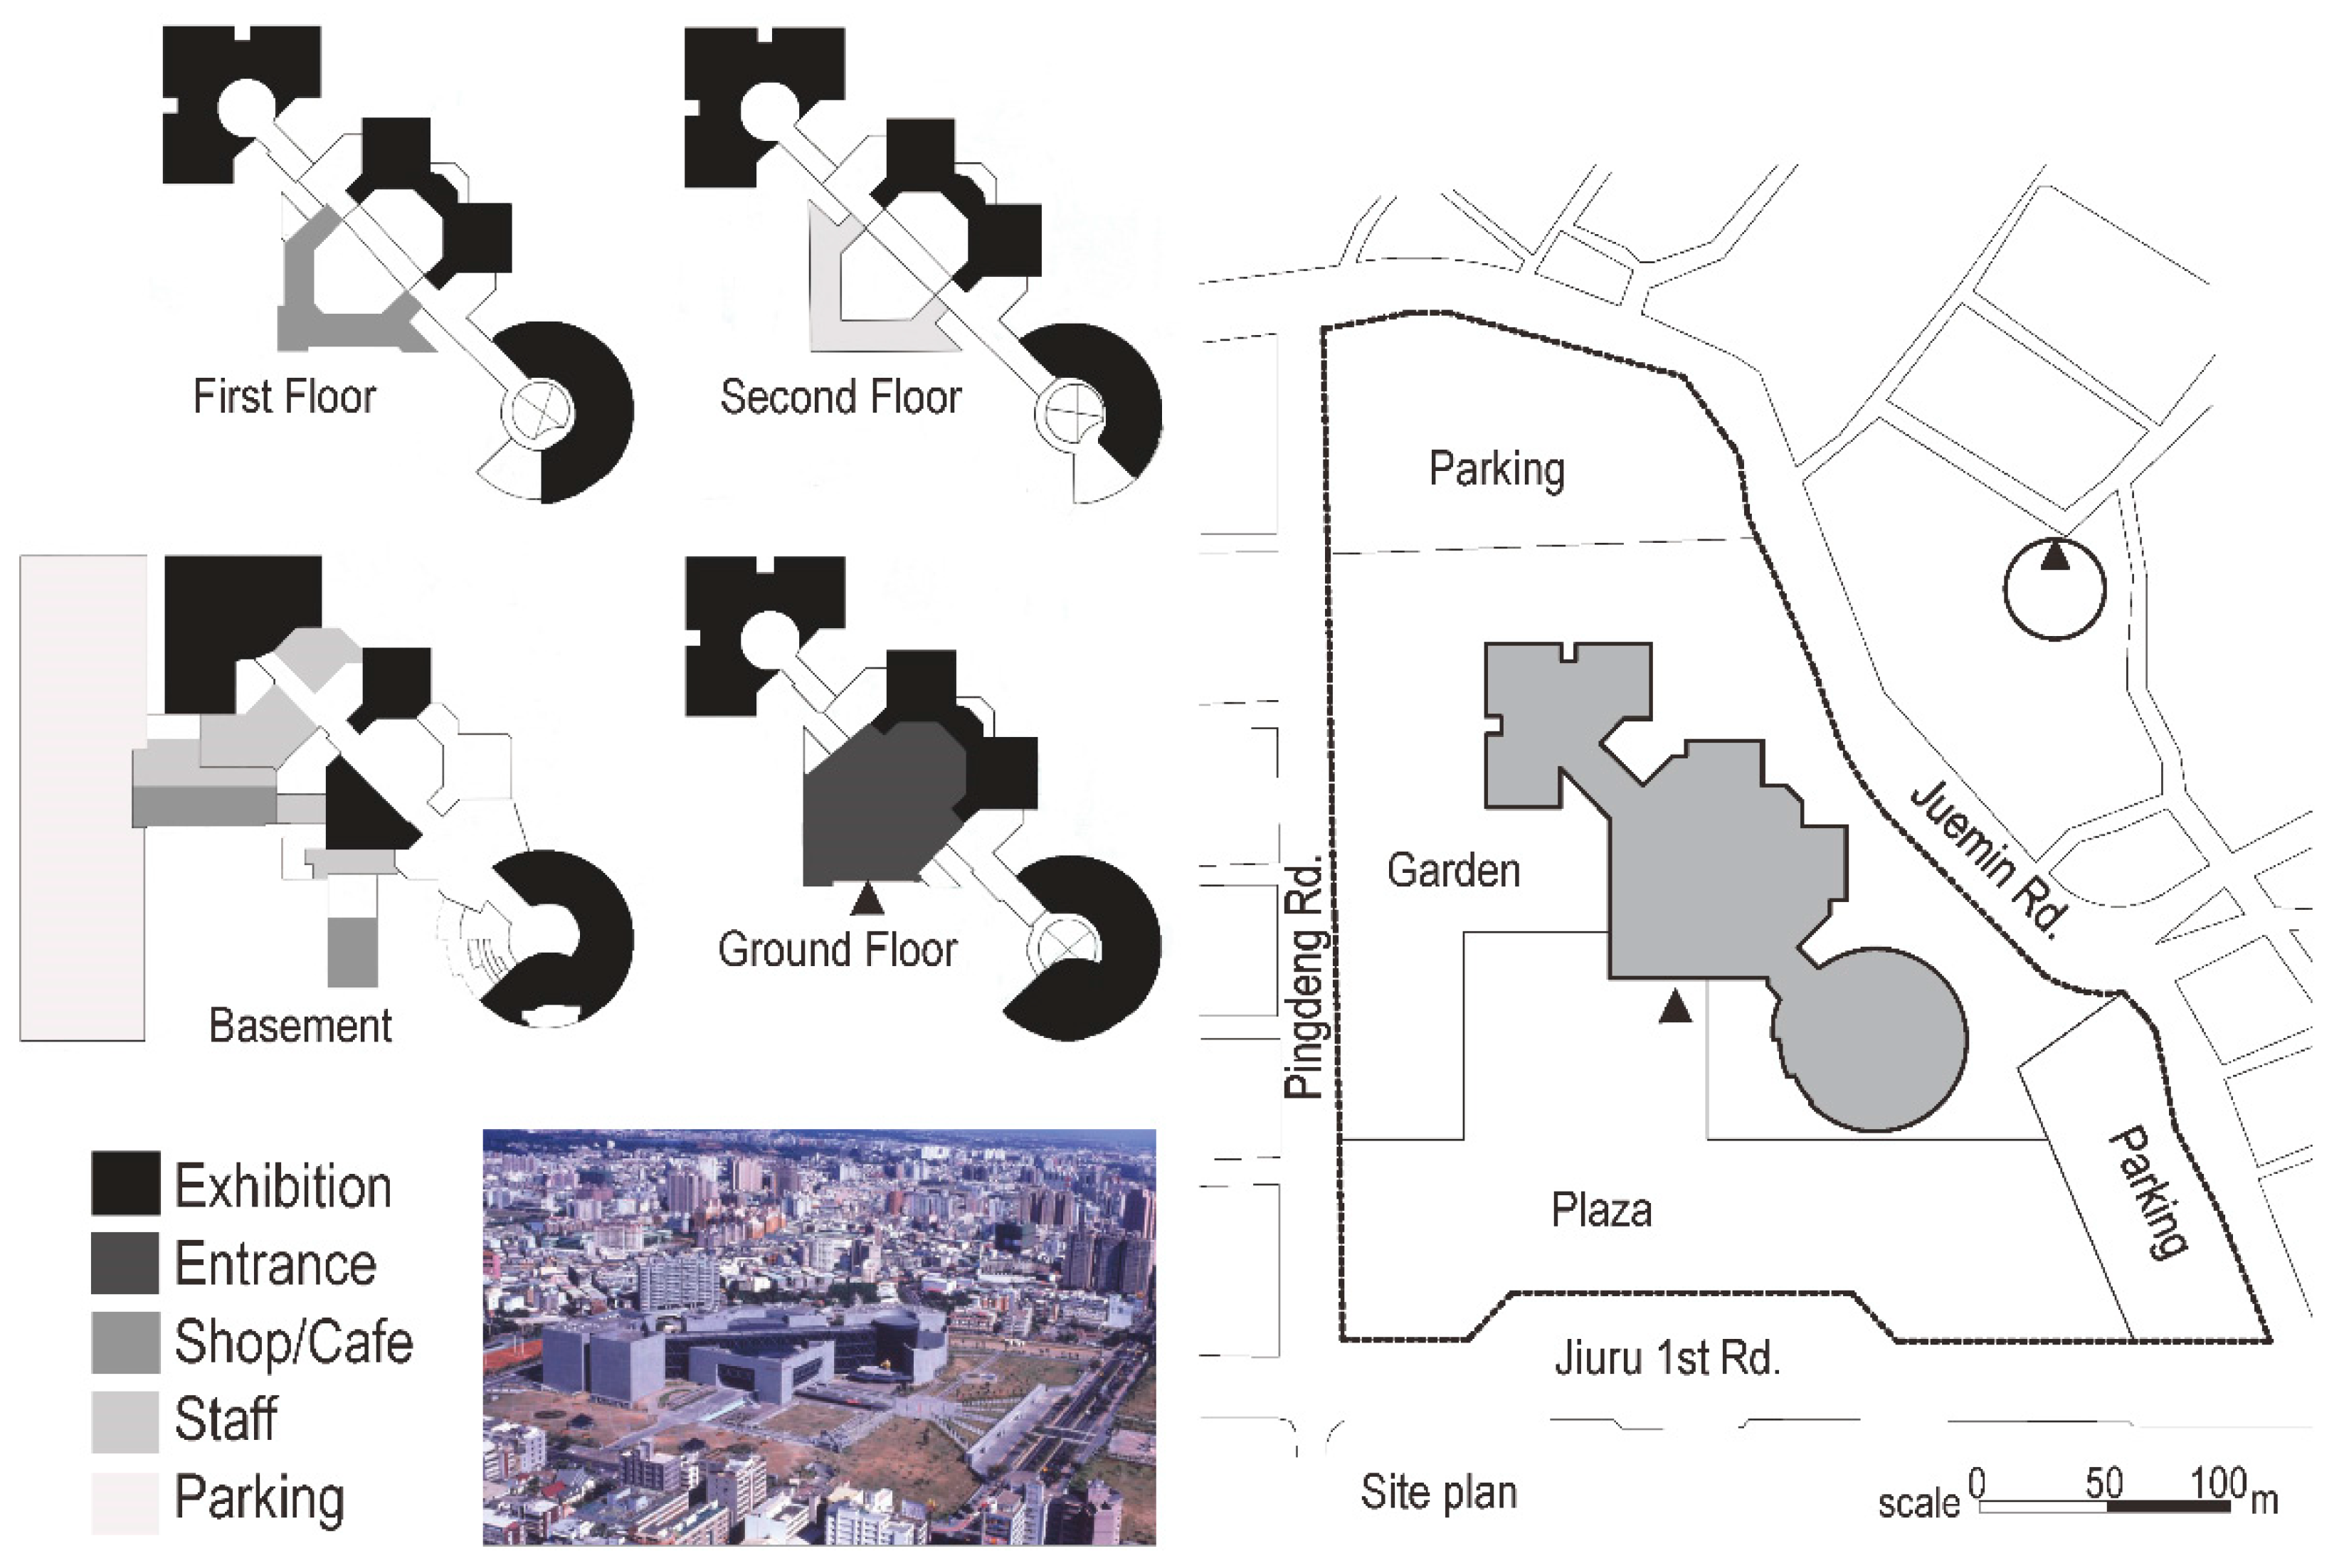
3.3. Survey Site and the Survey

The survey was conducted on the National Science and Technology Museum (NSTM) in Kaohsiung, Taiwan. Opened in 1997 and employing 133 staffs, the museum has a total floor area of 20,756 m2 and a site area of 19.16 ha. It contains 18 permanents and 3 special exhibitions (Figure 2). Kaohsiung is a major industrial city in Taiwan, and NSTM is the first museum of applied science in Taiwan. Unlike most museums of art or history, the aim of NSTM is on industrial development and daily applications of science and technology. The exhibition is tailored closely to people’s lives. This study covers the whole of the museum’s environment and facilities as well as services given by all staff members.
NSTM visitors were recruited for the survey. Data were collected through questionnaires conducted in the museum lobby while visitors complete their visits. Trained investigators explained to the participants the objective of the study, and the participants completed the questionnaire on a self-report basis. The investigators stayed in the lobby and responded to questions from the participants if they had any. When the questionnaire was completed, the participants would receive a small souvenir as requital for their participation. It took six days, which were mostly Saturdays or Sundays, to complete the survey. The questionnaires were distributed between 10:00 and 16:00 while the museum was open. To explore visitor behaviors, which are closer to actual tourism comparing to that of young pupils obligated to visit the museum for their homework, visitors younger than 15 were excluded from the survey, and 405 questionnaires were collected.

3.4. Analytical Process

Exploratory factor analysis (EFA) was used to identify the underlying factors of motivations, constraints, and the physical environment (PhE). Before EFA, item analysis was performed to raise the consistency and stability between multiple items of each construct. Barlett’s test of sphericity and the Kaiser-Meyer-Olkin (KMO) measure of sampling adequacy were employed to determine the fitness of the factor analysis. Cronbach’s alpha values were calculated to determine the reliability of each identified factor [95]. Factor analysis contributes to an understanding of the underlying latent construct and has been favored by researchers who wish to classify a mix of research items into groups of influential factors [21,32,96,97,98].
After EFA, the properties of the four research constructs—motivations, constraints, PhE and visitor satisfaction—were examined using structural equation modeling (SEM) [99] together with a two-stage testing process [100]. The validity of the measurement models was first tested to determine how measured variables logically and systematically represent the four constructs involved in the proposed model [95]. Then, a series of structural equation modeling (SEM) tests were run to estimate the structural model [95].
Finally, multiple regression was conducted to find the motivated and constrained determinants of perceived PhE for each factor extracted by EFA.

4. Results and Discussion

4.1. Sample Profile

In total, 405 questionnaires were distributed at the information desk of the museum. Forty-four responses were incomplete (e.g., over 1/3 of the questions unanswered or the same answers repeated in an entire section) and were excluded from the sample data. The final sample contained 361 questionnaires on which data analysis was conducted.
The demographic results of the survey indicate slightly more female visitors than male. Most of the visitors were between the age of 20 and 44 (72.5%) and have a college degree (61.7%); students accounted for a large proportion (Table 1).

4.2. Sample Profile

Both Kaiser–Meyer–Olkin measure of sampling adequacy (>0.8) and Bartlett Test of Sphericity (p < 0.05) were used to assess whether the sample data were appropriate for conducting factor analysis. The results show motivations, constraints, and PhEs satisfy the assumptions in the factor analysis. Factors were extracted if their eigenvalues (or latent roots) were larger than 1. Rotated items with low communality (factor loading < 0.40) or cross-loaded items were excluded. Finally, the factor structure for three constructs were confirmed and labeled (Appendix B, Table 2). Note that factor analysis was not performed for the construct “satisfaction” because it only has three items.
This study extracted five factors from motivations to visit a museum, in which “self-development” (Mo1) is the strongest. Among them, “self-development” (Mo1), “occasion and social interaction” (Mo2), and “family education” (Mo4) are intrinsic, and “leisure and companionship” (Mo3) and “attractiveness or obligation” (Mo5) are extrinsic. “Leisure and companionship” (Mo3) and “occasion and social interaction” (Mo2) were established as motivations to visit a museum, which is consistent with prior research [10,94]. In recent years, the managerial philosophy of museums has undergone major changes, evolving from a historical role of collection and research into a competition for visitor attendance [5]. Visitors find it important to have a setting that makes them feel comfortable and at ease when deciding if a museum is where they want to spend their leisure time [101]. A museum’s attractiveness (Mo5), such as its architecture and admission cost, was also found to be an effective motivation for visiting and crucial in meeting visitors’ needs.
This study draws three factors from constraints which hinder people’s willingness to visit the museum. All of them are structural constraints rather than personal or intrapersonal [35]. This suggests structural constraints are reasons hindering museum visits. Contrary to motivation, constraints toward visiting a museum are more extrinsic, while motivation to visit a museum is more intrinsic. What is noteworthy is “poor images of the museum” (Con1), rather than “unappealing soft content” (Con2), is the strongest factor hindering museum visits. That indicates the importance of the images in a museum. Another effective constraint to visiting a museum found in this study was “unattractive service and cost” (Con3), consisting of both admission charges and psychological efforts [102]. In line with prior assumptions, visitors weigh costs against the learning and recreational value they receive from the environment of a museum and the visit in general, and this assessment ultimately affects their level of satisfaction [103,104].
The study further suggests physical environment (PhE) possesses six main factors which affect visitors’ satisfaction: “architectural planning” (PhE1), “exhibition and marketing” (PhE2), “external environment and accessibility” (PhE3), “entrance and ticketing” (PhE4), “site planning” (PhE5), and “shop and café” (PhE6). It is to be noted that “shop and café” (PhE6) stands for one of the crucial elements for visiting museum, and therefore it is extracted as an independent factor.

4.3. Structural Model of Proposed Visiting Behavior

After confirming the interrelationship between the observed indicators, a confirmatory factor analysis (CFA) was conducted to evaluate the reliability and validity, and the relationship between the research constructs was redefined before the measurement and structural equation models were examined [100]. The reliability of the construct, which captures the degree to which a set of measures indicate the common latent construct, was tested by using the method proposed by Fornell and Larcker [105]. With CFA, the average variance extracted (AVE) of each construct (i.e., motivations, constraints, physical environment and satisfaction) was examined. The convergent validity is acceptable with the motivation value slightly under 0.50 [106], and the composite reliability (CR) for the four constructs are well within acceptable values for the criterion of reliability (>0.70) [107,108] (Table 3). The discriminant validity was also tested by comparing the average of variance extracted (AVE) and squared correlation (χ2) among the constructs. The results show no correlation is larger than the average of variance, which confirms the discriminant validity [105] of the three constructs is also satisfactory (Table 4). After verifying different validity and reliability criteria, the construct validity for applying the research instrument in this study is determined acceptable.
The measurement model consists of two exogenous variables (i.e., motivations and constraints) and two endogenous variables (i.e., physical environment and visitor satisfaction). The proposed model revealed an acceptable data fit (χ2 = 267.434, df = 113, χ2/df = 2.367, CFI = 0.940, IFI = 0.940, NFI = 0.901, GFI = 0.910, RMSEA = 0.066), indicating the proposed model adequately explains the empirical relationship between the study variables. Though χ2 is significant, which is sensitive to the sample size, the fit is deemed acceptable as χ2/df is less than 3 [109], and incremental indices (over 0.90. RMSEA ranging from 0.6 to 0.8) also indicate the model fits the data well [110].
The goodness-of-fit was assessed to evaluate the validity of the structural model [95] The indices demonstrate a good fit for the structural model (χ2 = 267.54 with 114 degrees of freedom, CMIN/DF (CN; χ2/df) = 2.347. GFI = 0.909, AGFI = 0.879, RMR = 0.030, RMSEA = 0.065, NFI = 0.901, IFI = 0.941, CFI = 0.940, PNFI = 0.75, PNFI = 0.755). The path analysis of the structural model shows the relationship between visitors’ motivations and constraints was insignificant (r = −0.12 and p = 0.088). This result is reasonable as the two are counter but independent effects in determining visitors’ experience and response. The causal link between determinants and physical environment is moderately strong and significant. The path coefficients from motivations and constraints to perceived quality of physical environment (PhEs) are 0.41 (t = 5.54, p < 0.000) and −0.21, respectively (t = −3.38, p < 0.000) (Figure 3). Therefore, the motivation effect is shown to overpower the constraint effect in determining the perception of physical environment after a visit. Furthermore, the path coefficient between PhEs and visitor satisfaction is 0.51 (t = 6.79, p < 0.000). Motivations also appear to have a direct effect on satisfaction with an impact of 0.16 (t = 2.39, p = 0.017), and an indirect effect of 0.21 through physical environment (Table 5). The two determinants, motivations and constraints, explain 23.1% variance in quality of physical environment and the three constructs explain 35.3% variance in visitor satisfaction.
This study posits a structural model in which motivations and constraints have a mediating effect on visitor satisfaction through physical environment (PhE). The PhE partially mediate the path from motivations to satisfaction, in which the direct effect of motivations on satisfaction is 0.16 and the indirect effect mediated through PhE is 0.21, which is actually stronger than the direct one (Table 5). Therefore, the path mediated by physical environment may be deemed more important than the direct one.
The strong effect size of physical environment on visitor satisfaction (Table 5 and Figure 4) is consistent with previous theoretical results in which service quality is shown to be a vital determinant of individual satisfaction [21,28,66,67,111]. This result highlights the influence of physical environment on satisfaction. An individual’s perception of a museum is derived from the evaluation of how well it performs on its various physical environment, such as exhibition environment, exhibition format, staff service and transportation, while the high level of satisfaction expressed by visitors who think the museum performed well in the quality of its physical environment confirms the theoretical assumption that the physical environment positively influence visitors’ attitudinal and behavioral responses. The strength of the two explained variances in the model is also noteworthy. Motivations and constraints explain as high as 23.1% variance in the quality of physical environment, indicating careful consideration should be given to visitors’ motivations and constraints in planning or managing a museum. As for visitor satisfaction, motivations, constraints and physical environment, they explain 35.3% of its variance. That is to say, over one third of visitor satisfaction can be achieved by paying more attention to motivations, constraint, and physical environment. In addition, though the effect of motivations on satisfaction is less than physical environment on satisfaction (0.51), motivations still have a relatively strong total effect (0.37) due to its compounded direct and indirect effects. Thus, to satisfy visitors, motivations of visit is another criterion to be considered besides physical environment. Compared to motivations, constraints have less effect on visitor satisfaction, and its influence is indirect. These results may fill the void in prior studies that are either dedicated to reveal the relationship between motivations and individual satisfaction [20,21,58] or verifying the relationship between service quality and individual satisfaction [66,112].

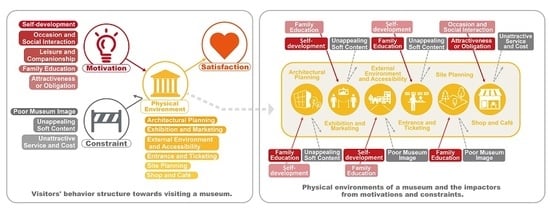
4.4. Impacts of Motivation and Constraint on the Planning of Museum Physical Environment

To obtain the determinants of quality cognition towards a museum’s physical environment, five factors in visiting motivations and three in visiting constraints were included and their relationships with six planning and management factors of physical environment for museum were tested. Multiple regression analysis with stepwise approach was conducted to select the most influential set of indicators in each factor of physical environment (Table 6) to generate appropriate planning and managing strategies.
In motivations, “self-development” (Mo1) is conceived to be a fundamental factor that motivates people to visit a museum [22,30]. In this study, self-development is related to four of the six factors of PhE in a museum, including “exhibition and marketing” (PhE2)”, “architectural planning” (PhE1), “External environment and accessibility” (PhE3), and “entrance and ticketing” (PhE4), at different strengths. “Family education” (Mo4) performed as the most profound motivation rather than self-development in relationship with the physical environment of a science museum. In the six factors of physical environment, family education affects five planning factors, even more than self-development does. Consequently, museum planners or managers should pay extra attention to family education functions in planning or running a modern museum. Visitors motivated by family education were also found to cherish the educational and leisure value offered by the whole site of the museum, i.e., both interiors of the museum building and its outdoor areas.
In contrast with motivations, constraints hinder people from visiting a museum and should be cautiously avoided. The results show “Unappealing Soft Content” (Con2), which is connected with three of the physical environment factors, PhE1, PhE2, and PhE4, is the most influential constraint among the three towards perception of the physical environment. This is consistent with the previous study, which suggested that the quality of exhibition is vital to the decision of visiting a museum or not [101]. “Poor Museum Image” (Con1) is found to be a major constraint that keeps people from visiting, and its impact is concentrated in the external environment, i.e., PhE3 and PhE5. External environment is found to be especially sensitive to “poor image of the museum” (Con1). Planners and managers should make more efforts on the external environment when they intend to improve the museum image.
The study results yield some interesting patterns. The “architectural planning” (PhE1), “exhibition and marketing” (PhE2), and entrance and ticketing (PhE4) of a museum share the same determinants, namely “self-development” (Mo1), “unappealing soft content” (Con2), and “family education” (Mo4). The findings indicate self-development (Mo1), family education (Mo4), and soft content (Con2) are the basic determinants of museum physical environment. This pattern of visitor behavior is consistent with the main goal of a modern museum, which is to provide new knowledge, family education and an enjoyable experience to visitors. Other factors of physical environment show, in contrast, a heterogeneous pattern in their determinants. Site planning (PhE5) of a museum is affected by “family education” (Mo4) and hindered by “poor museum image” (Con1). In addition, the museum shop and café (PhE6), as ancillary services, reveals a distinct pattern compared to other physical environments. Visitors’ drive from “attractiveness or obligation” (Mo5), “occasion and social interaction” (Mo2), and halt from “unattractive service and cost” (Con3) are critical to the evaluation of shops and café. Although “leisure and companionship” (Mo3) is one of the main motivations to visit the museum, it affects none of the planning features of the museum. This motivational demand can be satisfied when others are also satisfied.

5. Implications and Limitation

5.1. Practical Implications

Compared to other tourist attractions, visitors to a museum are seeking a dynamic and unique experience. They come with different experiences and expectations, such as seeking new information or acquiring enjoyable, aesthetic and recreational experiences. Some motivation, such as family education, being with others, and cost, are listed as benefits of visiting a museum versus other tourist destinations [101]. The findings of this study show family education (Mo4) and self-development (Mo1) influence visitors’ perception towards physical environment of museum most profoundly. Hence, museum planners and managers should incorporate suitable physical environment and corresponding activities to serve the two motivations.
The findings about constraints also identify certain factors that may improve museum services when avoided. “Unappealing soft content” (Con2) and “poor images of the museum” (Con1) are shown to be constraints to visitors. In addition, “unattractive service and cost” (Con3), including monetary as well as psychological and physical, were perceived as constraints which could impede a visit. Hence, it is suggested that characteristics contrary to the constraints should be introduced to bring intriguing, novel, exciting and enjoyable experiences to visitors to repair the hindrance. A museum should increase the opportunities for visitors to physically interact through its exhibition content and format (e.g., using hands-on workshops or interactive technology). A well-designed physical environment both inside and around the museum buildings may reduce visitor dissatisfaction. Enhancing the museum’s general services and providing a flexible admission rate, such as discount for special events or rates varying according to age, visit timing, and frequency, could prove effective in encouraging attendance.
This study identifies six factors of physical environment that impact visitor satisfaction and deserve extra attention from museum managers and planners: Architectural Planning, Exhibition and Marketing, External Environment and Accessibility, Entrance and Ticketing, Site Planning, and Shop and Café. This examination of motivation and constraint as determinants of physical environment reveals distinct patterns, which equip planners and managers with tools to more precisely define the physical environment of a museum. The inherent planning issues of a museum, such as “architectural planning” (PhE1), “exhibition and marketing” (PhE2), as well as “entrance and ticketing” (PhE4) are related to motivations “self-development” (Mo1), “family education” (Mo4) and constraint “unappealing soft content” (Con2). While organizing these three factors of physical environment, planners and managers should pay extra attention to the functions of self-development (Mo1) and family education (Mo4) while specifically avoiding weak exhibition content (Con2).
Besides the interiors, the external environment of the museum is also found to have a significant impact on visitor satisfaction. Traditionally, planners and managers pay the most attention to the collection and visual elements of exhibitions and seldom note functions facilitating recreation and social interaction may also attract visitors. According to the study, the external environment of a museum should be designed specifically for family education (Mo4) and self-development (Mo1) while also emphasizing leisure functions. Enhanced external display areas in a natural environment can add to the museum experience. Facilitating walking and relaxing on the museum site and adding family-related facilities (e.g., family toilets and nursing room) will also be appreciated.
Additional services offered by a museum, such as catering, souvenir shops, barrier-free facilities, and special staff attention to seniors, as well as a comfortable environment all help create a warm and enjoyable experience for visitors. The study shows shop and café (PhE6), which have long been neglected, have a decisive influence on visitor satisfaction as well as meeting visitors’ motivations including attractiveness and social interaction.
Research on tourism has confirmed visitor satisfaction and loyalty are two critical components of competitive sustainability in the tourism market [21]. Prior studies also confirm visitor satisfaction is vital to building customer loyalty in the service industry [1,3,10,11]. Those who visit the same museum over and over again are inclined to have high intention to revisit and are more likely to spread positive words to others. The study found the physical environment of a museum has an effective influence on visitor satisfaction. The results inform the museum planning or management as to which physical environment helps enhance visitor satisfaction.

5.2. Limitations

This study was conducted on a group of visitors to the National Science and Technology Museum, which is located in southern Taiwan. The results might be different compared to studies conducted across different locations and different types of museums (e.g., art museums). The proposed framework herein may be applied in future research to test different contexts.
The data collected were cross-sectional and non-experimental. Although SEM analysis provides a robust method for validating the causal relationships, the results should be reported with caution. Longitudinal observation and comparison were not possible due to the constraint of time and location. Future research will benefit from the collection of longitudinal and experimental data to measure the interrelationships between the research variables and provide more precise results in validation.
Though physical environment is verified as a mediator in this study, it explains already 35.3% variance of visitor satisfaction. Other factors also considered important for satisfaction, such as perceived value, corporate image, and quality of learning, were not included in the study. Future research may include and verify more constructs and extend or refine the relationships tested in this research.

6. Conclusions

In tourism research, researchers have treated motivations and constraints as critical components of satisfaction. However, few studies incorporate constraints as inhibitors of perceived quality of physical environment and satisfaction in making a destination choice. Besides, no conceptual model has been established that explicitly examines the relationship among individuals’ motivations, constraints, perceived quality and satisfaction toward the physical environment. This study conceptualizes the four as a whole.
Five factors are identified in motivations toward visiting a museum: “self-development”, “occasion and social interaction”, “leisure and companionship”, “family education”, and “attractiveness or obligation”, in which “self-development” (Mo1) is the strongest motive to visit a museum. Three constraints tend to hinder visiting: “poor images of the museum”, “unappealing soft content”, and “unattractive services and cost”, in which “poor images of the museum” (Con1) is found to be a major constraint that keeps people from visiting. Six essential factors in physical environment are found to influence visitor satisfaction: “Architectural Planning”, “Exhibition and Marketing”, “External Environment and Accessibility”, “Entrance and Ticketing”, “Site Planning”, and “Shop and Café”.
The structural model of the study suggests that physical environment serves an axial function among motivations, constraints and satisfaction. Physical environment has a strong effect (0.51) on the satisfaction of museum visitors, and, through the mediating effect, physical environment further transfers the influences of motivations and constraints on satisfaction. Although motivations have a direct effect on satisfaction, its indirect effect (0.21) is stronger than the direct one (0.16). That is to say, physical environment mediates prevailingly between motivations and satisfaction. The impact of motivations on visitor satisfaction (total 0.37) is much more than that of constraints (−0.11). The whole model can explain 35.3% of the satisfaction of museum visitors.
In motivations, self-development (Mo1) is the strongest motive for people to visit a museum, but it does not act as the most profound factor to affect physical environment of museum. Notably, family education (Mo4) does, followed by self-development. For constraints, poor museum image (Con1), which is the strongest constraint against visiting a museum, largely influences the external environment. When combining the impacts of motivation and constraints in planning a museum, planners and managers should pay attention to providing the functions under self-development (Mo1), family education (Mo4), and contain better soft content (Con2), through which the basic demands of museum visitors can be satisfied. Leisure and companionship (Mo3) has no significant effect on the physical environment of a museum. Shop and Café (PhE6) as ancillary facilities are shown to be important to attract visitors, especially those who come for attractiveness (Mo5) and social interaction (Mo2). The study carries practical implications on museum planning or management and helps define physical environment toward achieving better visitor satisfaction.

Author Contributions

H.Z. conceived and designed the study, and wrote the paper; P.-C.C. analyzed the data and wrote the original draft; and M.-F.C. conducted the survey.

Funding

This research was funded by a grant from the Ministry of Science and Technology Taiwan with the project number: NSC100-2511-S-006-002.

Conflicts of Interest

The authors declare no conflict of interest. The funders had no role in the design of the study; in the collection, analyses, or interpretation of data; in the writing of the manuscript, and in the decision to publish the results.

Appendix A. Visitors’ Questionnaire

This survey investigates visitors’ motivation, constraint, and satisfaction toward physical environment in the National Science and Technology Museum (NSTM). Please rate each of the following statement using a scale from 1 to 5 (1 being “strongly disagree”, 5 being “strongly agree” unless otherwise noted) by placing a “√” in the corresponding box.
A. Motivation for visit
A1. Improve my quality of life
A2. Experience new things
A3. Pursuit of interest
A4. Engage in a worthy activity
A5. Release stress and relax
A6. For leisure
A7. Attractive architecture
A8. Improve parent-child relations
A9. Work or school requirement
A10. Learn something
A11. Enhance social relations with accompanying person(s)
A12. Special exhibition
A13. Admission discount
A14. Children’s leisure and education
A15. Make new friends
A16. Just passing by and decided to come in
A17. Kill time
A18. Famous destination
A19. Participate in a social activity
A20. Participate in a parent-child activity
A21. Invitation from the museum
A22. Acquire new knowledge and information
B. Constraint from visit
B1. Have bad impression about the museum
B2. Transportation to/from museum inconvenient
B3. Poor security around the museum
B4. Unsafe environment
B5. The museum environment is unclean
B6. Insufficient leisure facilities on site
B7. The museum site has too many barriers for moving around
B8. The museum site is too hot and has no tree shade or shelter for rain
B9. Must walk for a long line to enter the museum
B10. Hard to get information on museum events
B11. Opening hours not suitable for me
B12. Admission too expensive
B13. Poor restaurant service
B14. Not enough stamina for such long visit
B15. Exhibitions difficult to understand
B16. Exhibitions unappealing
B17. Not suitable for family
B18. The museum’s activities do not help me relax
B19. Does not fulfill my social need
B20. Crowded
B21. Service quality unsatisfactory
C. Cognition of physical environment
C1. Scenery on the museum site (include the surroundings)
C2. Relaxing and comfortable landscape
C3. Appealing environment
C4. Convenient transportation access
C5. Abundant parking
C6. Easy to enter the museum
C7. Bicycle parking provided
C8. The museum site offers facilities for leisure and amusement
C9. Beautiful and educational planting around the museum
C10. Easy to find the entrance
C11. Spacious and comfortable entrance
C12. Simple ticket buying procedures
C13. Reasonable admission price
C14. Clear exhibition route and signage
C15. Spacious and suitable environment for the exhibitions
C16. Comfortable air-conditioning and ventilation in the exhibition space
C17. Food service offered
C18. Souvenir shop
C19. Natural and artificial light utilized to create bright exhibition space
C20. Visual display for the exhibition
C21. Ample facilities to keep the place clean (e.g., trash bins)
C22. Clear, accurate and sufficient interpretive boards
C23. Clean and hygienic overall environment
C24. Appropriate level of security
C25. Secure indoor and outdoor spaces
C26. Guided tour easy to understand
C27. Ample information provided at the service desk
C28. Personalized service for disabled persons
C29. Information about museum easy to obtain
C30. Appropriate museum opening hours
C31. Interesting and vivid exhibition format
C32. Educational exhibition content
C33. Active promotion of activities and services
C34. Adequate resting spaces along visiting route

Appendix B. Factor Analysis of Motivation, Constraint, and Physical Environment (PhE) of a Museum

A. Motivation:
ItemMo1Mo2Mo3Mo4Mo5
Self-DevelopmentOccasion and Social InteractionLeisure and CompanionshipFamily EducationAttractiveness or Obligation
A2. Experience new things0.849
A10. Learn something0.784
A4. Engage in a worthy activity0.772
A1. Improve my quality of life0.756
A3. Pursuit of interest0.744
A22. Acquire new knowledge and information0.742
A12. Special exhibition0.660
A16. Just passing by and decided to come in 0.781
A17. Kill time 0.723
A19. Participate in a social activity 0.691
A21. Invitation from the museum 0.658
A18. Famous destination 0.610
A15. Make new friends 0.584
A5. Release stress and relax 0.757
A6. For leisure 0.753
A11. Enhance social relations with accompanying person(s) 0.739
A8. Improve parent-child relations 0.651
A14. Children’s leisure and education 0.788
A20. Participate in a parent-child activity 0.782
A13. Admission discount 0.612
A7. Attractive architecture 0.477
A9. Work or school requirement 0.437
Eigenvalue4.5523.1842.7091.6881.389
Percent of variance explained20.69214.47512.3167.6716.316
Percent of cumulative variance explained20.69235.16747.48355.15461.470
KMO measure of sample adequacy0.874
Bartlett’s test of sphericity0.000
B. Constraint:
ItemCon1Con2Con3
Poor Museum ImageUnappealing Soft ContentUnattractive Service and Cost
B4. Unsafe facility0.813
B5. The museum environment is unclean0.798
B1. Have bad impression about the museum0.776
B3. Poor security around the museum0.765
B2. Transportation to/from museum inconvenient0.711
B7. The museum site has too many barriers for moving around0.710
B8. The museum site is too hot and has no tree shade or shelter for rain0.665
B9. Must walk for a long line to enter the museum0.576
B6. Insufficient leisure facilities on site0.574
B11. Opening hours not suitable for me0.531
B10. Hard to get information on museum events0.492
B18. The museum’s activities do not help me relax 0.724
B17. Not suitable for family 0.705
B16. Exhibitions unappealing 0.705
B15. Exhibitions difficult to understand 0.621
B21. Service quality unsatisfactory 0.610
B19. Does not fulfill my social need 0.594
B20. Crowded 0.514
B13. Poor restaurant service 0.742
B14. Not enough stamina for such long visit 0.741
B12. Admission too expensive 0.656
Eigenvalue6.0184.2203.081
Percent of variance explained28.65620.09614.673
Percent of cumulative variance explained28.65648.75363.426
KMO measure of sample adequacy0.953
Bartlett’s test of sphericity0.000
C. Physical Environment:
ItemPhE1PhE2PhE3PhE4PhE5PhE6
Architectural PlanningExhibition and MarketingExternal Environment and AccessibilityEntrance and TicketingSite PlanningShop and Café
C21. Ample facilities to keep the place clean (e.g., trash bins)0.673
C20. Visual display for the exhibition0.673
C24. Appropriate level of security0.672
C16. Comfortable air-conditioning and ventilation in the exhibition space0.632
C25. Secure indoor and outdoor spaces0.626
C15. Spacious and suitable environment for the exhibitions0.618
C23. Clean and hygienic overall environment0.594
C19. Natural and artificial light utilized to create bright exhibition space0.518
C14. Clear exhibition route and signage0.509
C34. Adequate resting spaces along visiting route 0.484
C29. Information about museum easy to obtain 0.722
C28. Personalized service for disabled persons 0.700
C30. Appropriate museum opening hours 0.685
C27. Ample information provided at the service desk 0.676
C26. Guided tour easy to understand 0.667
C32. Educational exhibition content 0.660
C33. Active promotion of activities and services 0.619
C31. Interesting and vivid exhibition format 0.583
C22. Clear, accurate and sufficient interpretive boards 0.518
C2. Relaxing and comfortable landscape 0.807
C1. Scenery on the museum site (include the surroundings) 0.765
C3. Appealing environment 0.762
C5. Abundant parking 0.669
C4. Convenient transportation access 0.659
C6. Easy to enter the museum 0.632
C12. Simple ticket buying procedures 0.692
C10. Easy to find the entrance 0.683
C11. Spacious and comfortable entrance 0.679
C13. Reasonable admission price 0.592
C7. Bicycle parking provided 0.732
C8. The museum site offers facilities for leisure and amusement 0.712
C9. Beautiful and educational planting around the museum 0.654
C17. Food service offered 0.792
C18. Souvenir shop 0.697
Eigenvalue5.2495.1484.0863.0702.3771.894
Percent of variance explained15.43715.23112.0199.0286.9905.569
Percent of cumulative variance explained15.43730.66842.68751.71558.70564.274
KMO measure of sample adequacy0.942
Bartlett’s test of sphericity0.000

References

  1. Kawashima, N. Knowing the public. A review of museum marketing literature and research1. Mus. Manag. Curatorship 1998, 17, 21–39. [Google Scholar] [CrossRef]
  2. Kotler, N.; Kotler, P. Can museums be all things to all people? Missions, goals, and marketing’s role. Mus. Manag. Curatorship 2000, 18, 271–287. [Google Scholar] [CrossRef]
  3. McLean, F. Marketing in museums: A contextual analysis. Int. J. Mus. Manag. Curatorship 1993, 12, 11–27. [Google Scholar] [CrossRef]
  4. Williams, C.; Buswell, J. Service Quality in Leisure and Tourism; CABI Pub.: Wallingford, UK, 2003. [Google Scholar]
  5. Lewis, P. Museums and marketing. Museum Managagement; Routledge: London, UK, 1994; pp. 213–227. [Google Scholar]
  6. Zeithaml, V.A.; Berry, L.L.; Parasuraman, A. The behavioral consequences of service quality. J. Mark. 1996, 60, 31–46. [Google Scholar] [CrossRef]
  7. Qu, H.; Elsa Yee Ping, W. A service performance model of Hong Kong cruise travelers’ motivation factors and satisfaction. Tour. Manag. 1999, 20, 237–244. [Google Scholar] [CrossRef]
  8. Lin, Y.-N. Importance–performance analysis of the Taipei fine arts museum’s services. Mus. Manag. Curatorship 2009, 24, 105–121. [Google Scholar] [CrossRef]
  9. Augustyn, M.; Ho, S.K. Service quality and tourism. J. Travel Res. 1998, 37, 71–75. [Google Scholar] [CrossRef]
  10. Bradford, H. A new framework for museum marketing. In Museum Management; Routledge: London, UK, 1994; pp. 41–51. [Google Scholar]
  11. McLean, F. A marketing revolution in museums? J. Mark. Manag. 1995, 11, 601–616. [Google Scholar] [CrossRef]
  12. Nowacki, M.M. Evaluating a museum as a tourist product using the servqual method. Mus. Manag. Curatorship 2005, 20, 235–250. [Google Scholar] [CrossRef] [Green Version]
  13. Brida, J.G.; Meleddu, M.; Pulina, M. Understanding urban tourism attractiveness: The case of the archaeological ætzi museum in bolzano. J. Travel Res. 2012, 51, 730–741. [Google Scholar] [CrossRef]
  14. Bouder-Pailler, D. A model for measuring the goals of theatre attendance. Int. J. Arts Manag. 1999, 1, 4–15. [Google Scholar]
  15. Slater, A. ‘Escaping to the gallery’: Understanding the motivations of visitors to galleries. Int. J. Nonprofit Volunt. Sect. Mark. 2007, 12, 149–162. [Google Scholar] [CrossRef]
  16. Calder, B.J.; Staw, B.M. Self-perception of intrinsic and extrinsic motivation. J. Personal. Soc. Psychol. 1975, 31, 599–605. [Google Scholar] [CrossRef]
  17. Ryan, R.; Ryan, E.; Deci, E.L. Intrinsic and extrinsic motivations: Classic definitions and new directions. Contemp. Educ. Psychol. 2000, 25, 54–67. [Google Scholar] [CrossRef] [PubMed]
  18. Crompton, J.L. Motivations for pleasure vacation. Ann. Tour. Res. 1979, 6, 408–424. [Google Scholar] [CrossRef]
  19. Dann, G.M.S. Tourist motivation an appraisal. Ann. Tour. Res. 1981, 8, 187–219. [Google Scholar] [CrossRef]
  20. Uysal, M.; Jurowski, C. Testing the push and pull factors. Ann. Tour. Res. 1994, 21, 844–846. [Google Scholar] [CrossRef]
  21. Yoon, Y.; Uysal, M. An examination of the effects of motivation and satisfaction on destination loyalty: A structural model. Tour. Manag. 2005, 26, 45–56. [Google Scholar] [CrossRef]
  22. Brida, J.G.; Disegna, M.; Scuderi, R. Visitors of two types of museums: A segmentation study. Expert Syst. Appl. 2013, 40, 2224–2232. [Google Scholar] [CrossRef] [Green Version]
  23. Jansen-Verbeke, M.; Van Rekom, J. Scanning museum visitors: Urban tourism marketing. Ann. Tour. Res. 1996, 23, 364–375. [Google Scholar] [CrossRef]
  24. Sheng, C.-W.; Chen, M.-C. A study of experience expectations of museum visitors. Tour. Manag. 2012, 33, 53–60. [Google Scholar] [CrossRef]
  25. Thyne, M. The importance of values research for nonprofit organisations: The motivation-based values of museum visitors. Int. J. Nonprofit Volunt. Sect. Mark. 2001, 6, 116–130. [Google Scholar] [CrossRef]
  26. Falk, J. Museum audiences: A visitor-centered perspective. Soc. Leis. 2016, 39, 357–370. [Google Scholar] [CrossRef]
  27. Powell, R.; Kokkranikal, J. Motivations and experiences of museum visitors: The case of the imperial war museum, United Kingdom. In Cultural Tourism in a Digital Era; Springer: New York, NY, USA, 2015; pp. 169–181. [Google Scholar]
  28. Žabkar, V.; Brenčič, M.M.; Dmitrović, T. Modelling perceived quality, visitor satisfaction and behavioural intentions at the destination level. Tour. Manag. 2010, 31, 537–546. [Google Scholar] [CrossRef]
  29. Falk, J.H.; Dierking, L.D. The Museum Experience; Whalesback Books: Washington, DC, USA, 1992. [Google Scholar]
  30. Falk, J.H.; Dierking, L.D. Learning from Museums: Visitor Experiences and the Making of Meaning; Altamira Press: Walnut Creek, CA, USA, 2000. [Google Scholar]
  31. Graburn, N.H. Tourism: The Sacred Journey; Hosts and Guests: The Anthropology of Tourism; University of Pennsylvania Press: Philadelphia, PA, USA, 1977; pp. 21–36. [Google Scholar]
  32. Prentice, R.; Davies, A.; Beeho, A. Seeking generic motivations for visiting and not visiting museums and like cultural attractions. Mus. Manag. Curatorship 1997, 16, 45–70. [Google Scholar] [CrossRef]
  33. Iso Ahola, S.E. Toward a social psychological theory of tourism motivation: A rejoinder. Ann. Tour. Res. 1982, 9, 256–262. [Google Scholar] [CrossRef]
  34. Crawford, D.W. Reconceptualizing barriers to family leisure. Leis. Sci. 1987, 9, 119–127. [Google Scholar] [CrossRef]
  35. Crawford, D.W.; Jackson, E.L.; Godbey, G. A hierarchical model of leisure constraints. Leis. Sci. 1991, 13, 309–320. [Google Scholar] [CrossRef]
  36. Hultsman, W.Z. The influence of others as barrier to recreation participation among early adolescents. J. Leis. Res. 1993, 25, 150–164. [Google Scholar] [CrossRef]
  37. Jackson, E.L.; Crawford, D.W.; Godbey, G. Negotiation of leisure constraints. Leis. Sci. 1993, 15, 1–11. [Google Scholar] [CrossRef]
  38. Shaw, S.M. Gender, leisure, and constraint: Towards a framework for the analysis of women’s leisure. J. Leis. Res. 1994, 26, 8–22. [Google Scholar] [CrossRef]
  39. Witt, P.A. The relationships between barriers to leisure enjoyment and family stages. Leis. Sci. 1981, 4, 29–49. [Google Scholar] [CrossRef]
  40. Chick, G.; Hsu, Y.-C.; Yeh, C.-K.; Hsieh, C.-M. Leisure constraints, leisure satisfaction, life satisfaction, and self-rated health in six cities in taiwan. Leis. Sci. 2015, 37, 232–251. [Google Scholar] [CrossRef]
  41. Nuijten, M.; De Rooij, P.; Snoeckx, L. How do leisure constraints influence the revisit intentions of music festival visitors? Tour. Cult. Commun. 2016, 16, 123–135. [Google Scholar] [CrossRef]
  42. Li, J.; Smith, A.E. Block layout for attraction-based enterprises. Eur. J. Oper. Res. 2018, 266, 1100–1112. [Google Scholar] [CrossRef]
  43. Casper, J.M.; Bocarro, J.N.; Kanters, M.A.; Floyd, M.F. Measurement properties of constraints to sport participation: A psychometric examination with adolescents. Leis. Sci. 2011, 33, 127–146. [Google Scholar] [CrossRef]
  44. Hubbard, J.; Mannell, R.C. Testing competing models of the leisure constraint negotiation process in a corporate employee recreation setting. Leis. Sci. 2001, 23, 145–163. [Google Scholar] [CrossRef]
  45. McQuarrie, F.; Jackson, E.L. Connections between negotiation of leisure constraints and serious leisure: An exploratory study of adult amateur ice skaters. Soc. Leis. 1996, 19, 459–483. [Google Scholar] [CrossRef]
  46. White, D.D. A structural model of leisure constraints negotiation in outdoor recreation. Leis. Sci. 2008, 30, 342–359. [Google Scholar] [CrossRef]
  47. Chung, J.Y.; Baik, H.-J.; Lee, C.-K. The role of perceived behavioural control in the constraint-negotiation process: The case of solo travel. Leis. Stud. 2017, 36, 481–492. [Google Scholar] [CrossRef]
  48. Kennelly, M.; Moyle, B.; Lamont, M. Constraint negotiation in serious leisure: A study of amateur triathletes. J. Leis. Res. 2013, 45, 466–484. [Google Scholar] [CrossRef]
  49. Hung, K.; Petrick, J.F. Testing the effects of congruity, travel constraints, and self-efficacy on travel intentions: An alternative decision-making model. Tour. Manag. 2012, 33, 855–867. [Google Scholar] [CrossRef]
  50. Tan, W.K.; Yeh, Y.D.; Chen, S.H. The role of social interaction element on intention to play mmorpg in the future: From the perspective of leisure constraint negotiation process. Games Cult. 2017, 12, 28–55. [Google Scholar] [CrossRef]
  51. Parasuraman, A.; Zeithaml, V.A.; Berry, L.L. A conceptual model of service quality and its implications for future research. J. Mark. 1985, 49, 41–50. [Google Scholar] [CrossRef]
  52. Parasuraman, A.; Zeithaml, V.; Berry, L. Servqual: A multiple-item scale for measuring consumer perceptions of service quality. J. Retail. 1988, 64, 12–40. [Google Scholar]
  53. Babakus, E.; Boller, G.W. An empirical assessment of the servqual scale. J. Bus. Res. 1992, 24, 253–268. [Google Scholar] [CrossRef]
  54. Bolton, R.N.; Drew, J.H. A multistage model of customers’ assessments of service quality and value. J. Consum. Res. 1991, 17, 375–384. [Google Scholar] [CrossRef]
  55. Brady, M.K.; Cronin, J.J.; Brand, R.R. Performance-only measurement of service quality: A replication and extension. J. Bus. Res. 2002, 55, 17–31. [Google Scholar] [CrossRef]
  56. Carman, J.M. Consumer perceptions of service quality: An assessment of the servqual dimensions. J. Retail. 1990, 66, 33–55. [Google Scholar]
  57. Schneider, B.; White, S.S. Service Quality: Research Perspectives; SAGE Publications: Thousand Oaks, CA, USA, 2004. [Google Scholar]
  58. Chon, K.S. Understanding recreational traveler’s motivation, attitude and satisfaction. Tour. Rev. 1989, 44, 3–7. [Google Scholar] [CrossRef]
  59. Gnoth, J. Tourism motivation and expectation formation. Ann. Tour. Res. 1997, 24, 283–304. [Google Scholar] [CrossRef]
  60. Caruana, A.; Money, H.M.; Berthon, P.R. Service quality and satisfaction—The moderating role of value. Eur. J. Mark. 2000, 34, 1338–1353. [Google Scholar] [CrossRef]
  61. Sweeney, J.C.; Soutar, G.N.; Johnson, W.L. Retail service quality and perceived value: A comparison of two models. J. Retail. Consum. Serv. 1997, 4, 39–48. [Google Scholar] [CrossRef]
  62. Zeithaml, V.A. Consumer perceptions of price, quality, and value: A means-end model and synthesis of evidence. J. Mark. 1988, 52, 2–22. [Google Scholar] [CrossRef]
  63. Andreassen, T.W.; Lindestad, B. Customer loyalty and complex services: The impact of corporate image on quality, customer satisfaction and loyalty for customers with varying degrees of service expertise. Int. J. Serv. Ind. Manag. 1998, 9, 7–23. [Google Scholar] [CrossRef]
  64. Baker, D.A.; Crompton, J.L. Quality, satisfaction and behavioral intentions. Ann. Tour. Res. 2000, 27, 785–804. [Google Scholar] [CrossRef]
  65. Bitner, M.J.; Hubbert, A.R. Encounter satisfaction versus overall satisfaction versus quality. Serv. Qual. New Dir. Theory Pract. 1994, 34, 72–94. [Google Scholar]
  66. Spreng, R.A.; Mackoy, R.D. An empirical examination of a model of perceived service quality and satisfaction. J. Retail. 1996, 72, 201–214. [Google Scholar] [CrossRef]
  67. Taylor, S.A.; Baker, T.L. An assessment of the relationship between service quality and customer satisfaction in the formation of consumers’ purchase intentions. J. Retail. 1994, 70, 163–178. [Google Scholar] [CrossRef]
  68. Bitner, M.J. Evaluating service encounters: The effects of physical surroundings and employee responses. J. Mark. 1990, 54, 69–82. [Google Scholar] [CrossRef]
  69. Anderson, E.W.; Fornell, C.; Lehmann, D.R. Customer satisfaction, market share, and profitability: Findings from sweden. J. Mark. 1994, 58, 53–66. [Google Scholar] [CrossRef]
  70. Churchill, G.A., Jr.; Surprenant, C. An investigation into the determinants of customer satisfaction. J. Mark. Res. 1982, 19, 491–504. [Google Scholar] [CrossRef]
  71. Zeithaml, V.A.; Parasuraman, A.; Malhotra, A. Service quality delivery through web sites: A critical review of extant knowledge. J. Acad. Mark. Sci. 2002, 30, 362–375. [Google Scholar] [CrossRef]
  72. Grönroos, C. A service quality model and its marketing implications. Eur. J. Mark. 1984, 18, 36–44. [Google Scholar] [CrossRef]
  73. Lee, H.; Lee, Y.F.; Yoo, D. The determinants of perceived service quality and its relationship with satisfaction. J. Serv. Mark. 2000, 14, 217–231. [Google Scholar] [CrossRef]
  74. Swan, J.E.; Combs, L.J. Product performance and consumer satisfaction: A new concept. J. Mark. 1976, 40, 25–33. [Google Scholar] [CrossRef]
  75. Cole, S.T. Examining the mediating role of festival visitors’ satisfaction in the relationship between service quality and behavioral intentions. J. Vacat. Mark. 2006, 12, 160–173. [Google Scholar] [CrossRef]
  76. Crompton, J.L.; Love, L.L. The predictive validity of alternative approaches to evaluating quality of a festival. J. Travel Res. 1995, 34, 11–24. [Google Scholar] [CrossRef]
  77. Mok, C.; Sparks, B.; Kadampully, J. Service Quality Management in Hospitality, Tourism, and Leisure; Routledge: Abingdon-on-Thames, UK, 2013. [Google Scholar]
  78. Cardozo, R.N. An experimental study of customer effort, expectation, and satisfaction. J. Mark. Res. 1965, 2, 244–249. [Google Scholar] [CrossRef]
  79. Engel, J.F.; Blackwell, R.D.; Miniard, P.W. Consumer Behavior, 8th ed.; The Dryden Press: New York, NY, USA, 1995. [Google Scholar]
  80. Howard, J.A.; Sheth, J.N. The Theory of Buyer Behavior; Wiley: Hoboken, NJ, USA, 1969. [Google Scholar]
  81. Kotler, P. Marketing Management, 11st ed.; Prentice Hall: Upper Saddle River, NJ, USA, 2003. [Google Scholar]
  82. Oliver Richard, L. Satisfaction: A Behavioral Perspective on the Consumer; Irwin-McGraw-Hill: New York, NY, USA, 1997. [Google Scholar]
  83. Spreng, R.A.; MacKenzie, S.B.; Olshavsky, R.W. A reexamination of the determinants of consumer satisfaction. J. Mark. 1996, 60, 15–32. [Google Scholar] [CrossRef]
  84. Fisk, R.P. Disconfirmation of equity expectations: Effects on consumer satisfaction with services. Adv. Consum. Res. 1985, 12, 340. [Google Scholar]
  85. Cadotte, E.R.; Woodruff, R.B.; Jenkins, R.L. Expectations and norms in models of consumer satisfaction. J. Mark. Res. 1987, 24, 305–314. [Google Scholar] [CrossRef]
  86. Tse, D.K.; Wilton, P.C. Models of consumer satisfaction formation: An extensive. J. Mark. Res. 1988, 25, 204–212. [Google Scholar] [CrossRef]
  87. Oliver, R.L. Cognitive, affective, and attribute bases of the satisfaction response. J. Consum. Res. 1993, 20, 418–430. [Google Scholar] [CrossRef]
  88. Mannell, R.C.; Iso-Ahola, S.E. Psychological nature of leisure and tourism experience. Ann. Tour. Res. 1987, 14, 314–331. [Google Scholar] [CrossRef]
  89. Dunn Ross, E.L.; Iso-Ahoa, S.E. Sightseeing tourists’ motivation and satisfaction. Ann. Tour. Res. 1991, 18, 226–237. [Google Scholar] [CrossRef]
  90. Noe, F.P.; Uysal, M. Evaluation of outdoor recreational settings. J. Retail. Consum. Serv. 1997, 4, 223–230. [Google Scholar] [CrossRef]
  91. Tian, S.; Tian, J.L.; Witt, P.A. Integrating constraints and benefits to identify responsive target markets for museum attractions. J. Travel Res. 1996, 35, 34–45. [Google Scholar] [CrossRef]
  92. Cronin, J.J., Jr.; Brady, M.K.; Hult, G.T.M. Assessing the effects of quality, value, and customer satisfaction on consumer behavioral intentions in service environments. J. Retail. 2000, 76, 193–218. [Google Scholar] [CrossRef] [Green Version]
  93. Hunt, S.D.; Sparkman, R.D., Jr.; Wilcox, J.B. The pretest in survey research: Issues and preliminary findings. J. Mark. Res. 1982, 19, 269–273. [Google Scholar] [CrossRef]
  94. Falk, J.H. The effect of visitors’ agendas on museum learning. Curator 1998, 41, 107–120. [Google Scholar] [CrossRef]
  95. Hair, J.F. Multivariate Data Analysis: A Global Perspective; Pearson Education: London, UK, 2010. [Google Scholar]
  96. Backman, S.J. An investigation of the relationship between activity loyalty and perceived constraints. J. Leis. Res. 1991, 23, 332–344. [Google Scholar] [CrossRef]
  97. Jackson, E.L. Leisure constraints: A survey of past research. Leis. Sci. 1988, 10, 203–215. [Google Scholar] [CrossRef]
  98. Williams, D.R.; Schreyer, R.; Knopf, R.C. The effect of the experience use history on the multidimensional structure of motivations to participate in leisure activities. J. Leis. Res. 1990, 22, 36–54. [Google Scholar] [CrossRef]
  99. Arbuckle, J.L. Amos 7.0 User’s Guide; AMOS Development Corporation: Chicago, IL, USA, 2006. [Google Scholar]
  100. Anderson, J.C.; Gerbing, D.W. Structural equation modeling in practice: A review and recommended two-step approach. Psychol. Bull. 1988, 103, 411–423. [Google Scholar] [CrossRef]
  101. Hood, M.G. Staying away: Why people choose not to visit museums. Mus. News 1983, 61, 50–57. [Google Scholar]
  102. Dickenson, V. The economics of museum admission charges. In Museum Management; Routledge: Abingdon-on-Thames, UK, 2005; pp. 116–125. [Google Scholar]
  103. Bettman, J.R. Perceived price and product perceptual variables. J. Mark. Res. 1973, 10, 100–102. [Google Scholar] [CrossRef]
  104. Voss, G.B.; Parasuraman, A.; Grewal, D. The roles of price, performance, and expectations in determining satisfaction in service exchanges. J. Mark. 1998, 62, 46–61. [Google Scholar] [CrossRef]
  105. Fornell, C.; Larcker, D.F. Structural equation models with unobservable variables and measurement error: Algebra and statistics. J. Mark. Res. 1981, 18, 382–388. [Google Scholar] [CrossRef]
  106. Bagozzi, R.P.; Yi, Y. On the evaluation of structural equation models. J. Acad. Mark. Sci. 1988, 16, 74–94. [Google Scholar] [CrossRef]
  107. Lance, C.E.; Butts, M.M.; Michels, L.C. The sources of four commonly reported cutoff criteria: What did they really say? Organ. Res. Methods 2006, 9, 202–220. [Google Scholar] [CrossRef]
  108. Nunnally, J.C. Psychometric Theory; McGraw-Hill: New York, NY, USA, 1978. [Google Scholar]
  109. Carmines, E.G.; McIver, J.P. Analyzing models with unobserved variables: Analysis of covariance structures. Soc. Meas. Curr. Issues 1981, 80, 65–115. [Google Scholar]
  110. Hair, J.F.; Black, W.C.; Babin, B.J.; Anderson, R.E.; Tatham, R.L. Multivariate Data Analysis; Pearson Prentice Hall: Upper Saddle River, NJ, USA, 2006; Volume 6. [Google Scholar]
  111. Cronin, J.J.; Taylor, S.A. Measuring service quality: A reexamination and extension. J. Mark. 1992, 56, 55–68. [Google Scholar] [CrossRef]
  112. Tian-Cole, S.; Crompton, J.L.; Willson, V.L. An empirical investigation of the relationships between service quality, satisfaction and behavioral intentions among visitors to a wildlife refuge. J. Leis. Res. 2002, 34, 1–24. [Google Scholar] [CrossRef]
Figure 1. Proposed model on the relationship among motivations, constraints, physical environment of a museum and satisfaction.
Sustainability 10 03880 g001
Figure 2. Site plan and major floor plans of the National Science and Technology Museum.
Sustainability 10 03880 g002
Figure 3. Estimated results of the study model. Physical environment forms a mediator among motivation, constraint and satisfaction. * p < 0.05, *** p < 0.001.
Sustainability 10 03880 g003
Figure 4. Interpretation of the structural model. Museum physical environment acts as an axial function in the model to transfer the impacts of motivation and constraint to visitor satisfaction. The indirect effect of motivation on satisfaction through physical environment is greater than its direct effect on satisfaction. Constraint has no direct effect on satisfaction.
Sustainability 10 03880 g004
Table 1. Demographic characteristics of the sample
Percentage Percentage
Gender Occupation
Male48.1Self-employed1.9
Female51.9Blue-collar worker6.6
White-collar worker14.2
Age Technical worker16.1
15–1913.3Government worker17.7
20–2424.7Student35.8
25–3420.3Retiree7.9
35–4427.5Others1.9
45–5410.1
55–643.5Monthly income
65+0.6<NTD10,00035.1
NTD10,000–30,00022.2
Educational Level NTD30,000–50,00025.3
Junior high0.9NTD50,000–70,00013
High school19.6NTD70,000–90,0002.2
College61.7NTD90,000–110,0001.3
Graduate17.7Above NTD110,0000.9
Marital status
Single53.8
Married with children38.3
Married without children7.9
Note: NTD is the abbreviation for New Taiwan Dollar.
Table 2. Factors under the motivation (Mo), constraint (Con), physical environment (PhE) and the explained variances of the three constructs.
ConstructFactorExplained Variance
(%)
Total Variance Explained
(%)
Motivation (Mo)Mo1 Self-development 20.6961.47
Mo2 Occasion and social interaction 14.48
Mo3 Leisure and companionship 12.32
Mo4 Family education7.67
Mo5 Attractiveness or obligation 6.32
Constraint (Con)Con1 Poor museum image28.6663.43
Con2 Unappealing soft content 20.10
Con3 Unattractive service and cost14.67
Physical Environment (PhE)PhE1 Architectural planning15.4464.27
PhE2 Exhibition and marketing15.23
PhE3 External environment and accessibility12.02
PhE4 Entrance and ticketing9.03
PhE5 Site planning 6.99
PhE6 Shop and café5.57
Table 3. Convergent validity of the measurement models.
Construct/IndicatorFactor Loading (λ)Reliability Coefficient (λ2)Measurement Error (1−λ2)AVECR
Motivation (Mo) 0.4160.778
Mo10.734 a0.5390.461
Mo20.502 ***0.2520.748
Mo30.635 ***0.4030.597
Mo40.67 ***0.4490.551
Mo50.661 ***0.4370.563
Constraint (Con) 0.6790.862
Con10.858 a0.7360.264
Con20.923 ***0.8520.148
Con30.671 ***0.4500.550
Physical environment (PhE) 0.5570.881
PhE10.899 a0.8080.192
PhE20.832 ***0.6920.308
PhE30.644 ***0.4150.585
PhE40.777 ***0.6040.396
PhE50.706 ***0.4980.502
PhE60.569 ***0.3240.676
Satisfaction (S) 0.6840.882
S10.662 a0.4380.562
S20.891 ***0.7940.206
S30.905 ***0.8190.181
Note: a Significance was not calculated because the unstandardized loading was set as 1.0 to fix construct variance. *** p < 0.001.
Table 4. Discriminant validity of the measurement models.
Motivation (Mo)Constraint (Con)Physical Environment (PhE)Satisfaction (S)
Motivation (Mo)0.416 a
Constraint (Con)0.013 b0.679 a
Physical environment (PhE)0.189 b0.064 b0.557 a
Satisfaction (S)0.142 b0.027 b0.333 b0.684 a
Note: a Average variance extracted (AVE). b Squared correlation (γ2).
Table 5. Direct and indirect effects among motivation, constraint, physical environment and satisfaction.
PathDirect EffectIndirect EffectTotal Effect
Motivation → Physical environment0.411 0.411
Constraint → Physical environment−0.207 −0.207
Physical environment → Satisfaction0.509 0.509
Motivation → Satisfaction0.1560.2090.365
Constraint → Satisfaction −0.105−0.105
Table 6. Relationship between motivation and constraint towards visiting a museum and perception of museum physical environment.
Physical Environment (PhE)DeterminantBetat-ValueSigVIF
PhE1 Architectural planning Mo4 Family education0.2514.3070.000 ***1.289
Con2 Unappealing soft content−1.93−3.7470.000 ***1.013
Mo1 Self-development0.1632.7800.000 ***1.299
PhE2 Exhibition and marketingMo1 Self-development0.1742.8920.004 **1.299
Con2 Unappealing soft content −0.183−3.4560.001 **1.013
Mo4 Family education0.1702.8360.005 **1.289
PhE3 External environment and accessibility Mo1 Self-development0.1612.6060.010 *1.301
Mo4 Family education0.1402.2770.023 *1.290
Con1 Poor museum image −0.109−2.0010.046 *1.017
PhE4 Entrance and ticketingMo4 Family education0.1913.1540.002 **1.289
Con2 Unappealing soft content −0.140−2.6140.009 **1.013
Mo1 Self-development0.1482.4410.015 *1.299
PhE5 Site planningMo4 Family education0.2945.5240.000 ***1.008
Con1 Poor museum image−0.165−3.0950.002 **1.008
PhE6 Shop and café Mo5 Attractiveness or obligation0.1652.6550.008 **1.329
Con3 Unattractive service and cost−0.152−2.8030.005 **1.006
Mo2 Occasion and social interaction0.1452.3280.021 *1.331
Note: * p < 0.05, ** p < 0.01, *** p < 0.001

