Evaluation of Safety Measures of a Hydrogen Fueling Station Using Physical Modeling


 ,
,
Abstract
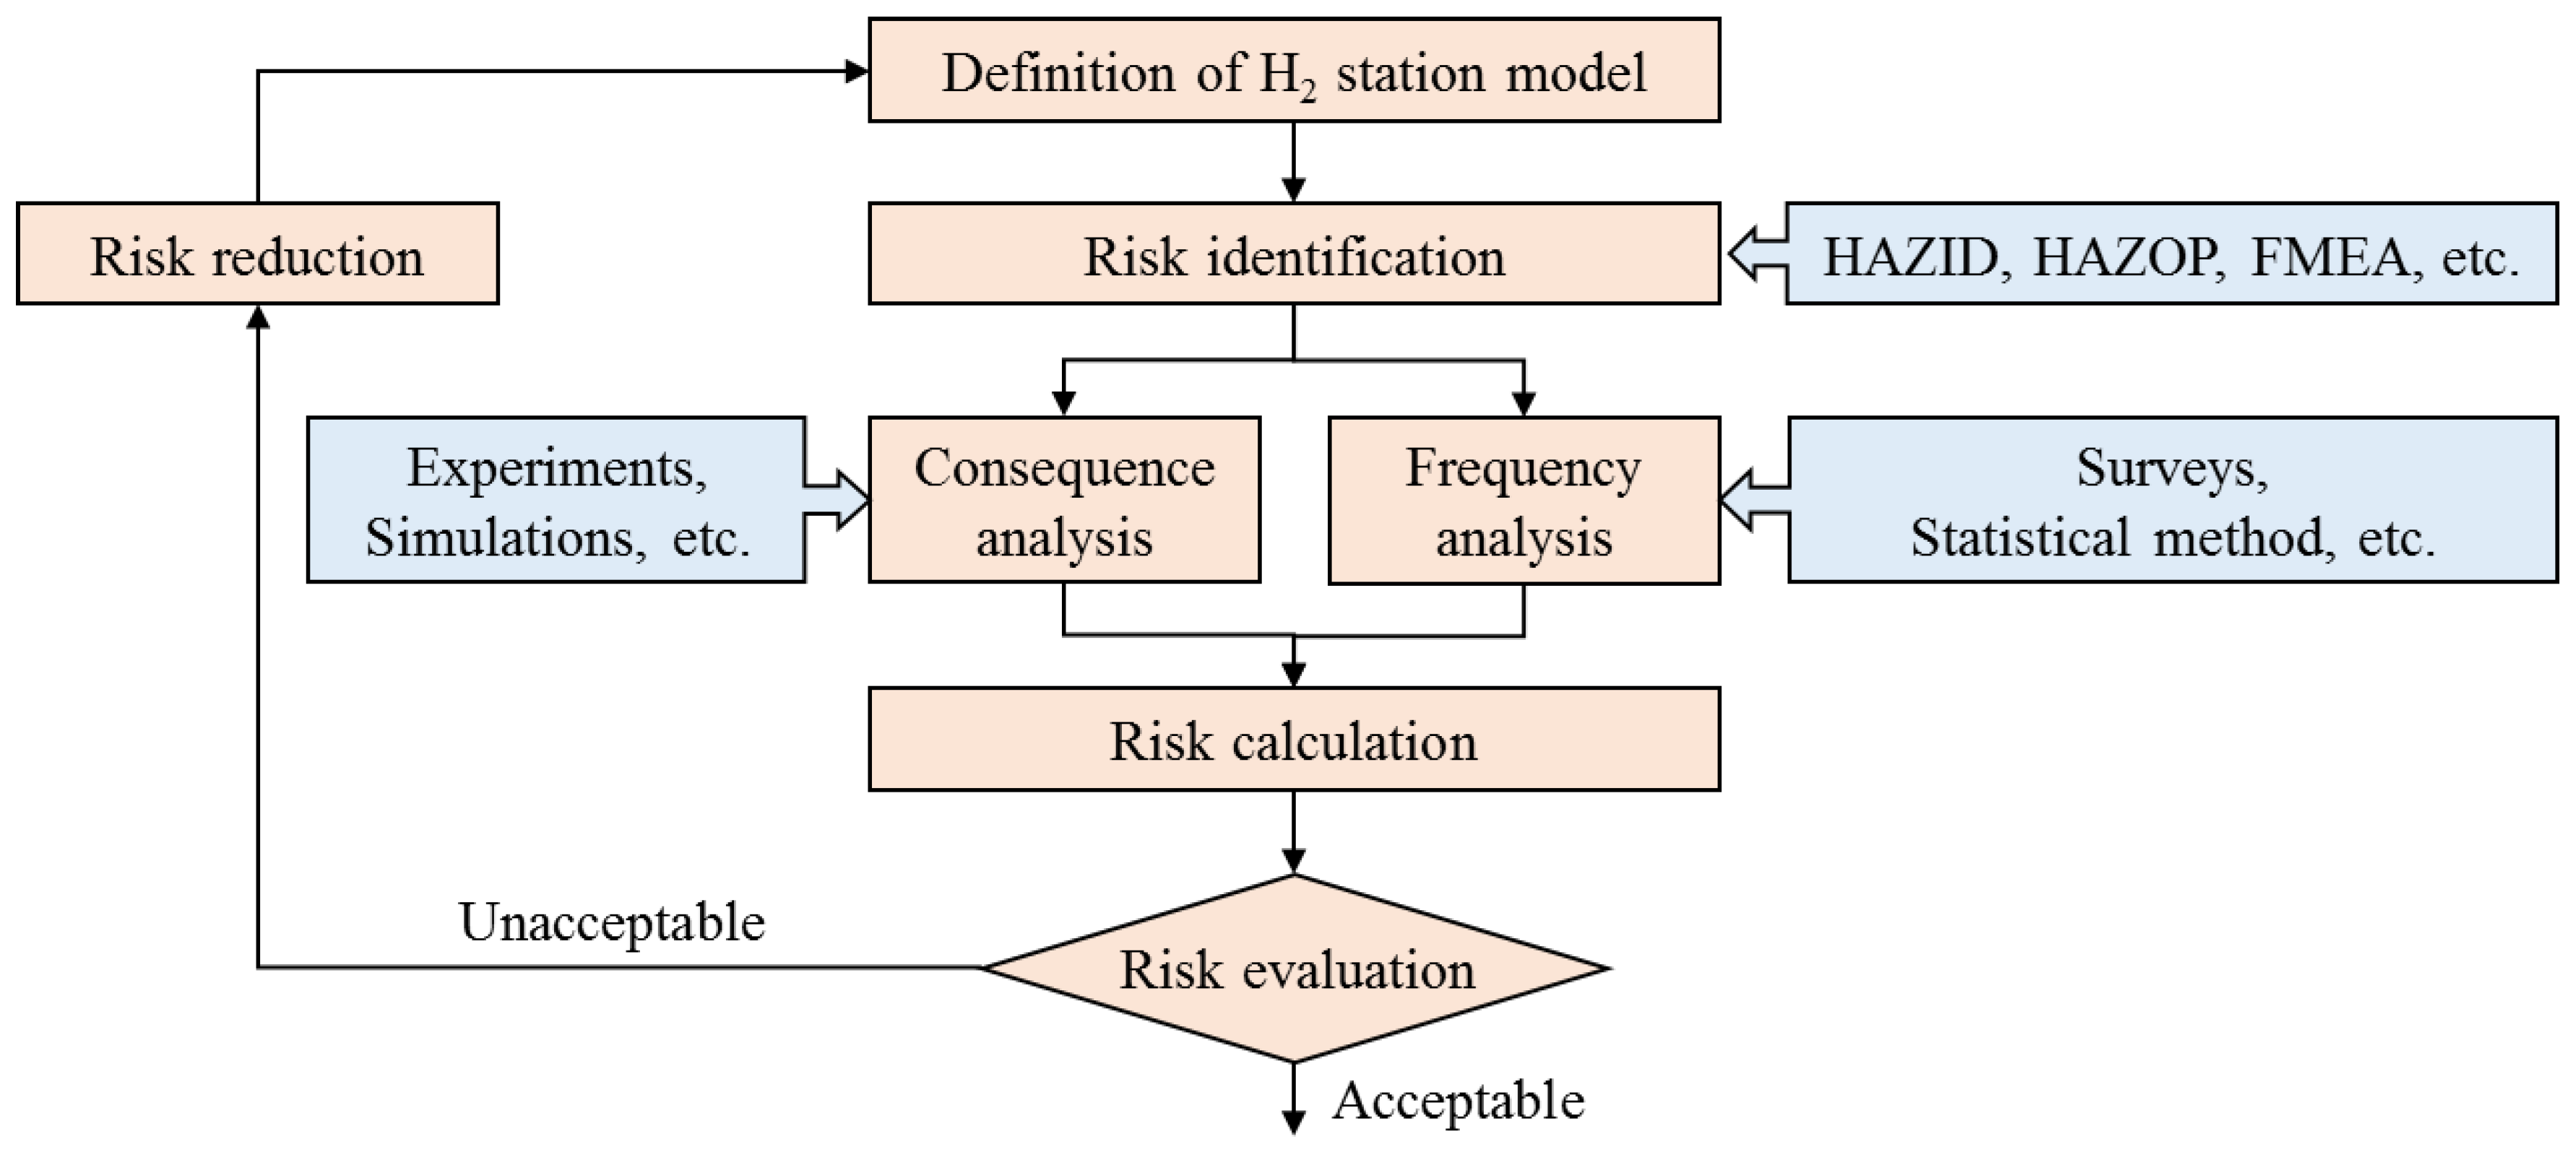
1. Introduction
2. Physical Modeling of Hydrogen Fueling Station
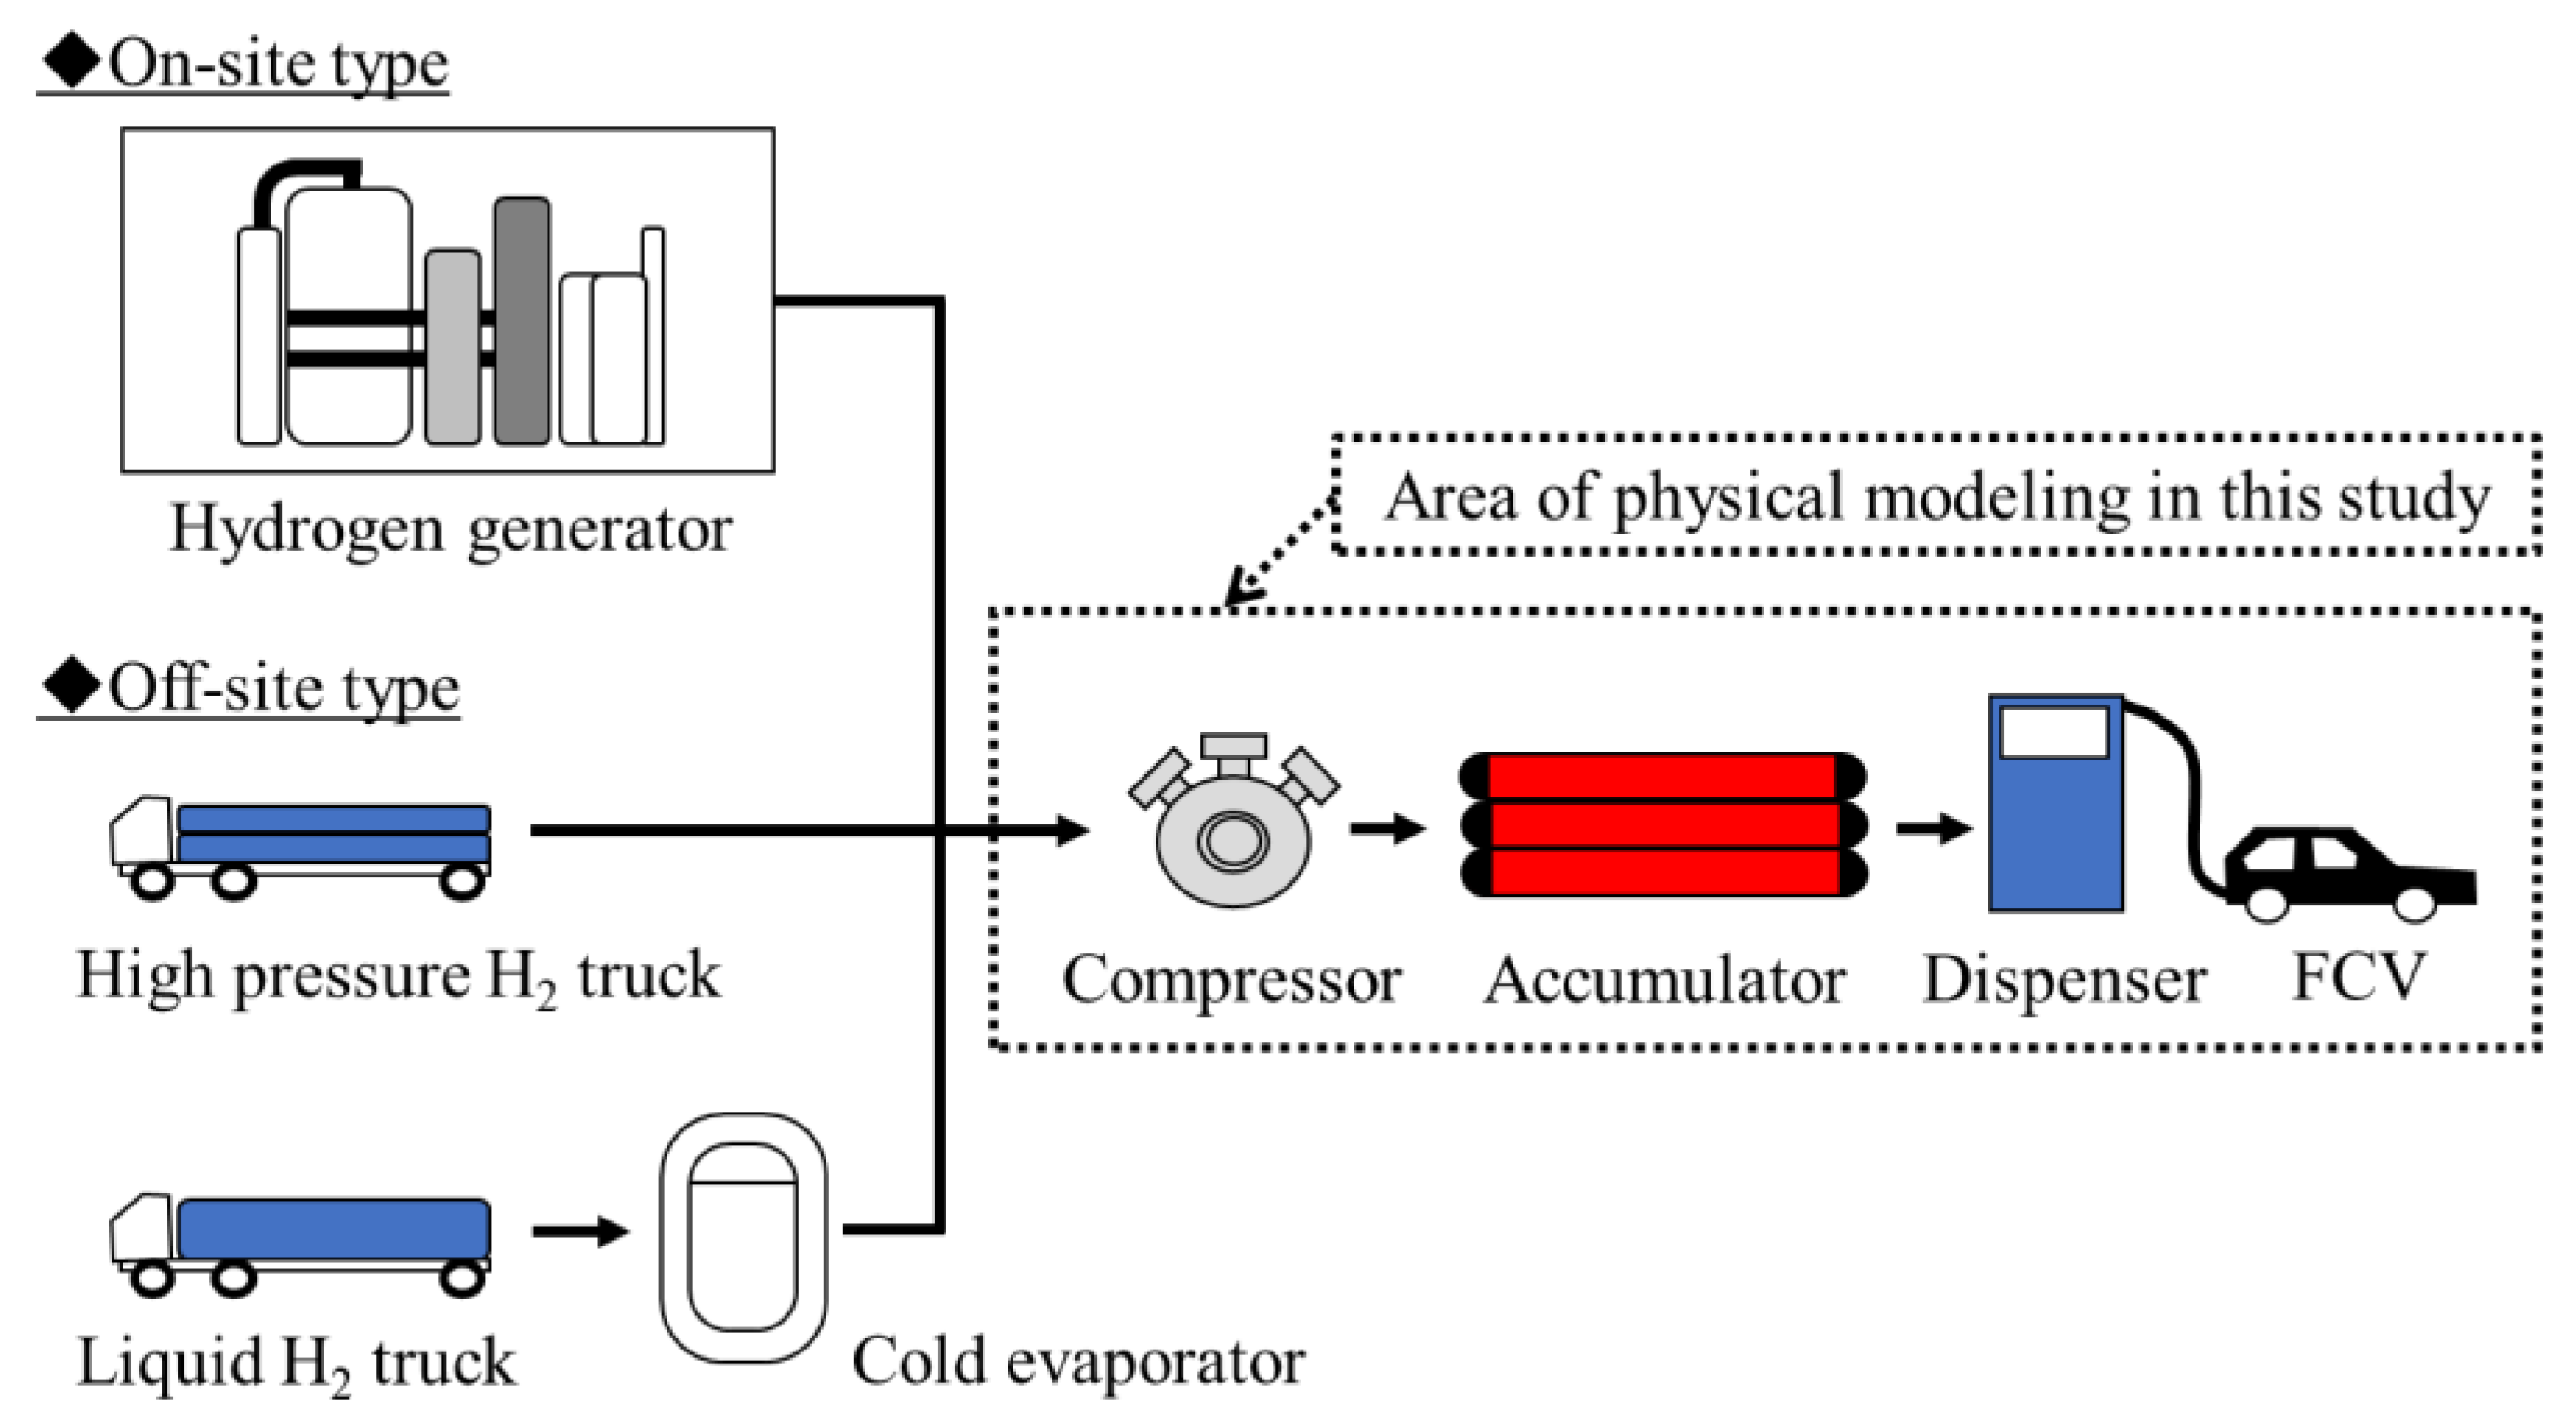
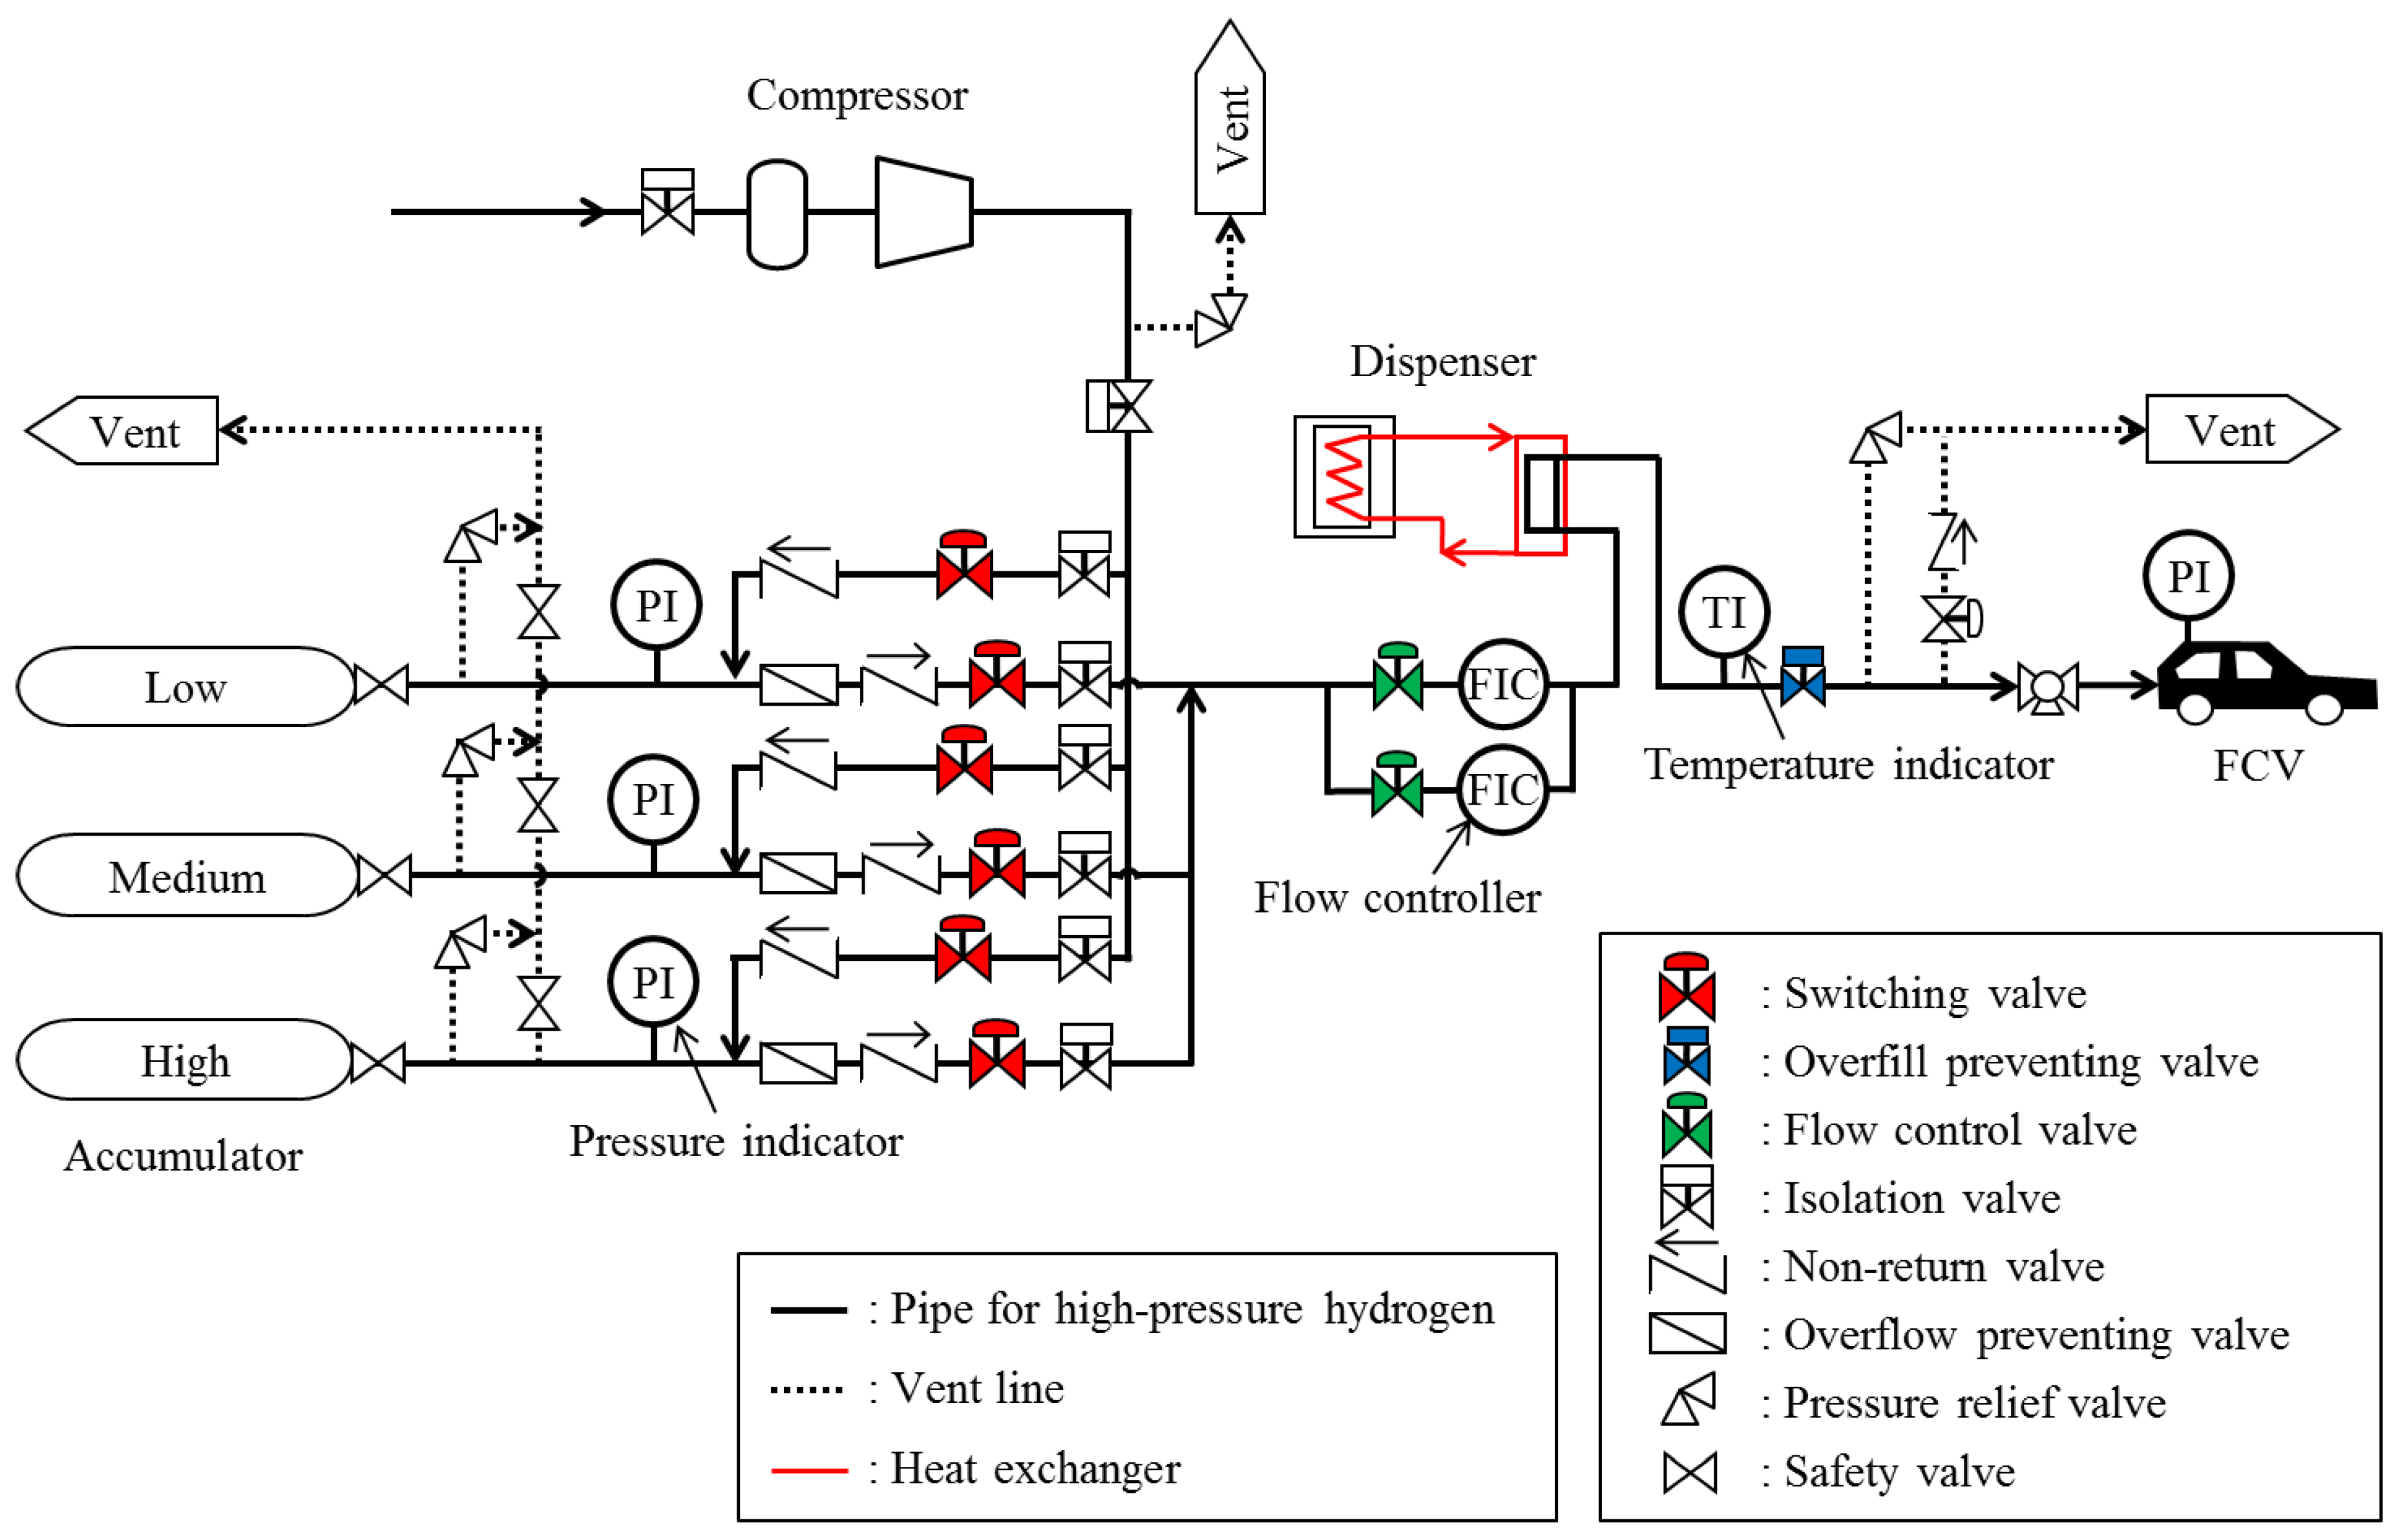
2.1. Model of Hydrogen Fueling Station
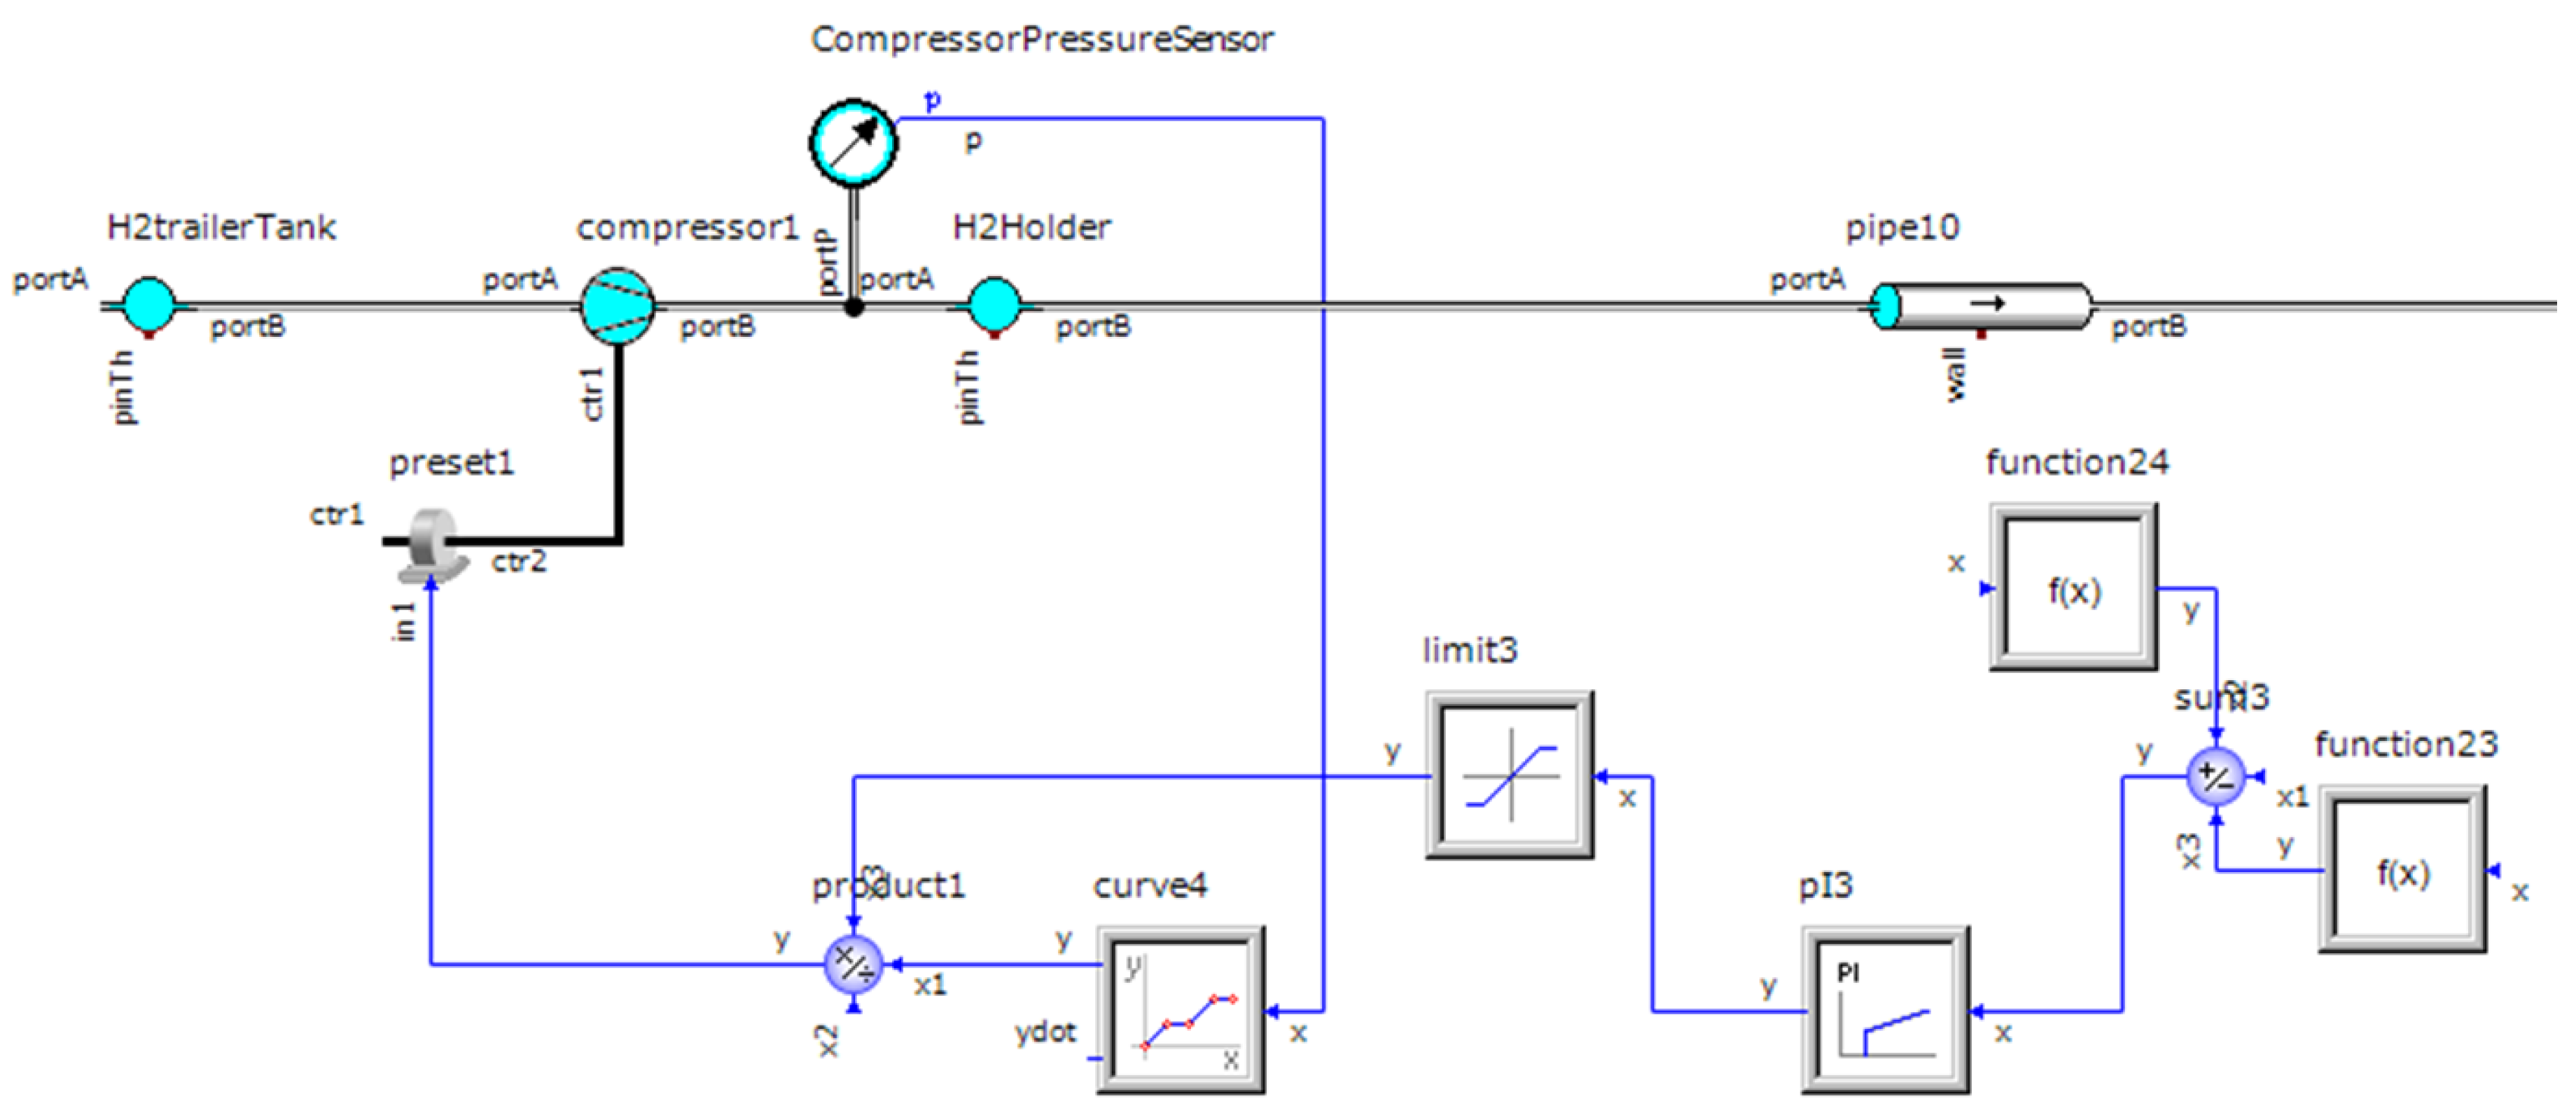
2.1.1. Compressor Modeling
2.1.2. Accumulator Modeling
2.1.3. Dispenser Modeling
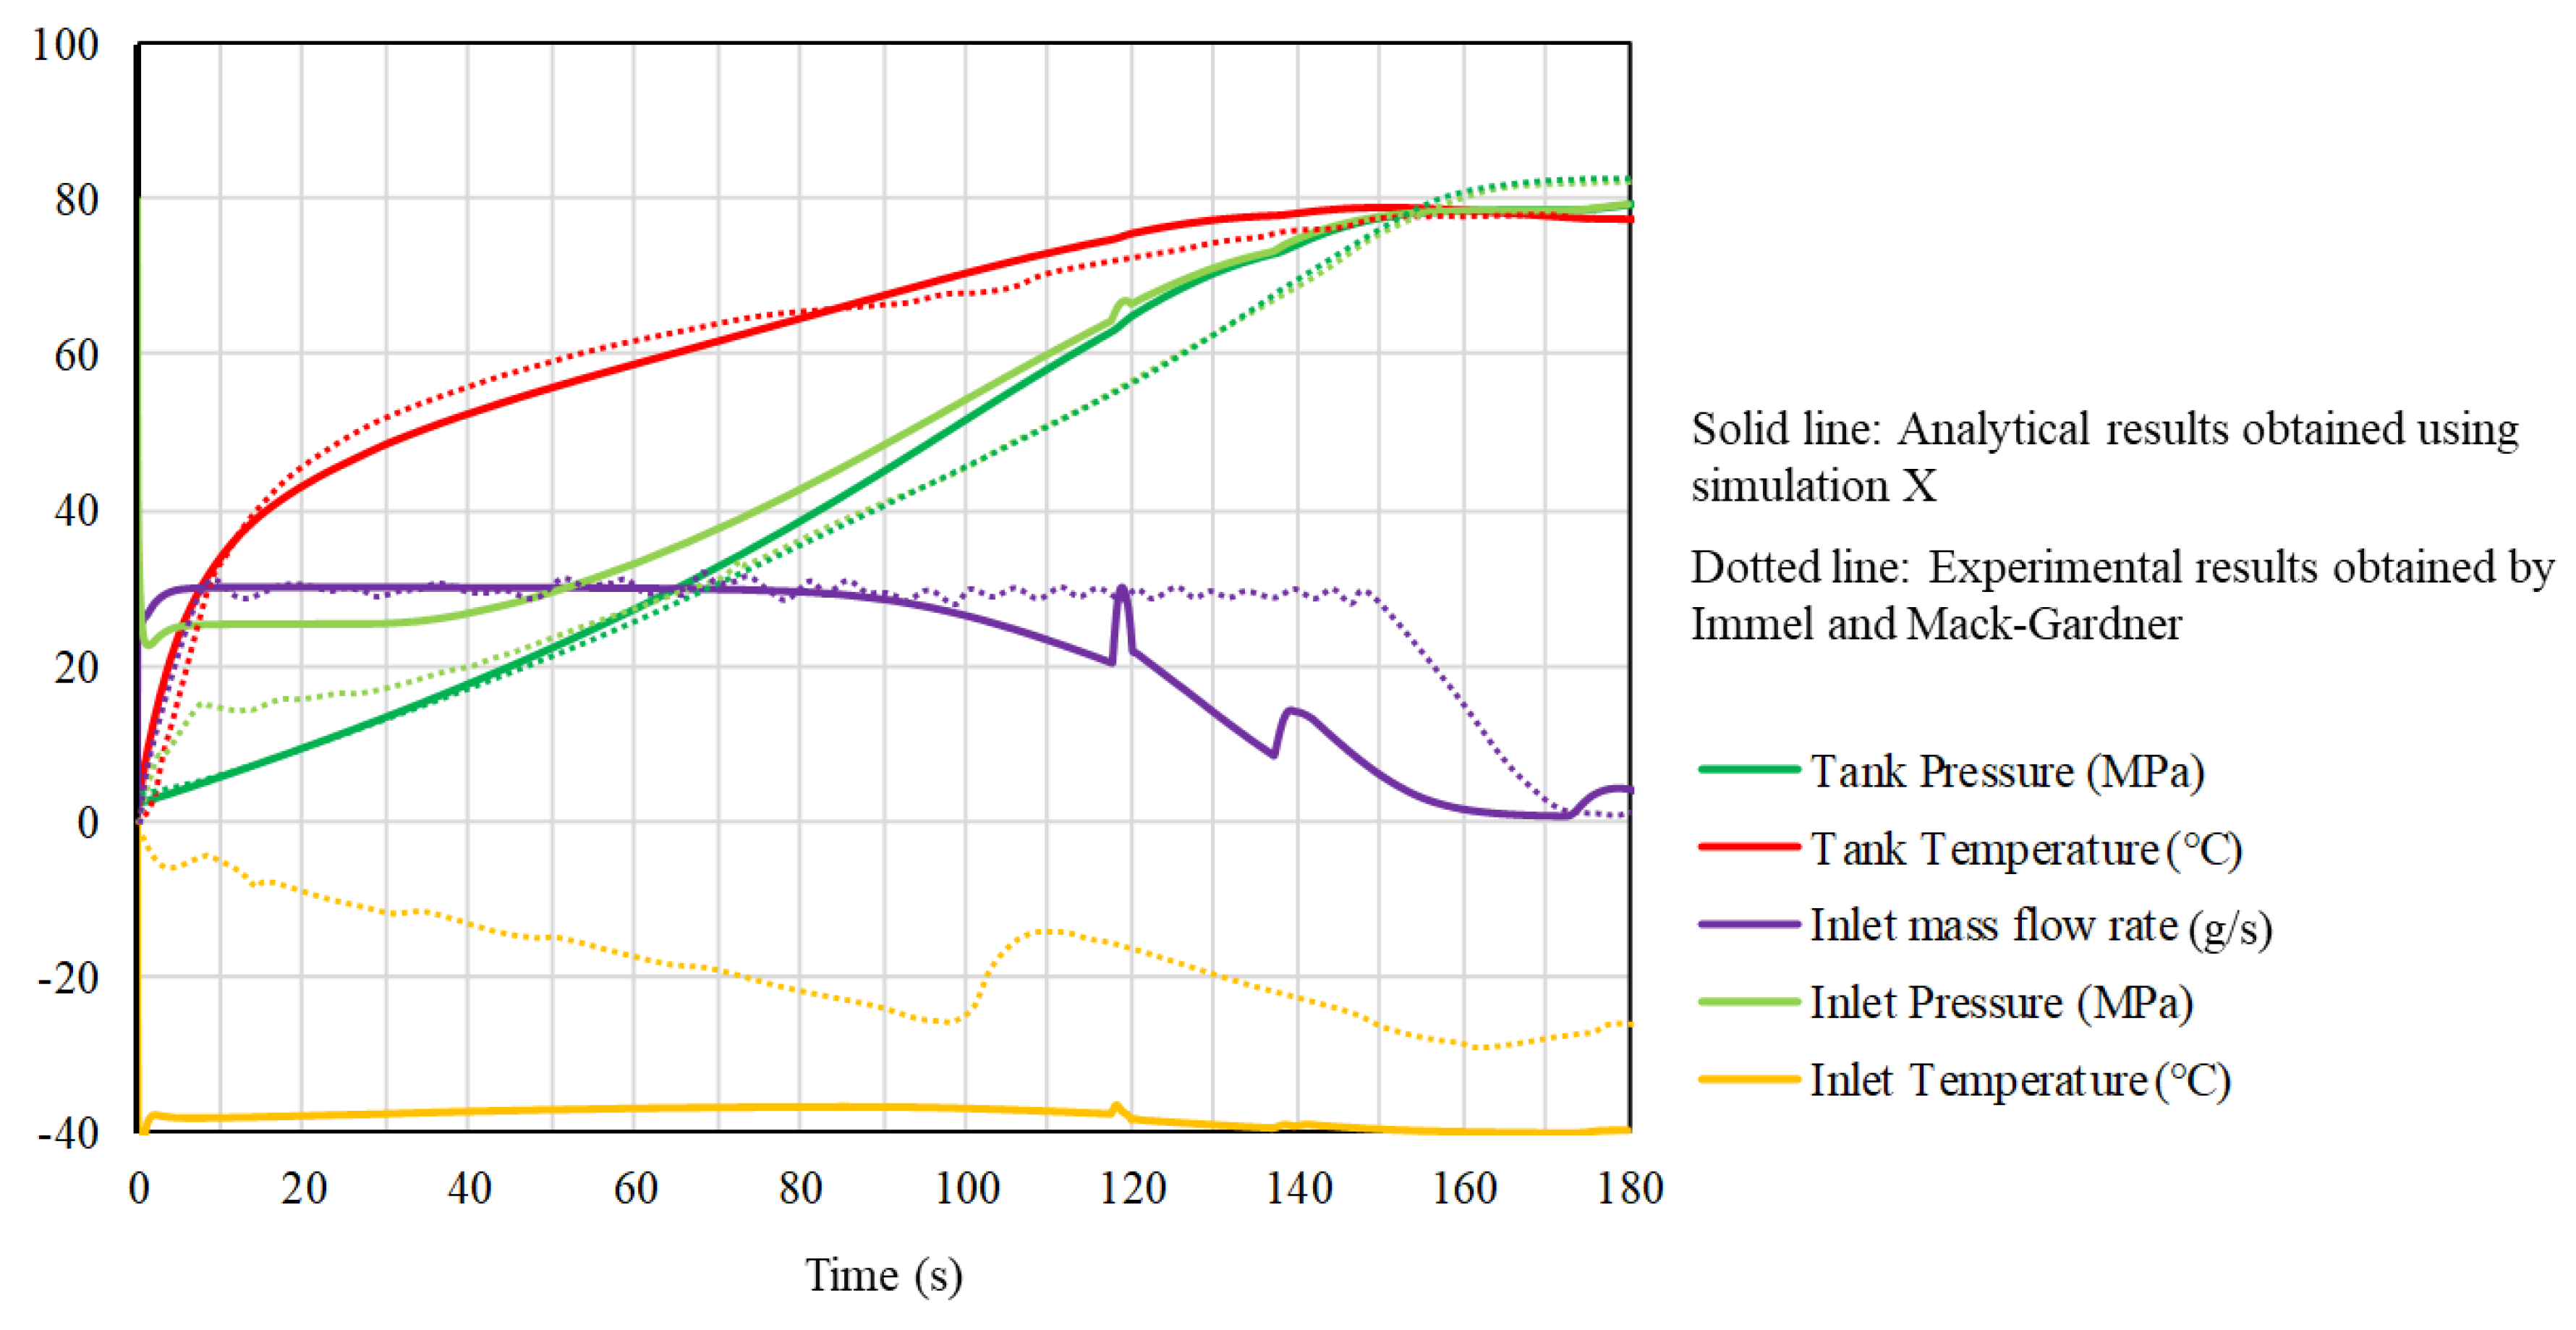
2.2. Validation
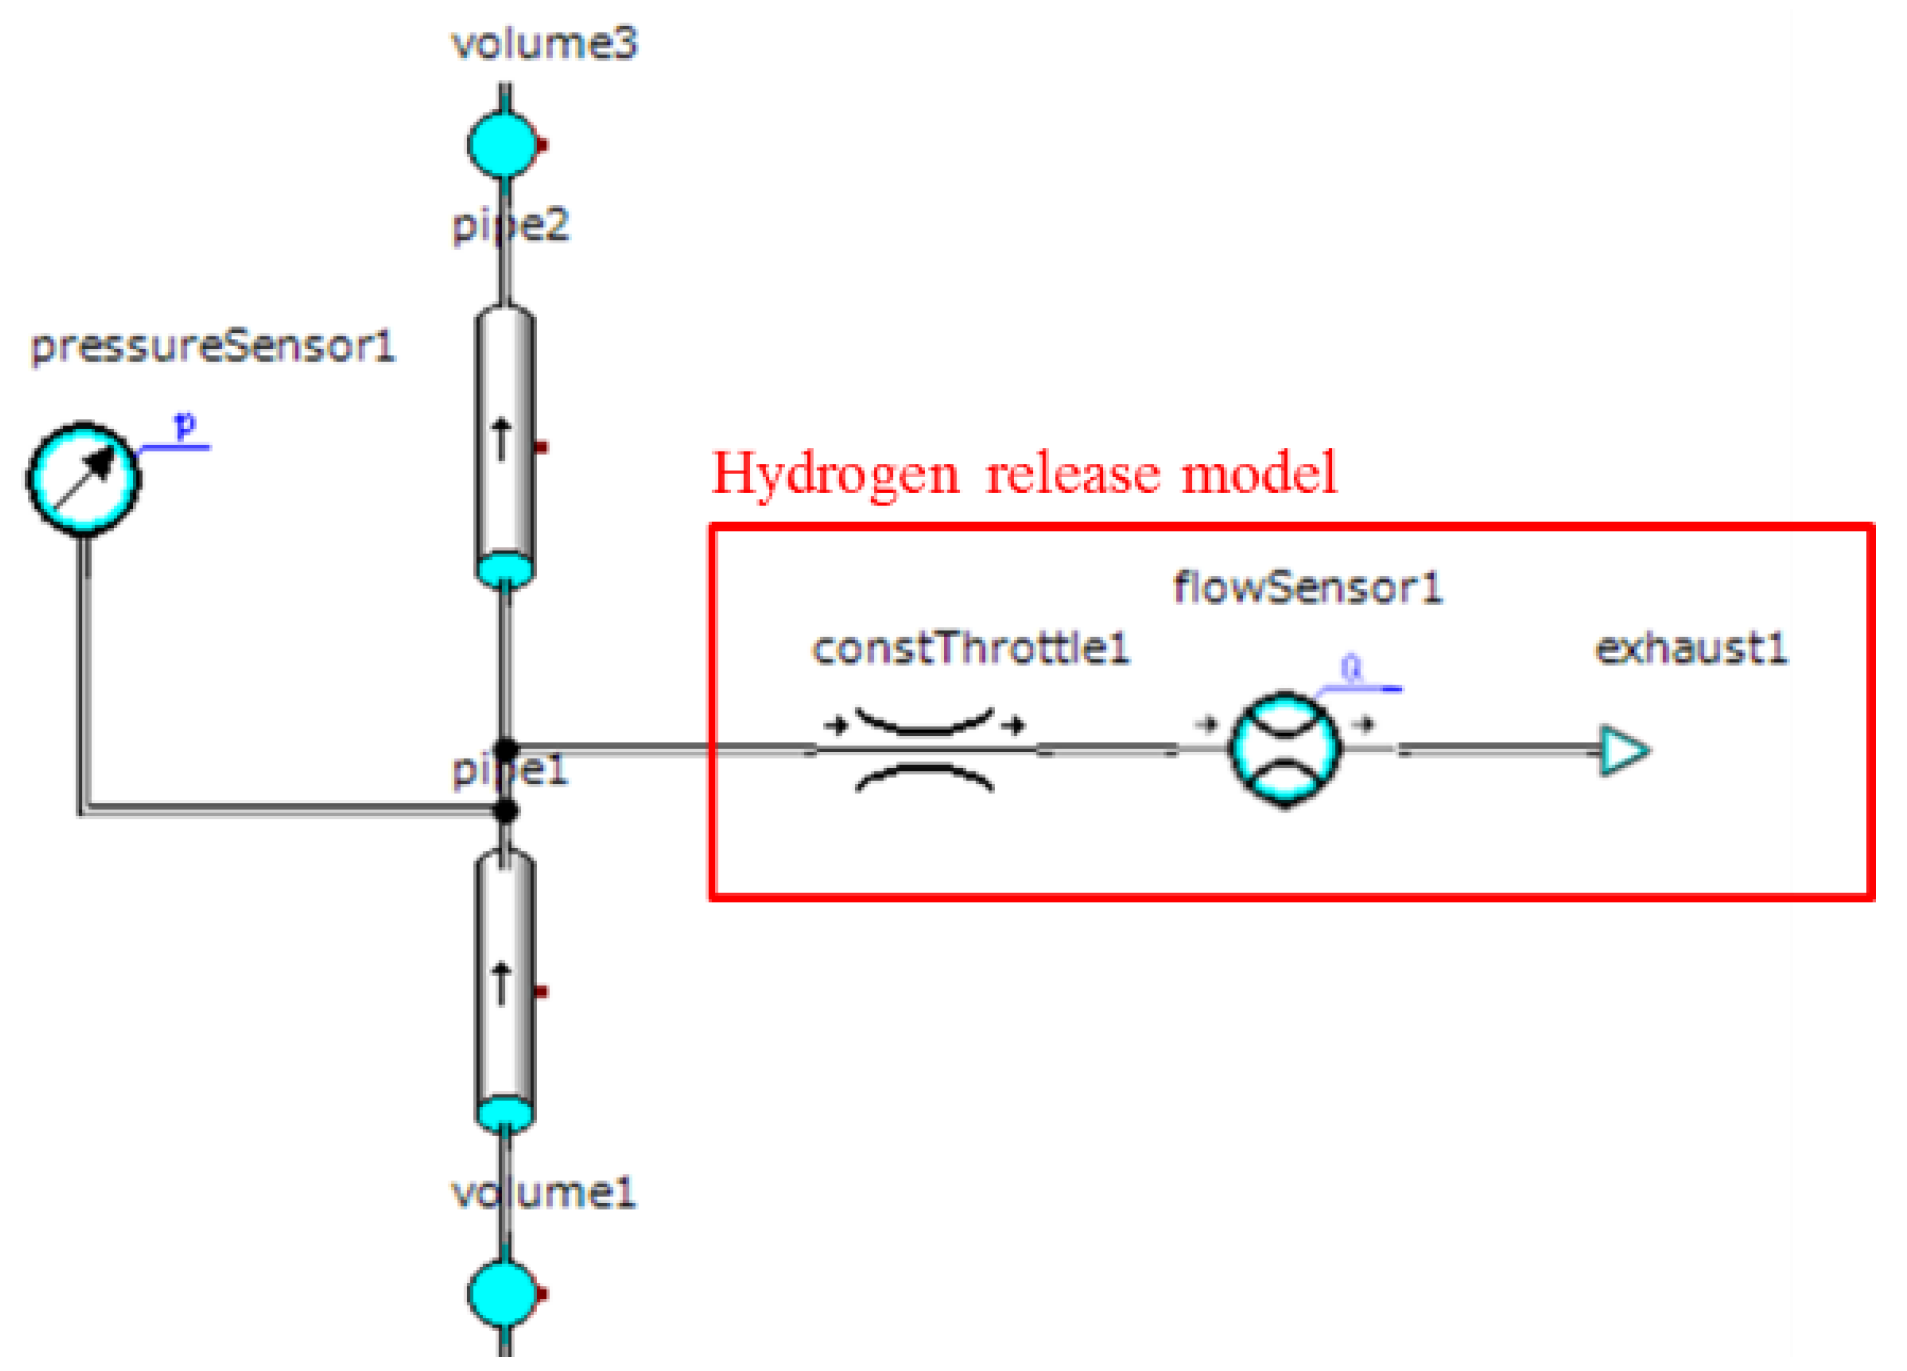
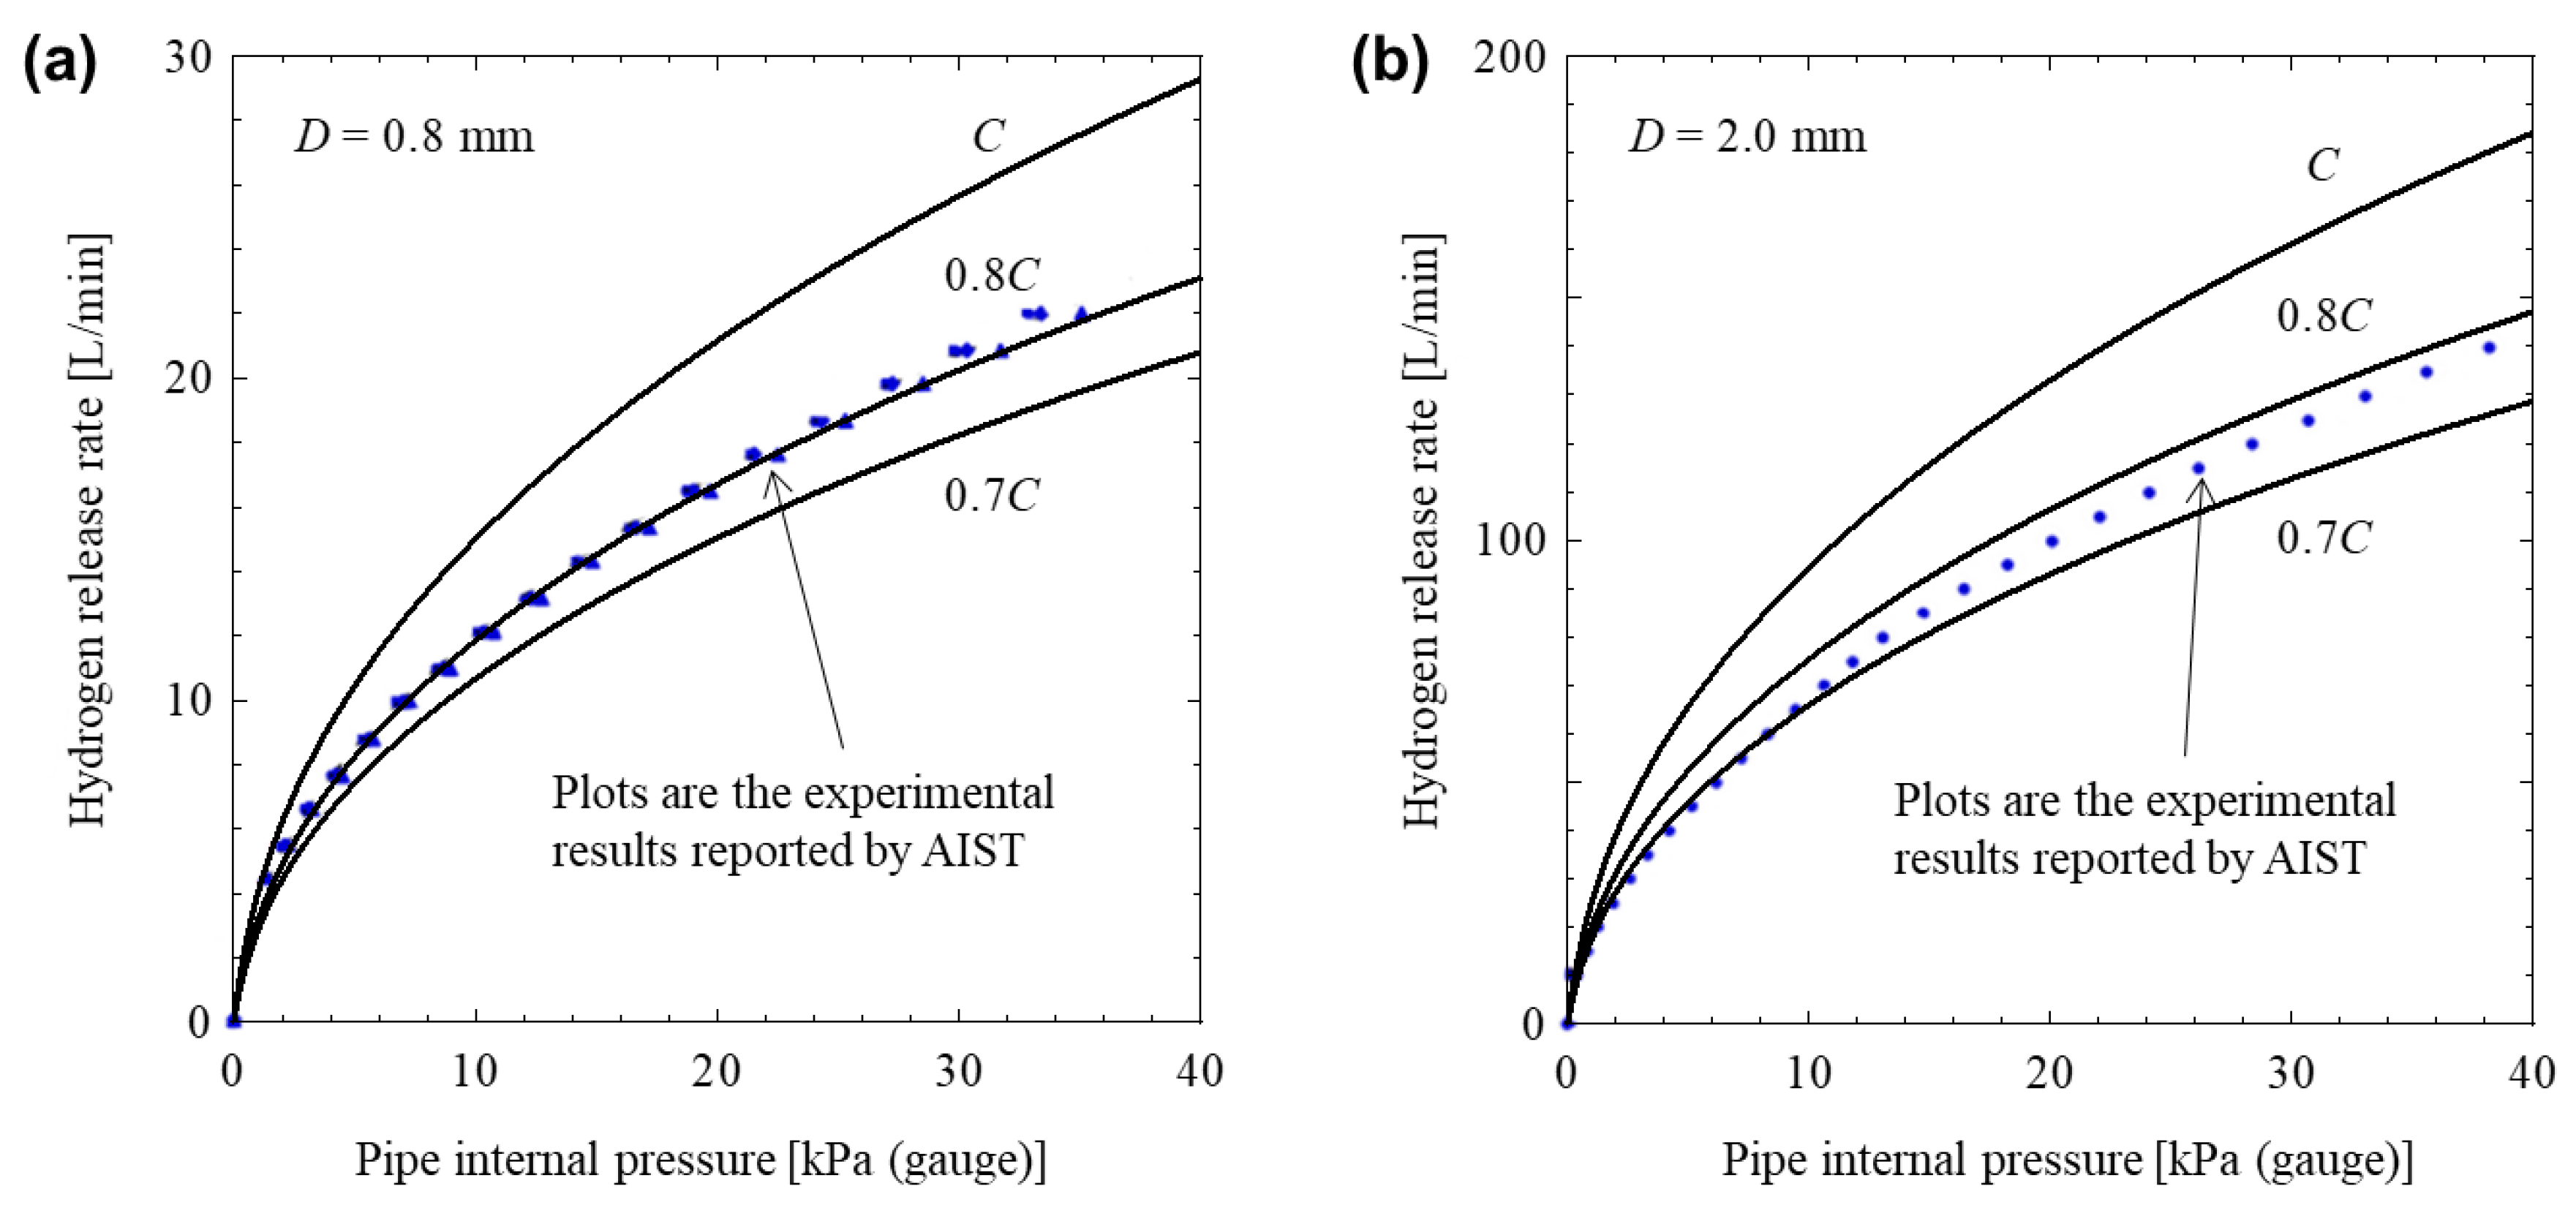
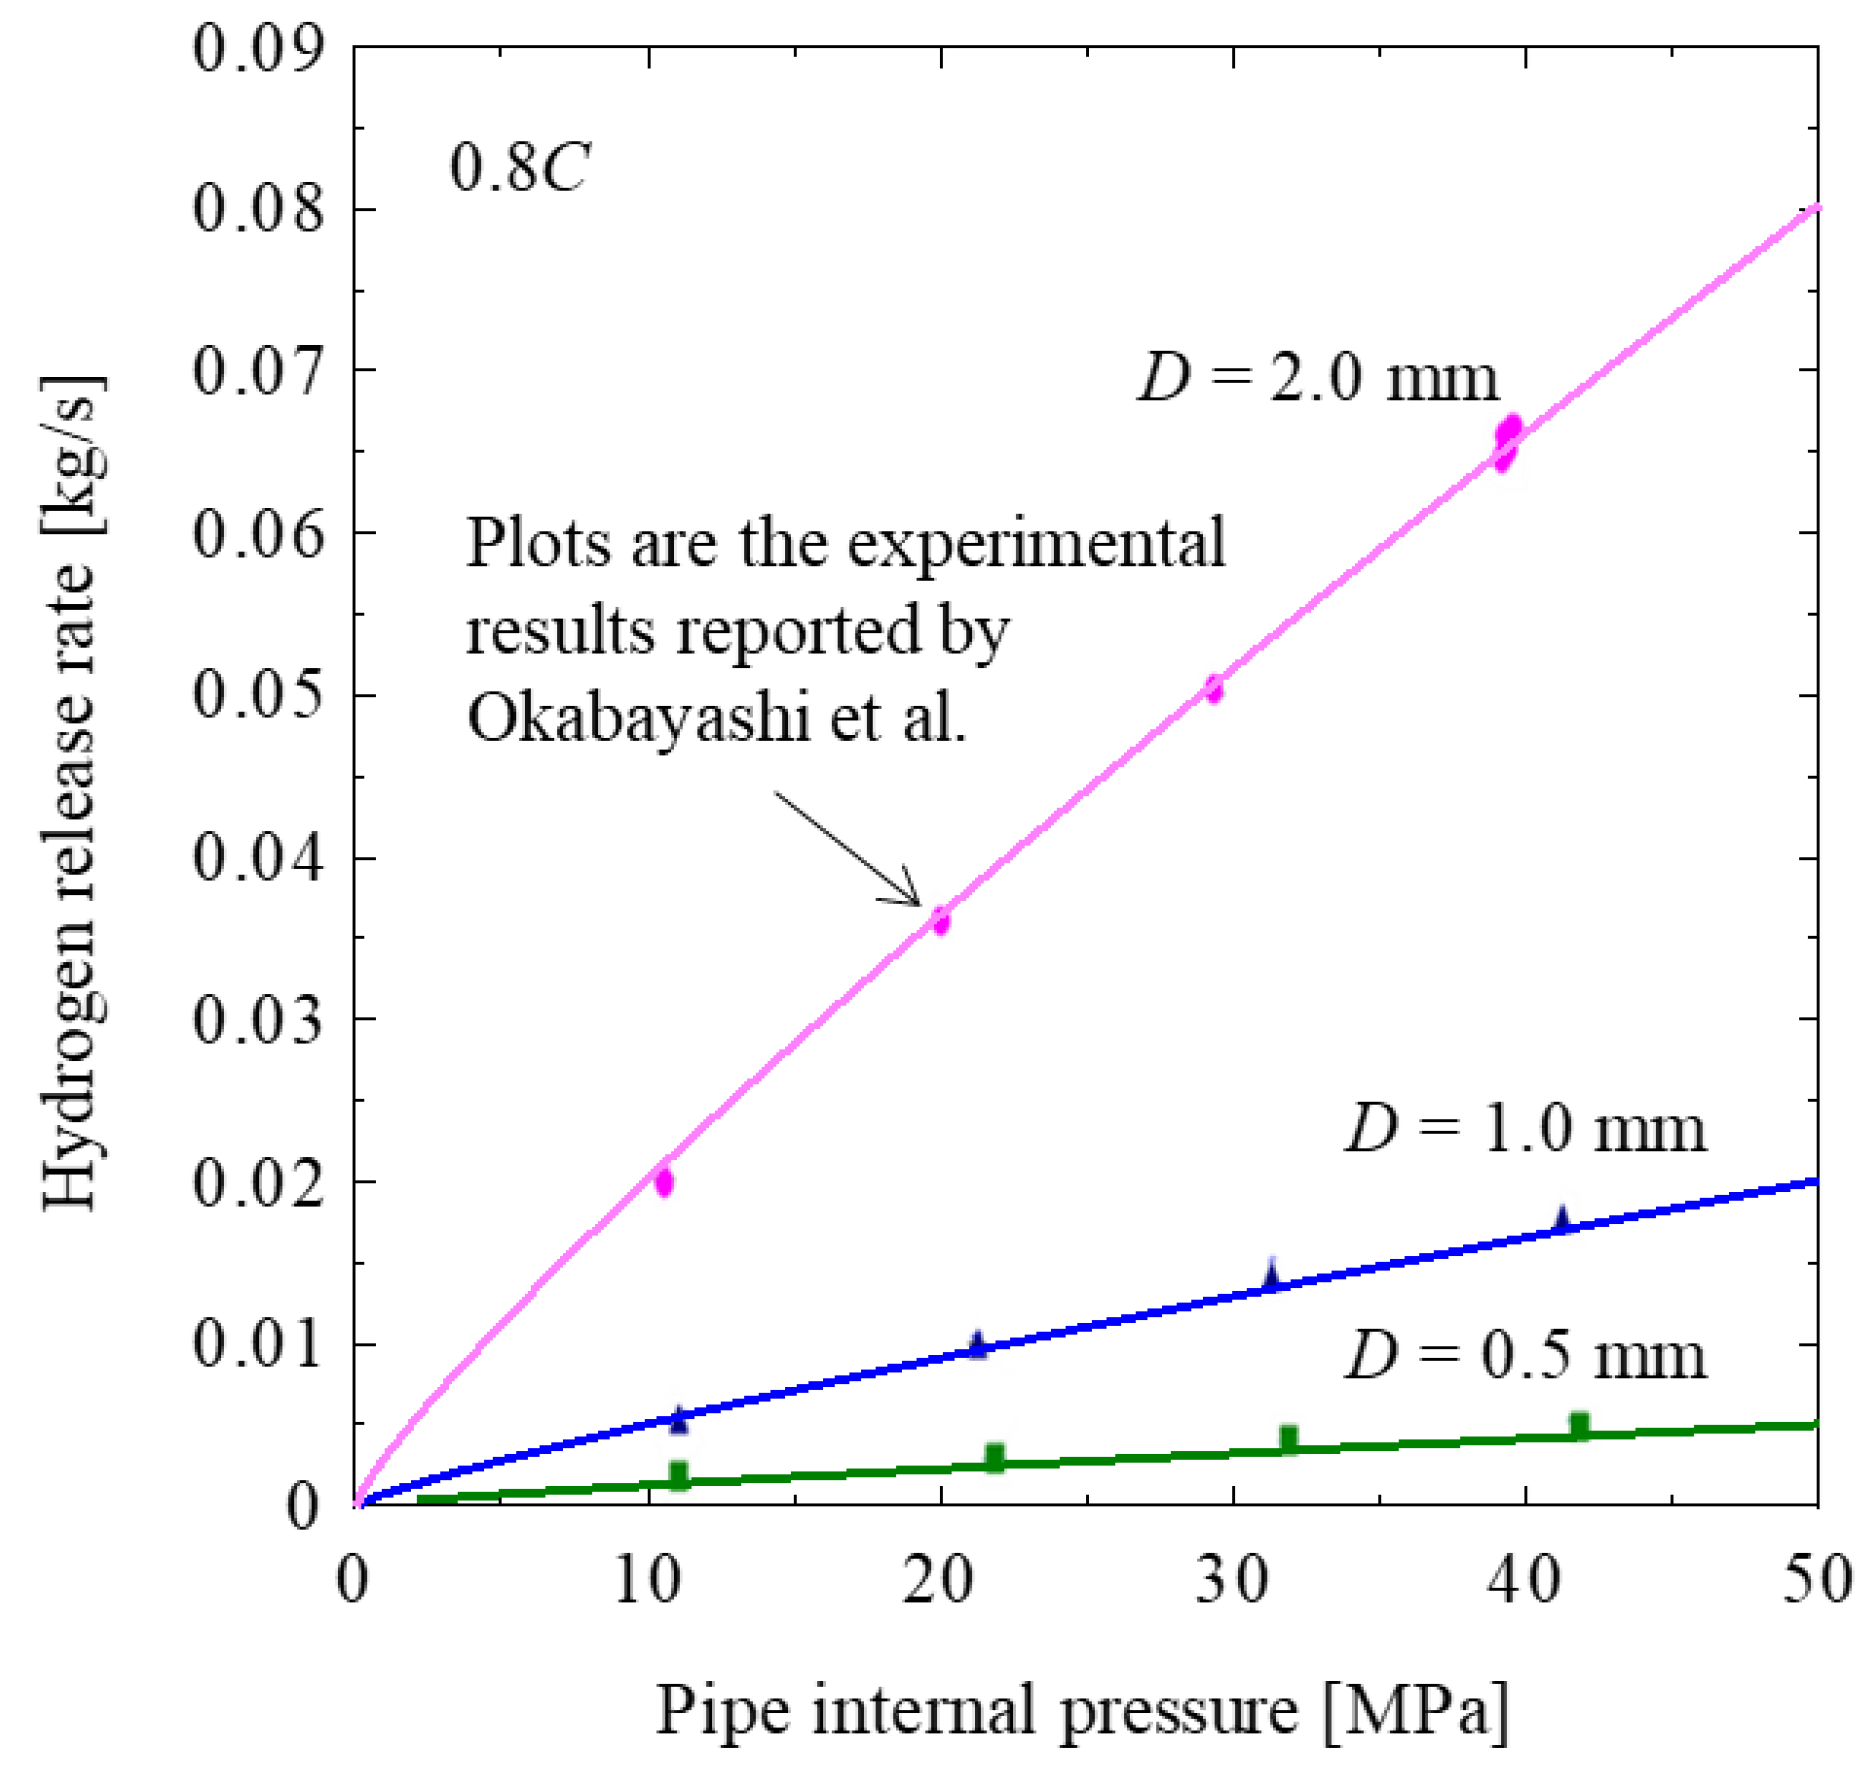
2.3. Leakage Model
m = C∙p1∙ρn∙√(Tn/T1)∙√(R1/Rn)∙√{1 − (p2/p1 − b)2/(1 − b)2} for p2/p1 > b
- m: Mass flow rate [kg/s].
- C: Sonic conductance [m3/Pa·s].
- ρn: Density of standard condition, 0.0899 [kg/m3] (const.).
- p1: Inlet pressure [Pa].
- p2: Outlet pressure, 101,325 [Pa] (const.).
- Tn: Temperature of standard condition, 293.15 [K] (const.).
- T1: Temperature of hydrogen gas [K].
- Rn: Gas constant of standard condition, 4120 [J/(kg·K)] (const.).
- R1: Gas constant [J/(kg·K)].
- b: Critical pressure ratio, 0.528 (const.).
2.3.1. Subsonic Flow
2.3.2. Choked Flow
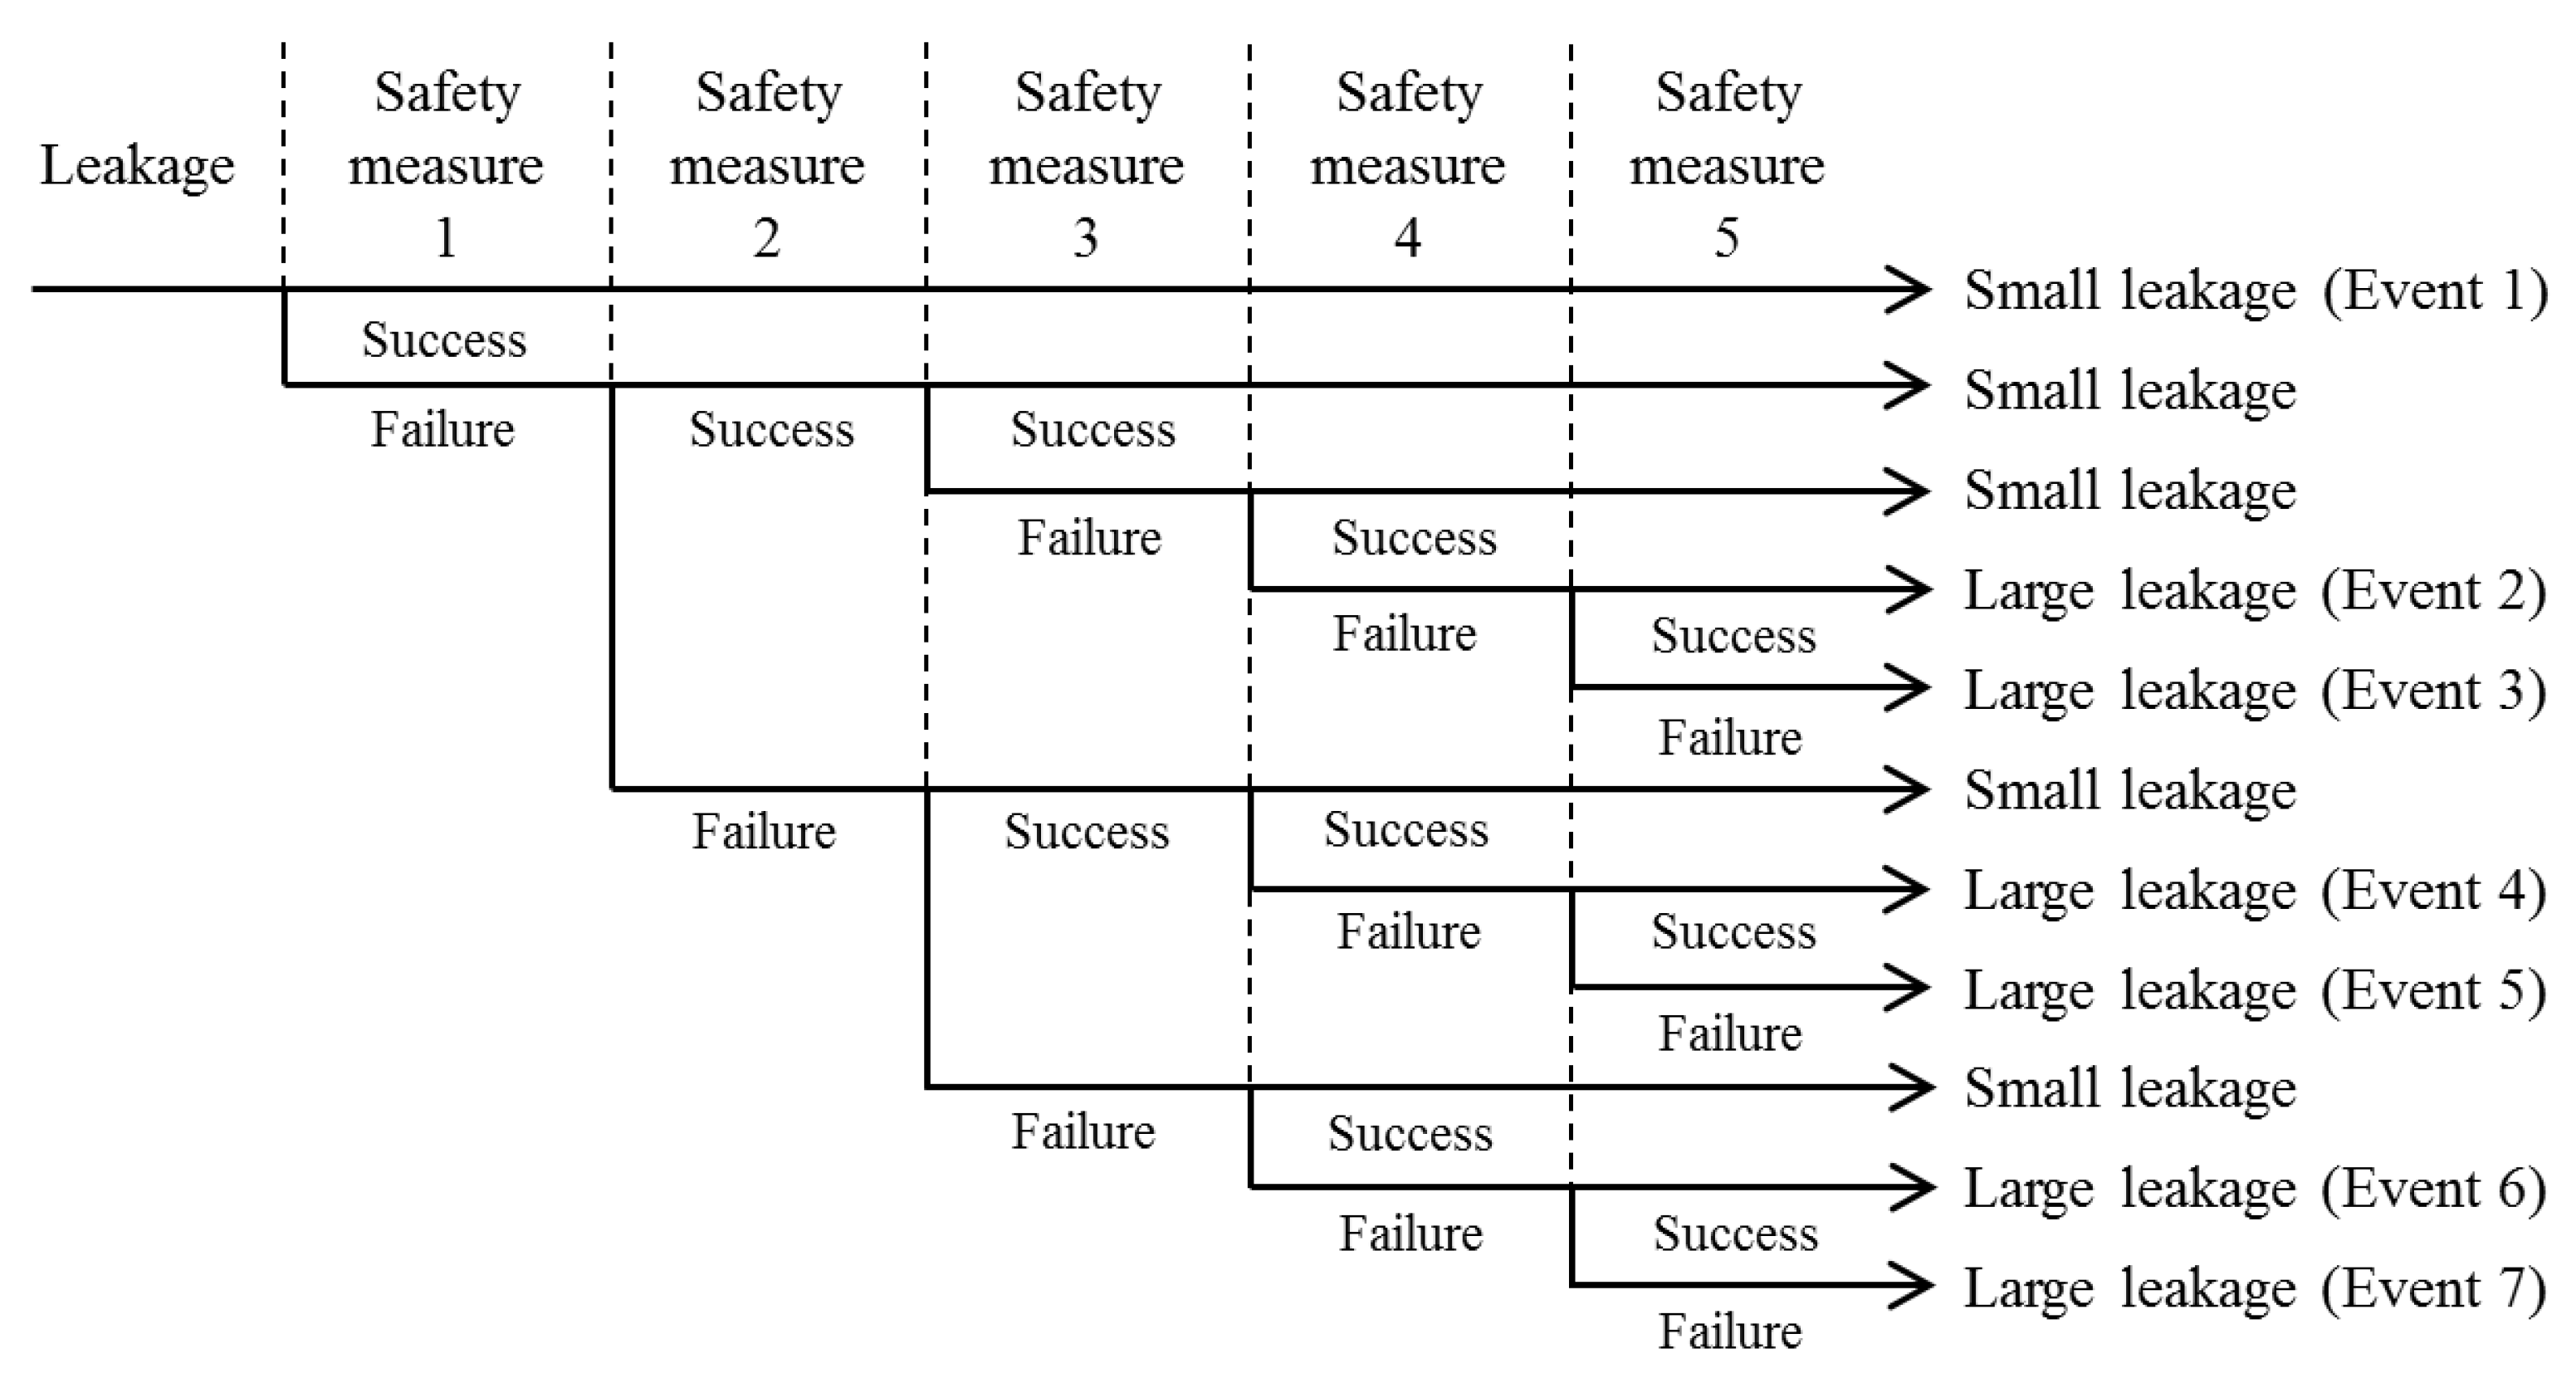
3. Evaluation of Safety Measures in the Event of Accidents
- Determination of initial event;
- Identification of effective safety measures against the initial event;
- Creation of event tree diagram using initial event and safety measures;
- Calculation of hydrogen-release rate of each event using physical model; and
- Evaluation of safety measures using RSM.
- Determination of initial event;
- Identification of effective safety measures against the initial event;
- Creation of design matrix of DOE;
- Calculation of hydrogen-release rate of events using physical model; and
- Evaluation of safety measures using RSM.
4. Results and Discussion
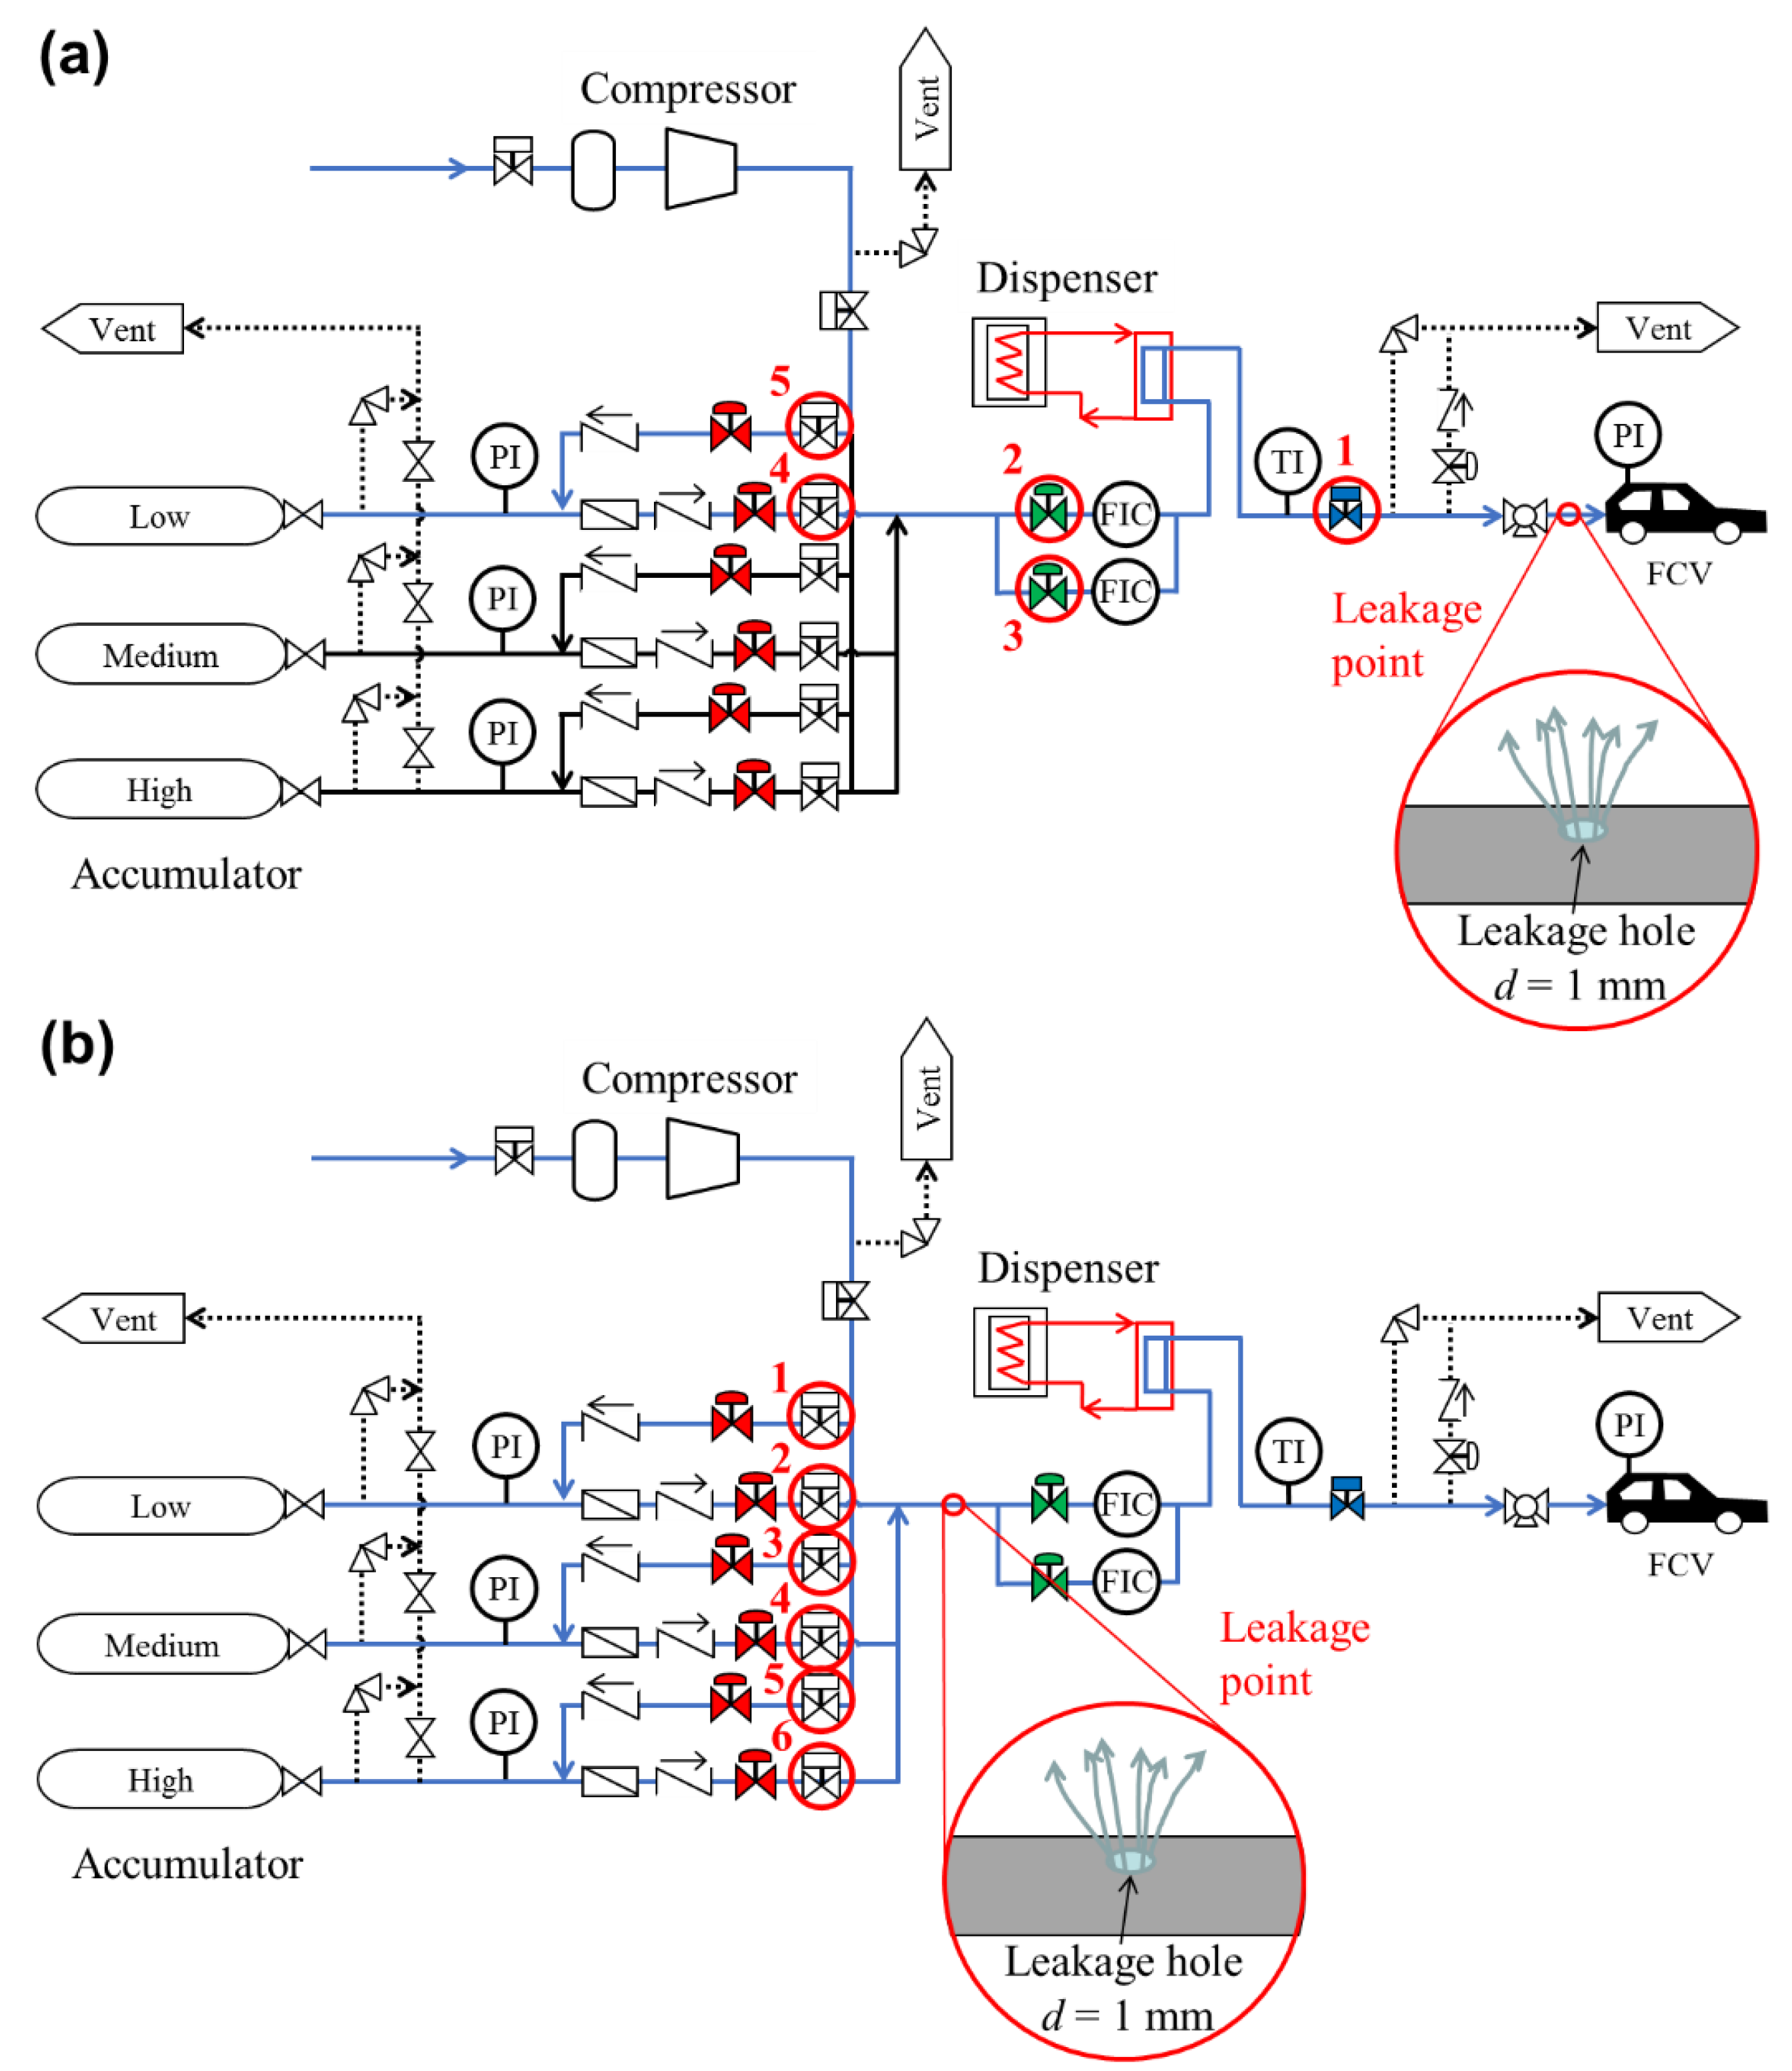
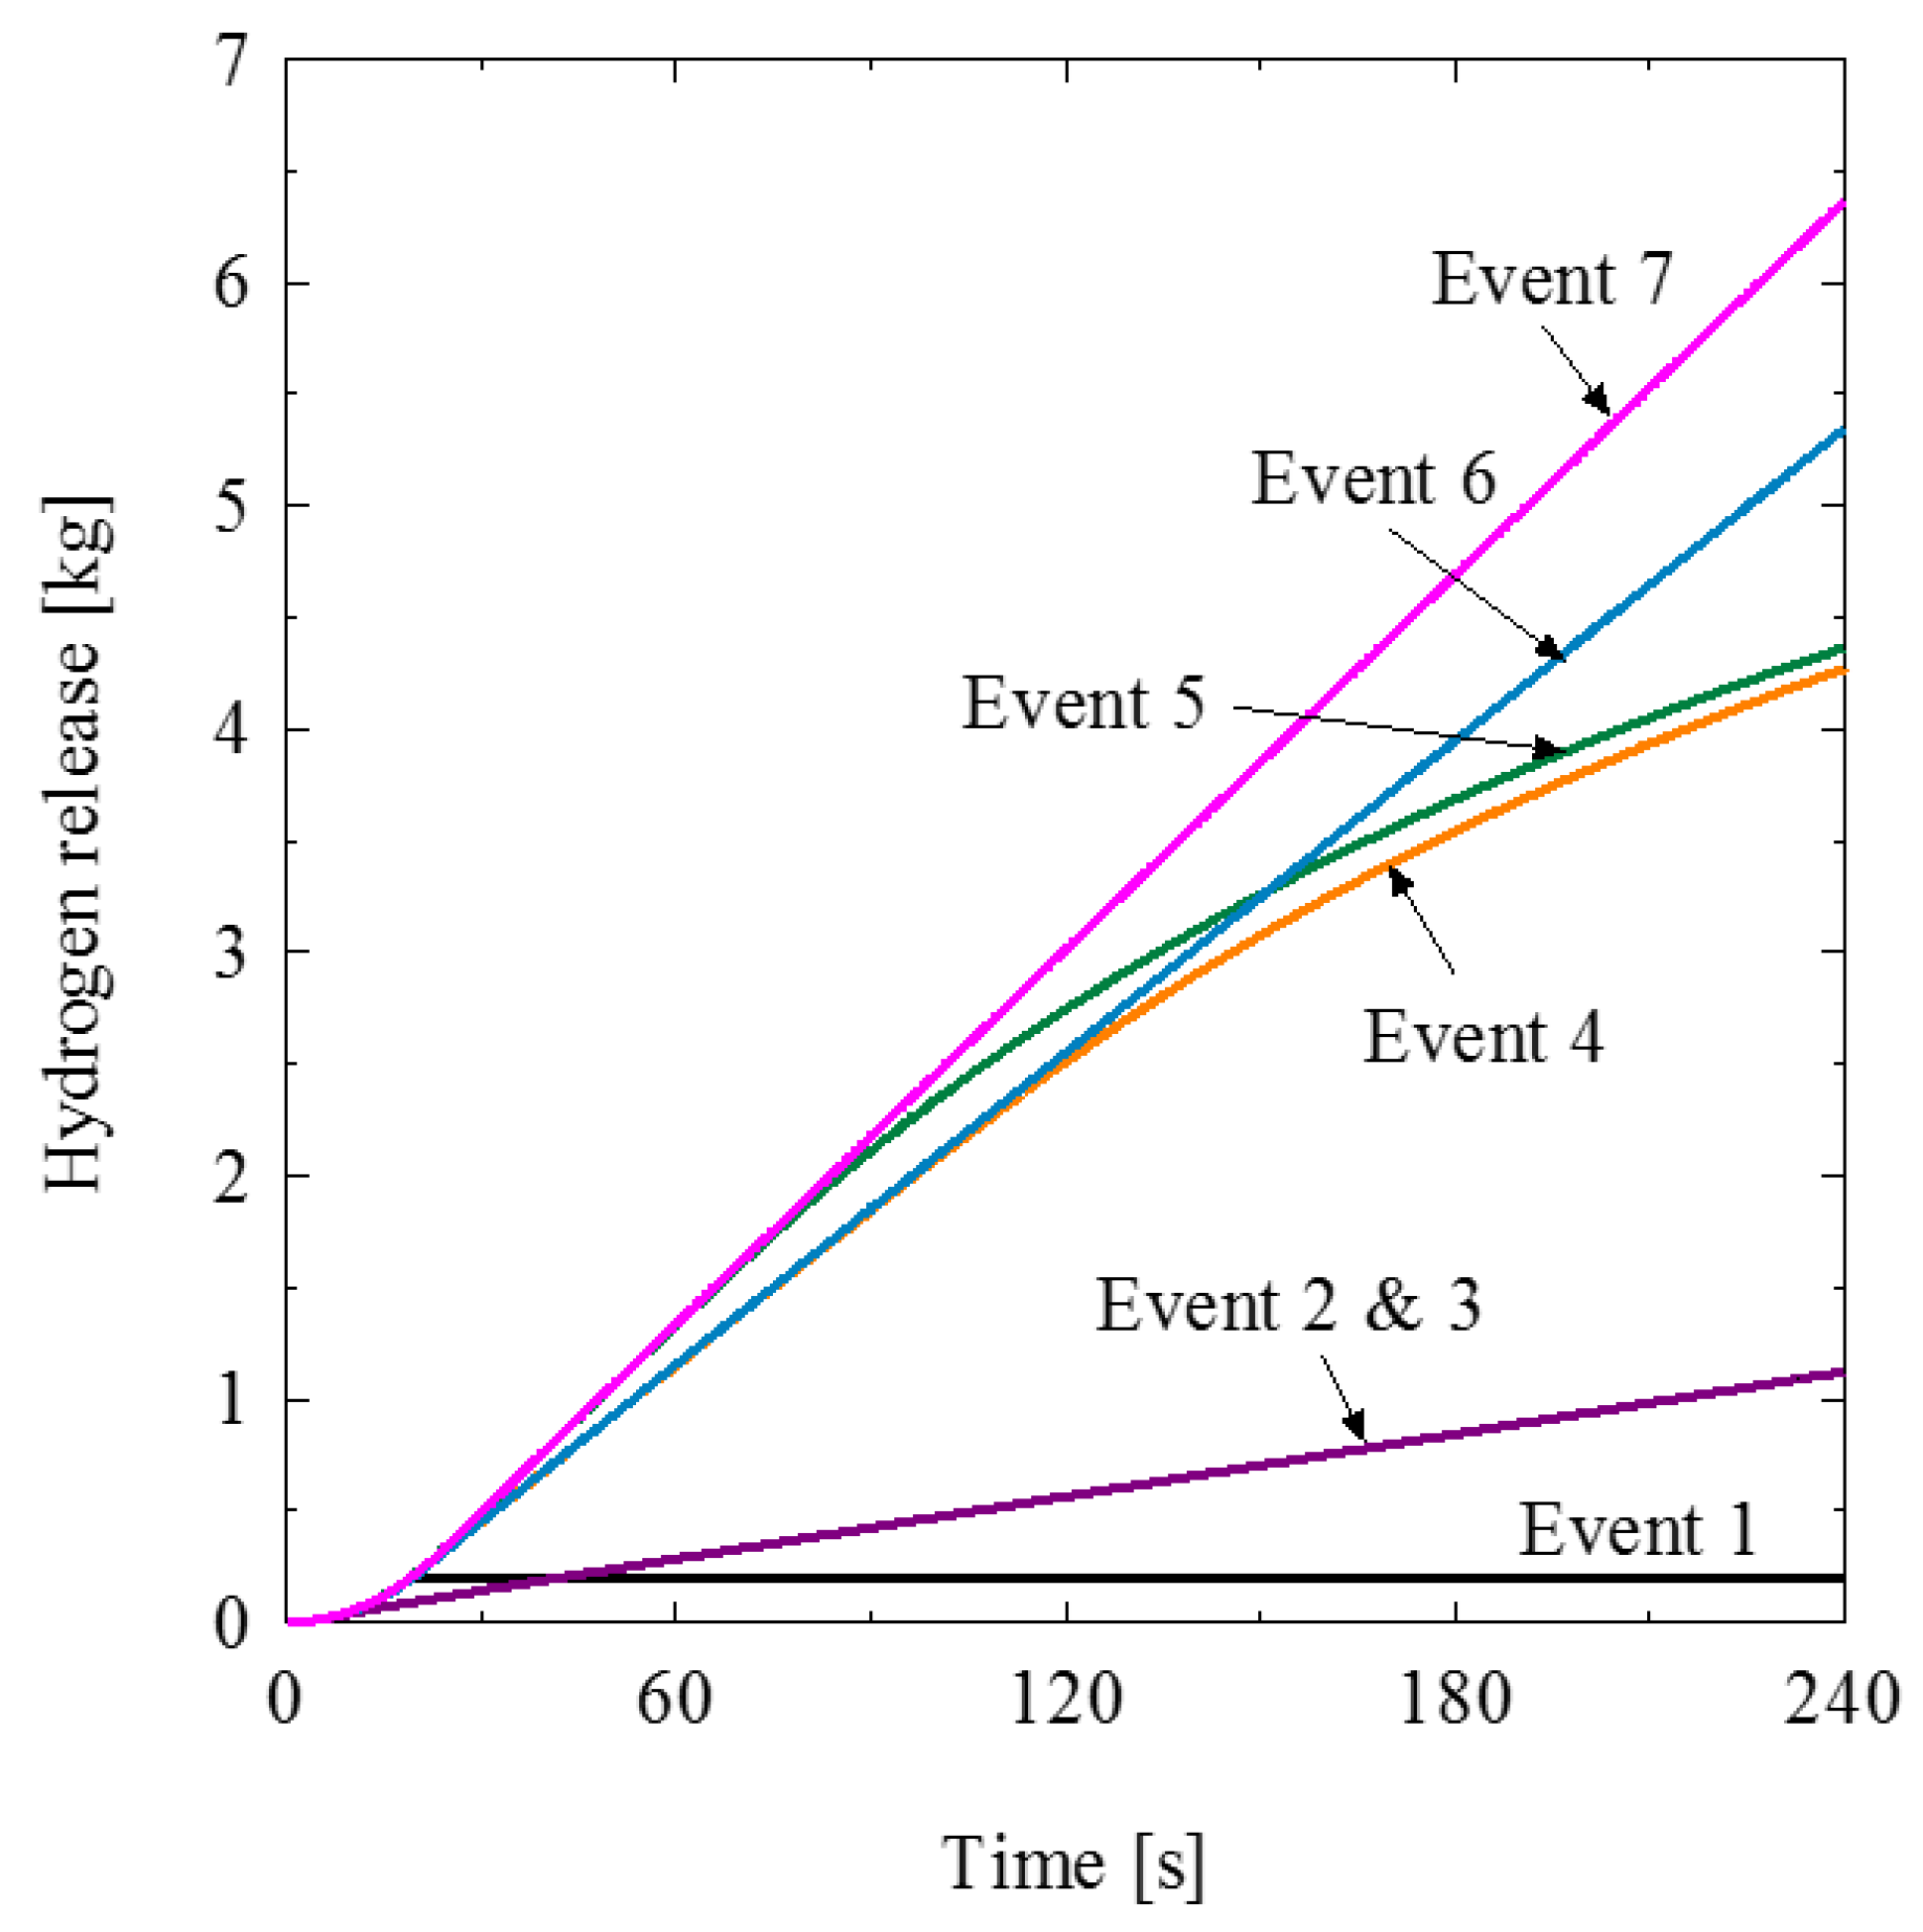
4.1. Results of Safety Measures for Accidents Arranged in Series
- y: Amount of hydrogen released in 240 s [kg].
- x1: Function of overfill preventing valve (safety measure No. 1 in Figure 9a) (0: Success, 1: Failure).
- x2: Function of flow control valve (high flow rate) (safety measure No. 2 in Figure 9a) (0: Success, 1: Failure).
- x3: Function of flow control valve (low flow rate) (safety measure No. 3 in Figure 9a) (0: Success, 1: Failure).
- x4: Function of isolation valve (compressor—dispenser) (safety measure No. 4 in Figure 9a) (0: Success, 1: Failure).
- x5: Function of isolation valve (compressor—accumulator) (safety measure No. 5 in Figure 9a) (0: Success, 1: Failure).
- An: Coefficient
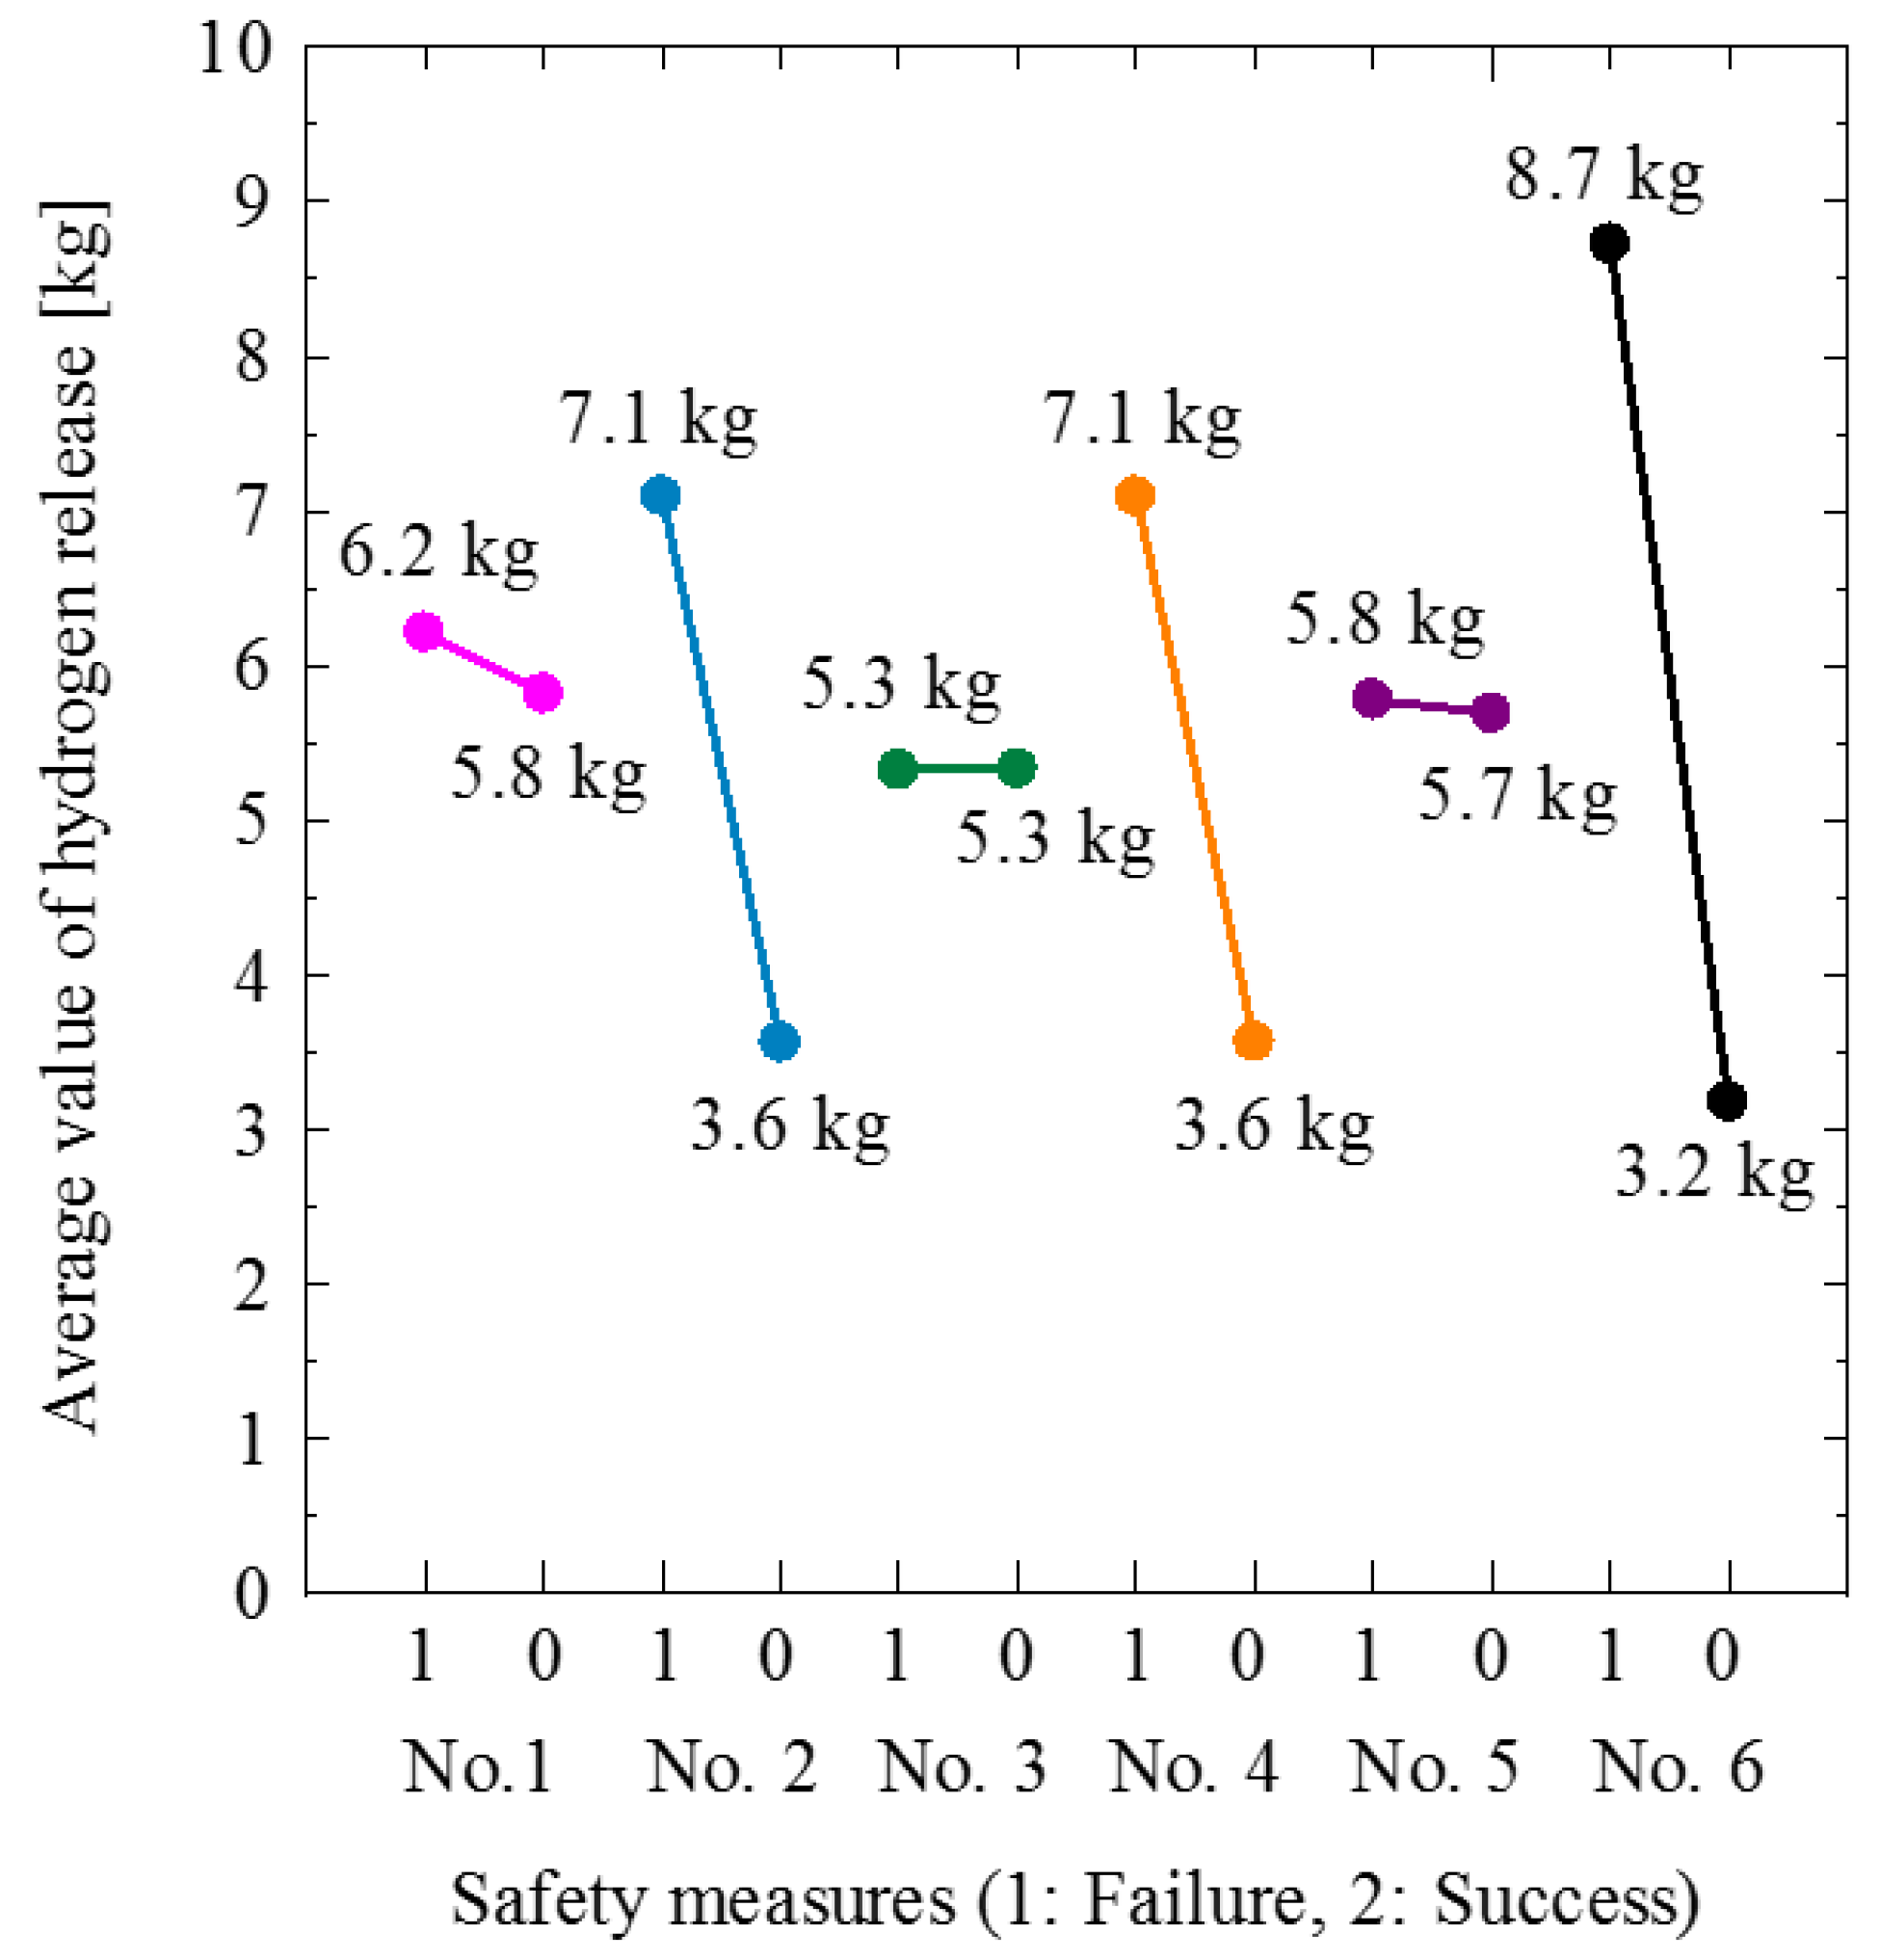
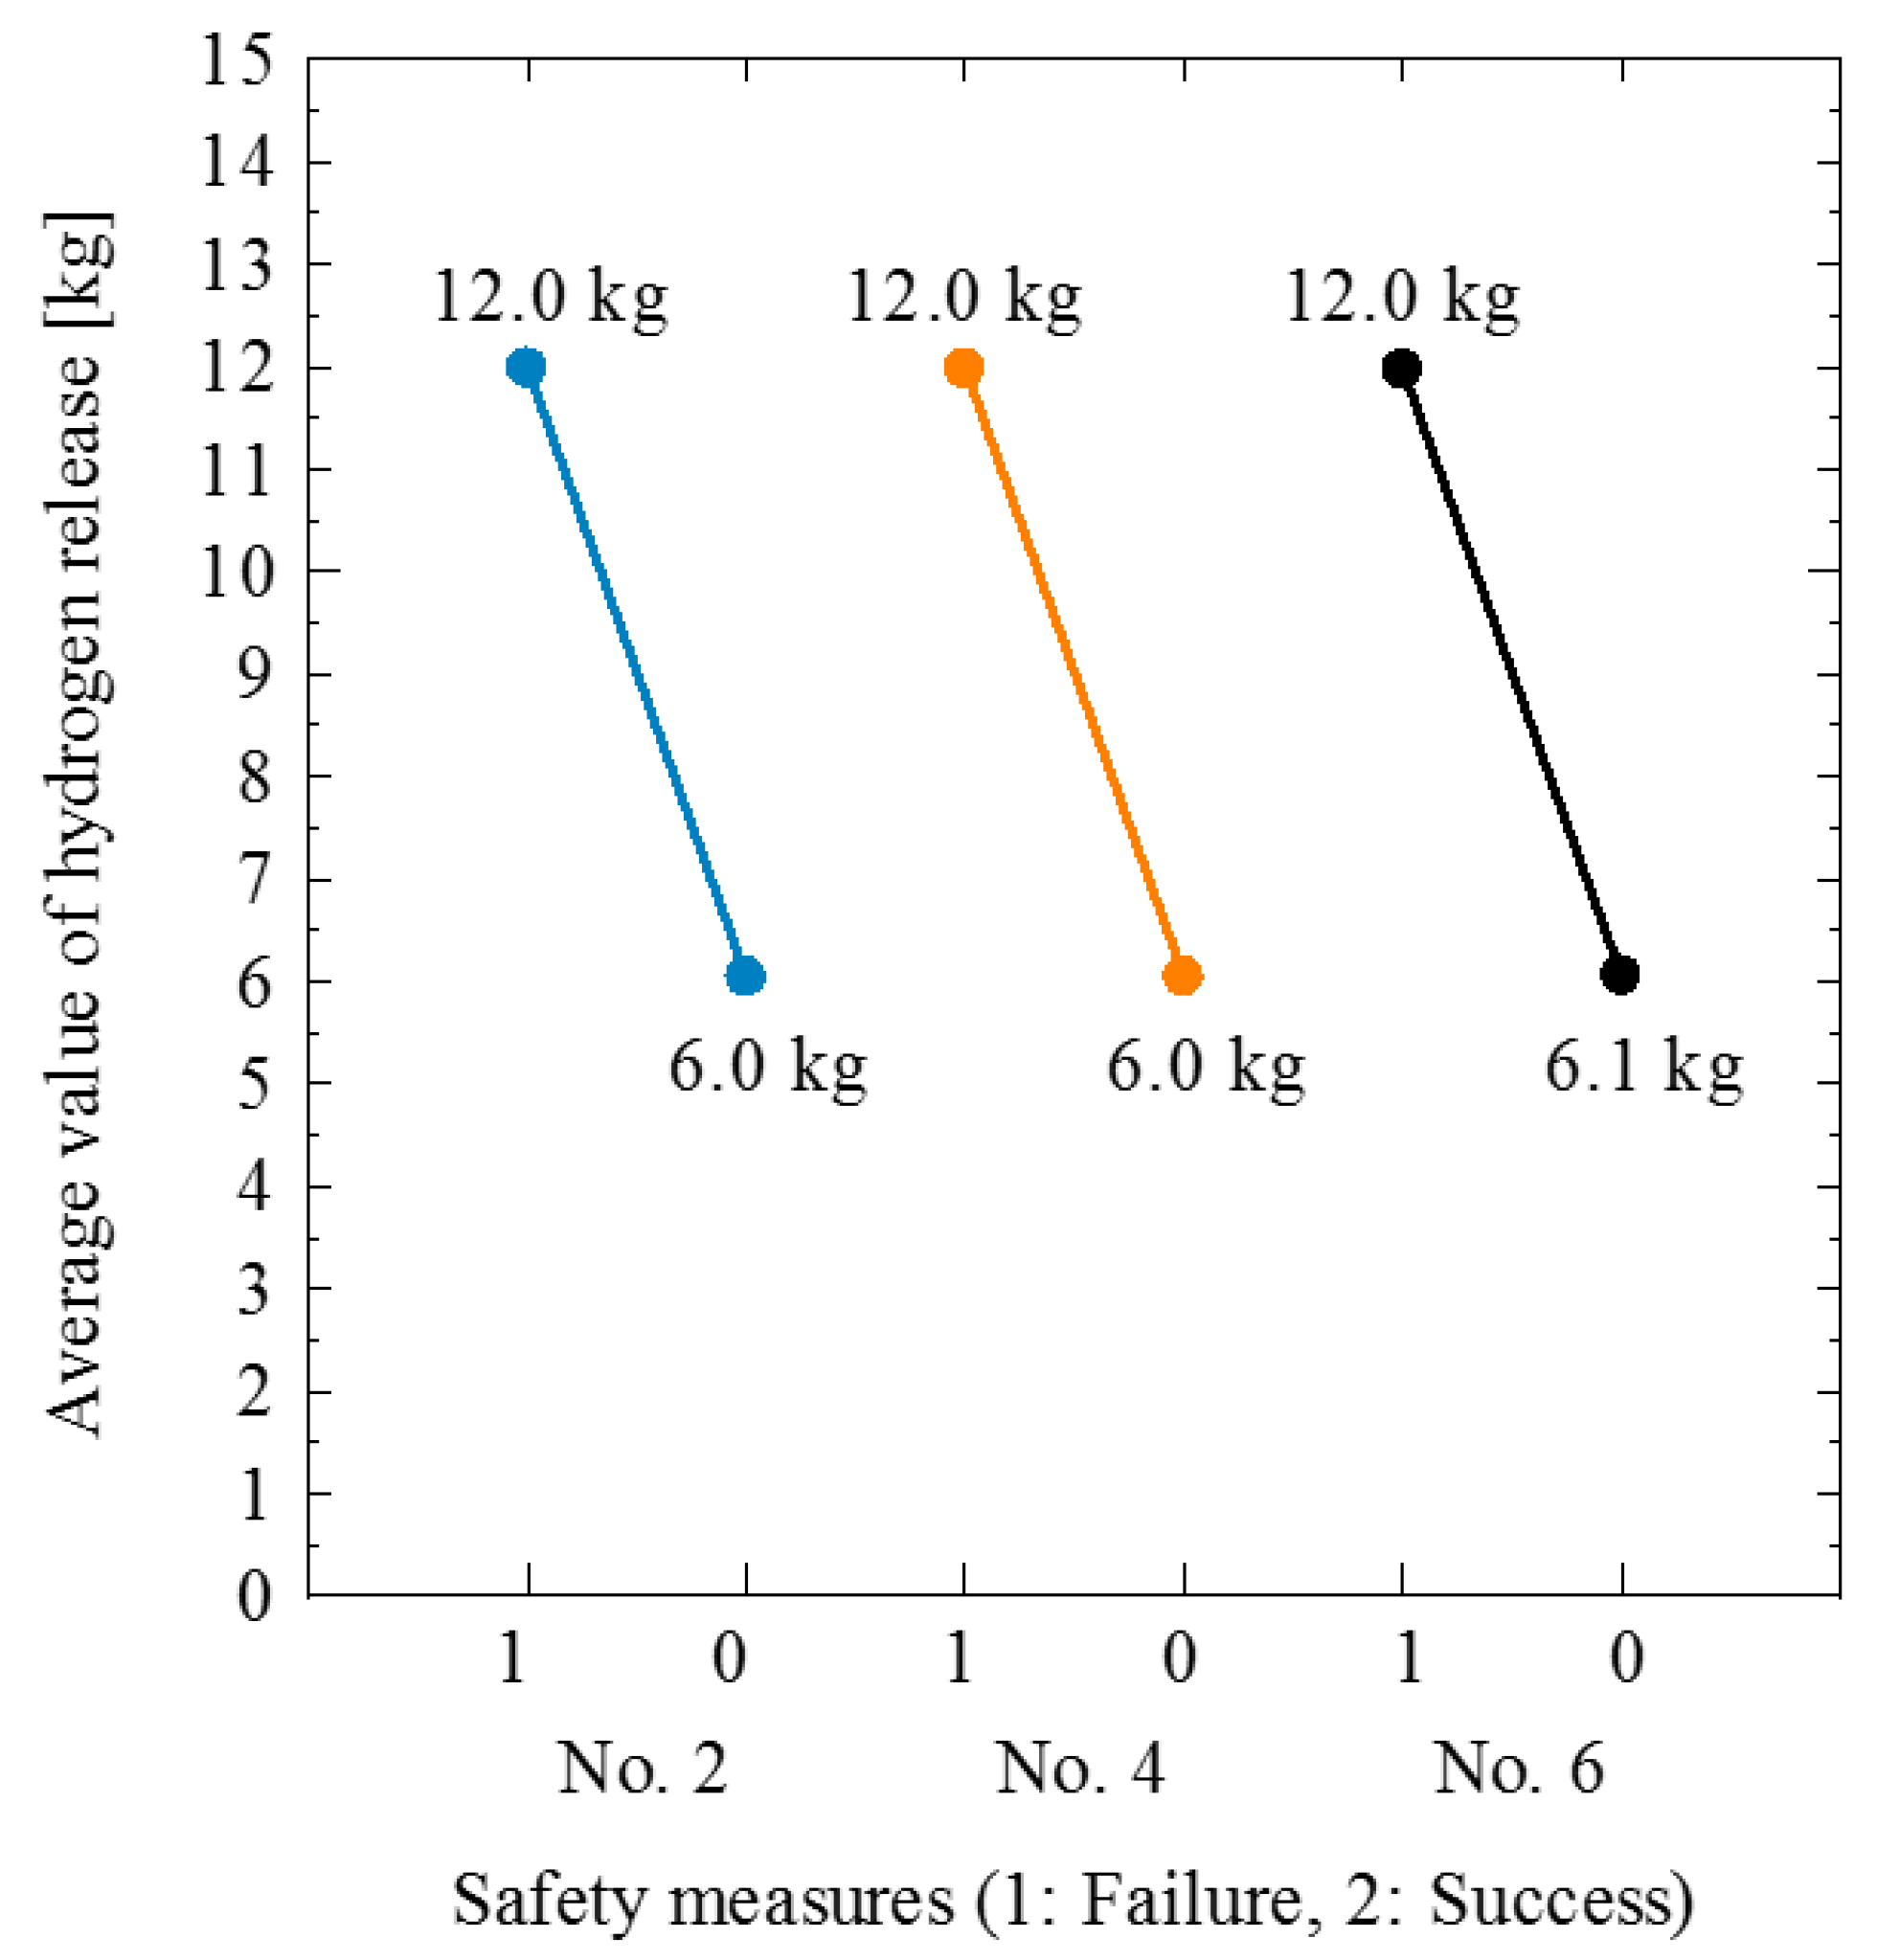
4.2. Results of Safety Measures for Accidents Arranged in Parallel
5. Conclusions
Author Contributions
Funding
Conflicts of Interest
References
- Alazemi, J.; Andrews, J. Automotive hydrogen fueling stations: An international review. Renew. Sustain. Energy Rev. 2015, 48, 483–499. [Google Scholar] [CrossRef]
- Sakamoto, J.; Sato, R.; Nakayama, J.; Kasai, N.; Shibutani, T.; Miyake, A. Leakage-type-based analysis of accidents involving hydrogen fueling stations in Japan and USA. Int. J. Hydrogen Energy 2016, 41, 21564–21570. [Google Scholar] [CrossRef]
- Nakayama, J.; Sakamoto, J.; Kasai, N.; Shibutani, T.; Miyake, A. Risk assessment for a gas and liquid hydrogen fueling station. In Proceedings of the 49th Annual Loss Prevention Symposium 2015, LPS 2015—Topical Conference at the AIChE Spring Meeting and 11th Global Congress on Process Safety, Austin, TX, USA, 27 April 2015; pp. 138–150. [Google Scholar]
- Nakayama, J.; Sakamoto, J.; Kasai, N.; Shibutani, T.; Miyake, A. Preliminary hazard identification for qualitative risk assessment on a hybrid gasoline-hydrogen fueling station with an on-site hydrogen production system using organic chemical hydride. Int. J. Hydrogen Energy 2016, 41, 7518–7525. [Google Scholar] [CrossRef]
- Mousavi, J.; Parvini, M. Analyzing effective factors on leakage-induced hydrogen fires. J. Loss Prev. Process Ind. 2016, 40, 29–42. [Google Scholar] [CrossRef]
- Liu, Y.L.; Zheng, Y.Y.; Xu, P.; Zhao, Y.Z.; Bie, H.Y.; Chen, H.G.; Dryver, H. Numerical simulation on the diffusion of hydrogen due to high pressured storage tanks failure. J. Loss Prev. Process Ind. 2009, 22, 265–270. [Google Scholar] [CrossRef]
- Cheng, Z.; Agranat, V.M.; Tchouvelev, A.V. PRD hydrogen release and dispersion, a comparison of CFD results obtained from using ideal and real gas law properties. In Proceedings of the 1st International Conference on Hydrogen Safety, Pisa, Italy, 8–10 September 2005. [Google Scholar]
- Matthijsen, A.; Kooi, E.S. Safety distances for hydrogen filling stations. J. Loss Prev. Process Ind. 2006, 19, 719–723. [Google Scholar] [CrossRef]
- Li, Z.; Pan, X.; Ma, J. Quantitative risk assessment on a gaseous hydrogen refueling station in Shanghai. Int. J. Hydrogen Energy 2010, 35, 6822–6829. [Google Scholar] [CrossRef]
- Li, Z.; Pan, X.; Ma, J. Quantitative risk assessment on 2010 Expo hydrogen station. Int. J. Hydrogen Energy 2011, 36, 4079–4086. [Google Scholar] [CrossRef]
- Sun, K.; Pan, X.; Li, Z.; Ma, J. Risk analysis on mobile hydrogen refueling stations in Shanghai. Int. J. Hydrogen Energy 2014, 39, 20411–20419. [Google Scholar] [CrossRef]
- Groth, K.M.; Hecht, E.S. HyRAM: A methodology and toolkit for quantitative risk assessment of hydrogen systems. Int. J. Hydrogen Energy 2017, 42, 7485–7493. [Google Scholar] [CrossRef]
- Mohammadfam, I.; Zarei, E. Safety risk modeling and major accidents analysis of hydrogen and natural gas releases: A comprehensive risk analysis framework. Int. J. Hydrogen Energy 2015, 40, 13653–13663. [Google Scholar] [CrossRef]
- Skjold, T.; Siccama, D.; Hisken, H.; Brambilla, A.; Middha, P.; Groth, K.M.; LaFleur, A.C. 3D risk management for hydrogen installations. Int. J. Hydrogen Energy 2017, 42, 7721–7730. [Google Scholar] [CrossRef]
- Ministry of Economy, Trade, and Industry (METI). Report of the Investigation of Hydrogen Leakage and Diffusion Behaviors. 2012. Available online: http://www.meti.go.jp/meti_lib/report/2012fy/E002061.pdf (accessed on 23 October 2018). (In Japanese).
- Okabayashi, K.; Hirashima, H.; Nonaka, T.; Sakata, N.; Kouchi, A. Japan Petroleum Energy Center (JPEC), Report of the Research and Development of the Diffusion Behaviors of High-Pressure Hydrogen Gas and Liquid Hydrogen (A project Commissioned by the New Energy and Industrial Technology Development Organization (NEDO)). 2004. Available online: http://www.pecj.or.jp/japanese/report/2004report/04sin2-2-1-04.pdf (accessed on 23 October 2018). (In Japanese).
- Tanaka, T.; Azuma, T.; Evans, J.A.; Cronin, P.M.; Johnson, D.M.; Cleaver, R.P. Experimental study on hydrogen explosions in a full-scale hydrogen filling station model. Int. J. Hydrogen Energy 2007, 32, 2162–2170. [Google Scholar] [CrossRef]
- Hall, J.E.; Hooker, P.; O’Sullivan, L.; Angers, B.; Hourri, A.; Bernard, P. Flammability profiles associated with high-pressure hydrogen jets released in close proximity to surfaces. Int. J. Hydrogen Energy 2017, 42, 7413–7421. [Google Scholar] [CrossRef]
- Mogi, T.; Horiguchi, S. Experimental study on the hazards of high-pressure hydrogen jet diffusion flames. J. Loss Prev. Process Ind. 2009, 22, 45–51. [Google Scholar] [CrossRef]
- Reddi, K.; Elgowainy, A.; Sutherland, E. Hydrogen refueling station compression and storage optimization with tube-trailer deliveries. Int. J. Hydrogen Energy 2014, 39, 19169–19181. [Google Scholar] [CrossRef]
- Immel, R.; Mark-Gardner, A. Development and validation of a numerical thermal simulation model for compressed hydrogen gas storage tanks. SAE Int. J. Eng. 2011, 4, 1850–1861. [Google Scholar] [CrossRef]


| Safety Measure | Position | High Pressure Gas Safety Act |
|---|---|---|
| Isolation valve | Compressor—accumulator | Article 7-3, paragraph 2, item 5 |
| Isolation valve | Compressor—accumulator Accumulator—dispenser | Article 7-3, paragraph 2, item 7 |
| Isolation valve | Dispenser | Article 7-3, paragraph 2, item 8 |
| Pressure relief valve | Accumulator Dispenser | Article 7-3, paragraph 2, item 10 |
| Overflow preventing valve | Accumulator—dispenser | Article 7-3, paragraph 2, item 12 |
| Overfill preventing valve | Dispenser | Article 7-3, paragraph 2, item 28 |
| Non-return valve | Compressor—accumulator Accumulator—dispenser | Article 7-3, paragraph 2, item 34 |
| Safety valve | Accumulator | Article 7-3, paragraph 2, item 35 |
| Analysis Conditions | Diameter of Leakage Hole [mm] | Sonic Conductance [L/(bar·s)] | Modified Sonic Conductance [L/(bar·s)] | Critical Pressure Ratio |
|---|---|---|---|---|
| No. 1 | 0.5 | 0.15 | 0.12 | 0.528 |
| No. 2 | 0.8 | 0.38 | 0.30 | 0.528 |
| No. 3 | 1 | 0.60 | 0.48 | 0.528 |
| No. 4 | 2 | 2.39 | 1.91 | 0.528 |
| No. | Safety Measure | Function |
|---|---|---|
| 1 | Overfill preventing valve | Isolation |
| 2 | Flow control valve (high flow rate) | Isolation |
| 3 | Flow control valve (low flow rate) | Isolation |
| 4 | Isolation valve (compressor—dispenser) | Isolation |
| 5 | Isolation valve (compressor—accumulator) | Prevention of boost |
| x1x2x4 | x1x2x4x5 | x1x3x4 | x1x3x4x5 | Hydrogen Released in 240 s [kg] | |
|---|---|---|---|---|---|
| Event 1 | 0 | 0 | 0 | 0 | 0.20 |
| Event 2 | 0 | 0 | 1 | 0 | 1.12 |
| Event 3 | 0 | 0 | 1 | 1 | 1.12 |
| Event 4 | 1 | 0 | 0 | 0 | 4.27 |
| Event 5 | 1 | 1 | 0 | 0 | 5.35 |
| Event 6 | 1 | 0 | 1 | 0 | 4.37 |
| Event 7 | 1 | 1 | 1 | 1 | 6.37 |
| Bn | Standard Error | t | p-Value | Lower 95% | Higher 95% | |
|---|---|---|---|---|---|---|
| Intercept | 0.56 (=B5) | 0.46 | 1.22 | 0.44 | −5.29 | 6.41 |
| x1x2x4 | 3.56 (=B1) | 0.43 | 8.20 | 0.077 | −1.95 | 9.07 |
| x1x2x4x5 | 1.39 (=B2) | 0.43 | 3.20 | 0.19 | −4.12 | 6.90 |
| x1x3x4 | 0.41 (=B3) | 0.43 | 0.94 | 0.52 | −5.10 | 5.92 |
| x1x3x4x5 | 0.31 (=B4) | 0.43 | 0.71 | 0.61 | −5.20 | 5.82 |
| No. | Safety Measure | Function |
|---|---|---|
| 1 | Isolation valve (Compressor—low-pressure accumulator) | Prevention of boost |
| 2 | Isolation valve (low-pressure accumulator—dispenser) | Isolation |
| 3 | Isolation valve (Compressor—middle-pressure accumulator) | Prevention of boost |
| 4 | Isolation valve (middle-pressure accumulator—dispenser) | Isolation |
| 5 | Isolation valve (Compressor—high-pressure accumulator) | Prevention of boost |
| 6 | Isolation valve (high-pressure accumulator—dispenser) | Isolation |
| Analysis Condition No. | Safety Measure No. 1 | Safety Measure No. 2 | Safety Measure No. 3 | Safety Measure No. 4 | Safety Measure No. 5 | Safety Measure No. 6 | Analysis Results: Hydrogen Released in 240 s [kg] |
|---|---|---|---|---|---|---|---|
| 1 | 1 | 1 | 1 | 1 | 1 | 1 | 11.8 |
| 2 | 1 | 1 | 1 | 1 | 1 | 0 | 10.0 |
| 3 | 1 | 1 | 0 | 0 | 0 | 1 | 9.39 |
| 4 | 1 | 0 | 1 | 0 | 0 | 1 | 3.11 |
| 5 | 1 | 0 | 0 | 1 | 0 | 0 | 3.08 |
| 6 | 1 | 0 | 0 | 0 | 1 | 0 | 0.01 |
| 7 | 0 | 1 | 0 | 0 | 1 | 1 | 9.37 |
| 8 | 0 | 1 | 0 | 1 | 0 | 0 | 6.13 |
| 9 | 0 | 1 | 1 | 0 | 0 | 0 | 3.08 |
| 10 | 0 | 0 | 0 | 1 | 1 | 1 | 9.37 |
| 11 | 0 | 0 | 1 | 0 | 1 | 0 | 0.01 |
| 12 | 0 | 0 | 1 | 1 | 0 | 1 | 9.38 |
| Coefficient | Standard Error | t | p-Value | Lower 95% | Higher 95% | |
|---|---|---|---|---|---|---|
| Intercept | −0.93 | 1.10 | −0.84 | 0.44 | −3.8 | 1.9 |
| No. 1 | −0.0076 | 0.83 | −0.0092 | 0.99 | −2.1 | 2.1 |
| No. 2 | 4.1 | 0.83 | 5.0 | 0.0043 | 2.0 | 6.3 |
| No. 3 | −0.010 | 0.83 | −0.013 | 0.99 | −2.1 | 2.1 |
| No. 4 | 4.1 | 0.83 | 4.9 | 0.0043 | 2.0 | 6.3 |
| No. 5 | 1.0 | 0.83 | 1.3 | 0.26 | −1.1 | 3.2 |
| No. 6 | 5.0 | 0.83 | 6.0 | 0.0018 | 2.9 | 7.2 |
| Analysis Condition No. | Safety Measure No. 2 | Safety Measure No. 4 | Safety Measure No. 6 | Analysis Results: Hydrogen Released in 240 s [kg] |
|---|---|---|---|---|
| 1 | 1 | 1 | 1 | 17.8 |
| 2 | 1 | 1 | 0 | 12.1 |
| 3 | 1 | 0 | 1 | 12.0 |
| 4 | 1 | 0 | 0 | 6.1 |
| 5 | 0 | 1 | 1 | 12.0 |
| 6 | 0 | 1 | 0 | 6.1 |
| 7 | 0 | 0 | 1 | 6.1 |
| 8 | 0 | 0 | 0 | 0.01 |
© 2018 by the authors. Licensee MDPI, Basel, Switzerland. This article is an open access article distributed under the terms and conditions of the Creative Commons Attribution (CC BY) license (http://creativecommons.org/licenses/by/4.0/).
Share and Cite
Sakamoto, J.; Misono, H.; Nakayama, J.; Kasai, N.; Shibutani, T.; Miyake, A. Evaluation of Safety Measures of a Hydrogen Fueling Station Using Physical Modeling. Sustainability 2018, 10, 3846. https://doi.org/10.3390/su10113846
Sakamoto J, Misono H, Nakayama J, Kasai N, Shibutani T, Miyake A. Evaluation of Safety Measures of a Hydrogen Fueling Station Using Physical Modeling. Sustainability. 2018; 10(11):3846. https://doi.org/10.3390/su10113846
Chicago/Turabian StyleSakamoto, Junji, Hitoshi Misono, Jo Nakayama, Naoya Kasai, Tadahiro Shibutani, and Atsumi Miyake. 2018. "Evaluation of Safety Measures of a Hydrogen Fueling Station Using Physical Modeling" Sustainability 10, no. 11: 3846. https://doi.org/10.3390/su10113846
APA StyleSakamoto, J., Misono, H., Nakayama, J., Kasai, N., Shibutani, T., & Miyake, A. (2018). Evaluation of Safety Measures of a Hydrogen Fueling Station Using Physical Modeling. Sustainability, 10(11), 3846. https://doi.org/10.3390/su10113846