Article

Screening-Level Risk Assessment of a Hydrogen Refueling Station that Uses Organic Hydride

Research Institute of Science for Safety and Sustainability, National Institute of Advanced Industrial Science and Technology, Tsukuba, Ibaraki 305-8569, Japan
*
Author to whom correspondence should be addressed.
Sustainability 2018, 10(12), 4477; https://doi.org/10.3390/su10124477
Submission received: 31 October 2018 / Revised: 19 November 2018 / Accepted: 20 November 2018 / Published: 28 November 2018
(This article belongs to the Special Issue Assessment of Energy Accident Risks)

Abstract

:
This study involves a screening-level risk assessment of the impairment of human health and life related to hydrogen explosion and chemical release during the operation of a hydrogen refueling station (HRS) that uses organic hydride. First, twenty-one accident scenarios were identified involving the leakage of hydrogen, toluene and methylcyclohexane (MCH) in the HRS. Next, the leakage frequency for each scenario was estimated using a hierarchical Bayesian model. Simulations were then performed of the blast-wave pressure and heat radiation after a hydrogen leak and of atmospheric dispersion of evaporated chemicals after leaks of liquid MCH and toluene. The consequences were estimated for each scenario according to leak size using the existing probit functions and threshold values. Finally, the risk due to explosion, heat radiation, and acute toxicity was estimated by multiplying the consequence by the leakage frequency. The results show that the mortality risk of explosion and acute effect is less than 10−6 per year, which is a negligible level of concern. However, the mortality risk of heat radiation in the scenarios involving hydrogen leakage from the pipe connected to the cylinders and compressors exceeds 10−4 per year inside the HRS, thereby requiring additional steps if a more-detailed risk assessment is needed.

1. Introduction

Fuel cell vehicles (FCVs) have the potential both to reduce considerably our dependence on foreign oil and to lower harmful emissions that contribute to air pollution. There are now growing numbers of FCVs and hydrogen refueling stations (HRSs) globally. Hydrogen has major characteristic hazards such as explosion and embrittlement, which increases the accidental risks at HRSs. To prevent and mitigate major hydrogen accidents, adequate safety measures should be identified through risk assessment [1]. Therefore, research has been conducted into quantifying the potential risk related to HRSs.
Li et al. [2] performed a quantitative risk assessment (QRA) based on thirteen accident scenarios involving jet fires, flash fires, and explosions at high-pressure HRSs. They reported that the individual risk in an HRS is 6.48 × 10⁻⁴ per year, and leaks from compressors and dispensers are the main risk contributors. Sun et al. [3] performed a risk analysis based on nine accident scenarios involving jet fires and flash fires at high-pressure HRSs. They found that the individual risk in a refueling station is 7.65 × 10⁻⁶ per year. The leak from booster compressors contributes the most to the overall risks, almost 69%, and the leak from tube storages contributes the second most to the overall risks, approximately 27%. Furthermore, the individual risk to customers was 1.63 × 10⁻⁵ per year.
LaChance [4] described an application of QRA methods to help establish the minimum separation distance between an HRS and the public. Kikukawa et al. [5] undertook a screening-level risk assessment of HRSs for 70-MPa FCVs and suggested that a safety distance of 6 m was sufficient in such cases.
The organic chemical hydride method for hydrogen storage and transportation has both high gravimetric and volumetric hydrogen density. However, this method has not been established technically, because a dehydrogenation catalyst has not attained enough stability or sufficient performance [6]. Thus, this method for hydrogen storage using hydrogenation and dehydrogenation chemical reactions has been developing recently. Okada et al. [7] developed a dehydrogenation catalyst using a simple fixed-bed reactor that has a high stability and sufficient performance. Biniwale et al. [8] studied thermal profile of catalysts surface under spray-pulsed injection of cyclohexane over Pt catalysts supported on activated carbon and alumite. Shukla et al. [9] described the results of experiments on dehydrogenation of methylcyclohexane (MCH) over Pt supported on metal oxides (Pt/MO) and Pt supported on perovskite.
This organic chemical hydride method is considered low potential risk, because hydrogen is stored as a chemical liquid under ambient pressure at room temperature [6]. Tsunemi et al. [10] estimated the consequences and damage due to explosions and heat radiation after a hydrogen leak, as well as the acute toxicity caused by the leakage and dispersion of MCH and toluene energy carriers in an HRS that uses organic hydride. However, there are no existing studies involving the risk assessment of HRS using organic hydride considering the frequency of leakage accidents at the station. The aim of this study was to conduct a screening-level assessment to identify and quantify the risk of impairment to human health and life related to hydrogen explosions and chemical release during the operation of an HRS that uses organic hydride.

2. Materials and Methods

A risk assessment framework for an HRS was constructed, as shown in Figure 1, to include accident probabilities, emissions of chemical substances, hazards, vulnerabilities, and exposure. Risk assessment is based on various assumptions, thus it is important to refine scenarios whose risk is a high level of concern at the screening-level assessment. In this study, a screening-based risk assessment was conducted by calculating the largest hazard for all leakage accident scenarios and the leak size of hydrogen and chemicals.
The characteristics of this assessment are as follows. First, operational occurrences and accidents due to various components and devices in the station were treated totally for screening assessment. Second, a method for estimating the leakage frequency using a hierarchical Bayesian model was established to use an existing accident database as the prior distribution, updated by incorporating the data for HRS accidents. Third, in addition to the effects of explosions and heat, the effects of the toxicities of the leaked chemicals were turned into risk assessment objects for application to an HRS that uses organic hydride. Fourth, the spatial distribution of human risk, including residents living near the HRS, was estimated and displayed using a geographic information system (GIS).

2.1. Leakage Scenarios

We assumed that an HRS that uses organic hydride is located in inner Tokyo where the population density is high. An organic hydride HRS uses three main processes (Figure 2). For liquid storage, MCH (the hydrogen energy carrier) is pumped from a tanker truck into the HRS storage tank. Toluene (the byproduct of dehydrogenation) is stored before being removed from the HRS. During dehydrogenation, the hydrogen is separated from the MCH and refined. For hydrogen storage, the refined hydrogen is compressed and stored in storage cylinders, from where it is sent to the dispenser to supply FCVs.
We created twenty-one scenarios involving leakage from components (Figure 2) based on hypothetical accidents in which either hydrogen leaked from the hydrogen storage pipes or MCH or toluene leaked from the liquid storage pipes in the HRS. Following LaChance et al. [11], we categorized the leak sizes as: “very small”, “minor”, “medium”, “major”, and “rupture”. These correspond to ratios of the leak hole area to the total flow area of 0.01%, 0.1%, 1%, 10%, and 100%, respectively. Hereinafter, we refer to the fractional leak area as FLA.

2.2. Leakage Frequency

The data on HRS accidents are limited, and there are no such data for organic hydride HRSs because such stations are yet to be operational. Therefore, it is difficult to estimate leak frequencies or accident rates appropriately using exiting leakage/accident data. Instead, we estimated the leak frequencies for hydrogen, MCH, and toluene by using the method of Kihara et al. involving a Bayesian inference model [12], for which we followed the method of LaChance et al. [11]. Table 1 describes the data used for Bayesian updating. These come in the form of leak frequencies observed in the chemical, compressed-gas, nuclear-power, and offshore petroleum industries and from HRSs in the US, as well as accident records for compressed natural gas stations, HRSs, and gasoline stations in Japan. While the US accident database records leak frequencies, the Japanese one records narrative descriptions of accidents rather than leak frequencies or accident rates. Therefore, we classified each accident record datum according to the FLA criteria and calculated the leak frequency per component.
The inference model assumes that the logarithm of the mean leak frequency for each component is related linearly to the logarithm of the FLA [11]. We constructed a linear regression model, for which we used a hierarchical Bayesian model in parts. We then used WinBUGS version 1.4.3 [16] to obtain the most likely parameter values and the mean and credible intervals of leak frequency for each FLA. We assumed that the distribution of leak frequency on the FLA follows a log-normal distribution. Considering the components listed in Table 2, we obtained the leak frequencies for the component assembly for the twenty-one leakage scenarios and five FLAs.
We used the median of the estimated leak frequency for following assessment. Upon hydrogen leakage, we assumed inevitable ignition as the worst-case scenario for the screening assessment, which is why the accident probability is the same as the leak frequency.

2.3. Emissions and Hazards

We calculated the amount of leaked hydrogen for each FLA assuming that: (i) hydrogen (at a maximum pressure of 82 MPa) begins leaking from the hydrogen storage pipes (with an inner diameter of 5.9 mm); (ii) the shut-off valve activates after 30 s [9]; and (iii) the excess-flow stop valve operates within 0.2 s if the flow rate of hydrogen exceeds 3.6 kg/min [17]. We calculated the leaked amounts of toluene and MCH for each FLA by assuming an inner pipe diameter of 27.6 mm in the liquid storage process, an inner pipe diameter of 105.3 mm for removing toluene and receiving MCH, and continuous chemical leakage for 30 min [10].
We assumed that the total amount of hydrogen leaked for 30 s forms a stoichiometric hydrogen/air mixture (30 vol %). An ignition point was set at the horizontal center of the mixture region and 0.5–1 m above the ground, and the value of ignition probability was set to 100%. The ignition results in a premixed hydrogen/air explosion which will be the largest hazard. We used FLACS and FLACS-Fire (GexCon) software to estimate the blast-wave pressure, impulse, and heat from the hydrogen leak at each grid point and time.
We estimated the average concentrations of chemicals in the atmosphere within each 10-m mesh 30 min after the chemicals began to leak. For this, we used the frequencies of wind direction, wind speed, and atmospheric stability for the meteorological conditions in Tokyo using a puff model incorporated in the Acute Effect Assessment Tool under development by the National Institute of Advanced Industrial Science and Technology [18].
Grid points for analysis were arranged at intervals of around 10 m in an area with a radius of 200 m from the hydrogen ignition point or 100 m from the chemical leak source at a height of 1.5 m above the ground.

2.4. Vulnerability and Consequence

We used the probit functions from the Green Book [19,20] to estimate the consequences of exposure to the blast-wave pressure, namely eardrum rupture, fatalities caused by being displaced by the blast wave, and fatalities caused by head injuries. We used the same method to estimate the consequences of the heat dose, namely first-degree burns, second-degree burns, and fatalities.
We used the acute exposure guideline levels (AEGL) are the airborne concentration of a substance above which it is predicted that the general population could experience life-threatening health effects or death (AEGL-3); irreversible or other serious, long-lasting adverse health effects or an impaired ability to escape (AEGL-2); and notable discomfort, irritation, or certain asymptomatic non-sensory effects (AEGL-1) [21]. We used AEGLs for 30-min inhalation exposure to toluene of 250 mg/m3 (AEGL-1), 2900 mg/m3 (AEGL-2), and 20,000 mg/m3 (AEGL-3) [22], and used the AEGL-1 equivalent human NOAEL for MCH acute effect of 690 mg/m3 [10] for threshold values.
The consequence of acute inhalation toxicity through inhalation of MCH or toluene was estimated by aggregating the probabilities of the various meteorological conditions when the atmospheric chemical concentration exceeds each of the above threshold values.

2.5. Damage and Risk

To calculate the number of injuries in the HRS and among the surrounding residents due to an HRS accident, we constructed 10-m mesh GIS data for the populations inside the buildings [9]. We calculated the damage Di for each leakage scenario by multiplying the population by the consequence from each 10-m mesh estimated in Section 2.4 for each leak size:
Di = Σj(Ci,j × Popj),
where Di (number of people) is the damage due to an accident with leak size i, Ci,j (-) is the consequence of 10-m mesh j due to an accident with leak size i, and Popj (number of people) is the population in 10-m mesh j. We estimated the individual risk IRj for each leakage scenario due to explosion, heat radiation, and acute toxicity by multiplying the consequence by the probability for each leak size:
IRj = Σj(Ci,j × Probi),
where IRj is the individual risk of 10-m mesh j and Probi (-) is the probability of each leakage scenario for leak size i. We calculated the population risk PR for each leakage scenario by multiplying the individual risk of each 10-m mesh by the population of each 10-m mesh:
PR = Σj(IRj × Popj).

3. Results

3.1. Leakage Frequency and Emission

Table 3 lists the results for the estimated leak frequencies and emissions of hydrogen, MCH, and toluene for the 21 scenarios and the five FLAs. In Scenarios 1, 2, 4, 5, 7 and 10–13, the leakage frequency exceeds 10−2 per year. Those results arise from the high estimated leakage frequencies of the hoses, nozzles and couplers, and compressors. The emissions exceed 100 m3 in Scenarios 2, 3, 5 and 6 because of the large stored quantities of hydrogen with high pressure.

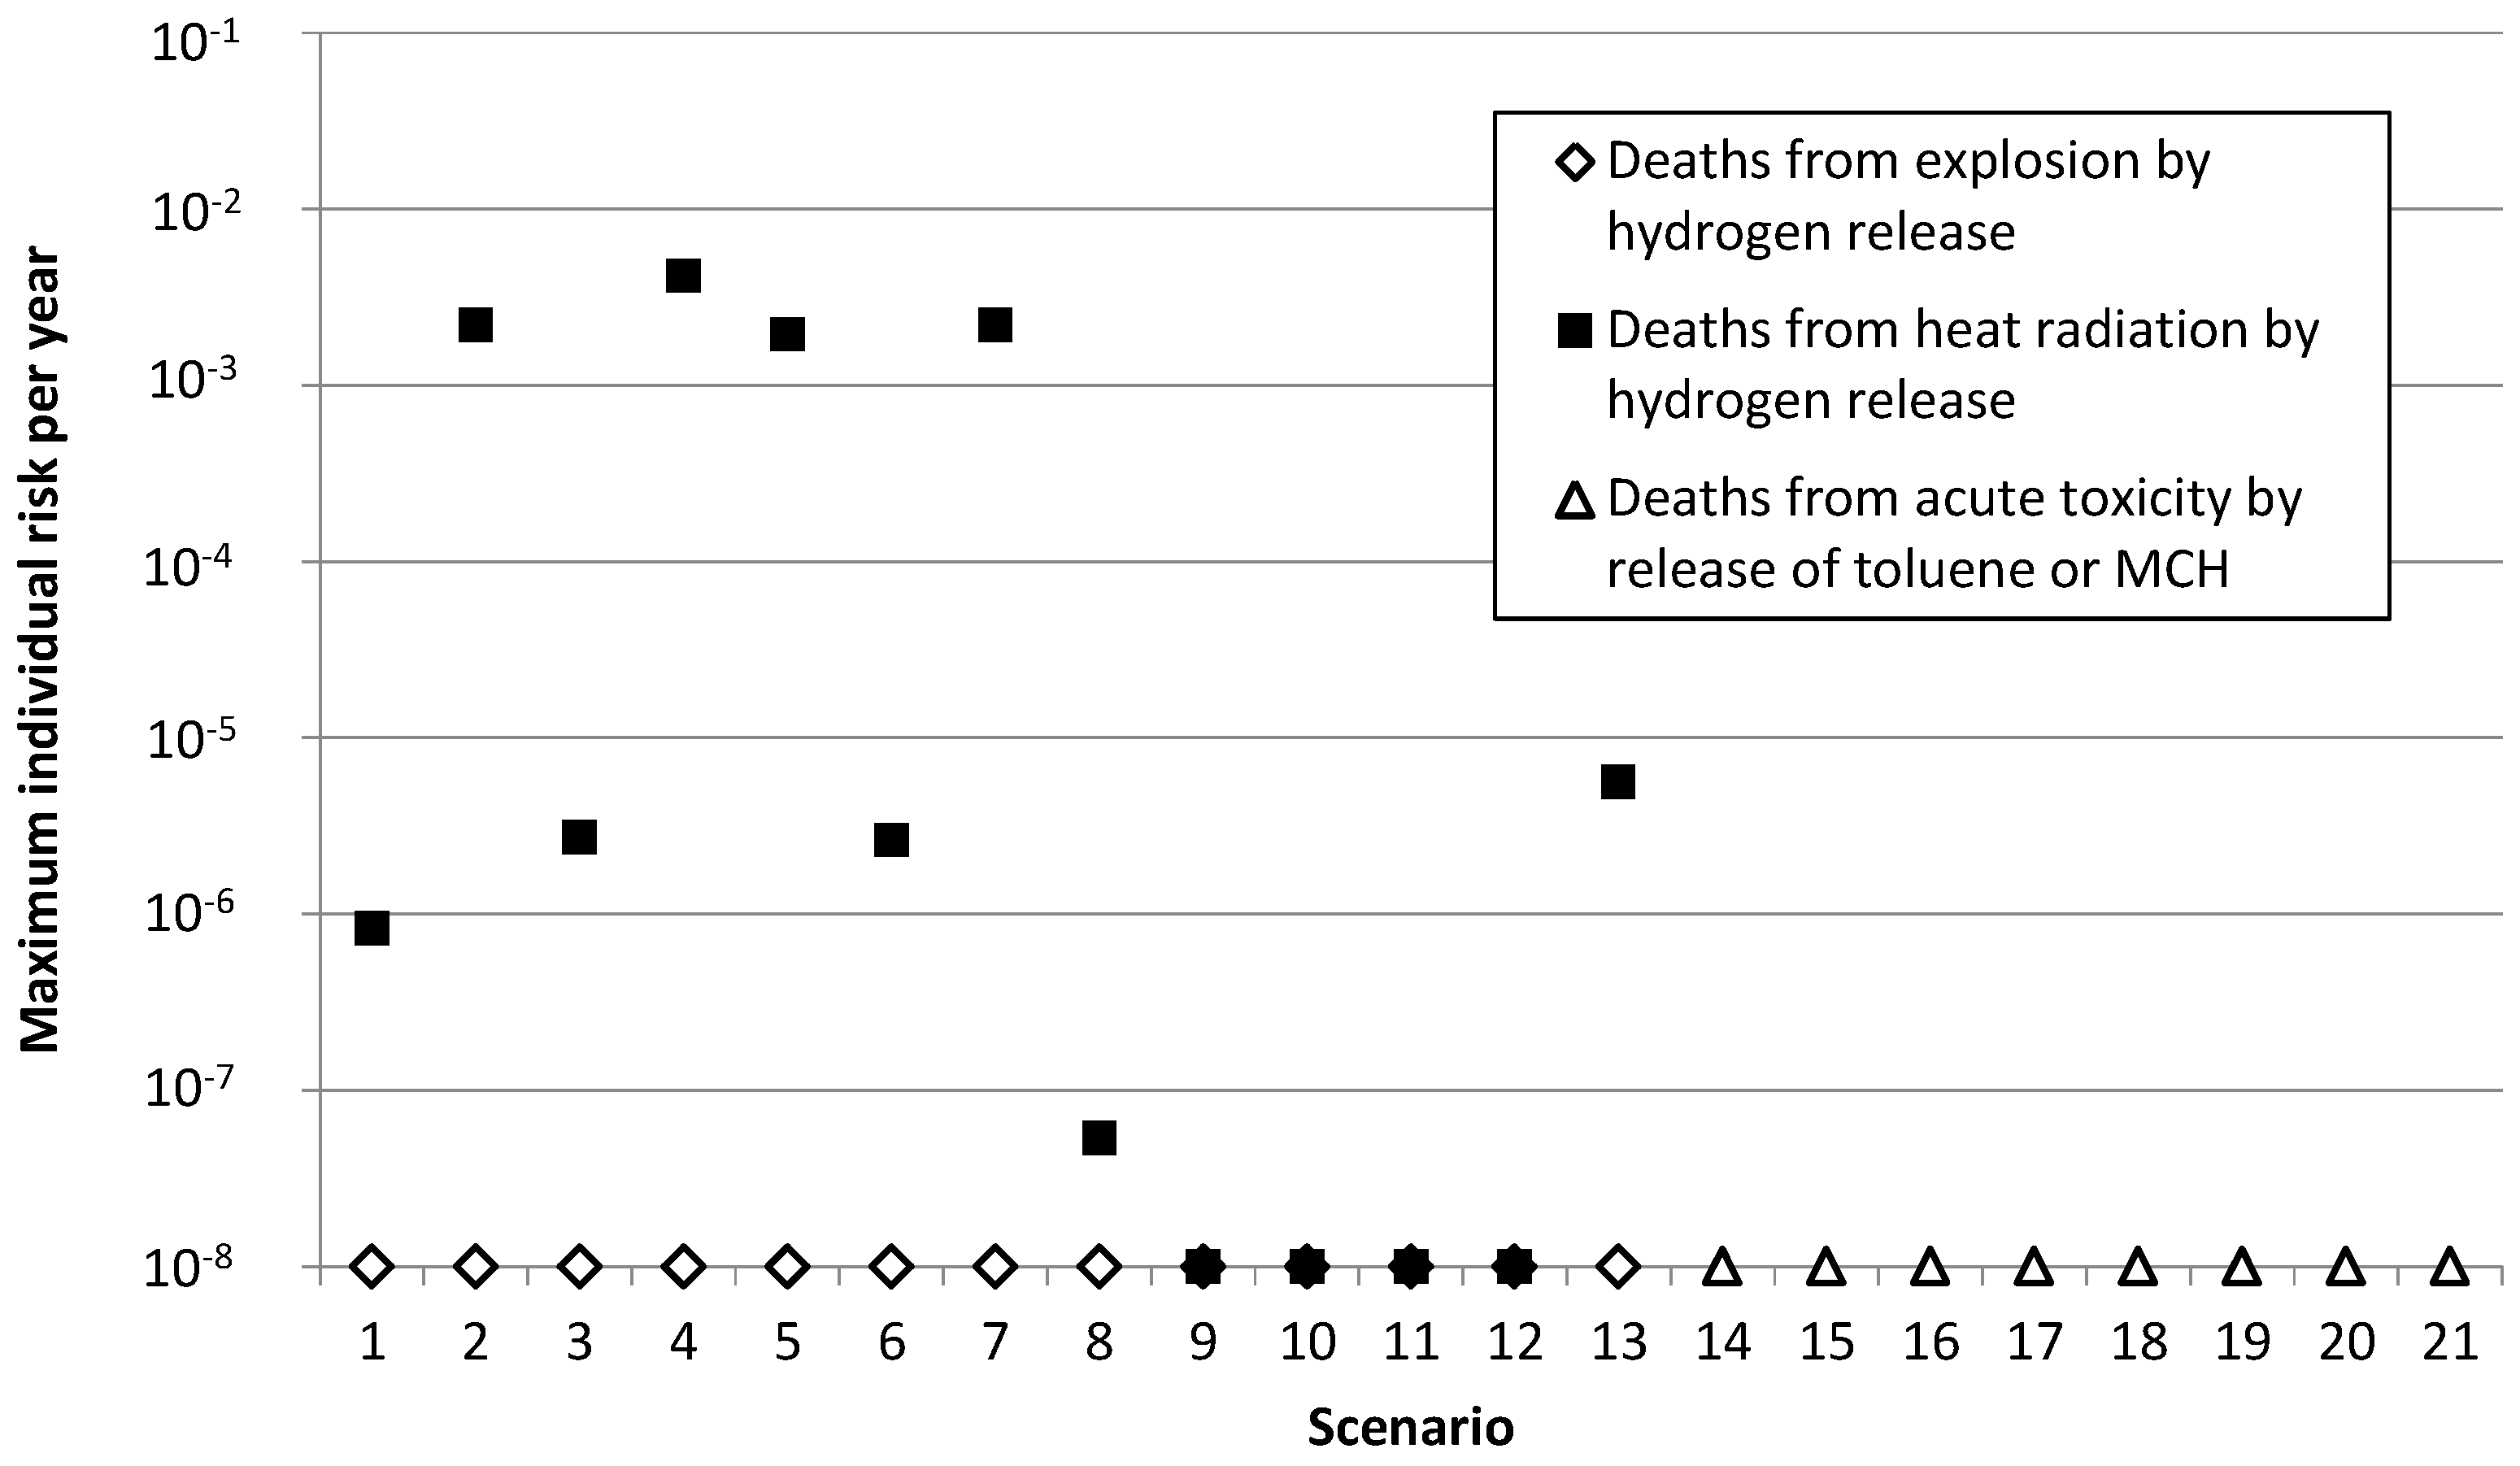
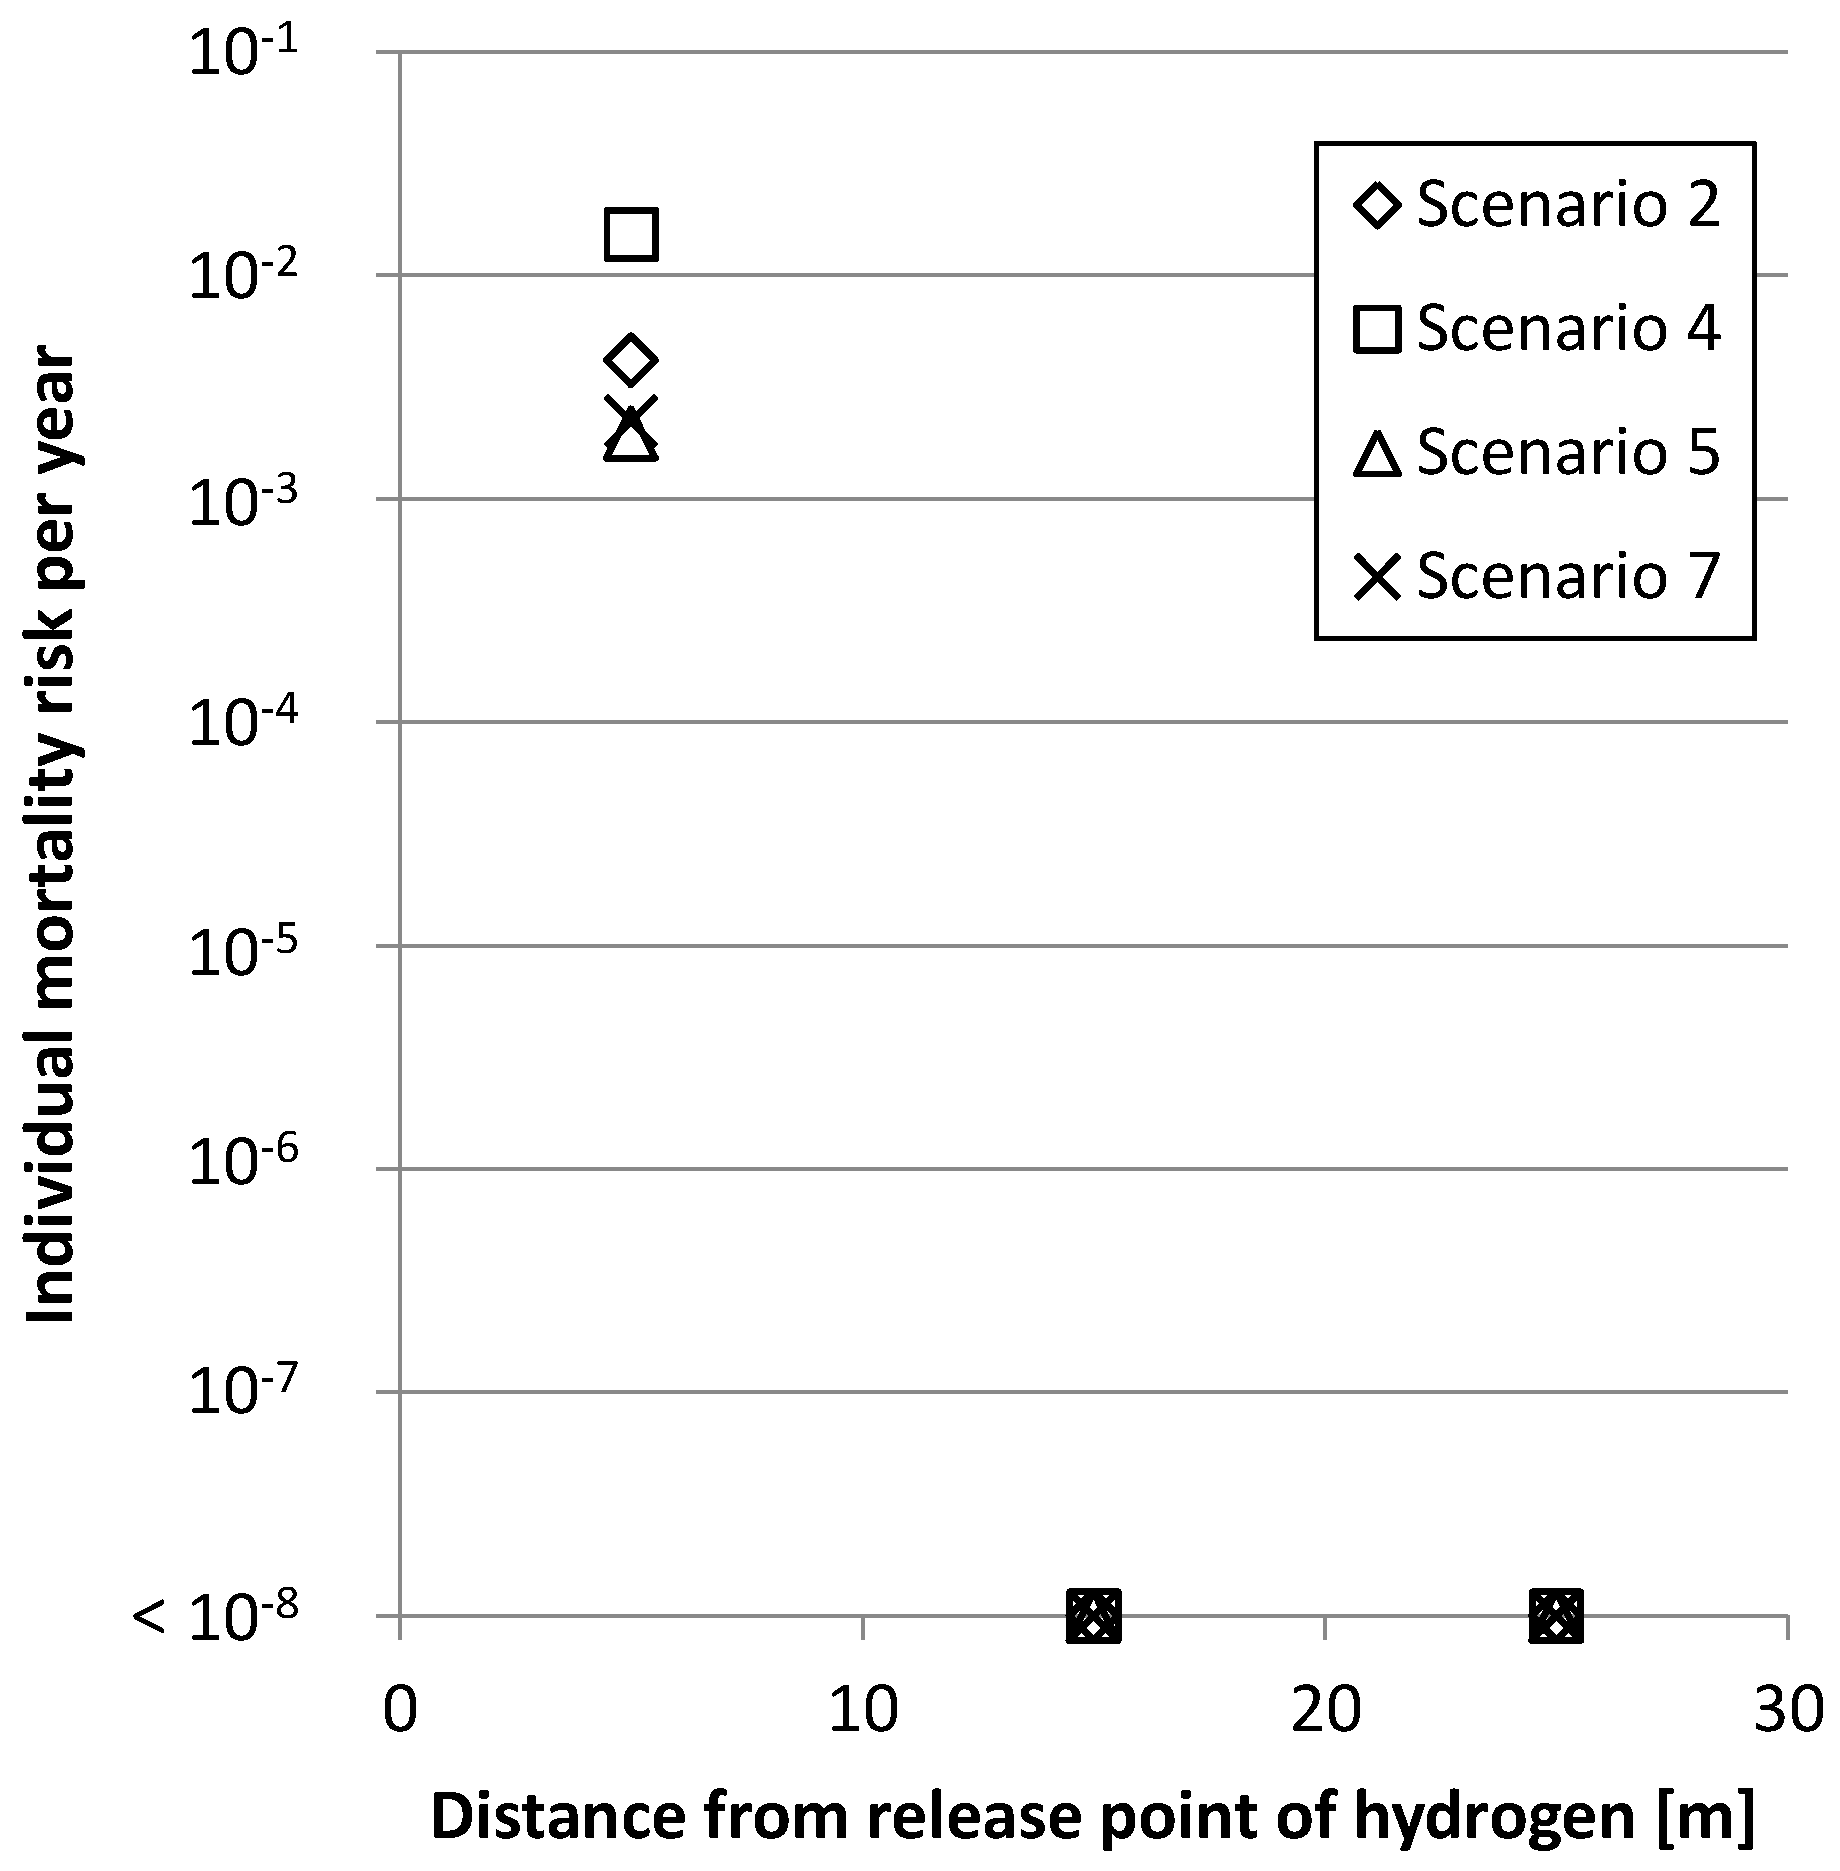
3.2. Consequence, Damage and Risk

Table 4 and Table 5 list the results for the consequence, damage, and risk due to explosion and heat radiation, respectively. The consequence, damage and risk due to explosion are low. The individual mortality risk due to explosion is less than 10−8 per year in Scenarios 1–13.
The maximum consequence due to heat radiation is nearly 100% in Scenarios 2–7 (i.e., hydrogen leakage from the pipe connected to the cylinders and compressors in the hydrogen storage process). The individual mortality risk due to heat radiation exceeds 10−3 per year in Scenarios 2, 4, 5 and 7. However, the mortality risk due to heat radiation in Scenarios 3 and 6 (i.e., hydrogen leakage directly from the cylinders) is less than 10−5 per year because the leak frequency is low. Furthermore, the consequence and risk due to heat radiation in Scenarios 8–13 (i.e., hydrogen leakage at dehydrogenation) are less than those for the hydrogen storage process.
Table 6 lists the results for the consequence, damage, and risk due to acute toxicity. The risks of human exposure to atmospheric concentrations of toluene exceeding AEGL-2 and AEGL-3 equivalent human NOAEL are very small in Scenarios 14–21. The maximum individual risk of human exposure to concentrations of MCH and toluene exceeding AEGL-1 equivalent human NOAEL exceeds 10−3 per year in Scenarios 18 and 21, but the level of the effect is slight.

4. Discussion

For process safety management, Kolluru et al. [23] indicated that the average individual mortality risk level for public should be less than 10−6 per year and the maximum individual mortality risk for employees should be less than 10−4 per year. EIHP2 document of risk acceptance criteria for HRSs [24] indicates that the individual mortality risk for employees and customers caused by hydrogen-process related events should not exceed 10−4 per year. ISO [25] proposes the risk criteria for HRSs as an average individual risk (AIR) less than 10−6 for vulnerable external populations and an AIR less than 10−4 for facility users and workers. In this study, the risk criteria were set that the individual mortality risk in the inner side of the station should be less than 10−4 per year, and the risk to the surrounding residents should be less than 10−6 per year.
Figure 3 shows the maximum individual mortality risk by each scenario. The individual mortality risk due to explosion is less than 10−6 per year in Scenarios 1–13, which is a negligible level of concern. The individual mortality risk due to acute toxicity is less than 10−6 per year in Scenarios 14–21, which is also a negligible level of concern. The individual mortality risk due to heat radiation exceeds 10−4 per year in Scenarios 2, 4, 5 and 7, and the mortality risk exceeds 10−6 per year in Scenarios 2–7 and 13.
Figure 4 shows the relationship between the distance from release point of hydrogen and individual risk in Scenarios 2, 4, 5 and 7. The result indicates that the mortality risk exceeds 10−4 per year within the 10 m distance from the release point of hydrogen. Thus, the individual mortality risk due to heat radiation is not a negligible level of concern in the inner side of the HRS, and the equivalent risk to the surrounding residents is very much smaller.
Therefore, the mortality risk to the surrounding residents due to explosion, heat radiation, and acute effects is less than 10−6 per year, which is a negligible level of concern. Meanwhile, although the mortality risk to workers and customers inside the HRS due to the blast wave and acute toxicity is also less than 10−6 per year and therefore also poses a negligible level of concern, the mortality risk due to heat radiation in the accident scenarios in which hydrogen leaks from the pipe connected to the cylinders and compressors exceeds 10−4 per year inside the station, thereby requiring additional steps if a more-detailed risk assessment is needed.

5. Conclusions

This study conducted a screening-level risk assessment of the impairment to human health and life related to hydrogen explosions and chemical releases during the operation of an HRS that uses organic hydride. Twenty-one accident scenarios were identified involving the leakage of hydrogen during the high-pressure hydrogen storage process and dehydrogenation process and of toluene and MCH during the liquid storage process. The Leak frequency of each leakage scenario was estimated using a hierarchical Bayesian model. Simulations were performed of the blast-wave pressure and heat radiation after a hydrogen leak and of the atmospheric dispersion of evaporated chemicals after leaks of liquid MCH and toluene. Probit functions or threshold values were created for each effect, and the consequences were estimated for each scenario according to leak size. The risks due to explosion, heat radiation, and acute toxicity were estimated by multiplying the consequences by the leak frequency.
As a result, the mortality risk to the surrounding residents in all accident scenarios was less than 10−6 per year, which is a negligible level of concern. The mortality risk to workers and customers due to the blast wave and acute toxicity inside the HRS upon leakage of hydrogen from the dehydrogenation process and of toluene and MCH from the liquid storage process was also less than 10−6 per year, again a negligible level of concern. However, the mortality risk due to heat radiation in the accident scenarios involving hydrogen leakage from the pipe connected to the cylinders and compressors in the high-pressure hydrogen storage process exceeded 10−4 per year inside the HRS, thereby requiring additional steps if a more-detailed risk assessment is needed. In conclusion, we revealed that the individual mortality risk is negligible in the accident scenarios in the liquid storage process and the dehydrogenation process uniquely installed in HRSs that use organic hydride.
In future work, we will conduct a detailed risk assessment in the accident scenarios in the hydrogen storage process installed in all HRSs. We intend to use event-tree analysis to estimate accident frequencies, and to conduct hazard assessment by arranging grid points for analysis at smaller intervals than those used in the present study. Measures based on risk criteria should also be investigated by conducting QRA using the consequence, damage, and occurrence-probability data presented herein.

Author Contributions

Conceptualization, K.T.; methodology, K.T., K.Y. and K.O.; software, K.Y. and T.S.; validation, K.T., K.Y., T.K. and T.S.; formal analysis, K.T., K.Y., T.K. and T.S.; investigation, T.K.; resources, K.T., K.Y. and K.O.; data curation, K.T. and K.Y.; writing—original draft preparation, K.T.; writing—review and editing, T.K., K.Y. and K.O.; visualization, K.T.; supervision, K.T.; project administration, K.T.; and funding acquisition, K.T.

Funding

This work was supported by the Council for Science, Technology and Innovation (CSTI) through its Cross-ministerial Strategic Innovation Promotion Program (SIP), and “Energy Carrier” (funding agency: Japan Science and Technology Agency (JST)).

Conflicts of Interest

The authors declare no conflict of interest.

References

  1. Nakayama, J.; Misono, H.; Sakamoto, J.; Kasai, N.; Shibutani, T.; Miyake, A. Simulation-based safety investigation of a hydrogen fueling station with an on-site hydrogen production system involving methylcyclohexane. Int. J. Hydrogen Energy 2017, 42, 10636–10644. [Google Scholar] [CrossRef]
  2. Li, Z.; Pan, X.; Ma, J. Quantitative risk assessment on 2010 Expo hydrogen station. Int. J. Hydrogen Energy 2011, 36, 4079–4086. [Google Scholar]
  3. Sun, K.; Pan, X.; Li, Z.; Ma, J. Risk analysis on mobile hydrogen refueling stations in Shanghai. Int. J. Hydrogen Energy 2014, 39, 20411–20419. [Google Scholar] [CrossRef]
  4. LaChance, J. Risk-informed separation distances for hydrogen refueling stations. Int. J. Hydrogen Energy 2009, 34, 5838–5845. [Google Scholar] [CrossRef] [Green Version]
  5. Kikukawa, S.; Yamaga, F.; Mitsuhashi, H. Risk assessment of hydrogen fueling stations for 70 MPa FCVs. Int. J. Hydrogen Energy 2008, 33, 7129–7136. [Google Scholar] [CrossRef]
  6. Okada, Y.; Saito, M.; Makabe, T. Development of dehydrogenation catalyst for hydrogen storage and transportation system by the organic chemical hydride method. J. Hydrogen Energy Syst. 2006, 31, 8–13. (In Japanese) [Google Scholar]
  7. Okada, Y.; Sasaki, E.; Watanabe, E.; Hyodo, S.; Nishijima, H. Development of dehydrogenation catalyst for hydrogen generation in organic chemical hydride method. Int. J. Hydrogen Energy 2006, 31, 1348–1356. [Google Scholar] [CrossRef]
  8. Biniwale, R.B.; Rayalu, S.; Devotta, S.; Ichikawa, M. Chemical hydrides: A solution to high capacity hydrogen storage and supply. Int. J. Hydrogen Energy 2008, 33, 360–365. [Google Scholar] [CrossRef]
  9. Shukla, A.A.; Gosavi, P.V.; Pande, J.V.; Kumar, V.P.; Chary, K.V.R.; Biniwale, R.B. Efficient hydrogen supply through catalytic dehydrogenation of methylcyclohexane over Pt/metal oxide catalysts. Int. J. Hydrogen Energy 2010, 35, 4020–4026. [Google Scholar] [CrossRef]
  10. Tsunemi, K.; Yoshida, K.; Yoshida, M.; Kato, E.; Kawamoto, A.; Kihara, T.; Saburi, T. Estimation of consequence and damage caused by an organic hydride hydrogen refueling station. Int. J. Hydrogen Energy 2017, 42, 26175–26182. [Google Scholar] [CrossRef]
  11. Sandia National Laboratories. Analysis to Support Development of Risk-Informed Separation Distances for Hydrogen Code and Standards. Available online: https://energy.sandia.gov/wp-content/uploads/2018/05/SAND2009-0874-Analyses-to-Support-Development-of-Risk-Informed-Separation-Distances-for-Hydrogen-Codes-and-Standards.pdf (accessed on 31 October 2018).
  12. Kihara, T.; Makino, R.; Ono, K.; Saburi, T.; Kubota, S.; Tsunemi, K.; Wada, Y. Bayesian Estimation of Leak Frequency for Organic Hydride Hydrogen Refueling Stations. J. Jpn. Soc. Saf. Eng. 2017, 56, 2–11. (In Japanese) [Google Scholar]
  13. Sandia National Laboratories. Early-Stage Quantitative Risk Assessment to Support Development to Codes and Standard Requirements for Indoor Fueling of Hydrogen Vehicles. Available online: https://www.sandia.gov/~kgroth/publicationfiles/SAND2012-10150.pdf (accessed on 31 October 2018).
  14. The High Pressure Gas Safety Institute of Japan. Accident Database of High Pressure Gas. (In Japanese). Available online: http://www.khk.or.jp/activities/incident_investigation/hpg_incident/incident_db.html (accessed on 9 February 2018).
  15. Hazardous Materials Safety Techniques Association. Integrated Information System for Hazardous Materials. (In Japanese). Available online: https://www.khk-syoubou.info/sougou/ (accessed on 31 October 2018).
  16. University of Cambridge. The BUGS Project. Available online: https://www.mrc-bsu.cam.ac.uk/software/bugs/the-bugs-project-winbugs/ (accessed on 31 October 2018).
  17. Yamatosangyo Co. Ltd. Spec of Excess Flow Stop Valve, Catalog for Gas Supplier Equipment for Hydrogen Station. Available online: http://www.e-yamato.co.jp/data/catalog/5/HEF.SAFETYH2.pdf (accessed on 31 October 2018).
  18. Yoshida, K.; Yoshida, M. Estimation of health risks to residents chronically exposed to an organic hydride and its dehydrogenated substance from a hydrogen station. Environ. Sci. 2018, 31, 164–177. (In Japanese) [Google Scholar]
  19. Van den Bosch, C.J.H.; Twilt, L. Damage caused by heat radiation. In Methods for the Determination of Possible Damage to People and Objects Resulting from Release of Hazardous Materials, 1st ed.; Committee for the Prevention of Disasters: Voorburg, The Netherlands, 1992; pp. 1–60. ISBN 9-5307-052-4. [Google Scholar]
  20. Merx, W.P.M. The consequences of explosion effects on humans. In Methods for the Determination of Possible Damage to People and Objects Resulting from Release of Hazardous Materials, 1st ed.; Committee for the Prevention of Disasters: Voorburg, The Netherlands, 1992; pp. 1–43. ISBN 9-5307-052-4. [Google Scholar]
  21. United States Environmental Protection Agency. Acute Exposure Guideline Levels for Airborne Chemicals. Available online: https://www.epa.gov/aegl (accessed on 13 November 2018).
  22. National Research Council. Acute Exposure Guideline Levels for Selected Airborne Contaminants; National Academies Press: Washington, DC, USA, 2014; pp. 1–474. ISBN 978-0-309-30096-4.
  23. Stricoff, R.S. Safety risk analysis and process safety management. In Risk Assessment and Management Handbook: For Environmental, Health, and Safety Professionals; Kolluru, R., Steven, M., Bartell, S., Pitblado, R., Stricoff, S., Eds.; McGraw-Hill, Inc.: New York, NY, USA, 1995; pp. 8.1–53. ISBN 0-07-035987-3. [Google Scholar]
  24. European Integrated Hydrogen Project. Risk Acceptance Criteria for Hydrogen Refuelling Stations. Available online: http://www.eihp.org/public/documents/acceptance_criteria_for_H2-refuelling_stations_FEB2003.pdf (accessed on 31 October 2018).
  25. International Organization for Standardization. Gaseous—Fuelling Stations—Part 1: General Requirements; ISO/DIS 19880-1; International Organization for Standardization: Geneva, Switzerland, 2018; pp. 1–176. [Google Scholar]
Figure 1. Risk assessment framework for a hydrogen refueling station.
Sustainability 10 04477 g001
Figure 2. Schematic flow and leakage scenarios of a hydrogen refueling station that uses organic hydride.
Sustainability 10 04477 g002
Figure 3. Maximum individual mortality risk in each leakage scenario.
Sustainability 10 04477 g003
Figure 4. Relationship between the distance from release point of hydrogen and individual mortality risk.
Sustainability 10 04477 g004
Table 1. Accident database used to estimate leakage frequency.
Description of Accident DatabaseProcesses AppliedReferences
Accidents recorded during 1975–2007 in the US for the chemical-processing, compressed-gas, nuclear-power, and offshore-petroleum industries and hydrogen refueling stations.Hydrogen storage, dehydrogenation, liquid storageSandia National Laboratories, 2009, 2012 [11,13]
637 accidents during 1965–2015 in Japan for compressed natural gas stations and hydrogen refueling stations.Hydrogen storage, dehydrogenationHigh Pressure Gas Safety Institute of Japan [14]
869 accidents during 2006–2014 in Japan for gasoline stations.Liquid storageFire and Disaster Management Agency, Japan [15]
Table 2. Assumed numbers of components in each leakage scenario.
No. 1Leakage ScenarioPipesJointsValvesFlangesCompressorsPumpsCylindersTanksReactorsHydrogen RefinerHosesNozzles and CouplersInlet/Outlet
1Components associated with dispenser (excess-flow stop valve, dispenser nozzle)80401082
2Components connected to cylinder (82 MPa)52015
3Cylinder (82 MPa, 300 L)3
4Compressor (82 MPa) and related components (50 L)203051
5Components connected to cylinder (45 MPa)52015
6Cylinder (45 MPa, 300 L)9
7Compressor (45 MPa) and related components (50 L)203051
8Components connected to hydrogen holder (300 L)30208
9Hydrogen holder (1 MPa, 300 L)1
10Hydrogen refiner and related components2030101
11Compressor in dehydrogenation process103051
12Components connected to toluene separator20305
13Dehydrogenation reactor and related components (0.3 MPa, 1800 L)20501071
14Toluene return piping and related components513
15Methylcyclohexane (MCH) feed piping and related components5151
16Toluene return piping (underground piping)5
17Toluene storage tank (underground tank, 30 m3)1
18Components for removing toluene1727131
19MCH feed piping5
20MCH storage tank (underground tank, 30 m3)1
21Components for receiving MCH161331
1 Number labels as shown in Figure 2.
Table 3. Results for leak frequencies of processes and emissions of hydrogen and energy carriers for 21 scenarios and five FLAs.
Leakage ScenarioFrequency 1Emission 2
Very SmallMinorMediumMajorRuptureVery SmallMinorMediumMajorRupture
18.8 × 10−23.0 × 10−21.2 × 10−25.2 × 10−32.9 × 10−300.551.24
21.0 × 10−25.5 × 10−32.8 × 10−31.3 × 10−31.2 × 10−300.5543208
39.8 × 10−78.3 × 10−75.6 × 10−73.2 × 10−71.7 × 10−7106242243243243
41.7 × 10−29.8 × 10−35.5 × 10−33.3 × 10−32.4 × 10−300.542840
51.0 × 10−25.3 × 10−32.8 × 10−31.3 × 10−31.2 × 10−300.3323114
61.0 × 10−58.8 × 10−65.9 × 10−63.4 × 10−61.8 × 10−658133133133133
71.7 × 10−29.8 × 10−35.5 × 10−33.3 × 10−32.4 × 10−300.321522
88.9 × 10−34.5 × 10−32.3 × 10−31.2 × 10−31.0 × 10−3000.10.53
99.8 × 10−78.3 × 10−75.6 × 10−73.2 × 10−71.7 × 10−713333
101.3 × 10−26.6 × 10−33.1 × 10−31.5 × 10−31.2 × 10−3000.10.30.5
111.7 × 10−29.7 × 10−35.3 × 10−33.2 × 10−32.3 × 10−3000.10.30.5
121.1 × 10−25.6 × 10−32.3 × 10−31.1 × 10−37.6 × 10−40000.22
132.0 × 10−29.8 × 10−34.2 × 10−31.9 × 10−31.4 × 10−347777
143.1 × 10−47.0 × 10−52.1 × 10−51.2 × 10−56.3 × 10−600000.3
154.6 × 10−41.6 × 10−45.8 × 10−52.0 × 10−52.0 × 10−5000.20.40.4
164.7 × 10−51.8 × 10−57.9 × 10−63.9 × 10−61.6 × 10−600000.3
174.5 × 10−51.9 × 10−57.9 × 10−63.3 × 10−61.4 × 10−6529303030
186.7 × 10−34.1 × 10−32.3 × 10−31.3 × 10−38.5 × 10−4000.2221
194.7 × 10−51.8 × 10−57.9 × 10−63.9 × 10−61.6 × 10−600000.4
204.5 × 10−51.9 × 10−57.9 × 10−63.3 × 10−61.4 × 10−6529303030
216.7 × 10−34.1 × 10−32.3 × 10−31.3 × 10−38.5 × 10−4000.2221
1 Unit:/year; values show the median data calculated by Bayesian inference. 2 Unit: m3 (under standard conditions); chemicals are hydrogen (Scenarios 1–13), MCH (Scenarios 14, 16–18), and toluene (Scenarios 15, 19–21). Total sum value of all 10-m mesh cells for rupture leak.
Table 4. Results for consequence, damage, and risk to people by explosion.
EffectItemUnitLeakage Scenario
12345678910111213
Ruptured ear drumsConsequence, max. 1(-)<10−82.0 × 10−51.7 × 10−51.3 × 10−51.3 × 10−51.3 × 10−59.3 × 10−7<10−8<10−8<10−8<10−8<10−8<10−8
Damage 2[people]<10−84.7 × 10−56.4 × 10−41.1 × 10−43.3 × 10−43.3 × 10−46.7 × 10−6<10−8<10−8<10−8<10−8<10−8<10−8
Individual risk, max. 3[/year]<10−83.1 × 10−8<10−85.9 × 10−82.4 × 10−8<10−8<10−8<10−8<10−8<10−8<10−8<10−8<10−8
Population risk 4[people/year]<10−89.5 × 10−7<10−84.5 × 10−74.7 × 10−7<10−83.3 × 10⁻⁸<10−8<10−8<10−8<10−8<10−8<10−8
Blast-wave fatalitiesConsequence, max.(-)<10−8<10−8<10−8<10−8<10−8<10−8<10−8<10−8<10−8<10−8<10−8<10−8<10−8
Damage[people]<10−8<10−8<10−8<10−8<10−8<10−8<10−8<10−8<10−8<10−8<10−8<10−8<10−8
Individual risk, max.[/year]<10−8<10−8<10−8<10−8<10−8<10−8<10−8<10−8<10−8<10−8<10−8<10−8<10−8
Population risk[people/year]<10−8<10−8<10−8<10−8<10−8<10−8<10−8<10−8<10−8<10−8<10−8<10−8<10−8
Head-injury fatalitiesConsequence, max.(-)0<10−8<10−80000000000
Damage[people]00<10−80000000000
Individual risk, max.[/year]0<10−800000000000
Population risk[people/year]0000000000000
1 Maximum value of 10-m mesh cell for rupture leak. 2 Total sum value of all 10-m mesh cells for rupture leak. 3 Maximum value of 10-m mesh cell for all leak sizes. 4 Total sum value of all 10-m mesh cells for all leak sizes.
Table 5. Results for consequence, damage, and risk to people by heat radiation.
EffectItemUnitLeakage Scenario
12345678910111213
Ruptured ear drumsConsequence, max. 1(-)0.31.01.01.01.01.01.00.30.3<10−8<10−88.7 × 10−30.5
Damage 2[people]1.97.27.27.27.27.27.21.91.9<10−8<10−86.3 × 10−23.3
Individual risk, max. 3[/year]3.2 × 10−33.2 × 10−32.9 × 10−67.2 × 10−33.2 × 10−32.9 × 10−67.2 × 10−32.8 × 10−45.1 × 10⁻⁷<10−8<10−86.6 × 10−61.3 × 10−2
Population risk 4[people/year]2.3 × 10−22.3 × 10−22.1 × 10−55.2 × 10−22.3 × 10−22.2 × 10−45.2 × 10−22.0 × 10−33.7 × 10⁻⁶<10−8<10−84.8 × 10−59.5 × 10−2
Blast-wave fatalitiesConsequence, max.(-)4.4 × 10−51.01.01.01.01.00.74.4 × 10−54.4 × 10⁻⁵<10−8<10−8<10−83.0 × 10⁻⁴
Damage[people]3.2 × 10−46.97.27.07.27.25.13.2 × 10−43.2 × 10⁻⁴<10−8<10−84.7 × 10−82.2 × 10−3
Individual risk, max.[/year]5.2 × 10−72.4 × 10−32.8 × 10−65.2 × 10−32.3 × 10−32.8 × 10−63.5 × 10−24.5 × 10−8<10−8<10−8<10−8<10−86.0 × 10⁻⁶
Population risk[people/year]3.8 × 10−61.7 × 10−22.0 × 10−53.7 × 10−21.6 × 10−22.2 × 10−42.6 × 10−23.2 × 10−7<10−8<10−8<10−8<10−84.4 × 10⁻⁵
Head-injury fatalitiesConsequence, max.(-)5.2 × 10−51.01.00.80.90.90.55.2 × 10−55.2 × 10⁻⁵<10−8<10−83.8 × 10−82.7 × 10−4
Damage[people]3.8 × 10−45.96.96.16.86.83.33.8 × 10−43.8 × 10⁻⁴<10−8<10−82.7 × 10−71.9 × 10−3
Individual risk, max.[/year]6.2 × 10−72.2 × 10−32.7 × 10−64.2 × 10−31.9 × 10−32.6 × 10−62.2 × 10−35.4 × 10−8<10−8<10−8<10−8<10−85.6 × 10⁻⁶
Population risk[people/year]4.5 × 10−61.6 × 10−22.0 × 10−53.2 × 10−21.4 × 10−22.0 × 10−41.6 × 10−23.9 × 10−7<10−8<10−8<10−8<10−84.1 × 10⁻⁵
1 Maximum value of 10-m mesh cell for rupture leak. 2 Total sum value of all 10-m mesh cells for rupture leak. 3 Maximum value of 10-m mesh cell for all leak sizes. 4 Total sum value of all 10-m mesh cells for all leak sizes.
Table 6. Results for consequence, damage, and risk to people by acute toxicity.
EffectItemUnitLeakage Scenario
1415161718192021
AEGL-1Consequence, max. 1(-)00000.5000.4
Damage 2[people]000058.50029.2
Individual risk, max. 3[/year]00001.3 × 10−3008.9 × 10−4
Population risk 4[people/year]00000.12005.8 × 10−2
AEGL-2Consequence, max.(-)0-000---
Damage[people]0-000---
Individual risk, max.[/year]0-000---
Population risk[people/year]0-000---
AEGL-3Consequence, max.(-)0-000---
Damage[people]0-000---
Individual risk, max.[/year]0-000---
Population risk[people/year]0-000---
1 Maximum value of 10-m mesh cell for rupture leak. 2 Total sum value of all 10-m mesh cells for rupture leak. 3 Maximum value of 10-m mesh cell for all leak sizes. 4 Total sum value of all 10-m mesh cells for all leak sizes.

