Article

Cattle Diets Strongly Affect Nitrous Oxide in the Rumen

by
Katrin Gerlach
1,*,
Alexander J. Schmithausen
2,
Ansgar C. H. Sommer
1,
Manfred Trimborn
2,
Wolfgang Büscher
2 and
Karl-Heinz Südekum
1
1
Institute of Animal Science, University of Bonn, 53115 Bonn, Germany
2
Institute of Agricultural Engineering, University of Bonn, 53115 Bonn, Germany
*
Author to whom correspondence should be addressed.
Sustainability 2018, 10(10), 3679; https://doi.org/10.3390/su10103679
Submission received: 5 October 2018 / Revised: 11 October 2018 / Accepted: 12 October 2018 / Published: 14 October 2018
(This article belongs to the Special Issue Environmentally Sustainable Livestock Production)

Abstract

:
This study aimed at assigning climate-relevant gaseous emissions from ruminants to animal- or feed-related origin. Three adult rumen-cannulated German Holstein steers and three forage types (corn silage (CS), alfalfa silage (AS) and grass hay (GH)) were used in a 3 × 3 Latin square design. Each period consisted of 12 days (d), during which animals received 10 kg dry matter/day of one forage as sole feed. Gaseous samples from forages and the steers´ rumen were taken and analyzed for CO2, CH4, and N2O using gas chromatography. There were large differences in the amounts of CO2 and N2O emitting from the forage types. Most N2O came from AS and only small amounts from GH and CS. Results indicate that fermented forages rich in nitrogen can release climate-relevant N2O. The highest CO2 amounts were measured in CS. Methane was not detected in any forage sample. Animals consuming CS showed slightly lower CH4 concentrations in the rumen gas sample than animals fed AS or GH. Big differences were found for ruminal N2O with the highest concentration after AS ingestion such that the N2O measured in the rumen seems to originate from the used feedstuff.

1. Introduction

Animal production significantly contributes to climate-relevant greenhouse gas (GHG) emissions but also offers considerable reduction potential such that different mitigation strategies like the use of feed additives and application of feeding strategies as well as different manure, reproduction, and animal management strategies are discussed [1,2]. Ruminants are mainly responsible for the trace gases methane (CH4) and nitrous oxide (N2O) with the latter having a much higher carbon dioxide (CO2) equivalence factor (298) than CH4 (25) [3]. Methane is a product of the anaerobic fermentation of carbohydrates in the rumen, which is a pathway for the disposal of hydrogen formed during microbial metabolism [4]. Cattle lose 2–10% of their ingested gross energy as eructated CH4 [5], and the total amount is influenced by dry matter (DM) intake (DMI) and ration composition [6,7,8]. The volatile N2O (Henry´s law constant, k°H 0.025 mol/kg × bar) is mainly produced by the microbially facilitated denitrification in manure and to a smaller extent by nitrification in soils [9]. The contribution of GHG emissions from enteric fermentation and manure management occurs in a ratio of about 9:1 [10] such that the potential for decreasing GHG emissions is mainly seen in manipulating enteric fermentation, e.g., by adjusting composition of rations. In this regard, different studies have already been performed using in vitro and in vivo measurements (e.g., recent work by Lee et al. [11] and Macome et al. [12]) as well as rumen-cannulated cows, among others resulting in different regression equations for predicting CH4 emissions based on intake and diet characteristics [13]. When applying different regression equations to five typical Central European dairy cow rations it was shown that the best differentiation between diets was achieved with equations containing forage proportion and DMI as factors [13]. For measurement of GHG emissions on animal level the use of respiration chambers is a proven technology [5,14]. Other techniques comprise a mobile open-circuit hood system to measure the gas exchange in small ruminants [15] and a ventilated hood system for measuring GHG from cattle [16]. Most studies focused on emissions of CH4 and CO2, whereas approaches investigating the effect of ration composition on enteric emissions of N2O are rare [17,18]. Rotz and Thoma [19] reviewed that N2O emissions are in the range of 0.3–0.5 g/cow per day (d), with higher values occurring possibly under certain dietary conditions. Authors state that mechanisms and amount produced are generally not well understood but that high dietary nitrate (NO3) levels might induce increased N2O emissions. Though, they also agree that more research is needed to better quantify that source of emission as formation in the rumen is questionable [20].
However, beside the ruminant itself, the forage used as feedstuff can also act as a source of emissions: for non-fermented forages Emery and Mosier [21] measured emissions of CO2, CH4, and N2O from switchgrass and corn stover under varying storage conditions. Both CH4 and N2O were detected and concentrations were influenced by forage DM concentration. However, when calculating the net global warming potential for the different treatments (0–2.4 g CO2 equivalents/kg DM) authors suggested that direct emission of CH4 and N2O from aerobically stored (non-fermented) feedstuffs have a minor effect on net global warming potential of cellulosic biofuels. Fermented forages as an origin of gaseous emissions measured in the environment of ruminants have rarely been studied. In early studies of Wang and Burris [22] N2O was detected in whole-crop corn silages where the gas composition was analyzed eight times within 66 h after sealing the silo. A constant increase in N2O concentration from 1.50% (v/v) to 4.55% after 54 h was measured which declined afterwards to 1%. The origin of the N2O was seen in the reduction of NO3 [22]. The reduction of NO3 starts a few hours after ensiling with an enrichment of the intermediate products NO und NO2 which normally disappear after one or two weeks of ensiling [23]. Further reduction by Enterobacteriaceae results in N2O and ammonia (NH3) [24]. Also recent work using Fourier transform infrared (FTIR) spectroscopy verified the presence of N2O in gases formed in the early phase of ensilage of whole-crop corn [25]. Franco [26] showed that particularly forages naturally rich in nitrogen (N), especially in the form of nitrate, had significant N2O production during silage fermentation. Up to now, only little attention has been given to N2O possibly emitting during the feed-out phase of silages.
Gaseous emissions occurring in the environment of ruminants are often difficult to assign to a specific source (e.g., feed, rumen, manure), especially when measurements are conducted on barn level, in respiration or environmental chambers. This impedes the explanation of their formation and strategies for mitigation.
Therefore, the objective of the present study was to determine gaseous emissions from ruminants offered different forage types (corn silage (CS), alfalfa silage (AS) and grass hay (GH)) with contrasting chemical composition and to assign the emissions to animal or feed-related sources, with special emphasis on nitrous oxide. To the best of our knowledge, this is the first study determining the concentration of CO2, CH4, and N2O in the ruminal gas phase of steers after ingestion of three different forage types.

2. Materials and Methods

2.1. Animals, Diets, and Experimental Design

This study was conducted at the Educational and Research Center Frankenforst of the Faculty of Agriculture, University of Bonn (Königswinter, Germany). All experimental procedures were conducted in accordance with the German guidelines for animal welfare and were approved (file number 84-02.04.2017.A247) by the Animal Care Committee of the state of North Rhine-Westphalia. Three animals and three forage types differing in chemical composition (CS, AS, GH) were used. Three adult rumen-cannulated German Holstein steers (born and raised on the Center, 4 years old, rumen-cannulated since 2 years, about 1300 kg body weight) were housed separately in single pens (4.4 × 4.6 m) allowing visual contact. Ambient conditions within the barn were consistent throughout the experimental period with a temperature of 18.4 ± 2.1 °C and relative air humidity of 74.7 ± 8.3%. Water was continuously available allowing ad libitum intake. The whole trial consisted of 42 d (4 June to 15 July 2016) and was divided into three periods following a 3 × 3 Latin square design. Each period started with a 2-d adaptation phase during which animals were offered a ration consisting of 50% of the previous forage and 50% of the new forage. Twelve days of experimental feeding followed during which animals received one of the three forages as sole feed. During this time, each steer was offered 10 kg DM/d of the respective forage. Measurement of gaseous emissions was carried out during the last 3 d of each period. Table 1 shows the chemical composition of the forages which had been produced at the Educational and Research Center Frankenforst. The AS was produced from a fourth cut of alfalfa (harvest date 9 September 2015) and ensiled in round bales. For CS, the whole-crop corn (harvest date 20 September 2015) was chopped (6 mm theoretical chop length) and ensiled in a bunker silo. The GH was made from the second cut (harvest date 28 June 2015), and the field-dried hay was packed in round bales. To ensure constant forage qualities during each period, silages were stored anaerobically in 120-L plastic barrels. Therefore, the CS was taken from a fresh silage face and the AS was obtained from a round bale opened just before. Silages were filled into the barrels in several layers, each layer was compacted separately such that a high density was reached, and were then stored anaerobically. Forages were offered to the steers once daily at 08.00 a.m. Before feeding in the morning, remaining feed was removed and weighed to determine DMI. During the last 3 d of each period (sampling period), the DM consumed within 180 min after offering feed in the morning was also measured. Every day (d 10–12), a representative sample (500 g) of each forage was taken and composited to one sample for each period. After sampling, forages were immediately frozen until analysis.

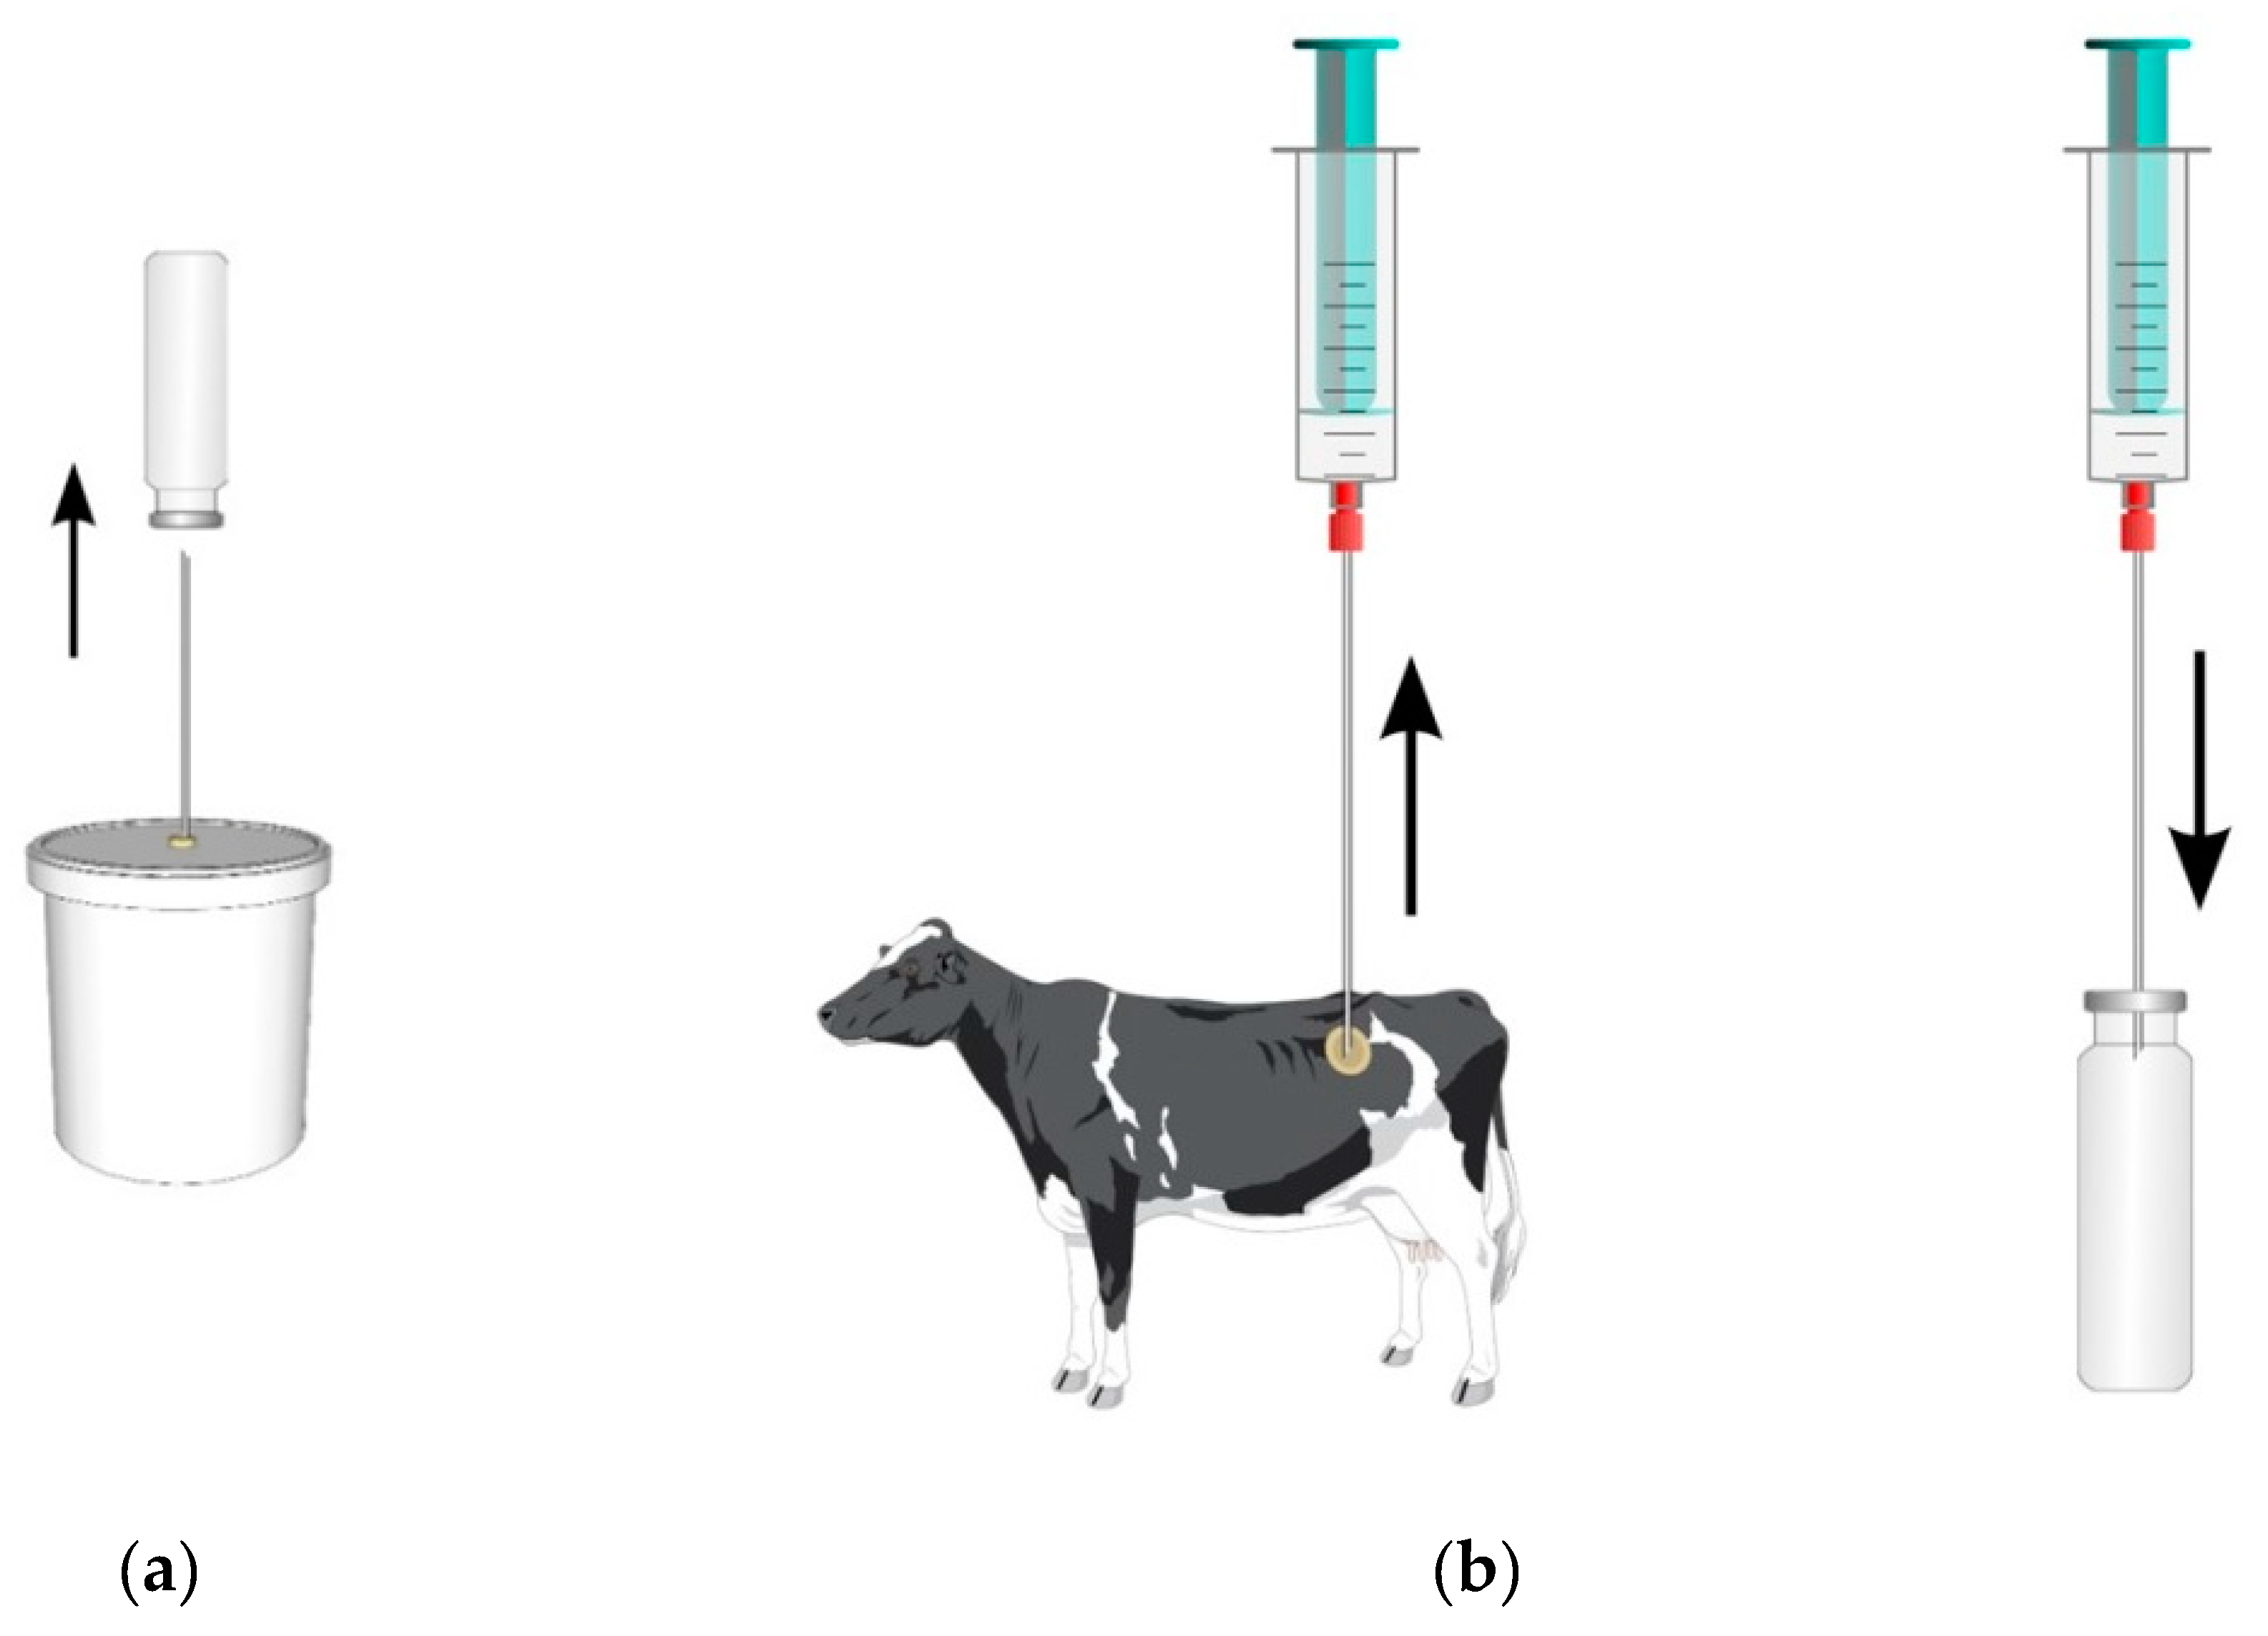
2.2. Sampling and Measurements of Gaseous Emissions

During the last 3 d of each period, sampling for measurements of gaseous emissions from forages and the rumen was conducted. Concurrently, forage samples for laboratory analysis and incubation experiments for gas measurement were taken. The emission measurements aimed at the acquisition of the gases CO2, CH4, and N2O from the forages and the rumen gas of the steers. Sampling of emissions from the forages was conducted simultaneously to the feeding using closed containers with a volume of 10 L. The containers were made of polyethylene (PE) and were equipped with a rubber septum for gas sampling via twin needle. For each container, average temperature and relative humidity were logged continuously using data loggers (Tinytag Plus 2—TGP-4500, Gemini Data Loggers Ltd., Chichester, West Sussex, UK). For sample collection a defined amount of each forage (1 kg each of CS and AS, and 0.5 kg GH) was put in the container and sealed gas tight. Within the next 40 min five gaseous samples were taken using evacuated headspace vials directly after closure (0 min) and 10, 20, 30, and 40 min after closure (Figure 1a). Then the containers were opened for 140 min to enable unrestricted, natural air exchange before a second sealing and gas sampling period started. The headspace vials had a vacuum range below 5 mbar. The vacuum was produced by pricking a twin needle through the container septum as described by Schmithausen et al. [27]. This procedure (sampling of emissions from the forages) was conducted on 3 consecutive d.
Samples from the gaseous phase of the steers´ rumen were taken 180 min after offering feed in the morning. In 10-min intervals (0, 10, 20, and 30 min), one sample was obtained with a syringe (50 mL) through the closed lid of the rumen-cannula and filled into two evacuated headspace vials (20 mL each; Figure 1b). Subsequently, samples were analyzed for CO2, CH4, and N2O using a gas chromatograph (GC) (8610 C, SRI Instruments, Torrance, CA, USA). The N2O and CO2 were determined with an electron capture detector (ECD) and CH4 was measured with a flame ionization detector (FID) [28,29]. The detection limit of the used analytical technique for CO2, CH4, and N2O is described in detail by Schmithausen et al. [30]. The emission rates of the respective gas from the incubation experiments were calculated via linear regression of the gas concentration over time, more specifically, the slope of the regression line. The detection limits of the GC result in minimally measurable increases in the concentration (slope) of the investigated gases in the incubation experiment. In the case of CH4, for example, this minimum slope was 0.5 ppm CH4, which corresponds to 3.3 μg CH4/(kg of feed × h). Comparable measurements by using headspace vials and defined criteria of evaluation are described by Schmithausen et al. [27]. As a result of the ruminal gas analysis, the concentrations of CH4 in rumen gas phase and the ratio of N2O to the sum of CO2 and CH4 are shown. The amounts of N2O formed in the rumen or the emission rates of N2O from the rumen could not be calculated, as the total volume of air in the rumen and the total rates of formation of CO2 and CH4 in the rumen could not be determined in this experiment. The CO2, N2O, and CH4 values are expressed as concentration in the rumen gas phase as well as ratio of CH4 to CO2 as an indicator of the efficiency of microbial fermentation [31].

2.3. Laboratory Analyses of the Forages

In each of the three periods, silages and hay were sampled for chemical analyses. Forages were kept at −20 °C and were then freeze-dried (Freeze-Dryer P18K-E, Piatkowski Forschungsgeräte, München, Germany) in triplicate. Afterwards, a duplicate subsample was oven-dried overnight at 105 °C for determination of the DM concentration. A correction of DM (DMcor) for the losses of volatiles during drying was done in alfalfa and corn silages with the following equations (concentrations are given as g/kg):
  • Alfalfa silage [32]:
    DMcor = DM + (1.05 − 0.059 × pH) × total volatile fatty acids (VFA, C2 − C6) + 0.08 × lactic acid + 0.77 × 1,2-propanediol + 0.87 × 2,3-butanediol + 1.00 × total of other alcohols.
  • Corn silage [33]:
    DMcor = DM + 0.95 × VFA (C2 − C6) + 0.08 × lactic acid + 0.77 × 1,2-propanediol + 1.00 × other alcohols.
After freeze-drying, samples were ground using 3-mm and afterwards 1-mm sieves. Samples were chemically analyzed according to VDLUFA [34] and following method numbers: Analysis of ash and ether extract (EE) was done by using methods 8.1 and 5.1. Crude protein (CP) was analyzed by Dumas combustion (4.1.2, FP328, Leco 8.1, Leco Instrumente, Mönchengladbach, Germany). The concentrations of neutral detergent fiber assayed with heat-stable amylase and expressed exclusive residual ash (aNDFom; 6.5.1), acid detergent fiber expressed exclusive residual ash (ADFom; 6.5.2), and acid detergent lignin (ADL; 6.5.3) were determined with an Ankom2000 Fiber Analyzer (Ankom Technology, Macedon, NY, USA). Following point 8.8 of method 6.5.2 the analysis of ADFom was conducted sequentially for AS to avoid precipitation of pectins. In CS, the concentration of starch was determined after enzymatically hydrolyzing starch to glucose [35]. The 24 h in vitro gas production (GP [mL/200 mg DM]) of forage samples was measured with the Hohenheim gas test (method 25.1, [34]) and afterwards, the concentration of metabolizable energy (ME) was estimated as follows:
  • Corn silage [36]:
    ME = 0.136 × GP + 0.0057 × CP + 0.000286 × EE2 + 2.20.
  • Alfalfa silage [37]:
    ME [MJ/kg organic matter] = 11.09 − 0.01040 × ADFom + 0.00497 × CP + 0.00750 × EE + 0.0351 × GP; ME [MJ/kg DM] = ME (MJ/kg organic matter) × [1000 − ash (g/kg DM)]/1000.
  • Grass hay [38]:
    ME = 7.81 + 0.07559 × GP + 0.00384 × ash + 0.00565 × CP + 0.01898 × EE − 0.00831 × ADFom.
Both silage types were analyzed for fermentation products after cold-water extraction. These analyses were conducted at the Central Analytical Laboratory of the Humboldt University, Berlin, Germany and concentrations of lactic acid, volatile fatty acids (VFA), alcohols (methanol, ethanol, propanol, 1,2-propanediol, 2,3-butanediol), acetone, ammonia, and water-soluble carbohydrates (WSC) as well as the pH were determined. Frozen forage samples (50.0 g) were blended with a mixture of 200 mL distilled water and 1 mL toluene for preparation of cold-water extracts. After keeping them overnight in a refrigerator extracts were filtered with a folded filter paper. The pH in the extract was measured potentiometrically with a calibrated pH electrode. Analysis of lactic acid was done by high performance liquid chromatography (HPLC) (RI-detector, Shimadzu Deutschland GmbH, Duisburg, Germany) [39]. Gas chromatography with FID (GC-2010; Shimadzu Deutschland, Duisburg, Germany) and a free fatty acid phase column (Permabond FFAP 0.25 Tm; Macherey-Nagel, Düren, Germany) was used for determining the VFA and alcohols. Ammonia was measured colorimetrically using a continuous flow analyzer (Skalar Analytical B.V., Breda, The Netherlands) and the concentration of WSC was analyzed using the anthrone method [40].

2.4. Statistical Analyses

All statistical analyses were performed with SAS 9.4. The following mixed model was used for the rumen samples:
yij = μ + Fi + Pj + (F × P)ij + Ak + eijk
with y = observed response; μ = overall mean; Fi = fixed effect of forage type i = 1, 2, 3; Pj = fixed effect of period j = 1, 2, 3; (B × P)ij = effect of interaction forage type I × period j; A = random effect of the animal k = 1, 2, 3; and eijk = residual error.
For analysis of the gas samples from forages the following mixed model was used:
yij = μ + Fi + Pj + (F × P)ij + eij
y = observed response; μ = overall mean; Fi = fixed effect of forage type i = 1, 2, 3; Pj = fixed effect of period j = 1, 2, 3; (B × P)ij = effect of interaction forage type I × period j; and eij = residual error.
Covariance structures were tested with the types “unstructured“, “autoregressive“, and “compound symmetry“. ”Akaike´s Information Criterion“ (AIC) was used to decide which model showed the best fit and based on that, “autoregressive” was chosen for the analysis. Within the period, d was taken as a repeated measurement. Least squares means were compared using the PDIFF option in SAS. Significant treatment effects were detected by pairwise comparisons employing Tukey´s test. In all statistical analyses, differences among means with p < 0.05 were accepted as representing statistically significant differences.

3. Results

3.1. Gas Production from Forages

As intended, forages differed considerably in chemical composition (Table 1). The AS had high concentrations of CP (246 g/kg DM), whereas GH and CS had only low to moderate concentrations. The GH contained high concentrations of fiber fractions (e.g., aNDFom) and was low in EE. The CS was high in starch (438 g/kg DM), in vitro gas production and metabolizable energy. Both silage types were well fermented with moderate to low concentrations of acetic acid and without butyric acid. The pH value in AS, however, was higher than recommended.
The emissions from forages as influenced by forage type, period, and their interaction are shown in Table 2. There were large differences in the rates of CO2 and N2O emitting from the forages (p < 0.05). Most N2O was released from AS (24.1 μg/(kg DM × h)) and only small amounts from GH (0.233 μg/(kg DM × h)) and CS (0.109 μg/(kg DM × h)). The CO2 emissions were also influenced by forage type and greatest CO2 amounts were measured in CS, followed by AS (p < 0.01). Both N2O and CO2 were influenced by forage type, but no influence (p > 0.05) was observed of period or the interaction between period and forage type. After 180 min, most emissions from forages were strongly reduced but 170 mg/(kg DM × h) of CO2 were still emitting from CS. Methane was not detected in any forage sample, neither directly after silo opening nor after 180 min (detection limit for CH4 was 3.3 μg/(kg × h)).

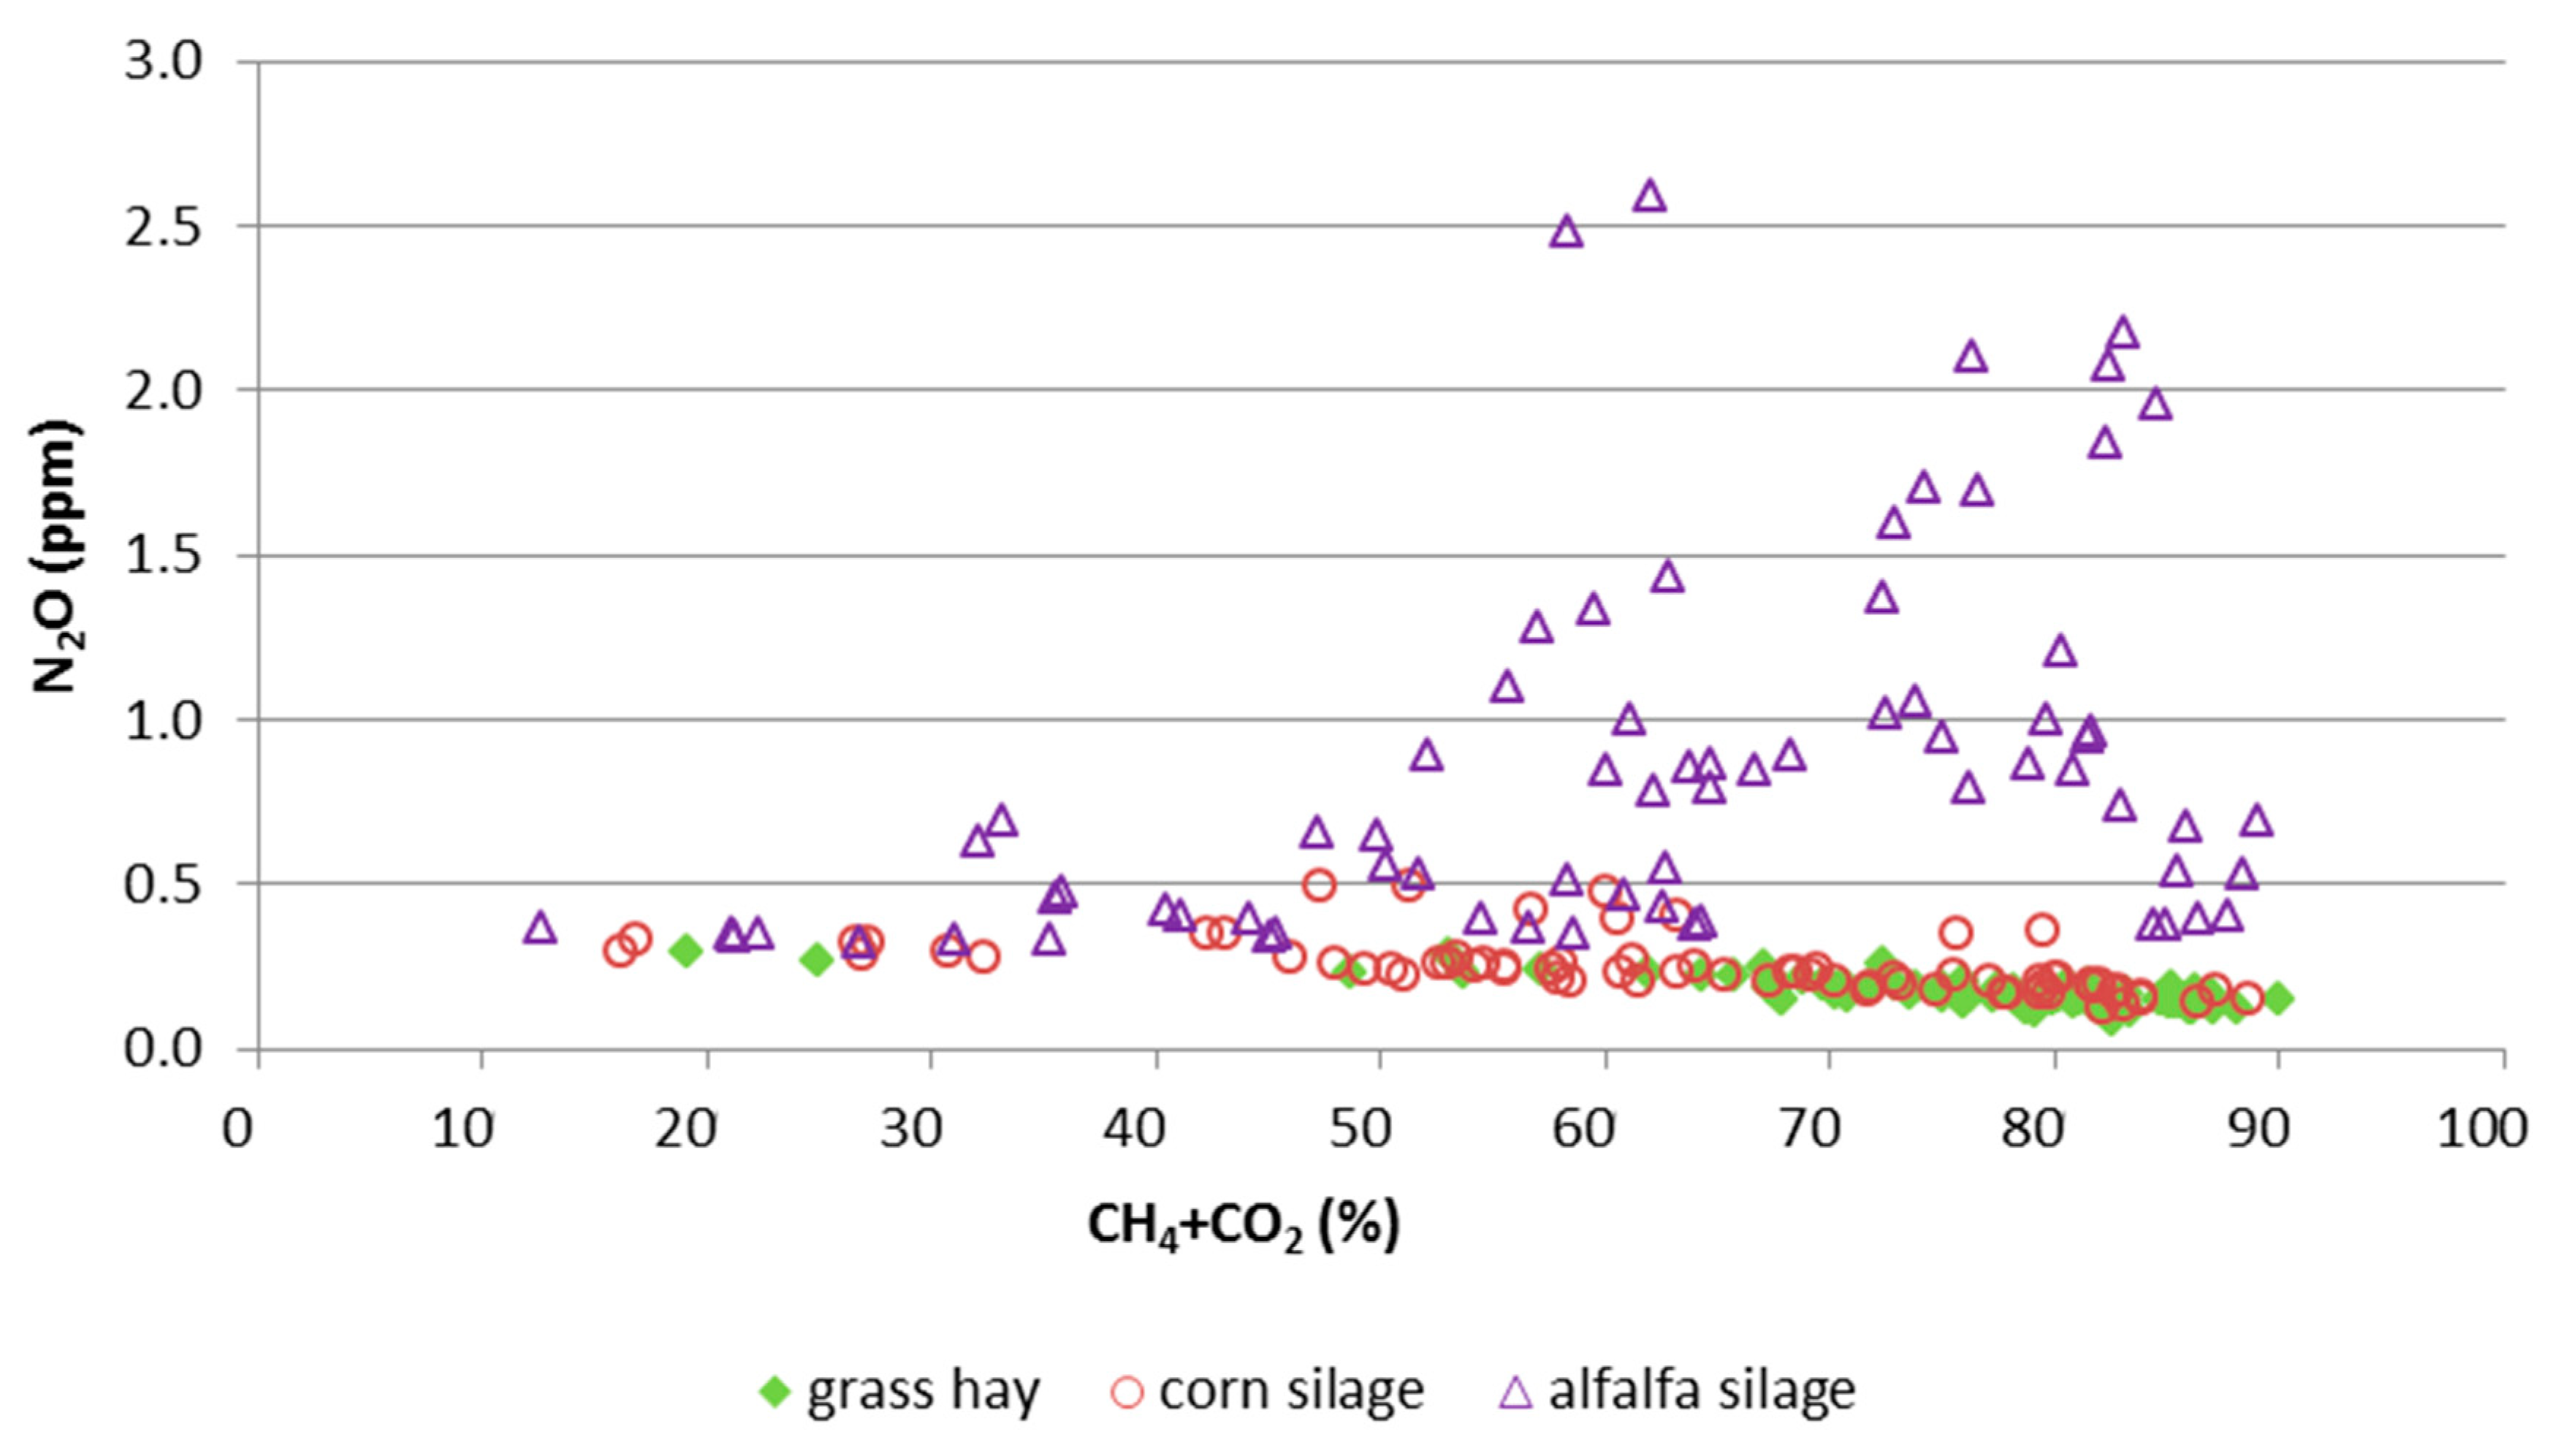
3.2. Gas Composition in the Rumen

The effect of forage type and period on DMI and composition of gaseous samples obtained from the rumen of steers is shown in Table 3. During 180 min, animals consumed 3.3 to 6.6 kg DM which was influenced by forage type. 180 min after initiation of feed ingestion, gas samples were taken from the rumen. There was a significant effect of forage type on all measured variables (p < 0.01). Big differences were found for N2O with higher concentrations for AS than for CS and GH (p < 0.01). The N2O concentration in the rumen atmosphere relative to the sum of CH4 and CO2 (%) for the different forage types obtained from the single measurements is shown in Figure 2. Elevated concentrations were only detected after ingestion of AS. Animals fed CS showed slightly lower CH4 concentrations in the rumen gas sample than when fed AS or GH. The CH4 to CO2 ratio was highest for AS (p < 0.01) and there was no difference between CS and GH (p > 0.05). This ratio can be seen as an indicator of the efficiency of microbial fermentation as it directly describes the share of emitted C that has not been metabolized to CO2 [31].
The CO2 concentration was highest after ingestion of GH (p < 0.01) and did not differ between CS and AS (p > 0.05). The remaining gas (difference to 100%) that cannot be explained by CH4, CO2, and N2O is presumably atmospheric air that may have entered the rumen or the gaseous sample via three possible ways: with the forage into the rumen during ingestion, via small leakages of the rumen cannula into the rumen or during sampling (into evacuated headspace vials). Concentrations of both O2 and N2 typically increase during feeding [41]. As oxygen entering during ingestion or via the cannula is depleted rapidly in the rumen atmosphere, mainly N2 remains from the atmospheric air which could not be analyzed with the methodology applied in this study.

4. Discussion

4.1. Emissions from Forages

Directly after silo opening, N2O emitted from AS but there were no N2O emissions from CS and GH. Formation of N2O during ensiling has been described before and can be mainly ascribed to anaerobic activity of Enterobacteriaceae species occurring during the initial period of ensiling [23]. Plant enzymes, on the other hand were not capable of producing N2O and NOx during ensiling such that microbial activity seems to be the main underlying process [26]. The conversion of NO3 during ensiling appears to be related to the duration the crop remains at a pH at which Enterobacteriaceae may grow and utilize NO3 (pH > 4.5–5.0) [24]. Due to a typically high buffering capacity (high CP, high ash concentration) and a high DM concentration of the experimental AS only a moderate drop in pH to 5.7 had been achieved. Consequently Enterobacteriaceae were not restricted by acidic conditions during the whole storage period. Also the increased NH3-N concentrations in AS may reflect increased activity of Enterobacteriaceae [23]. In contrast to this, whole-crop corn typically has a low buffering capacity and ferments rapidly. As a result, the CS had a low pH (3.9) which inhibits Enterobacteriaceae. The N2O emissions from CS and GH were very low and only slightly above detection limit (0.1 μg/(kg × DM h)).
Aerobic activity of Enterobacteriaceae may also occur in silages [42], but is most probably restricted to respiration. The decreased emission rates of N2O after 180 min of air exposure indicate that N2O emitted that had already been formed during the anaerobic fermentation process. The major part of the N2O was released during 180 min such that an aerobic formation seems unlikely. It can be concluded that N2O emissions from forages are possible under certain circumstances. It seems to be most pronounced from forages with high CP and NO3 concentrations at harvest [26] and extended and/or continuous activity of Enterobacteriaceae which can be caused by high silage pH [24]. It is therefore important to optimize the ensiling conditions (rapid wilting and sealing, strong compaction, use of additives in substrates that are classified as being difficult to ensile) to ensure a fast and sufficient drop in pH. More research is needed to state more precisely the conditions of formation and release of N2O in silages. However, the total amounts of N2O emitting from fermented forages are much lower than typical emissions from manure during storage which are in the range of 1.0 to 3.0 kg/cow per year (equaling 0.1 to 0.3 g/cow per h), mainly depending on the method of storage [19].
Besides N2O, also CO2 emitted from forages with an effect of forage type. As expected, only fermented forages released considerable amounts of CO2, most likely produced at the beginning of the ensiling process. The CS emitted more CO2 than AS. Caused by its plant structure and longer chop length in comparison to CS, alfalfa is more difficult to compact and its tubular hollow stem may even impede the removal of air during ensilage [43] or, vice versa, facilitate ingress of oxygen as soon as the silo is opened. Therefore, CO2 might be lower in concentration and emit very quickly after silo opening or during relocation to the barrels, explaining the lower emission rates in AS. Also aerobic spoilage processes by yeasts and molds which typically take place after silo opening lead to the formation of CO2 [44]. However, as CS still had a low pH and high concentrations of lactic acid (as an indicator of good fermentation quality) and emission rates diminished during aerobic exposure, ongoing aerobic deterioration processes can be excluded and the measured CO2 might result from gassing out of CO2 already being formed during ensiling. The forage gas samples were also analyzed for CH4 but changes in concentration were below detection limit in all cases. Fermented forages seem to be an unlikely source of CH4 emissions. To the best of our knowledge, possible CH4 emissions from silages have also not been studied or discussed in literature. Emery and Mosier [21] measured GHG emissions from unfermented feedstuffs and detected small amounts of CH4; however impact on the net global warming potential was assessed to be small.

4.2. Concentration Ratios in the Rumen

With the method of taking samples through the closed lid of the rumen-cannula via a syringe it was possible to obtain information on the composition of the gaseous phase in the rumen of the steers, without any interference (e.g., atmospheric air, oral contact, manure). Highest ruminal concentrations of N2O were found for steers fed AS with values exceeding 2.5 ppm at some sampling times (Figure 2) despite the fact that DMI was lowest for AS. In contrast, the N2O concentrations after ingestion of GH and CS were always below 0.5 ppm such that a clear effect of forage type could be shown. It is questionable whether N2O can be formed directly in the rumen under certain conditions. Kaspar and Tiedje [45] detected traces of N2O (up to 0.3% of added nitrogen) when investigating the dissimilatory reduction of nitrate and nitrite by the rumen microbiota of a rumen-cannulated cow. They concluded that N2O is a by-product of dissimilatory nitrite reduction to ammonium rather than a product of denitrification which seems to be absent from the rumen habitat. However, only traces were found under those experimental feeding conditions with addition of nitrate. Also de Raphélis-Soissan et al. [46] and Lee et al. [11] fed nitrate to ruminants in an attempt to lower ruminal CH4 production. In this regard, two main possibilities by which NO3 reduces enteric CH4 production were discussed [11]: NO3 reduction (thermodynamically favorable in comparison to methanogenesis) as major pathway and secondly, possibly being quantitatively less important, NO3 and NO2 being toxic to methanogens in the rumen. In both cases, CH4 production was decreased by addition of nitrate, however, de Raphélis-Soissan et al. [46] stated that, on the other hand, the N2O emission from sheep in respiration chambers was increased which led to a reduction of the net benefit of methane mitigation on global warming potential (CO2 equivalents/kg DMI) of 18%. This effect could be mitigated by using encapsulated NO3 as slow-release form, thereby lowering NO2 toxicity after nitrate ingestion [11]. When ruminants are fed typical rations without added nitrate, formation of N2O under anaerobic conditions in the rumen seems unlikely such that oral ways of formation after dietary nitrate supplementation were discussed as possible mechanisms based on measurements of N2O from dairy cows in respiration chambers [20]. A release from the rumen via eructation was excluded by the authors as there was no relationship at all between CH4 and N2O in ventilation air of the respiration chamber. However, the possibility of N2O formation in the oral cavity can be excluded for the current study as the gas samples were taken directly from the rumen atmosphere without oral contact. Also, feces as a possible source of N2O as discussed for sheep [46] can be excluded in our study due to the sampling method. As enteric formation under anaerobic conditions seems unlikely, the transfer from the forage into the rumen is the most likely way. In our study the AS emitted considerably more N2O than the other forage types. After ingestion of AS, solved N2O may have gassed out in the rumen, which would explain the increased concentrations in the rumen gas sample 180 min after initiation of feed intake.
Also, the CH4 concentrations in the rumen gas sample were influenced by forage type and the lowest concentrations were detected after ingestion of CS. In contrast to N2O methane is formed in the rumen as a product of carbohydrate fermentation, and the total amount is influenced by DMI and chemical composition of the feedstuff [8] as well as by the rumen microbial community (species, abundance, and activity of microbes) and fermentation pathways [47]. An effect of diurnal variation on rumen CH4 concentrations as described by Bjerg et al. [48] can be excluded due to the experimental design. A decreased concentration is not necessarily connected with a decreased total CH4 formation; however, a reduced formation of CH4 in the rumen of cattle fed CS in comparison to other forage types has also been observed in other studies [9] and is related to the increased propionate to acetate ratio and a decreased rumen pH caused by feedstuffs with enhanced degradability (e.g., increased starch and reduced fiber concentration like CS in the present study) [4,49].
The CO2 concentration in rumen gas samples was greatest after ingestion of GH and did not differ for CS and AS, and all concentrations were in the range of values summarized from several feeding trials [50]. The CH4 to CO2 ratio was lower for CS and GH than for AS. The lower ratio seems to be caused by the lower CH4 concentration for CS as discussed before and an increased share of CO2 for GH where DMI was highest. As the amount of consumed DM and its fermentability are the main factors influencing the CO2 production [31] the amount of ingested fermentable substrate might explain the higher CO2 concentration for GH. The CH4 to CO2 ratio can be seen as an indicator of the efficiency of microbial fermentation as it directly describes the share of emitted C that has not been metabolized to CO2 [31]. According to this, the efficiency of microbial fermentation was lowest for AS. As the DMI was lowest for AS, a reduced passage rate of the digesta could have caused an increased methanogenesis. McAllister et al. [8] concluded from several studies that properties of forages decreasing the rate of digestion or prolonging the time of feed particles being in the rumen generally lead to a rise in the amount of CH4 that is formed per unit of forage digested. In contrast, recent work by Dittmann et al. [51] carefully proposed the opposite way as the CH4 production itself might influence digesta retention in the sense of a feedback mechanism to mitigate CH4 losses by decreasing retention time at higher CH4 production.

5. Conclusions

The experimental setup in this study with very diverging types of forages and a 3 × 3 Latin square design made it possible to assign gaseous emissions from steers to animal- or feed-related origin. Results indicate that fermented forages rich in CP or nitrate like alfalfa silage can release climate-relevant N2O with the conditions of its formation, emitting amounts and strategies for reduction (e.g., targeted use of silage additives, feed-out management) warranting further research. Under the aspect of mitigating GHG emissions from animal production also the feeding management of farms has to be considered. The N2O detected in the rumen gas of the steers seems to originate from the consumed feedstuff and is probably not synthesized in the rumen. Additional studies, e.g., with high-yielding dairy cows and concurrent analyses of feedstuffs and environmental conditions are needed to make those findings applicable for ruminants in general.

Author Contributions

Conceptualization, K.G., W.B. and K.-H.S.; Data curation, A.C.H.S. and M.T.; Investigation, K.G.; Methodology, A.J.S., A.C.H.S. and M.T.; Project administration, W.B. and K.-H.S.; Supervision, K.-H.S.; Validation, M.T.; Visualization, A.J.S.; Writing—Original draft, K.G.; Writing—Review & editing, A.J.S., M.T. and K.-H.S.

Funding

This work was partially funded by the German Research Foundation (DFG, BU 1235/8-1, Germany).

Acknowledgments

The authors thank the staff of the Educational and Research Center Frankenforst for support in conducting the experiments. Furthermore, this study was partly conducted by members of the Center of Integrated Dairy Research (CIDRe), University of Bonn (Bonn, Germany).

Conflicts of Interest

The authors declare no conflict of interest.

References

  1. Gerber, P.J.; Steinfeld, H.; Henderson, B.; Mottet, A.; Opio, C.; Dijkman, J.; Falcucci, A.; Tempio, G. Tackling Climate Change through Livestock: A Global Assessment of Emissions and Mitigation Opportunities; Food and Agriculture Organization of the United Nations (FAO): Rome, Italy, 2013. [Google Scholar]
  2. Hristov, A.; Oh, J.; Lee, C.; Meinen, R.; Montes, F.; Ott, T.; Firkins, J.; Rotz, A.; Dell, C.; Adesogan, A. Mitigation of Greenhouse gas Emissions in Livestock Production: A Review of Technical Options for Non-CO2 Emissions; FAO Anim. Produon and Health Paper; FAO: Rome, Italy, 2013; Volume 177, pp. 1–206. [Google Scholar]
  3. IPCC. The Physical Science Basis. Contribution of working group I to the Fourth Assessment Report of the Intergovernmental Panel on Climate Change; Cambridge University Press: Cambridge, UK, 2007. [Google Scholar]
  4. McAllister, T.; Newbold, C. Redirecting rumen fermentation to reduce methanogenesis. Aust. J. Exp. Agric. 2008, 48, 7–13. [Google Scholar] [CrossRef]
  5. Johnson, K.A.; Johnson, D.E. Methane emissions from cattle. J. Anim. Sci. 1995, 73, 2483–2492. [Google Scholar] [CrossRef] [PubMed]
  6. Jentsch, W.; Schweigel, M.; Weissbach, F.; Scholze, H.; Pitroff, W.; Derno, M. Methane production in cattle calculated by the nutrient composition of the diet. Arch. Anim. Nutr. 2007, 61, 10–19. [Google Scholar] [CrossRef] [PubMed]
  7. Kirchgessner, M.; Windisch, W.; Müller, H.L. Nutritional Factors for the Quantification of Methane Production. In Proceedings of the 8th Symposium on Ruminant Physiology, 1995; Engelhart, W., Leonhard-Marek, S., Breves, G., Giesecke, D., Eds.; Ferdinand Enke: Stuttgart, Germany, 1995; pp. 333–348. [Google Scholar]
  8. McAllister, T.; Cheng, K.-J.; Okine, E.; Mathison, G. Dietary, environmental and microbiological aspects of methane production in ruminants. Can. J. Anim. Sci. 1996, 76, 231–243. [Google Scholar] [CrossRef] [Green Version]
  9. Eckard, R.J.; Grainger, C.; de Klein, C.A.M. Options for the abatement of methane and nitrous oxide from ruminant production: A review. Livest. Sci. 2010, 130, 47–56. [Google Scholar] [CrossRef]
  10. Prusty, S.; Sontakke, U.; Kundu, S. Methane and nitrous oxide emission from livestock manure. Afr. J. Biotechnol. 2014, 13, 4200–4207. [Google Scholar]
  11. Lee, C.; Araujo, R.C.; Koenig, K.M.; Beauchemin, K.A. In situ and in vitro evaluations of a slow release form of nitrate for ruminants: Nitrate release rate, rumen nitrate metabolism and the production of methane, hydrogen, and nitrous oxide. Anim. Feed Sci. Technol. 2017, 231, 97–106. [Google Scholar] [CrossRef]
  12. Macome, F.M.; Pellikaan, W.F.; Schonewille, J.T.; Bannink, A.; van Laar, H.; Hendriks, W.H.; Warner, D.; Cone, J.W. In vitro rumen gas and methane production of grass silages differing in plant maturity and nitrogen fertilisation, compared to in vivo enteric methane production. Anim. Feed Sci. Technol. 2017, 230, 96–102. [Google Scholar] [CrossRef]
  13. Hippenstiel, F.; Pries, M.; Büscher, W.; Südekum, K.-H. Comparative evaluation of equations predicting methane production of dairy cattle from feed characteristics. Arch. Anim. Nutr. 2013, 67, 279–288. [Google Scholar] [CrossRef] [PubMed]
  14. Storm, I.M.L.D.; Hellwing, A.L.F.; Nielsen, N.I.; Madsen, J. Methods for measuring and estimating methane emission from ruminants. Animals 2012, 2, 160–183. [Google Scholar] [CrossRef] [PubMed]
  15. Fernández, C.; López, M.; Lachica, M. Low-cost mobile open-circuit hood system for measuring gas exchange in small ruminants: From manual to automatic recording. J. Agric. Sci. 2015, 153, 1302–1309. [Google Scholar] [CrossRef]
  16. Place, S.E.; Pan, Y.; Zhao, Y.; Mitloehner, F.M. Construction and operation of a ventilated hood system for measuring greenhouse gas and volatile organic compound emissions from cattle. Animals 2011, 1, 433–446. [Google Scholar] [CrossRef] [PubMed]
  17. Hassanat, F.; Gervais, R.; Julien, C.; Massé, D.I.; Lettat, A.; Chouinard, P.Y.; Petit, H.V.; Benchaar, C. Replacing alfalfa silage with corn silage in dairy cow diets: Effects on enteric methane production, ruminal fermentation, digestion, N balance, and milk production. J. Dairy Sci. 2013, 96, 4553–4567. [Google Scholar] [CrossRef] [PubMed]
  18. Haque, M.N.; Hansen, H.H.; Storm, I.M.; Madsen, J. Comparative methane estimation from cattle based on total CO2 production using different techniques. Anim. Nutr. 2017, 3, 175–179. [Google Scholar] [CrossRef] [PubMed]
  19. Rotz, C.A.; Thoma, G. Assessing carbon footprints of dairy production systems. In Large Dairy Herd Management, 3rd. ed.; Beede, D.K., Ed.; American Dairy Science Association: Champaign, IL, USA, 2017; pp. 19–31. [Google Scholar]
  20. Petersen, S.O.; Hellwing, A.L.F.; Brask, M.; Højberg, O.; Poulsen, M.; Zhu, Z.; Baral, K.R.; Lund, P. Dietary nitrate for methane mitigation leads to nitrous oxide emissions from dairy cows. J. Environ. Qual. 2015, 44, 1063–1070. [Google Scholar] [CrossRef] [PubMed]
  21. Emery, I.; Mosier, N. Direct emission of methane and nitrous oxide from switchgrass and corn stover: Implications for large-scale biomass storage. GCB Bioenergy 2015, 7, 865–876. [Google Scholar] [CrossRef]
  22. Wang, L.C.; Burris, R. Toxic gases in silage, mass spectrometric study of nitrogenous gases produced by silage. J. Agric. Food Chem. 1960, 8, 239–242. [Google Scholar] [CrossRef]
  23. Spoelstra, S.F. Nitrate in silage. Grass Forage Sci. 1985, 40, 1–11. [Google Scholar] [CrossRef]
  24. Pahlow, G.; Muck, R.E.; Driehuis, F.; Oude Elferink, S.J.W.H.; Spoelstra, S.F. Microbiology of ensiling. In Silage Science and Technology; Buxton, D.R., Muck, R.E., Harrison, J.H., Eds.; ASA, CSSA, SSSA: Madison, WI, USA, 2003; pp. 31–93. [Google Scholar]
  25. Zhao, Y.; Wexler, A.S.; Hase, F.; Pan, Y.; Mitloehner, F.M. Detecting nitrous oxide in complex mixtures using FTIR spectroscopy: Silage gas. J. Environ. Prot. 2016, 7, 1719–1729. [Google Scholar] [CrossRef]
  26. Franco, R. Measuring Emissions and Developing Strategies to Mitigate Volatile Organic Compounds and Oxides of Nitrogen from Silage. Ph.D. Thesis, University of California, Davis, CA, USA, 2016. [Google Scholar]
  27. Schmithausen, A.J.; Trimborn, M.; Büscher, W. Sources of nitrous oxide and other climate relevant gases on surface area in a dairy free stall barn with solid floor and outside slurry storage. Atmos. Environ. 2018, 178, 41–48. [Google Scholar] [CrossRef]
  28. Wulf, S.; Maeting, M.; Clemens, J. Application technique and slurry co-fermentation effects on ammonia, nitrous oxide, and methane emissions after spreading. J. Environ. Qual. 2002, 31, 1795–1801. [Google Scholar] [CrossRef] [PubMed]
  29. Clemens, J.; Trimborn, M.; Weiland, P.; Amon, B. Mitigation of greenhouse gas emissions by anaerobic digestion of cattle slurry. Agric. Ecosyst. Environ. 2006, 112, 171–177. [Google Scholar] [CrossRef]
  30. Schmithausen, A.J.; Trimborn, M.; Büscher, W. Methodological comparison between a novel automatic sampling system for gas chromatography versus photoacoustic spectroscopy for measuring greenhouse gas emissions under field conditions. Sensors 2016, 16, 1638. [Google Scholar] [CrossRef] [PubMed]
  31. Madsen, J.; Bjerg, B.S.; Hvelplund, T.; Weisbjerg, M.R.; Lund, P. Methane and carbon dioxide ratio in excreted air for quantification of the methane production from ruminants. Livest. Sci. 2010, 129, 223–227. [Google Scholar] [CrossRef]
  32. Weißbach, F.; Strubelt, C. Correcting the dry matter content of grass silages as a substrate for biogas production. Landtechnik 2008, 63, 210–246. [Google Scholar]
  33. Weißbach, F.; Strubelt, C. Correcting the dry matter content of maize silages as a substrate for biogas production. Landtechnik 2008, 63, 82–83. [Google Scholar]
  34. VDLUFA. VDLUFA-Methodenbuch, Bd. III. Die Chemische Untersuchung von Futtermitteln; VDLUFA-Verlag: Darmstadt, Germany, 2012. [Google Scholar]
  35. Brandt, M.; Schuldt, A.; Mannerkorpi, P.; Vearasilp, T. Zur enzymatischen Stärkebestimmung im Darminhalt und Kot von Kühen mit hitzestabiler Amylase. Arch. Anim. Nutr. 1987, 37, 455. [Google Scholar]
  36. Menke, K.H.; Steingass, H. Schätzung des energetischen Futterwerts aus der in vitro mit Pansensaft bestimmten Gasbildung und der chemischen Analyse. II. Regressionsgleichungen. Übers Tierernährg 1987, 15, 59–94. [Google Scholar]
  37. GfE. Equations for predicting metabolisable energy and digestibility of organic matter in forage legumes for ruminants. Proc. Soc. Nutr. Physiol. 2017, 26, 186–193. [Google Scholar]
  38. GfE. New equations for predicting metabolisable energy of grass and maize products for ruminants. Proc. Soc. Nutr. Physiol. 2008, 17, 191–197. [Google Scholar]
  39. Weiß, K.; Kaiser, E. Milchsäurebestimmung in Silageextrakten mit Hilfe der HPLC. Wirtschaftseig. Futter 1995, 41, 69–80. [Google Scholar]
  40. von Lengerken, J.; Zimmermann, K. Handbuch Futtermittelprüfung; Deutscher Landwirtschaftsverlag: Berlin, Germany, 1991. [Google Scholar]
  41. Barry, T.; Thompson, A.; Armstrong, D. Rumen fermentation studies on two contrasting diets. 1. Some characteristics of the in vivo fermentation, with special reference to the composition of the gas phase, oxidation/reduction state and volatile fatty acid proportions. J. Agric. Sci. 1977, 89, 183–195. [Google Scholar] [CrossRef]
  42. Lindgren, S.; Pettersson, K.; Kaspersson, A.; Jonsson, A.; Lingvall, P. Microbial dynamics during aerobic deterioration of silages. J. Sci. Food Agric. 1985, 36, 765–774. [Google Scholar] [CrossRef]
  43. McAllister, T.A.; Feniuk, R.; Mir, Z.; Mir, P.; Selinger, L.B.; Cheng, K.J. Inoculants for alfalfa silage: Effects on aerobic stability, digestibility and the growth performance of feedlot steers. Livest. Prod. Sci. 1998, 53, 171–181. [Google Scholar] [CrossRef]
  44. Weinberg, Z.G.; Ashbell, G. Changes in gas composition in corn silages in bunker silos during storage and feedout. Can. Agric. Eng. 1994, 36, 155–158. [Google Scholar]
  45. Kaspar, H.F.; Tiedje, J.M. Dissimilatory reduction of nitrate and nitrite in the bovine rumen: Nitrous oxide production and effect of acetylene. Appl. Environ. Microbiol. 1981, 41, 705–709. [Google Scholar] [PubMed]
  46. De Raphélis-Soissan, V.; Li, L.; Godwin, I.R.; Barnett, M.C.; Perdok, H.B.; Hegarty, R.S. Use of nitrate and Propionibacterium acidipropionici to reduce methane emissions and increase wool growth of Merino sheep. Anim. Prod. Sci. 2014, 54, 1860–1866. [Google Scholar] [CrossRef]
  47. Knapp, J.R.; Laur, G.L.; Vadas, P.A.; Weiss, W.P.; Tricarico, J.M. Invited review: Enteric methane in dairy cattle production: Quantifying the opportunities and impact of reducing emissions. J. Dairy Sci. 2014, 97, 3231–3261. [Google Scholar] [CrossRef] [PubMed]
  48. Bjerg, B.; Zhang, G.; Madsen, J.; Rom, H.B. Methane emission from naturally ventilated livestock buildings can be determined from gas concentration measurements. Environ. Monit. Assess. 2012, 184, 5989–6000. [Google Scholar] [CrossRef] [PubMed]
  49. Beauchemin, K.A.; Kreuzer, M.; O’Mara, F.; McAllister, T.A. Nutritional management for enteric methane abatement: A review. Aust. J. Exp. Agric. 2008, 48, 21–27. [Google Scholar] [CrossRef]
  50. Hegarty, R.; Gerdes, R. Hydrogen production and transfer in the rumen. Rec. Adv. Anim. Nutr. Aust. 1999, 12, 37–44. [Google Scholar]
  51. Dittmann, M.T.; Hammond, K.J.; Kirton, P.; Humphries, D.J.; Crompton, L.A.; Ortmann, S.; Misselbrook, T.H.; Südekum, K.-H.; Schwarm, A.; Kreuzer, M.; et al. Influence of ruminal methane on digesta retention and digestive physiology in non-lactating dairy cattle. Br. J. Nutr. 2016, 116, 763–773. [Google Scholar] [CrossRef] [PubMed]
Figure 1. Sampling (a) of gaseous emissions from the forages stored in a closed container via headspace vials and (b) from the gaseous phase of the rumen with a syringe through the closed lid of the rumen-cannula (left) and filling into a headspace vial (right).
Sustainability 10 03679 g001
Figure 2. The N2O concentration (ppm) in the rumen gas relative to the CH4+CO2 concentration (%) for alfalfa silage, corn silage, and grass hay.
Sustainability 10 03679 g002
Table 1. Chemical composition of forages used for the gaseous measurements and as feedstuffs for the steers (expressed as g/kg dry matter (DM) unless stated; (n = 3)).
Corn Silage (CS)Alfalfa Silage (AS)Grass Hay (GH)
DM [g/kg]366415881
Ash34.912470.5
Crude protein70.724679.2
Ether extract35.930.220.2
aNDFom 1314396599
ADFom 2175300340
Acid detergent lignin17.498.336.8
Starch438n.a.n.a.
In vitro gas production [mL/200 mg DM]64.139.850.5
Metabolizable energy [MJ/kg DM]11.78.789.40
pH3.95.77n.a.
Lactic acid40.78.2n.a.
Acetic acid9.96.3n.a.
Butyric acidn.d. 3n.d.n.a.
Methanol0.31.5n.a.
Ethanol1.71.6n.a.
Water-soluble carbohydrates13.449.8n.a.
NH3-N [g/kg total N]10996.7n.a.
Ethyl acetate [mg/kg DM]54.419.3n.a.
Ethyl lactate [mg/kg DM]105n.d.n.a.
1 aNDFom: neutral detergent fiber assayed with heat-stable amalyse and expressed exclusive residual ash. 2 ADFom: acid detergent fiber expressed exclusive residual ash. n.d.: not detected. n.a.: not analyzed.
Table 2. Effect of forage type (F) and period (P) on emission rates of CH2 and N2O * of samples obtained from corn silage (CS), alfalfa silage (AF) and grass hay (GH) directly after silo opening (8 a.m.) and after 180 min of air exposure (11 a.m.).
Least Square MeansEffect
CSASGHSEMFPF·P
N2O [μg/(kg dry matter × h)]8 a.m.0.109 b24.1 a0.233 b3.810.02n.s.n.s.
11 a.m.0.140 b2.46 a0.176 b0.172<0.010.01<0.01
CO2 [mg/(kg dry matter × h)]8 a.m.391 a141 b8.13 c32.0<0.01n.s.n.s.
11 a.m.170 a19.0 b9.38 b14.4<0.01n.s.n.s.
* Methane was not detected in any forage sample. SEM: standard error of the mean. n.s.: not significant (p < 0.05). a–c Values within a row with different letters are significantly (p < 0.05) different.
Table 3. Effect of forage type (F) and period (P) on dry matter intake (DMI) over 180 min and composition of gaseous samples obtained from the rumen of steers 180 min after initiation of feed intake.
Least Square MeansEffect
Corn Silage (CS)Alfalfa Silage (AS)Grass Hay (GH)SEMFPF·P
DMI [kg/180 min]4.60 b3.22 b6.64 a0.473<0.010.02<0.01
N2O [ppm]0.246 b0.857 a0.171 b0.068<0.01n.s.0.02
CH4 [%]16.9 b20.6 a20.3 a0.8900.01<0.010.03
CO2 [%]46.1 b41.1 b54.8 a2.21<0.01n.s.0.03
CH4:CO20.358 b0.501 a0.372 b0.010<0.010.02<0.01
a–c Values within a row with different letters are significantly (p < 0.05) different. SEM: standard error of the mean. n.s.: not sigificant (p > 0.05).

