Article

Spatial Pattern of Farmland Abandonment in Japan: Identification and Determinants

1
Department of Geography, Division of Humanities, Graduate School of Letters, Hiroshima University, Hiroshima 739-8522, Japan
2
Department of Geography, Faculty of Letters, Nara University, Nara 631-8502, Japan
3
National Institutes for the Humanities, Tokyo 105-0001, Japan
*
Authors to whom correspondence should be addressed.
Sustainability 2018, 10(10), 3676; https://doi.org/10.3390/su10103676
Submission received: 16 August 2018 / Revised: 10 October 2018 / Accepted: 11 October 2018 / Published: 14 October 2018

Abstract

:
In recent years, Japan has undergone an unprecedented increase in farmland abandonment, which not only causes serious environmental problems and rural landscape loss, but also has a significant impact on socio-economic conditions and the livelihood of Japanese farmers. Many studies have analyzed farmland abandonment and its processes and drivers at multiple scales; however, few have focused on East Asia, especially Japan, which is a heavily depopulated country in rural areas suffering from serious abandonment. Therefore, this study attempts to shed light on the spatial patterns and determinants of farmland abandonment in Japan. For this analysis, we used the former municipalities defined in 1950 at a national scale as unit samples. Consequently, the spatial patterns, characteristics and variations of farmland abandonment in Japan are displayed. As for the drivers or determinants, we adopted ordinary least squares (OLS) and geographically weighted regression (GWR) by categorizing the determinants into geographical and socio-economic aspects. We have found that, firstly, farmland abandonment in Japan exhibits a significantly uneven pattern. While taking the farmland abandonment rate as a measurement, the results demonstrate that most abandoned farmland is positively correlated with slope and is highly clustered in the Kanto, Chubu and Chugoku Shikoku regions, compared to other regions that are suitable for agricultural production, such as the Hokkaido and Tohoku regions. Secondly, the arable land ratio of self-sufficient farm households, the ratio of non-successor farm households and the number of laborers per farm household positively affect abandonment. In contrast, arable land area per farm household and paddy field density have a negative impact on abandonment. Thirdly, the determinants are spatially varied among study regions. Farmland abandonment is driven by interactions of multiple determinants and depends on specific local circumstances. Such results can contribute to the understanding of farmland abandonment in Japan, promoting the maintenance of farmland and sustainable agriculture.

1. Introduction

Farmland, as an indispensable form of land use, plays a significant role in the Earth’s ecosystems. It is important, not only for agricultural production, but also for its considerable functioning in the flora and fauna of a region [1,2]. However, in recent years, farmland areas have decreased as a result of abandonment [3], and this is also becoming a reality worldwide [1,4,5,6]. In most regions, farmland abandonment frequently exceeds farmland expansion, an irreversible process [7] that has caused significant natural and socio-economic consequences [8,9]. Many researchers have tried to analyze the processes and drivers of farmland abandonment in developed countries in Europe and North America [10,11,12] and in developing countries in Asia [13,14], and Latin America [15]. However, this phenomenon remains ill-understood in East Asia, particularly in heavily depopulated countries, such as Japan.
A clear understanding of farmland use and dynamics is essential for maintaining biodiversity and agricultural sustainability [16,17,18]. Biodiversity plays a key role in ecosystem stability while sustainable farming and agriculture are essential to preserve natural resources and to maintain rural landscapes and communities [15,19]. In 2015, the United Nations initiated Sustainable Development Goals (SDGs) to work towards a more sustainable future for our planet and society. The Sustainable Development Goal 15 targets biodiversity and life on land in an effort to ensure the conservation, restoration and sustainable use of land and ecosystem services. Recently, abandoned farmland has become a threat to sustainable agriculture; however, the impacts of abandonment are controversial as consequences vary across geographical regions and must be considered relative to the region’s agricultural targets [2,4,20]. Some scholars view farmland abandonment as an opportunity for habitat regeneration, with an added nature value from forests or grasslands restoration [4], while others regard abandonment as a threat to biodiversity that can cause serious environmental issues, such as landscape and habitat loss. Regardless of the environmental impacts, abandoned farmland can lead to reduced agricultural production and weakened socio-economic conditions in rural communities [1]. In the case of Japan, most Japanese scholars insist that farmland abandonment has both positive and negative impacts on the environment, but primarily negative socio-economic consequences for agriculture and food security [21,22,23]. In response, the Japanese government updated its law for sustainable agricultural practices to the Basic Law on Food, Agriculture and Rural Areas, which began being enforced in 1999. This law was necessary in order to promote agricultural production that remains in harmony with the environment without compromising food security, thereby leading to the healthy development of agriculture.
Farmland abandonment is usually a dynamic process driven by multiple factors, and the setting of proper time spans and scales for study can be expected to significantly influence its determinants [14,24,25]. Empirical studies have elucidated spatial patterns of farmland abandonment and its drivers in Europe at different times and scales [18,26]. In terms of spatial patterns, remote sensing (RS) is widely used to capture and monitor farmland abandonment variations [27,28,29]. This technology allows researchers to identify spatial patterns, as well as areas with low and high abandonment rates quickly and precisely. However, many researchers have found that farmland abandonment is a complex multi-dimensional process, interlinked with regional environmental, economic and social conditions [9,11,30,31,32,33]. Drivers of abandonment are spatially diverse and are difficult to monitor due to the elusive regional or local circumstances [18,34]. This diversity is reflected not only in the spatial identification of abandonment but also in the regional variations in the characteristics of socio-economic development and land use [1]. Determinants are often examined at pixel, village or household levels [11,32,35]. Such information supports regional planners and policy-makers to implement effective countermeasures, such as controlling possible environmental impacts of land abandonment or preventing its expansion by issuing new laws and regulations [13,36].
In Japan, farmland abandonment has been a longstanding problem. Statistics show that arable land contraction started in the early 1990s, with arable land use declining from 6.09 million hectares in 1961 to 4.52 million hectares in 2014 (MAFF, 2015). On the one hand, abandonment has always occurred initially in mountainous areas [35]. The Japanese archipelago has a very complicated geography, with many hilly and mountainous areas (in Japanese: Chusankanchiiki) distributed widely throughout the country (accounting for approximately 40% of the total agricultural area) [37]. In these areas, agriculture is difficult to maintain, and the shortage of labor cannot be supplemented immediately due to the lack of agricultural successors, aging, and outflow of the population, among other factors [21]. These factors are the prerequisite for the existence of high rates of abandoned farmland, especially in rural mountain villages. On the other hand, Japan is experiencing heavy depopulation and aging problems especially in rural areas [38]. This social background is extremely unfavorable for agriculture because the effectiveness of cultivation and the lack of labor in agriculture directly promote abandonment [22]. A total of 423,064 hectares of farmland were abandoned in 2015 alone, followed by a decline in farm households and agricultural labor (MAFF, 2015). As such, it is necessary to study farmland abandonment by making good use of agricultural census data from a national context.
Only a few studies focus on national-level analysis of the spatial patterns and regional variations of farmland abandonment in Japan. Thus far, most of the previous studies were conducted at the regional scale in the form of case studies [39]. This limits the understanding across broader Japan, and observations cannot be generalized across a broad scale. Every 5 years, the Japanese census of agriculture and forestry publishes statistics based on former municipalities (Japan has three levels of government: national, prefectural, and municipal, and there are four types of municipalities: cities, towns, villages and special wards (the Ku of Tokyo), which are also known as Shichoson in Japanese. Municipalities have undergone considerable consolidation three times, and their number decreased from 71,314 in 1988 to 1821 in 2006 [40]), as in 1950, thereby contributing to the promotion of agriculture and forestry at this level. Specifically, each municipality has a unique boundary that differs from current administrative units. By employing former municipalities in our study, we can clearly visualize changes in farmland abandonment and therefore gain an in-depth understanding of this process. In addition, numerous empirical studies on driving forces or determinants of abandonment only consider global regression [3,22]. Although these studies have enabled us to identify drivers from a general relationship over a study region, they cannot be used to explore spatially varying relationships. Therefore, we attempt to evaluate the determinants of farmland abandonment comprehensively and to improve the understanding of this phenomenon using local regression, which might not have been previously used.
To fill the aforementioned gaps, this study attempts to (1) identify the temporal and spatial patterns, as well as variations, of farmland abandonment. The results will outline the spatial patterns and identify the clusters and low or high abandonment rate areas; (2) explore how, and to what extent, geographical and socio-economic determinants affect abandonment by global regression. These findings are essential for understanding the roles of selected variables in abandonment in East Asia and the differences from other nations; and (3) discuss the regional differences and spatial variations of determinants using local regression. This outcome will generate a comprehensive understanding of abandonment associated with local geographical and socio-economic circumstances across study regions and will, therefore, culminate in some recommendations for future farmland use. Japan’s case would be a good empirical example for the supplemental understanding of farmland abandonment in general and for those who want to thoroughly examine agriculture in a heavily depopulated society.

2. Materials and Methods
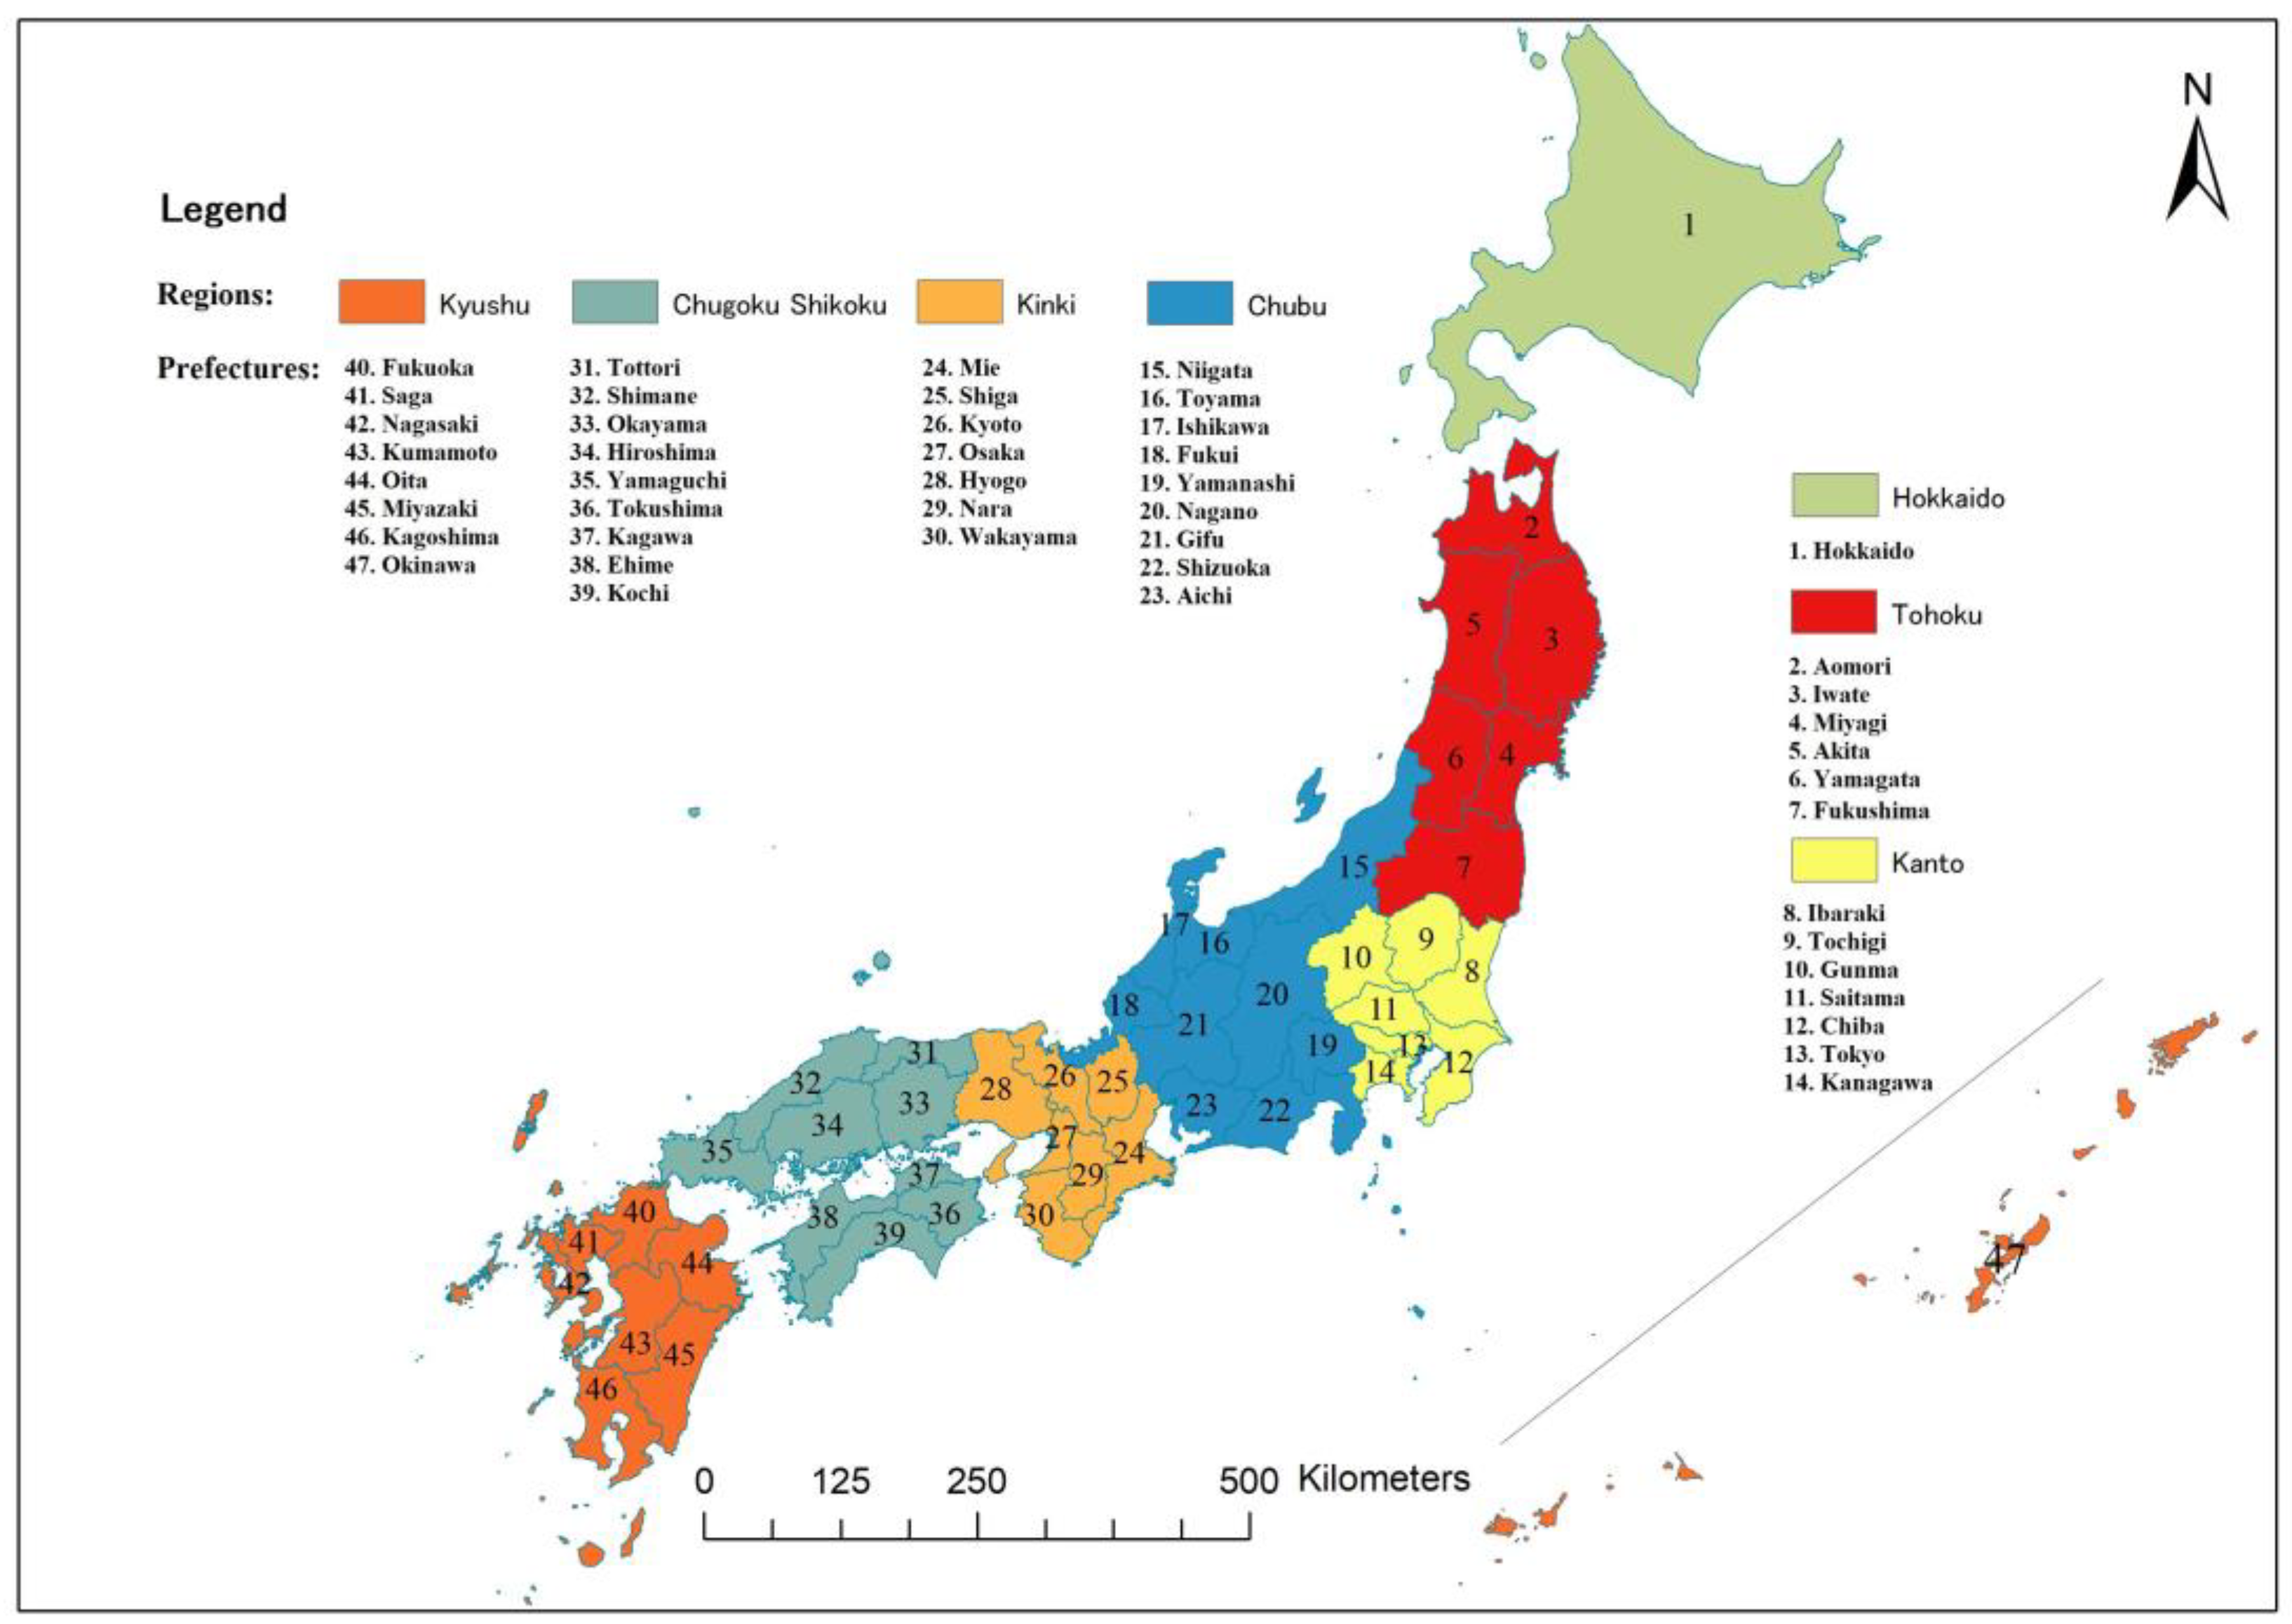
2.1. Study Area

This study was conducted in the national context of Japan, including 47 prefectures in 7 main regions: Hokkaido, Tohoku, Kanto, Chubu, Kinki, Chugoku Shikoku and Kyushu (Figure 1). The Japanese archipelago lies between latitudes 24° and 46° N and longitudes 122° and 146° E in East Asia, with an area of 377,923.1 km2. This region contains various kinds of landscapes, including flatland, hilly and mountainous areas, isolated island zones, etc. [22], of which mountainous areas occupy 73% of the total land area. Japan is located in a tectonic plate movement zone with various physiographical phenomena. Therefore, the number of earthquakes and active volcanoes is relatively high [41]. Japan has a total population of 127.11 million, according to the national population census in 2015, and approximately 26.0% of the population is older than 65 years. The main climate is a temperate marine climate, although the changes in the four seasons are distinct, depending on the effects of seasonal winds and ocean currents. There are more than 2700 river basins. However, most rivers are short and swift and flow erratically with little water available for use (FAO. 2016. AQUASTAT website. Food and Agriculture Organization of the United Nations (FAO)). Therefore, farms have developed reservoir irrigation systems to better utilize river and pond water, which is suitable for paddy rice fields in the lower plains.

2.2. Data

In the agricultural census, abandoned farmland is defined by the Ministry of Agriculture Forestry and Fisheries (MAFF) as farmland that has not been cultivated for more than one year and where there is no indication that it will be cultivated in subsequent years [38]. We used this definition and calculated a farmland abandonment rate (FLAR) to present and evaluate abandonment conditions, which can be expressed as:
F L A R = L a / L t
where F L A R is the farmland abandonment rate, L a is the total abandoned farmland and L t pertains to the total arable land.
Research data were derived from the National Census of Agriculture and Forestry in 2015 (In Japanese: 2015 Noringyo Census). Digital elevation models (DEMs) are distributed by the Geospatial Information Authority of Japan (GSI), with a spatial resolution of 10 m. Geographical variables were calculated from raster maps (Figure 2), whereas most socio-economic variables were available and are displayed in the form of polygons at the former municipality level.
There are two main reasons for selecting boundaries of former municipalities, in this case from 1950, at a national scale (Figure 2): contemporary administrative units are too large to describe regional variations in detail; in contrast, agricultural settlement units are too small to have sufficient data support. However, there is a disadvantage in using former municipalities. In order to preserve household privacy, the local government refused to provide real data of their true location because of the limited number of farm households in some regions. In our calculation, we carefully examined and excluded municipalities with limited data, and we finally retained 9368 municipalities. All the processes were calculated using SPSS Statistics 21.0 (IBM SPSS Japan: Tokyo, Japan), ArcGIS 10.3 (ESRI Japan: Tokyo, Japan), and Geoda (the University of Chicago, Chicago, IL, USA) software packages.

2.3. Description and Selection of Explanatory Variables

As stated in the introduction, determinants of farmland abandonment are usually assessed by different scholars into environmental (natural) and socio-economic aspects [4]. Environmental factors refer to meteorological factors such as precipitation [14], temperature [11]; ecological factors such as soil condition [35], forest rate [36]; and geographical factors such as slope and elevation [10,15,24]. In Japan, meteorological factors have been discussed by Osawa (2016) at the 10 × 10-km2 mesh scale [22]. In our analysis, we considered geographical conditions that is available from former municipalities, such as slope [32] and remoteness or accessibility [15,42]. We calculated the mean center of each municipality and projected the slope value onto the center. Finally, “X1: Mean slope”, “X2: Expressway density” and “X3: Railroad density” were introduced to present the geographical condition of each municipality (Table 1).
For socio-economic determinants: the theories used to explain farmland abandonment are based on socio-economic conditions of human behavior or economic conditions [11,42]. Socio-economic conditions are difficult to measure, and sometimes we cannot cover all aspects. MAFF usually conducts its census based on farm households in order to represent the condition in the municipality. To abandon farmland or not is usually a household decision that depends on the household and farmland characteristics [3,4]. In this study, we categorized socio-economic factors into farm-household-related and farmland-related groups. In Japan, the total set of farm households (household engaged in farming and managing cultivated land of 10 ares or more, or earning more than 150,000 yen per year from sales of agricultural products; an are is 100 m2) consists of self-sufficient farm households (a farm household managing cultivated land of less than 30 ares, and earning less than 500,000 yen per year from sales of agricultural products), commercial farm households (farm household managing cultivated land of 30 ares or more, or earning more than 500,000 yen per year from sales of agricultural products), and land tenure non-farm households. Agricultural management entities (an establishment that either performs agricultural production directly or on contract and fulfills one of the following conditions: (1) manages 30 ares or more cultivated land; (2) possesses a planted area or cultivated area or a number of livestock being raised or delivered that is equal to or greater than a predetermined standard (e.g., 15 ares for outdoor grown vegetables, 350 m2 for vegetables grown in facilities, one cow); (3) accepts farm work on contract) refer to the combination of commercial farm households, agricultural holdings other than a farm household, and agricultural service enterprises. Firstly, to describe the household land tenure structure, “X4: Arable land ratio of self-sufficient farm households” and “X5: Arable land ratio of land tenure non-farm households” were selected. Self-sufficient households potentially produce and consume the agricultural products themselves, while non-farm households have lower utilization of their farmland, both of which are considered to be more likely to abandon their farmland than households that are fully engaged in agriculture. “X6: Arable land area per farm household”, which shows the household farming scale [23], was also included. Secondly, “X7: Ratio of the first type of part-time farm households” was selected to evaluate the farm households’ income structure [39]. There are two types of part-time farm households. The first type is households where at least one member is engaged in non-farm employment and whose farm income exceeds their non-farm income, while the second type is households where at least one member engages in non-farm employment and whose non-farm income exceeds their farm income [38]. Thirdly, we evaluated farm households’ laborers and successors to represent their labor situation. Households with insufficient agricultural laborers and a lack of successors were found to be inclined to abandon their farmland [24,35]. Consequently, we selected “X8: Laborers per farm household” and “X9: Ratio of non-successor farm households”. For farmland-related variables (Table 2), land tenancy and its extent were mainly considered. An empirical study showed that the leasing of farmland could be a promising measure to prevent abandonment [17]. “X10: Ratio of leased (tenanted) land” and “X11: Ratio of leased-out land” were therefore selected. In Japan, the majority of arable land is rice paddy fields, which have a profound connection with farmland abandonment [43]. As a result, we selected “X12: Paddy field density” as an important variable. Table 2 shows our socio-economic variables and their description for the evaluation of socio-economic conditions in each municipality. Variables from 2010 and 2015 were available as study periods, while we displayed data from 2015, which are closer to the current situation, and data from 2010 were used for verification.

2.4. Methods

In this study, we employed global and local regression to perform our analysis. In global regression, ordinary least squares (OLS) can estimate one set of correlation parameters among global independent and dependent variables. In terms of local regression, geographically weighted regression (GWR) can estimate parameters differently depending on spatial correlations among neighboring regions and can explain their explicit spatial variations. In addition, Moran’s I is adopted as an extension of the Pearson correlation coefficient, which can determine the existence of spatial autocorrelation among variables [44].

2.4.1. Ordinary Least Squares (OLS)

Multiple regression analysis is a highly flexible method for examining the relationship between independent variables and a dependent variable [45]. In reality, it is necessary to consider two or more influential factors as independent variables for explaining the changes in the dependent variable; this is what is meant by multiple regression. When the relationship between multiple independent variables and the dependent variable is linear, it is called multiple linear regression, which is also known as ordinary least squares (OLS) and can be expressed as:
y ^ i = β 0 + x 1 β 1 + x 2 β 2 + + x i β i + ε i ,
where i is the number of variables, β i is the regression coefficient value, and ε i is the random error.

2.4.2. Geographically Weighted Regression (GWR)

Recently, the simple but powerful method of geographically weighted regression (GWR) has been widely used to explore continuously varying relationships at multiple scales. It can be applied in various fields, such as ecology, economy, land-use studies, social studies, and environmental studies [46]. GWR estimates the parameter for each location ( u i , v i ) using a weighted least squares method, which can be expressed as:
y ^ i = β 0 ( u i , v i ) + k = 1 p β k ( u i , v i ) x i k + ε i ,
where ( u i , v i ) represents the coordinate location of the observation i , β k ( u i , v i ) represents the regression parameters, and ε i is the random error.
The weight matrix is expressed as W ( i ) , and according to the principle of the weighted least squares method, the original parameter at location i is estimated as:
β ^ ( i ) = [ X T W ( i ) X ] 1 X T W ( i ) Y .
where
W ( i ) = , X = [ 1 x 11 x p 1 1 x 12 x p 2 1 x 1 n x p n ] ,   and   Y = [ y 1 y 2 y n ] .

2.4.3. Local Moran’s I

There are two primary types of spatial autocorrelation that are relevant to regression analysis: global and local spatial autocorrelations. Anselin (1995) proposed local Moran’s I as a measure of local spatial autocorrelation to address the issue that global spatial autocorrelation cannot accurately quantify relationships in all parts of a study area in sufficient detail [47]. It is reasonable to assume that spatial patterns observed in closely spaced data are more likely to be similar than those that are further apart. Values of Moran’s I vary from −1 to 1, where a value near 1 indicates spatial clustering, while a value near −1 indicates spatial dispersion. Local Moran’s I was defined as:
M o r a n s I = n S j = 1 n k = 1 n W j k ( x j X ´ ) ( x k X ´ ) j = 1 n ( x j X ´ ) 2 ,
where n is the total number of municipalities, X ´ is the mean of x, W j k is the weight between cases j and k, and s is the sum of all W j k :
S = j = 1 n k = 1 n W j k

3. Results

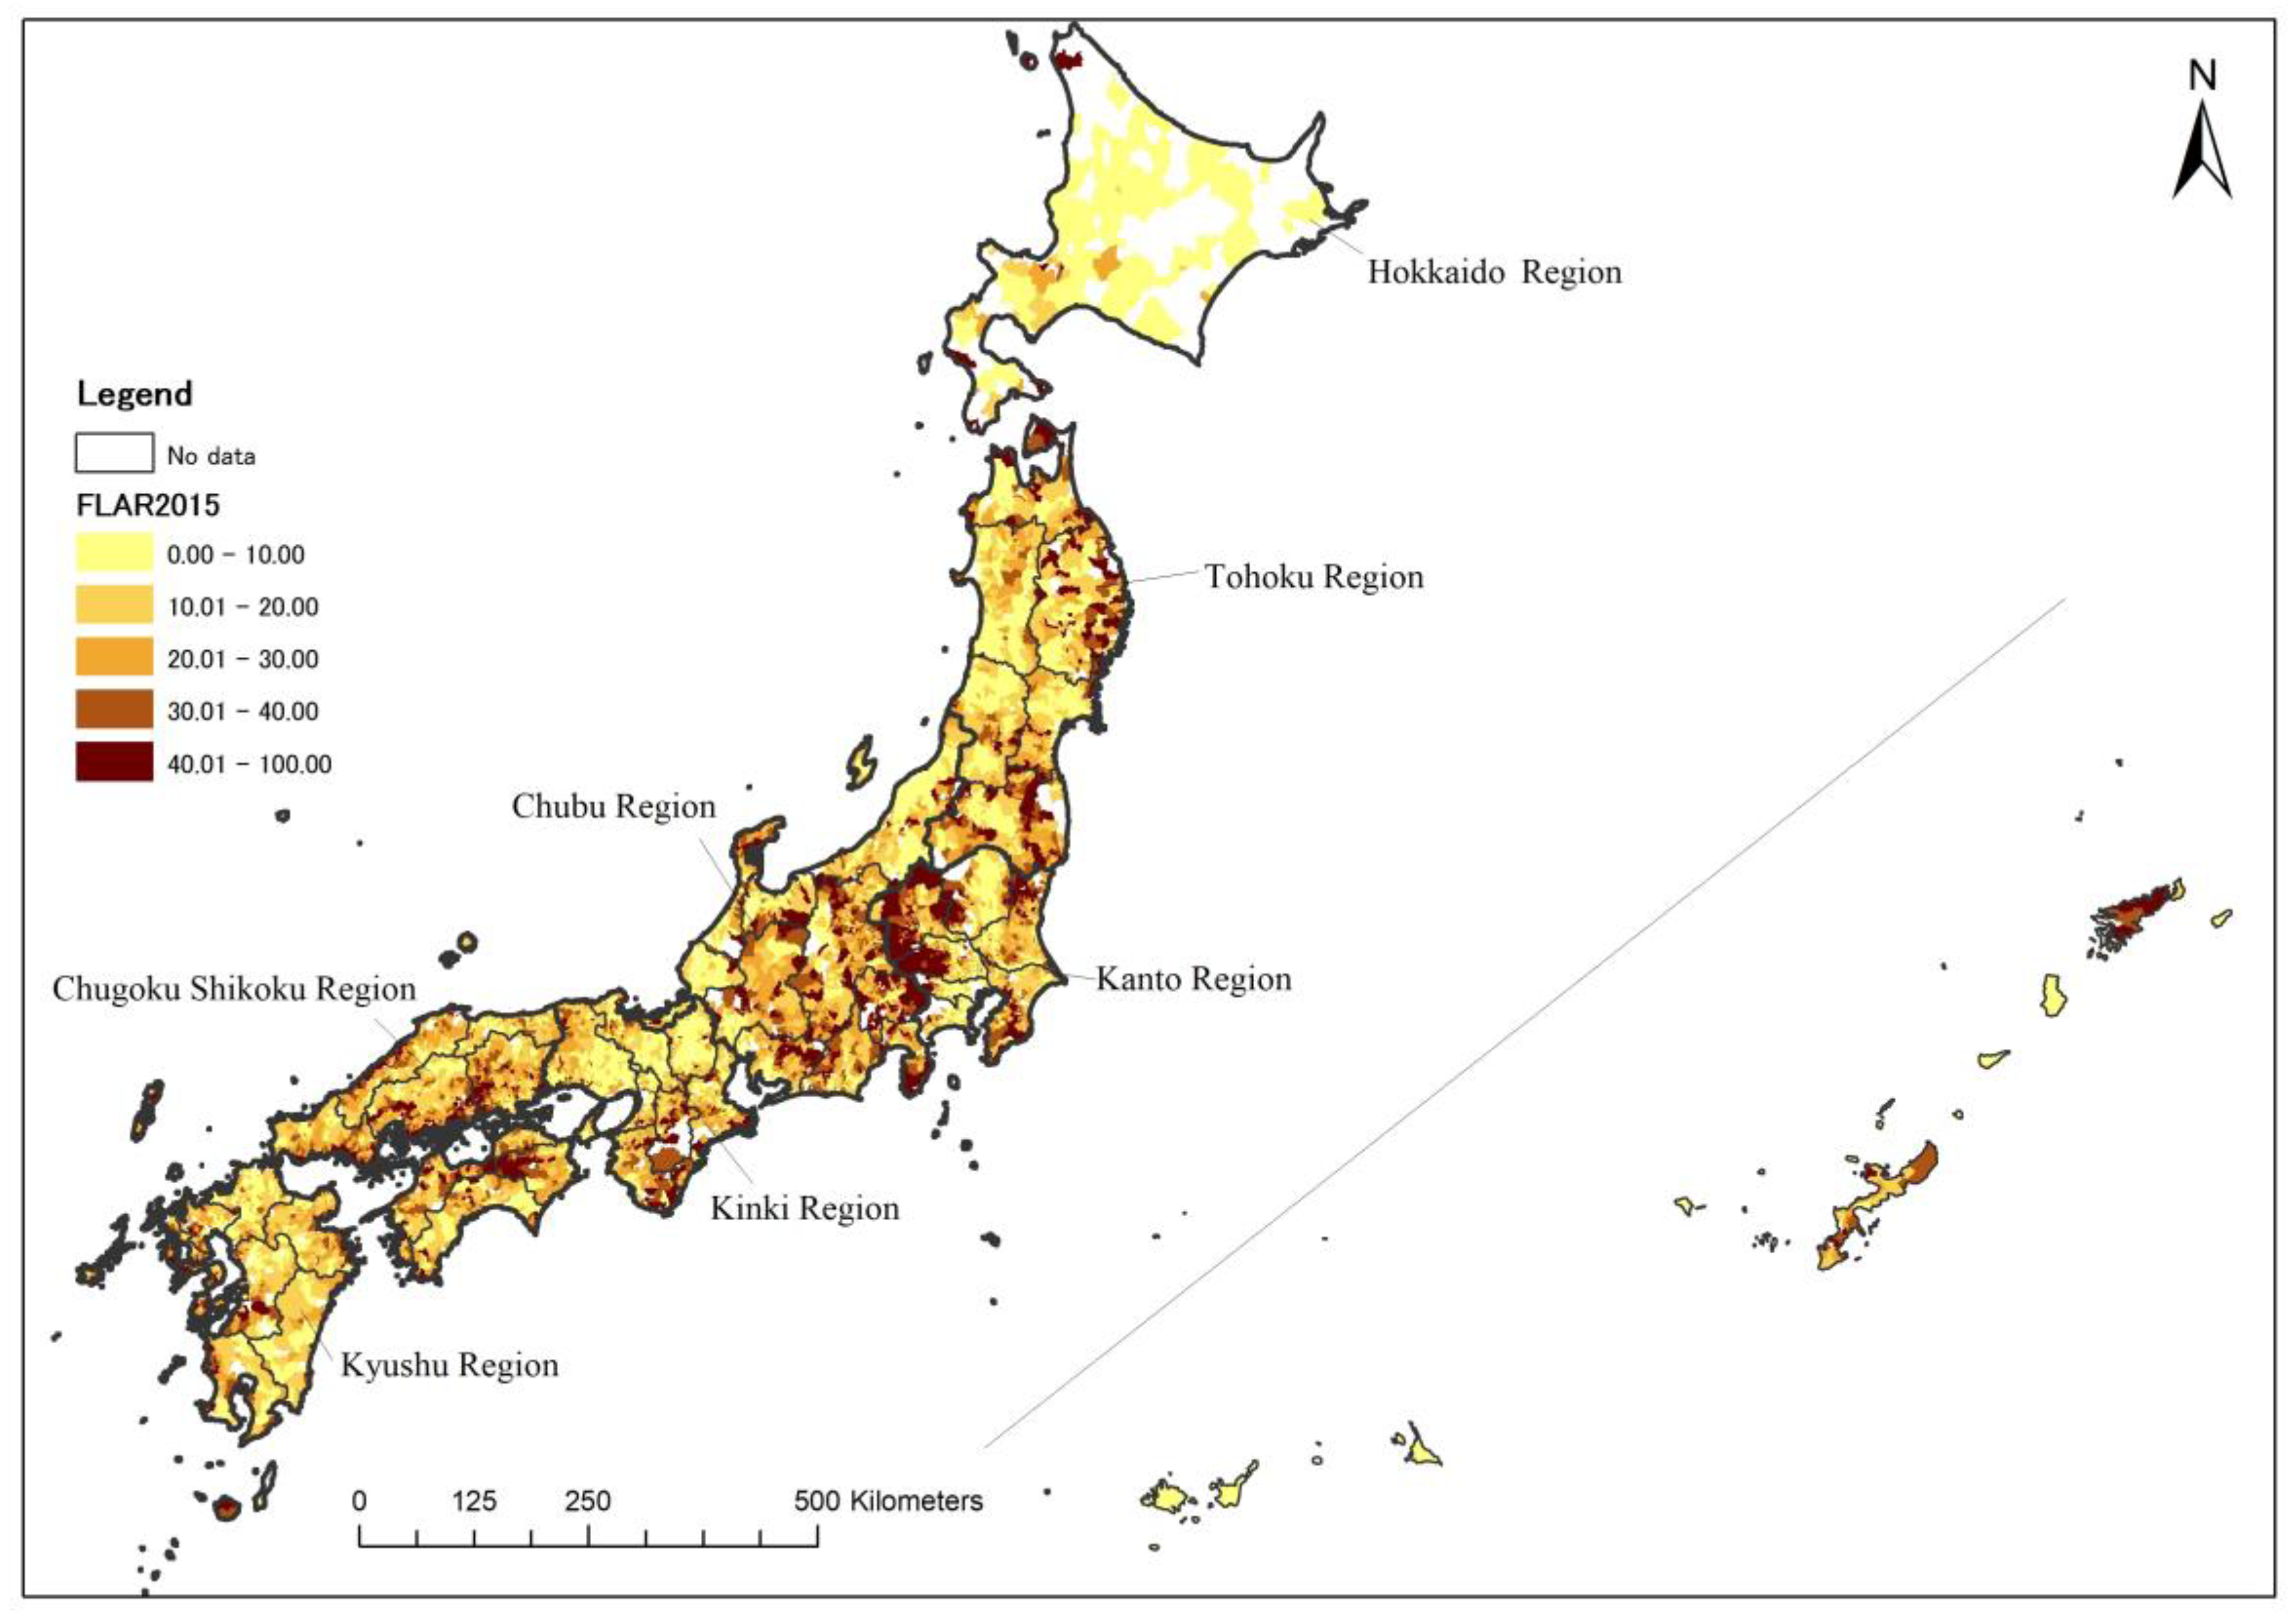
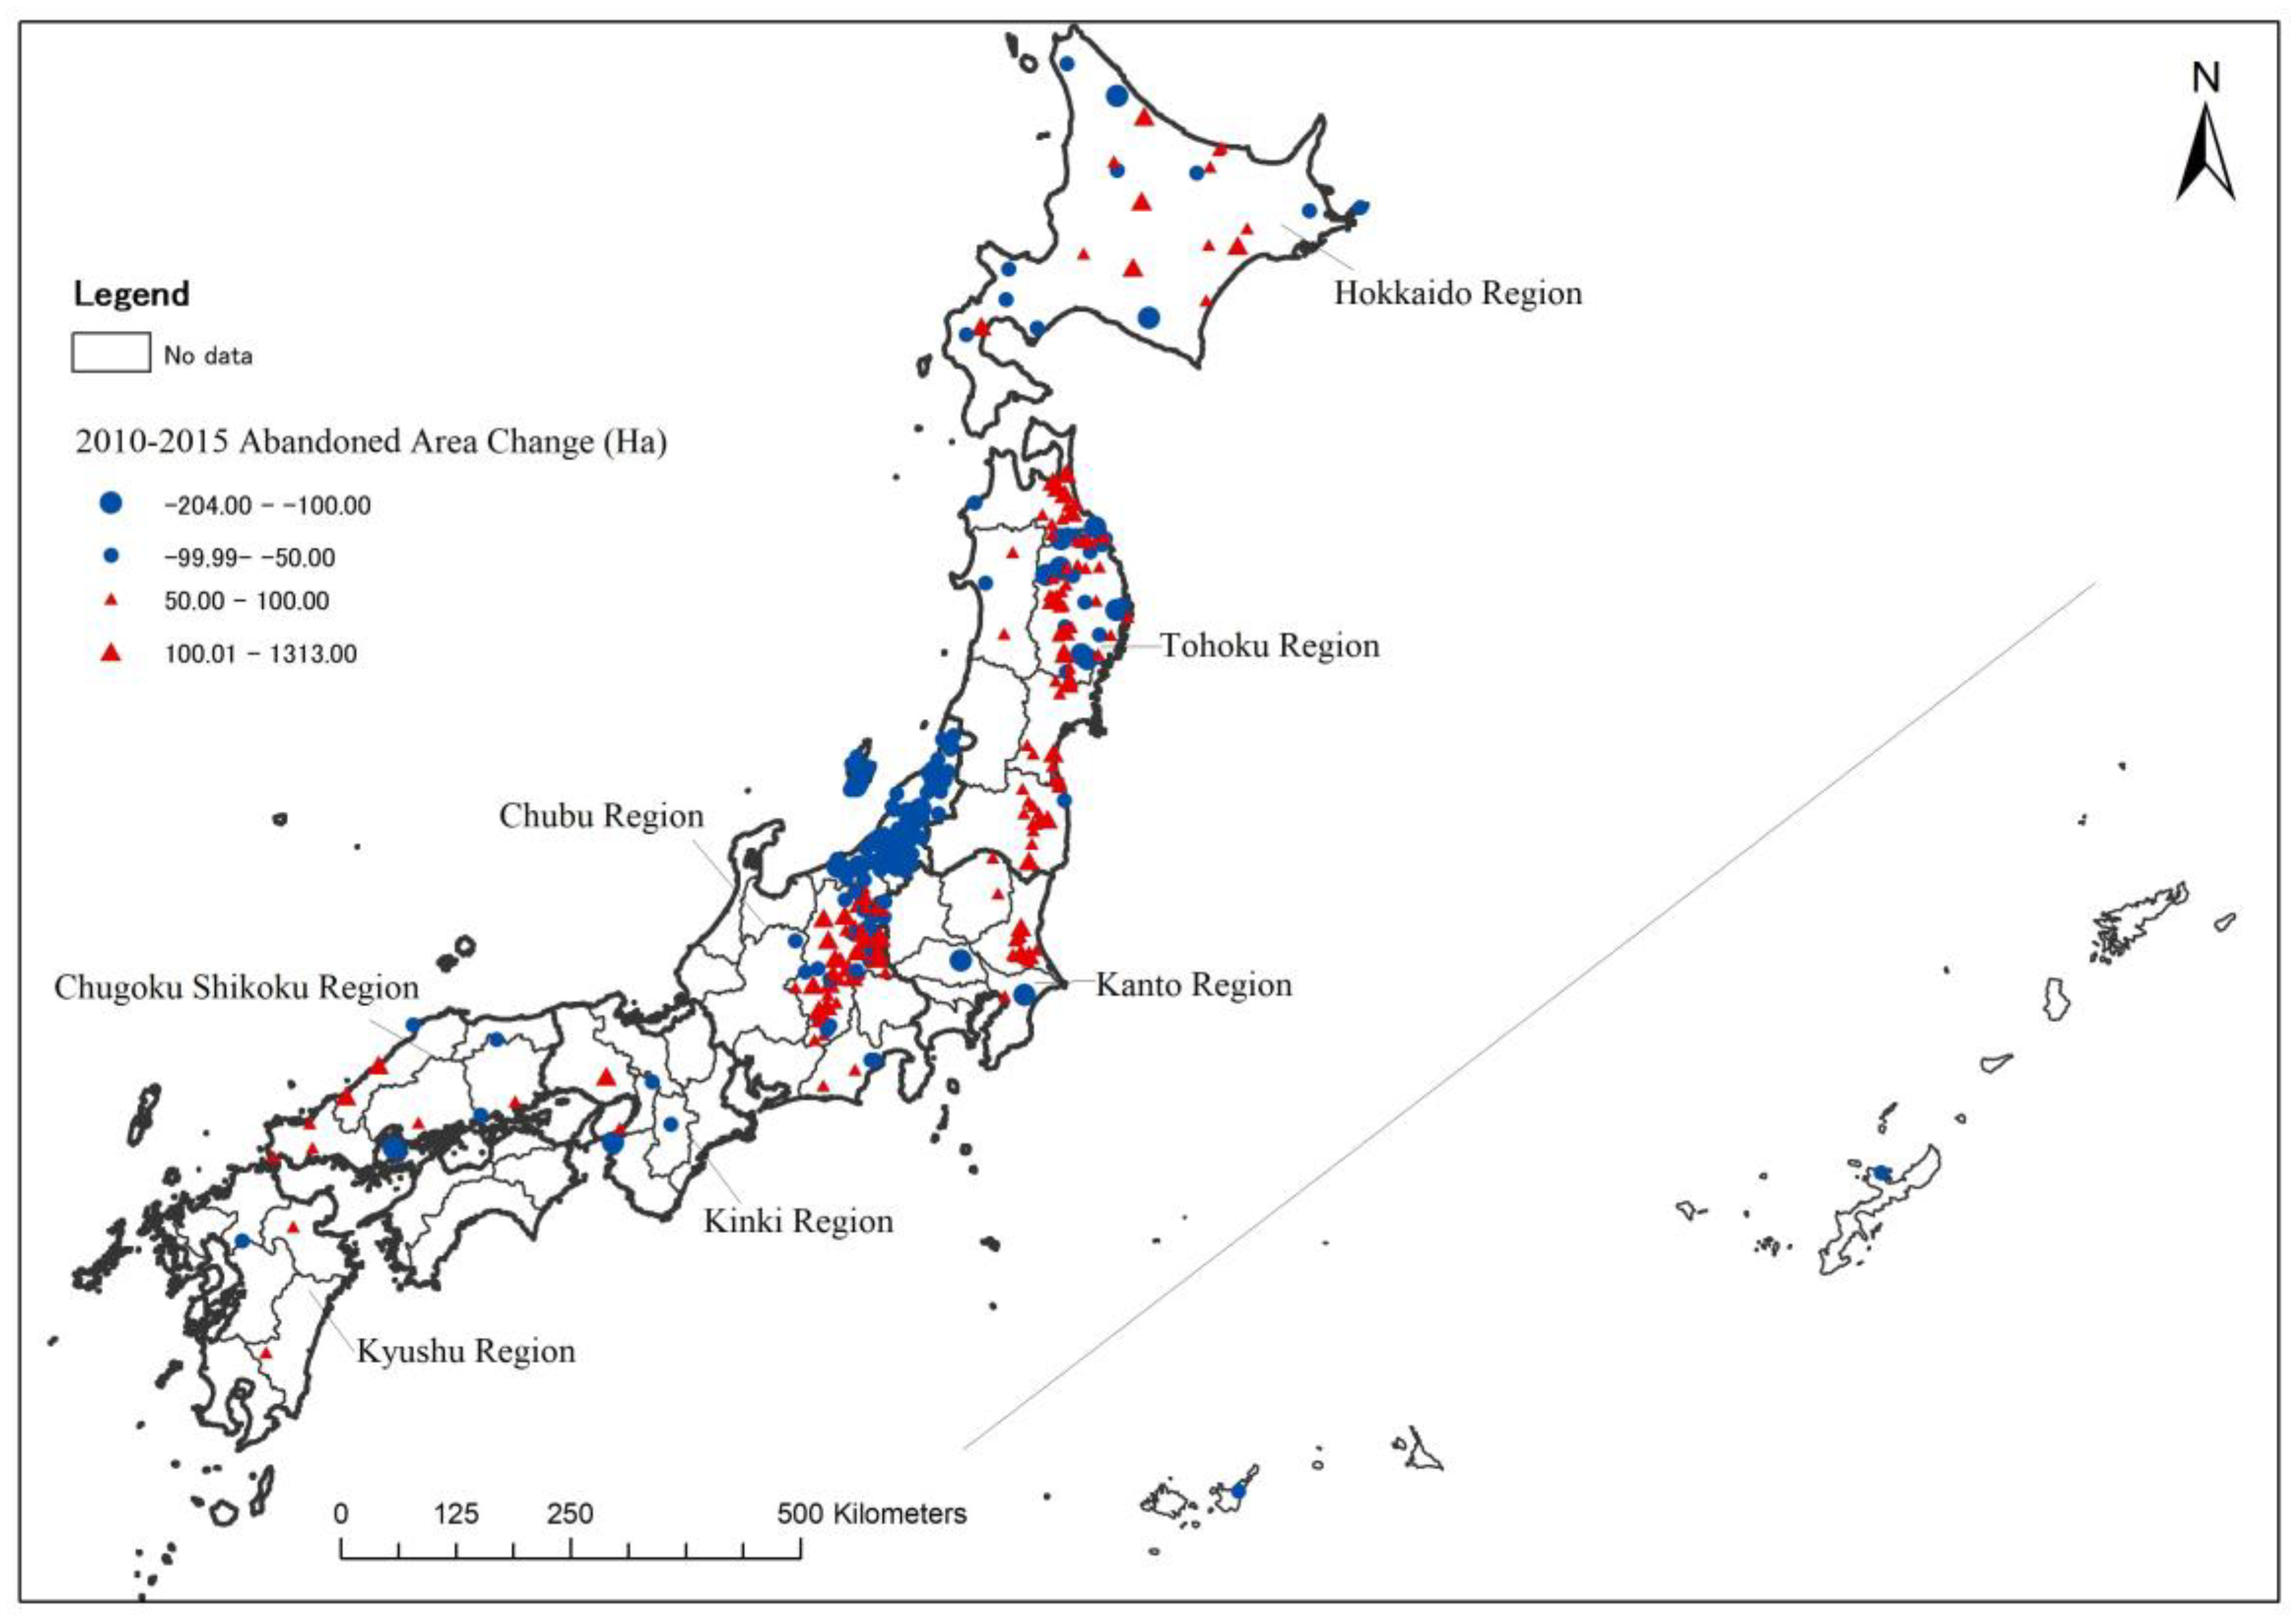
3.1. Spatial Patterns of Farmland Abandonment in Japan

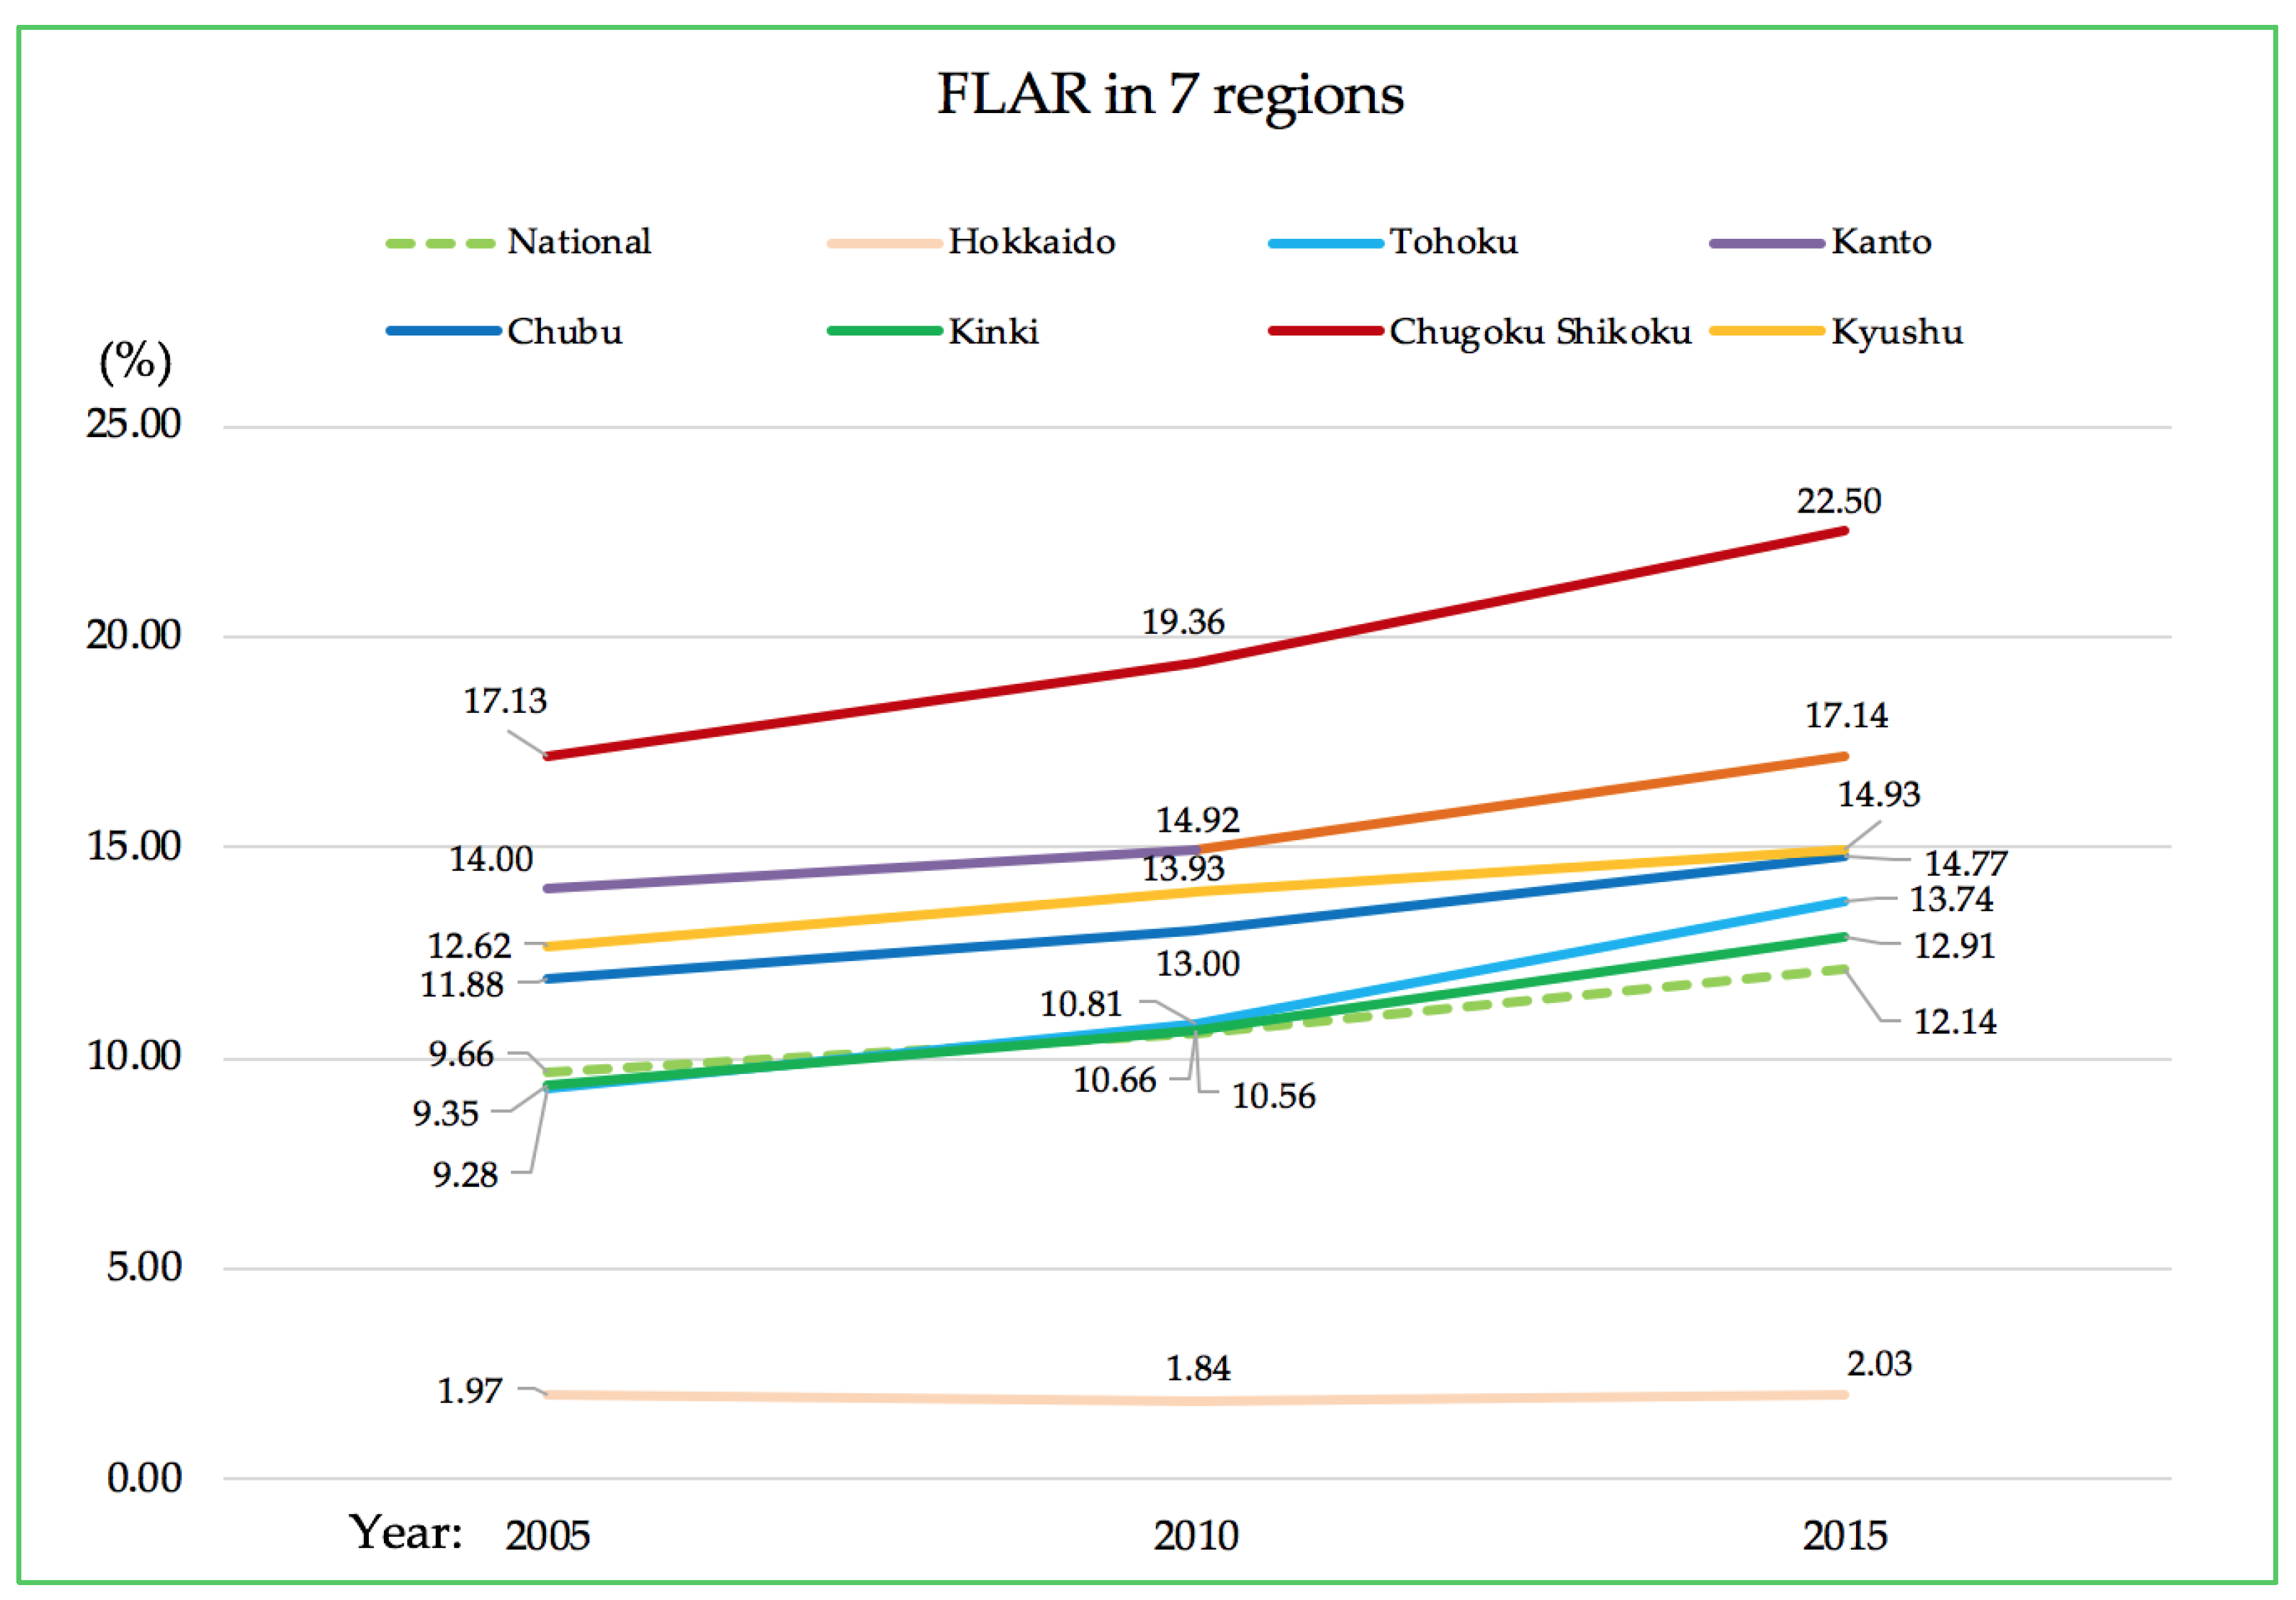
3.1.1. General Characteristics of Farmland Abandonment

Table 3 clearly exhibits the farmland abandonment rate in different prefectures and their temporal variations. At a national level, the FLAR increased from 9.66% to 12.14% over the 10-year period. In 2005, the highest value was observed in Nagasaki prefecture, i.e., 27.13%; Yamanashi and Gunma prefectures followed with values of 23.41% and 20.86%, respectively. In 2015, the highest FLAR was observed in Hiroshima prefecture, i.e., 27.14%, followed by Yamanashi and Nagasaki prefectures, with values of 26.85% and 26.72%, respectively. The FLAR in Hokkaido was the lowest in all three years, indicating stable agricultural development. Saga prefecture witnessed the highest increase in the FLAR (8.39%), followed by Kagawa prefecture with an increase of 8.34%. Only Okinawa and Nagasaki prefectures experienced a slight reduction in terms of the change in the FLAR. Many prefectures experienced a higher FLAR than the national level, which indicates that the scope of the impact of this issue is still broad.

3.1.2. Spatial Patterns

Farmland abandonment was distributed in an uneven pattern over the seven regions. Figure 3 shows the FLARs and their spatial distribution in 2015. In Hokkaido, farmland remained stable, and only a few areas experienced a FLAR higher than 40%. In the Tohoku, Kinki and Kyushu regions, the situations were also less serious than in some other high-elevation regions. In the Tohoku region, the area with a high FLAR was mainly distributed along the eastern coastal region. In the Kinki region, northern Kinki had a very low FLAR, while southern Kinki had a different pattern, with many high FLAR areas. The Chugoku Shikoku, Kanto, Kyushu and Chubu regions exhibited a serious situation of abandonment, with many high FLAR areas. In the Chugoku Shikoku region, farmland abandonment tended to be severe in coastal areas and on small isolated islands near the Seto Inland Sea. This was very similar to the Kyushu region, where abandoned farmland was predominantly located in western coastal island areas in Nagasaki and Kumamoto prefectures, due to the complex geography. In the Kanto region, abandoned farmland had an obvious radial distribution based on the Tokyo metropolitan area as a center. Abandoned farmland was dominantly distributed around the peripheral areas of the Kanto region, especially in north-western regions of the Ibaraki, Gunma, and Saitama prefectures. The Chubu region is under the influence of the Japanese alps and has many high FLAR areas. Compared with the data from 2010, the abandoned area in 2015 (Figure 4) exhibited an increase (>50 ha) in Kanto, north of Tohoku, Hokkaido, and part of the Chugoku Shikoku regions, but exhibited a decrease (<−50 ha) mainly in northern Chubu in Niigata prefecture and Tohoku because of the good agricultural conditions to maintain farmland. In our study, data from 2005 and before were not compatible with those from 2010 and 2015 because of the change in the municipality codes. Future research can investigate longer time phases for this trend as well as simulations of future abandonment.

3.1.3. Spatial Autocorrelations

To visualize the spatial features of farmland abandonment in 2010 and 2015, we calculated Moran’s I and outlined local indicators of spatial association (LISA) statistics to present data non-stationarity or hot/cold spots [47,48]. Moran’s I indices of FLAR rates were 0.669 for 2010 and 0.554 for 2015, both of which were significant at the 0.001 level. Results indicated that farmland abandonment in Japan is positively spatially clustered, although the level has decreased. With respect to LISA statistics, high-high agglomeration municipalities or hot spots were chiefly distributed in the western Kanto region, Chubu region, southern Kinki region, coastal areas of the Chugoku Shikoku region and the Kyushu region, while low-low agglomeration municipalities or cold spots were mostly located in the Hokkaido, Tohoku, and northern Kinki regions in 2010 (Figure 5a). By 2015 (Figure 5b), the number of high-high agglomeration municipalities increased from 1029 to 1171, and low-low agglomeration municipalities decreased from 2384 to 2164, indicating that the trend of farmland abandonment increased from 2010 to 2015. Low-high and high-low agglomeration municipalities displayed a scattered distribution in both time periods.

3.2. Ordinary Least Squares

Prior to regression analysis, a Pearson’s test was carried out to check the existence or not of preliminary co-linearity among variables. We confirmed that there was no significant co-linearity among our explanatory variables; the correlation coefficients did not exceed the threshold value of 0.75 [49] (Appendix Table A1).
For the regression, we developed four models and simultaneously ran OLS and GWR to examine their correlations with farmland abandonment and to identify our best-fit model. In model 1, we included all the variables for OLS. The results indicated that this model explained approximately 47.5% of determinants regarding farmland abandonment, and there was a significant difference in the coefficients among selected variables. In model 2, all geographical variables were introduced. This model explained approximately 14.7% of determinants regarding farmland abandonment, with slope having a more significant effect than road density. Model 3 explained approximately 44.7% of determinants regarding abandonment, with all socio-economic variables being considered. The arable land ratio of self-sufficient farm households had the most significant explanatory ability. Model 4 was our best model considering overall performance as well as the stability of coefficients of each variable. This indicates that farmland abandonment in Japan is influenced by the arable land ratio of self-sufficient farm households; the ratio of non-successor farm households; paddy field density; mean slope; arable land area per farm household and laborers per farm household.
The results (Table 4) indicated that our best model (model 4) can identify approximately half (with an Radj2 value of 0.489) of the reasons for farmland abandonment in Japan. Geographical variables, such as mean slope, were positively correlated with farmland abandonment. For socio-economic variables, household-related variables, such as the arable land ratio of self-sufficient farm households, had the most significantly positive impact on farmland abandonment. The ratio of non-successor farm households and laborers per farm household also positively affected abandonment and was significant at the 0.01 level. In contrast, arable land area per farm household had a negative effect on farmland abandonment. Furthermore, for farmland-related variables, paddy field density had the most significant negative impact on abandonment. However, OLS only revealed a statistical relationship among dependent variables and independent variables. To explore the influence of each specific variable considering its spatial variations, the GWR will be further introduced.

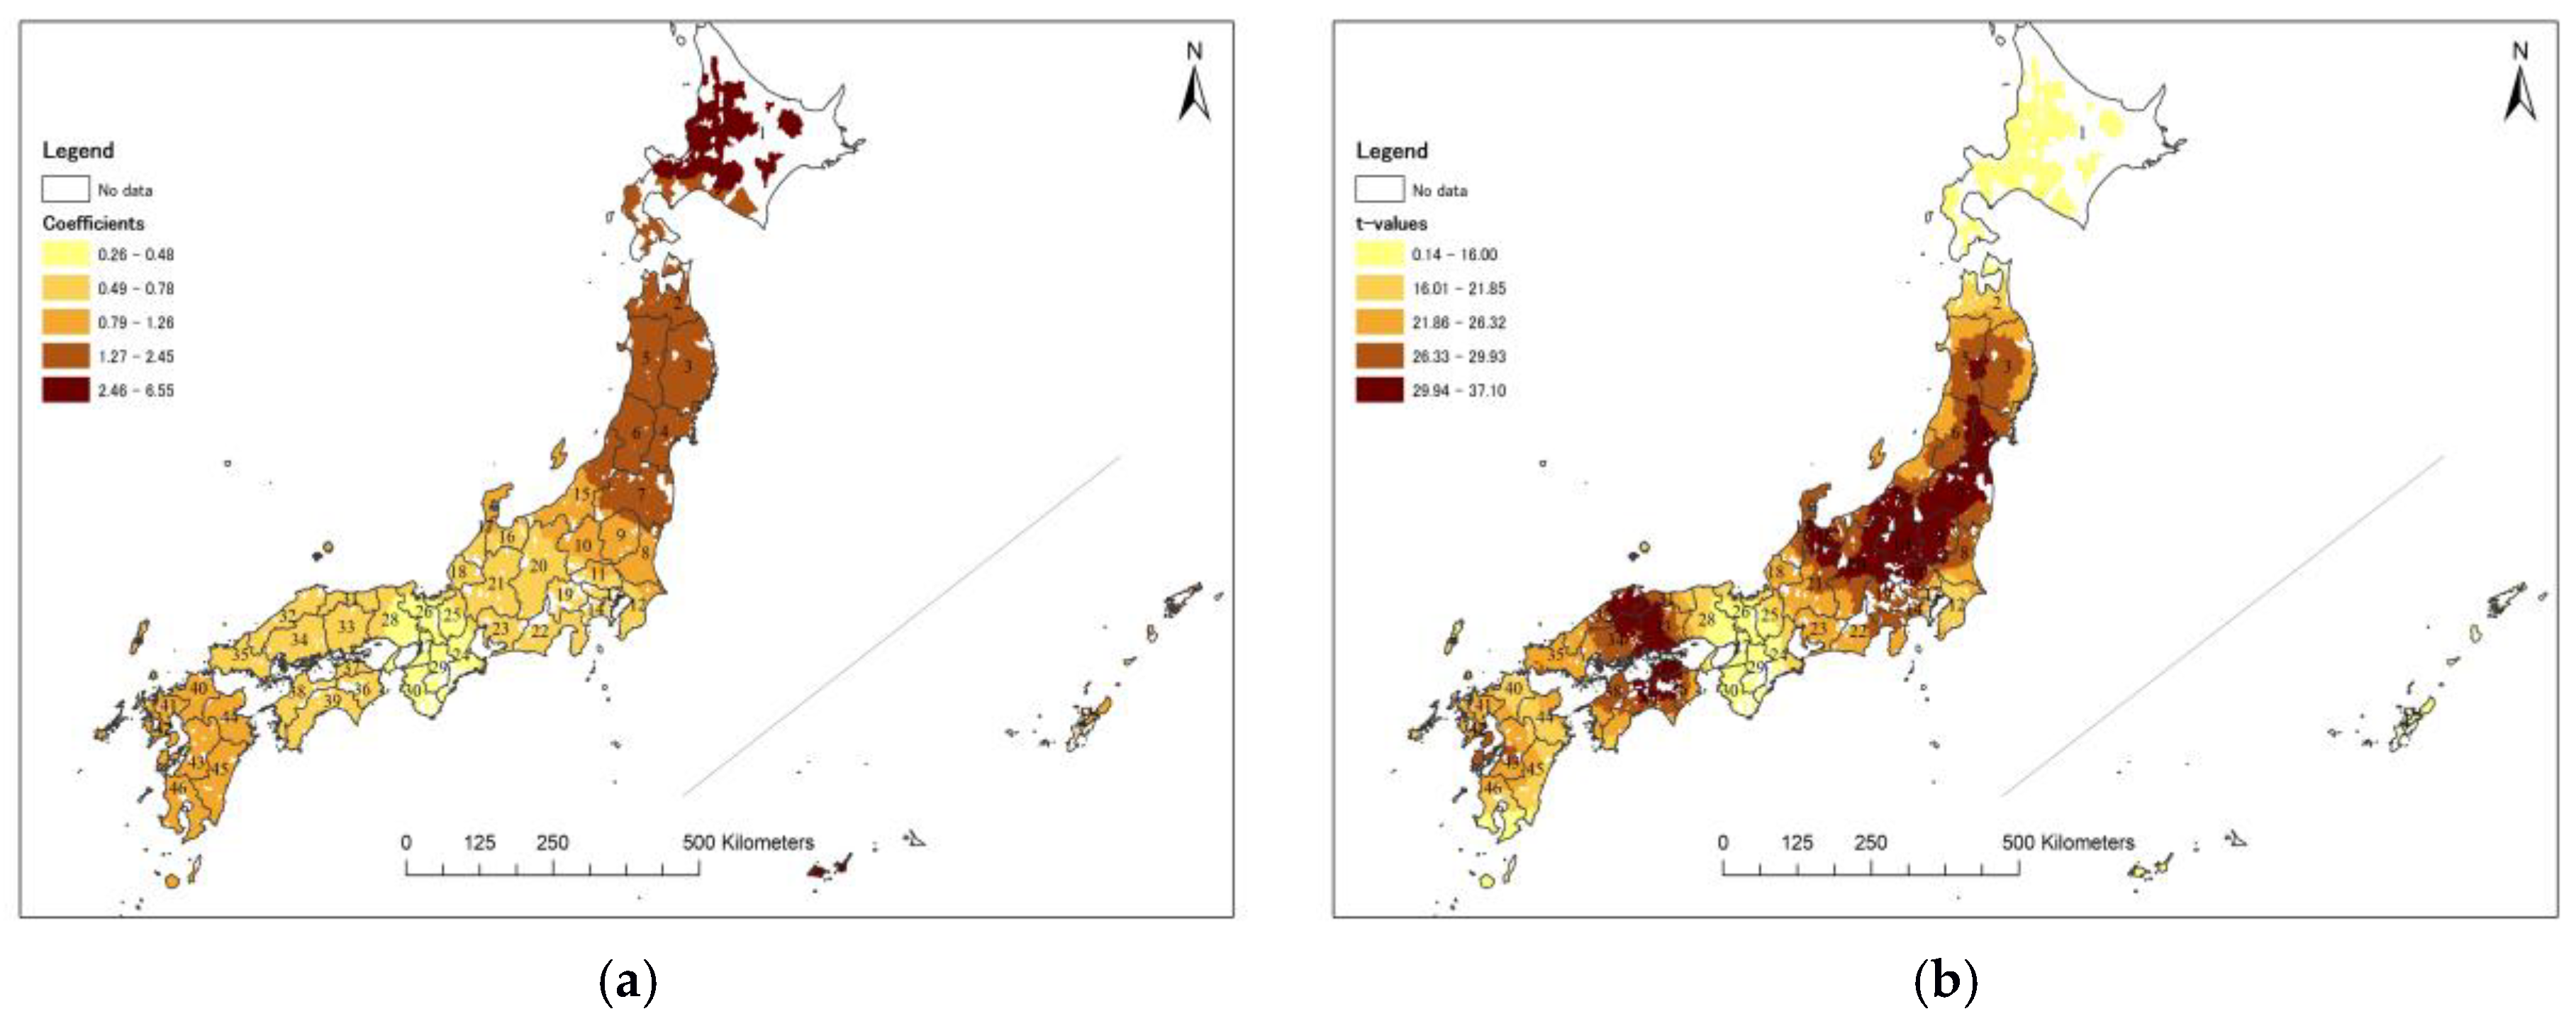
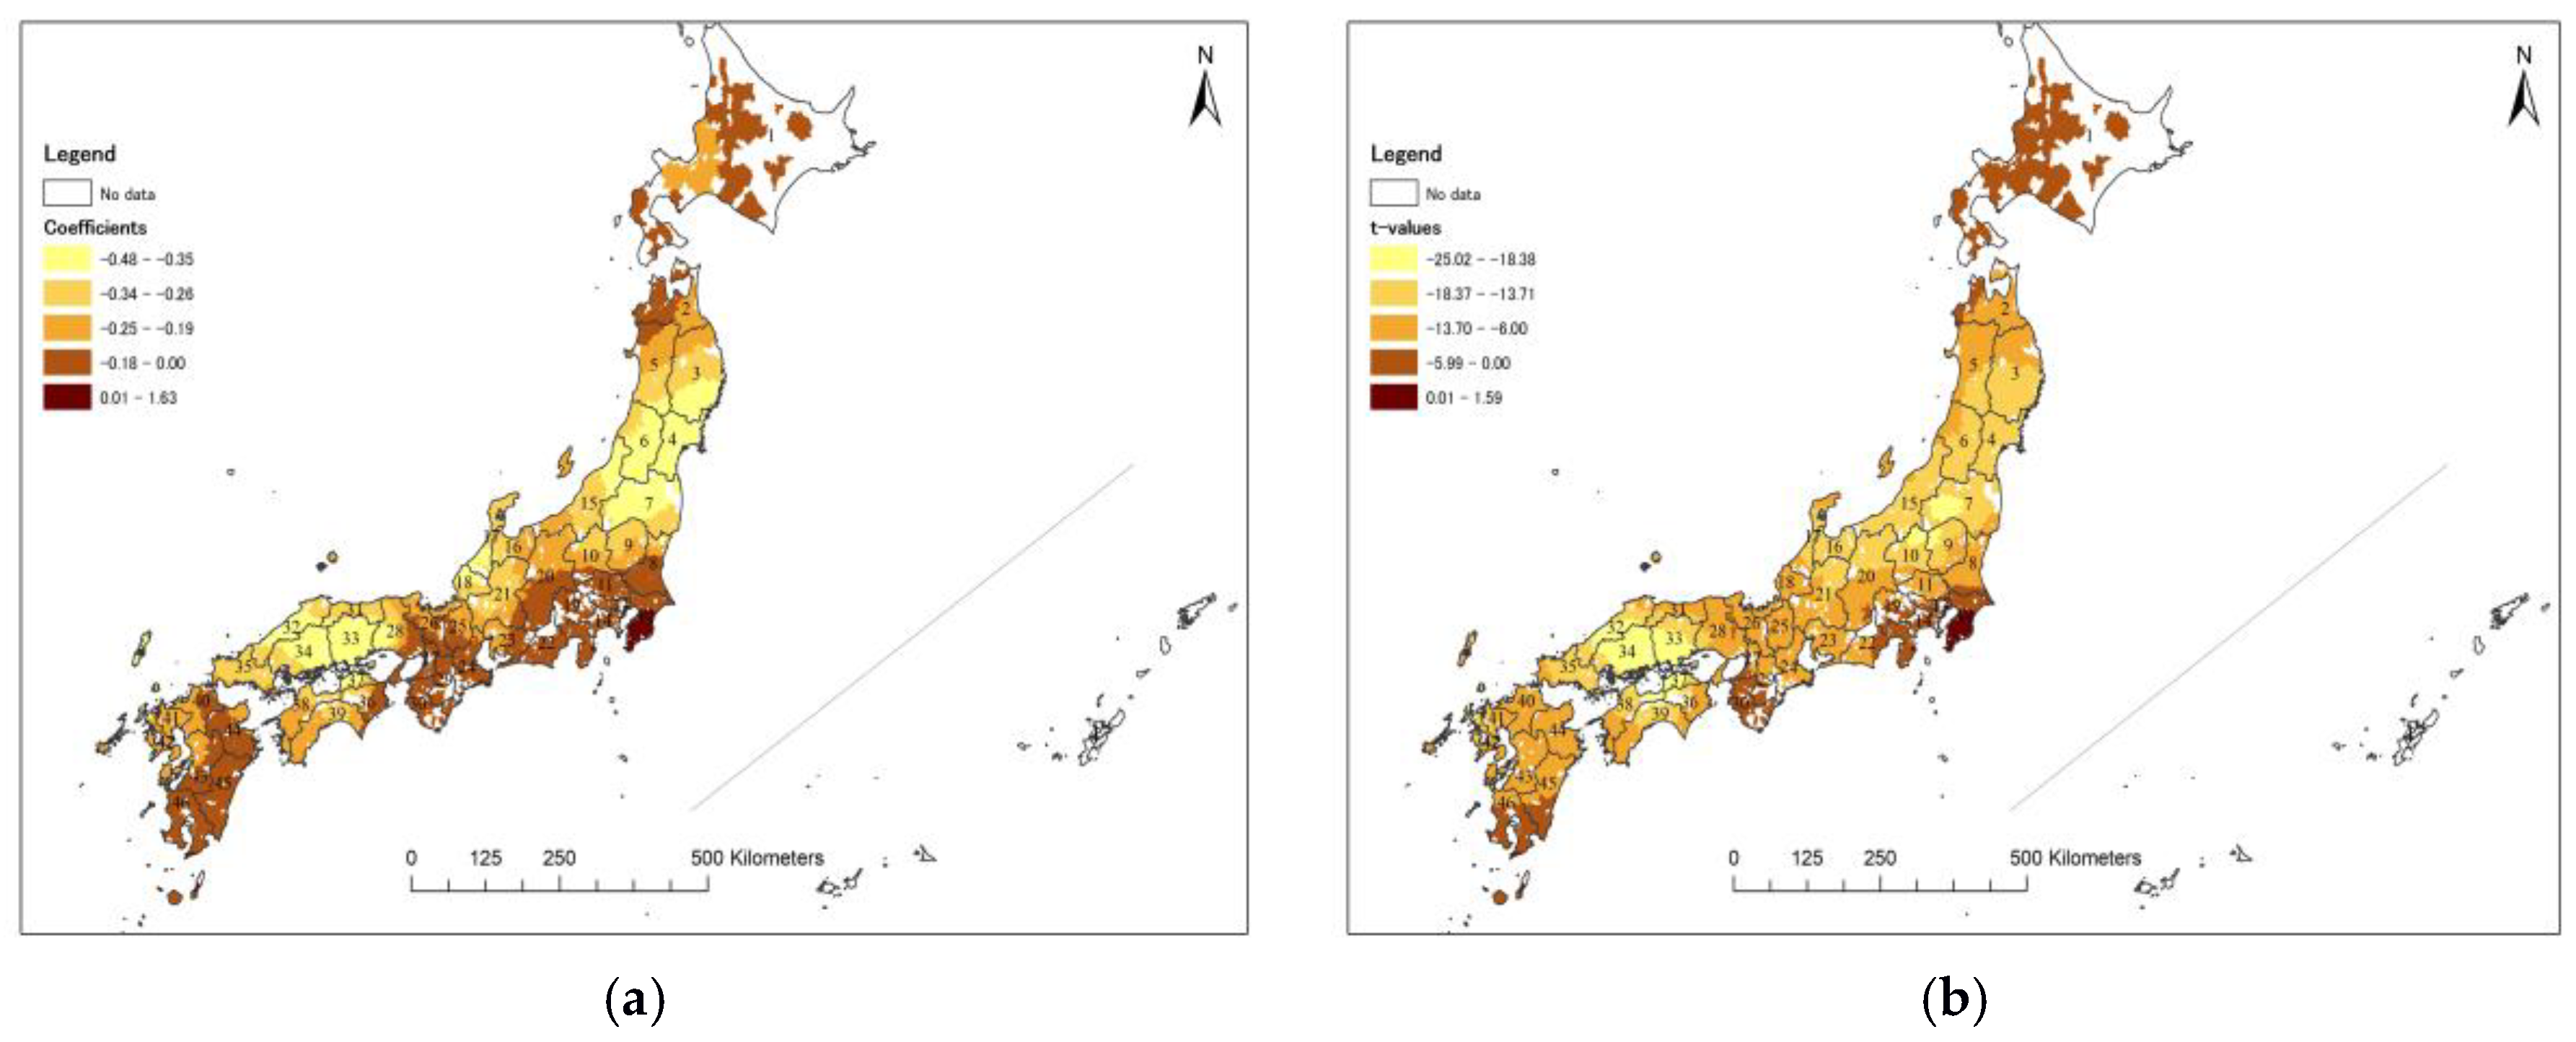
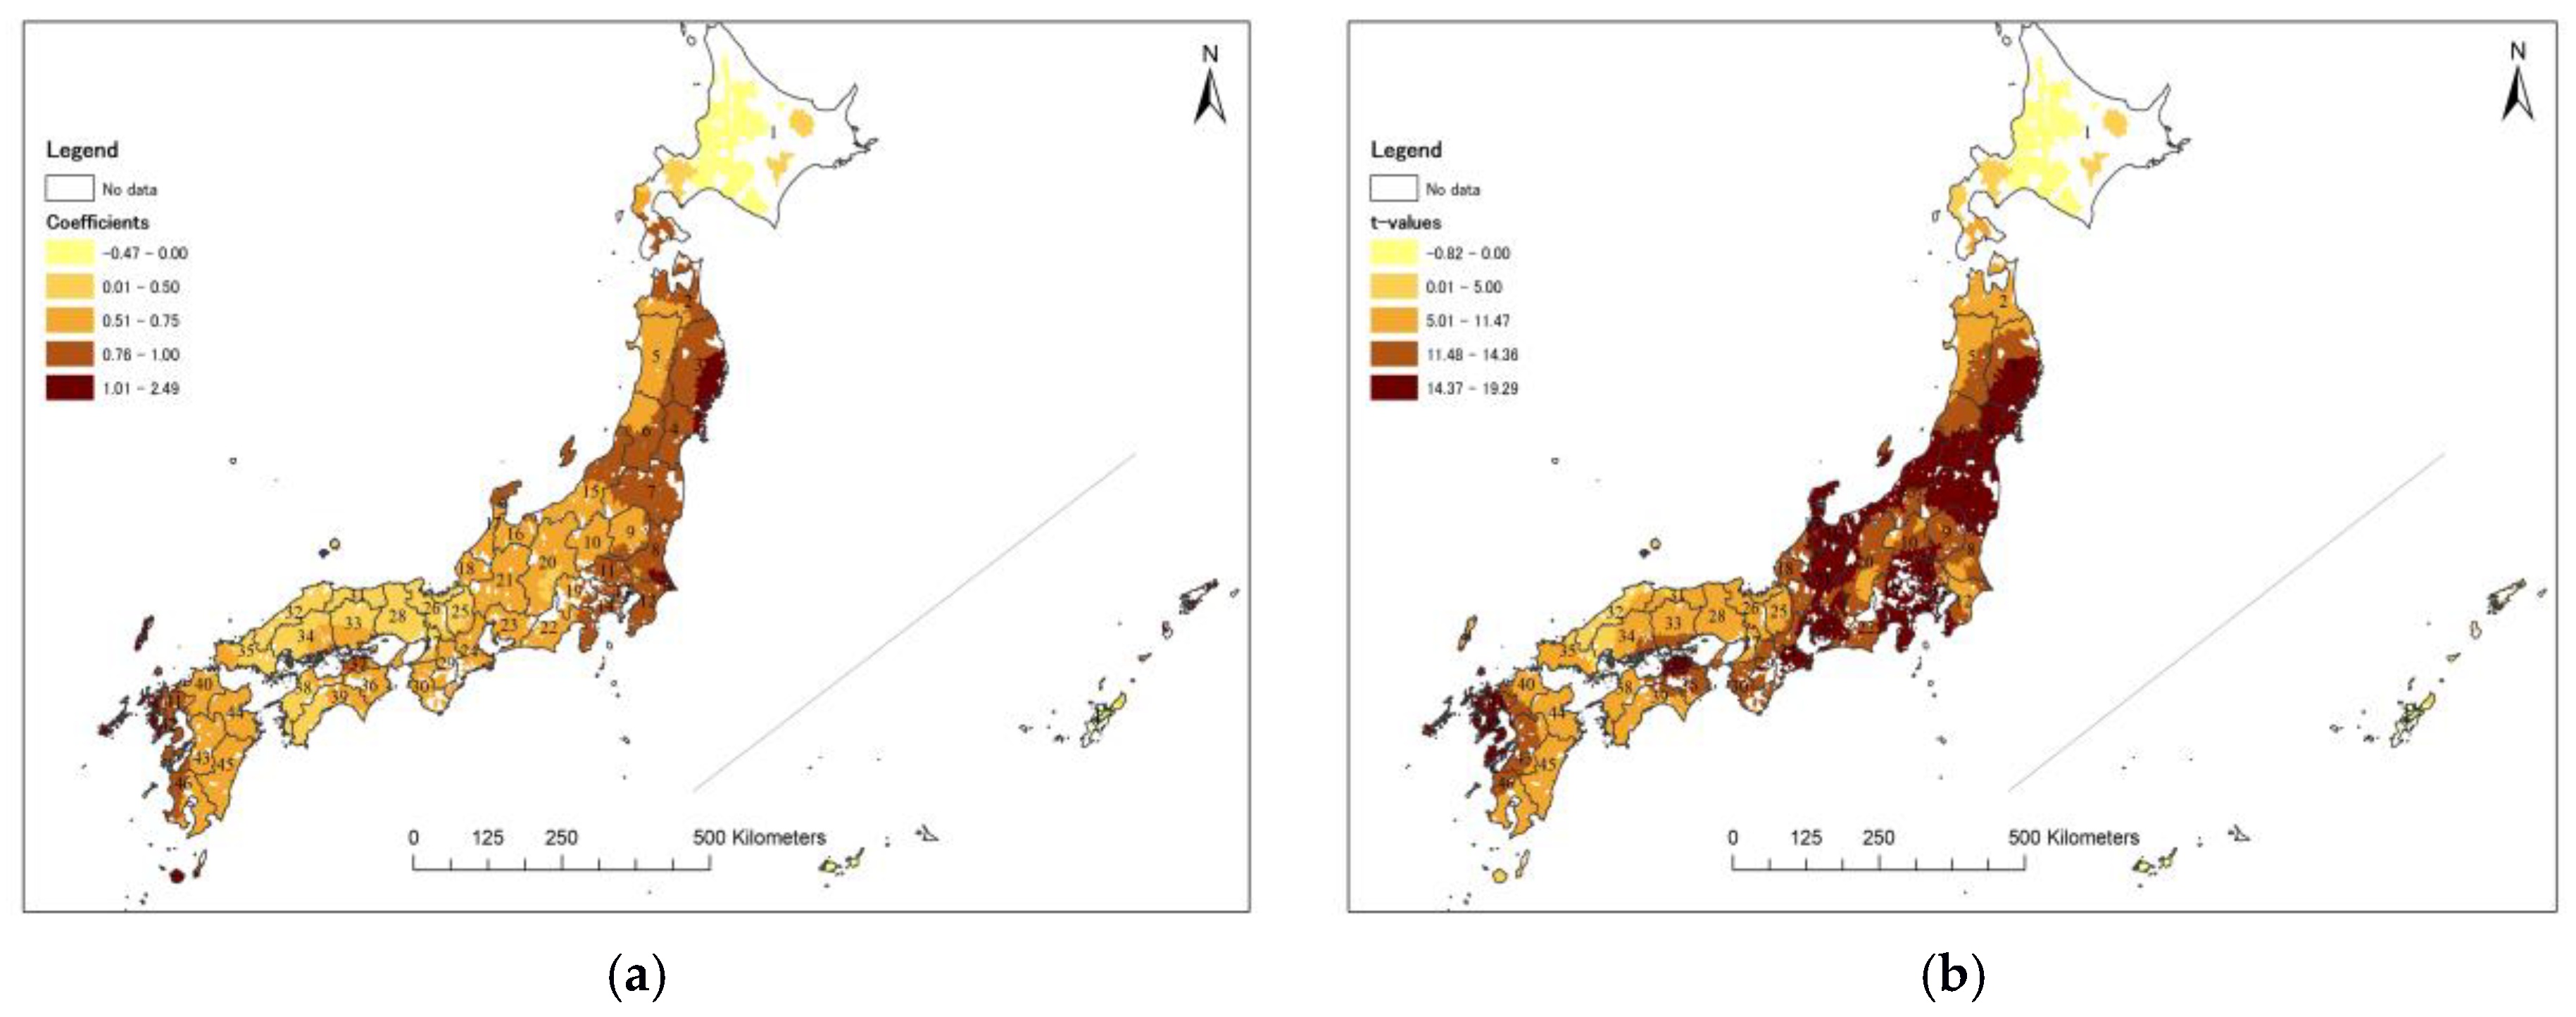
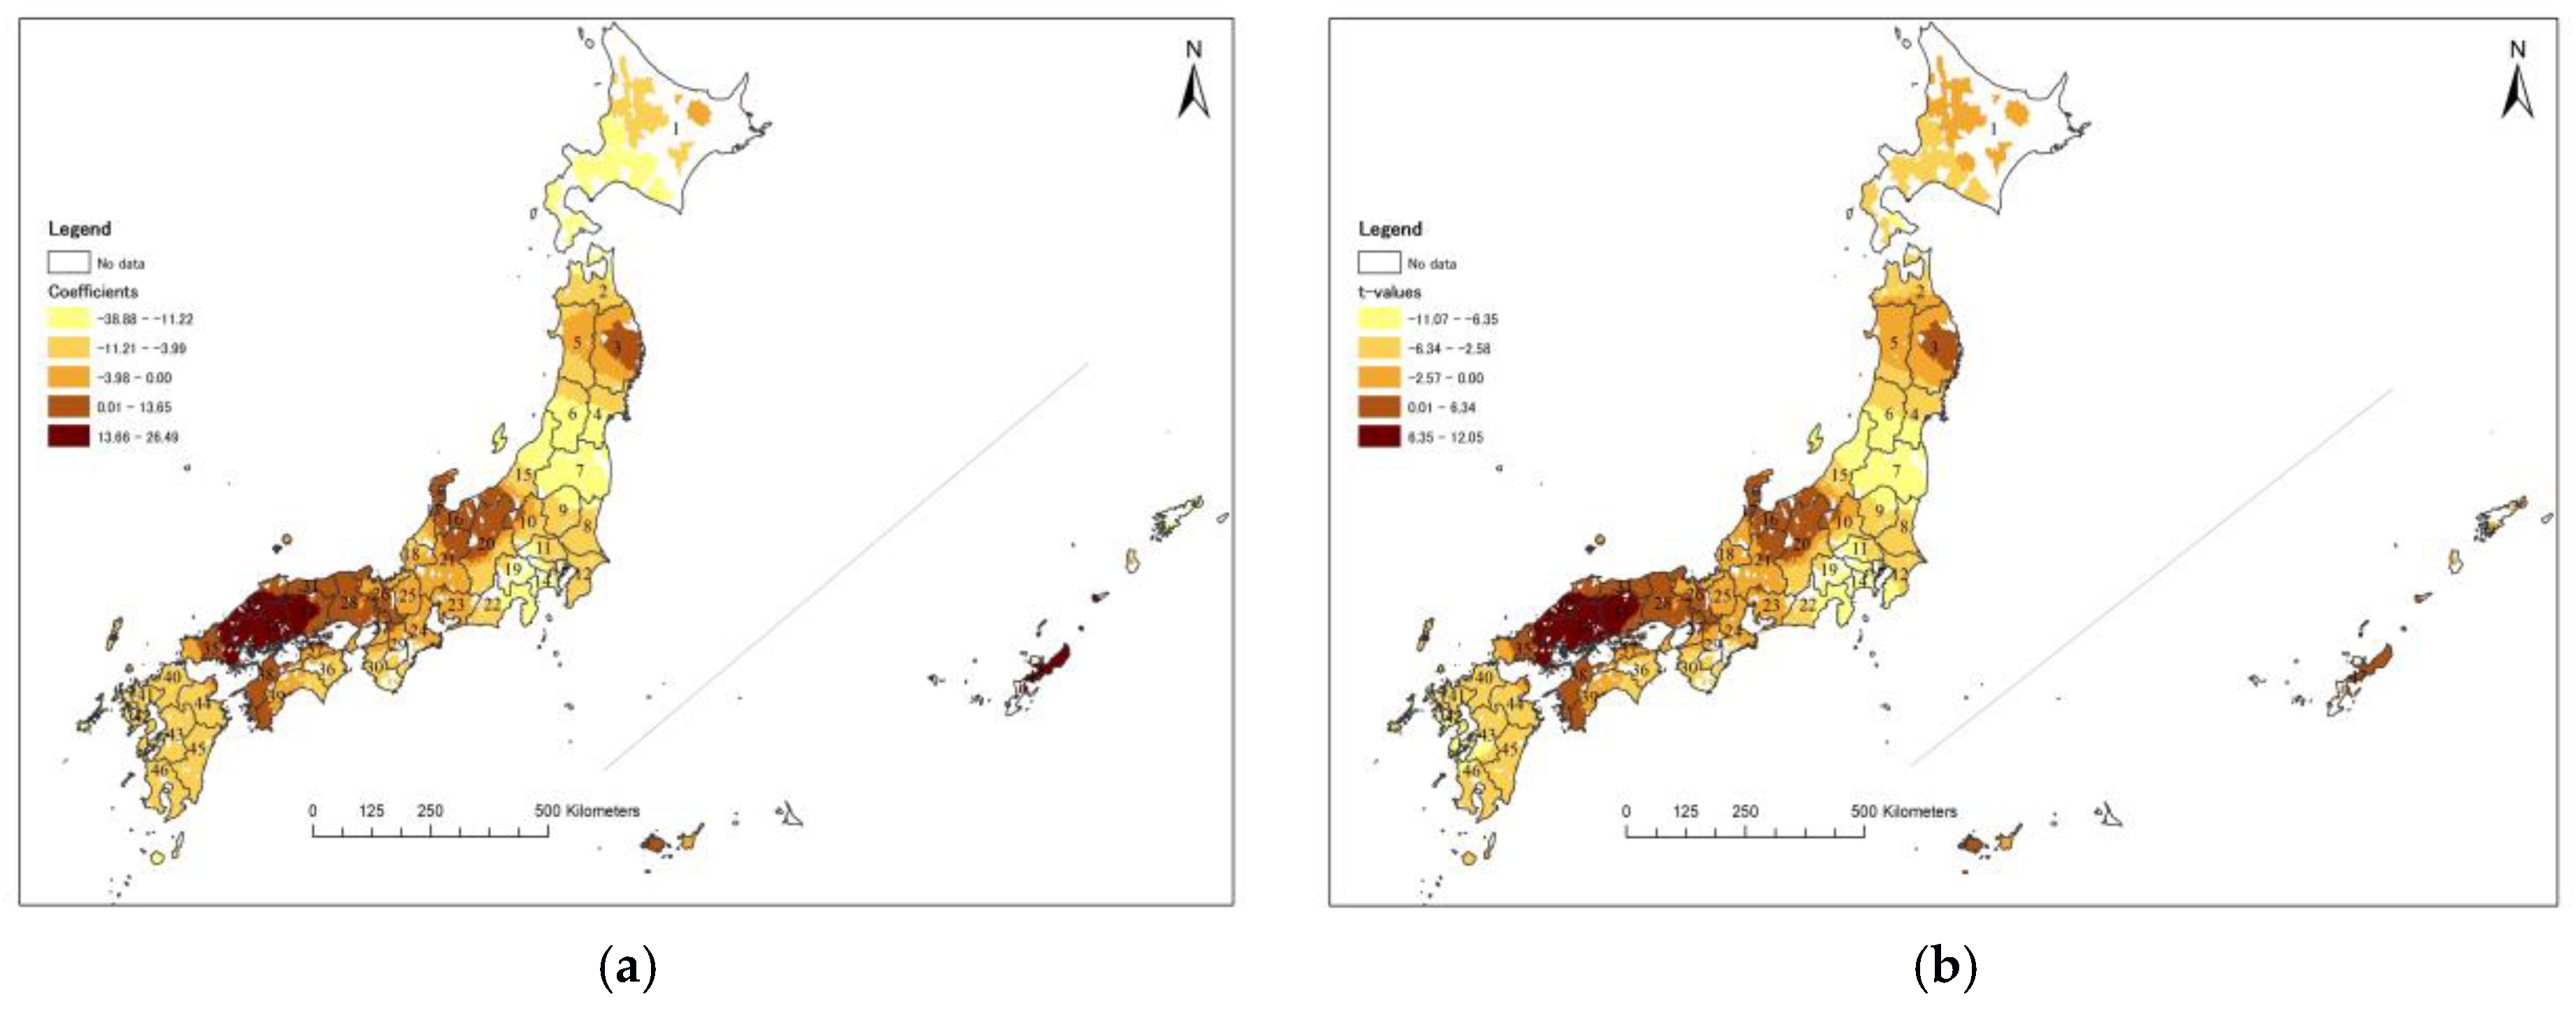
3.3. Geographically Weighted Regression

In contrast to global regression, local regression allows the analyst to assess the local spatial cause-and-effect relationships that might exist between the dependent and independent variables [49]. In addition, the regression coefficients are not static, but vary spatially across the study region [50], and the model performance is superior in its fitting ability when taking spatial relationships into consideration [51]. In our study, farmland abandonment is regarded as a process of the human–environment interaction. Therefore, GWR was employed to effectively visualize and identify how each determinant will influence farmland abandonment and to describe local variations.
Before applying GWR, local Moran’s I was calculated. Table 5 displays the Moran’s I values and their significance based on the Z-score and p-value for each variable. The results indicated a significant spatial autocorrelation, with spatial clustering among our variables. A fixed kernel bandwidth was found to perform in a superior way because of the large sample size and, therefore, it was adopted to reflect the relationships among different data samples. Our Radj2 values were significantly improved from 0.488 to 0.637, and the corrected Akaike information criterion (AICC: used to measure goodness of fit for a model.) decreased from 52203.11 to 50399.48 in our best model (Table 4). This indicated that GWR performed better than OLS in terms of AICC and Radj2, which corroborates other empirical findings [52,53].
We retained one variable in each GWR and plotted the results to display the spatial variances of determinants (Figure 6, Figure 7, Figure 8, Figure 9, Figure 10 and Figure 11). Locally weighed coefficients and pseudo t values were visualized to represent the contribution and fitting level for each GWR. The arable land ratio of self-sufficient farm households exhibited a nationwide positive correlation with abandonment (Figure 6a), and this was significant in the northern Chubu, northern Kanto, southern Tohoku, and central Chugoku Shikoku regions (Figure 6b). This indicates that the ratio of self-sufficient farm households in these regions is more likely to affect farmland abandonment. Paddy field density of coverage displayed a negative correlation in most regions (Figure 7a), but a significant correlation was not observed in the southern Kyushu, southern Kinki, and southern Kanto regions (Figure 7b). This result may be ascribed to the low share of rice production. In comparison to other regions, these are upland cropping areas and are famous for fruit orchards, and vegetables and tea production, and so the density of rice paddy fields is relatively low as this is not a mainstay of agriculture. All regions displayed a significant positive correlation of the slope with the FLAR, except Hokkaido (Figure 8a,b), because Hokkaido has many plain fields and has a stable agricultural condition, while other regions are more or less affected by terrain condition. The ratio of non-successor farm households displayed a positive correlation in all regions except Hokkaido (Figure 9a), with the most significant effect in the Chugoku, southern Kinki and Chubu regions (Figure 9b). There are many un-favored rural areas in southern Kinki and Chugoku, while Chubu is under the influence of the Japanese alps. Young generations in those regions migrated to cities and refused to engage in agriculture. The existence, or otherwise, of successors has become a vital determinant of farmland abandonment in Japan. Arable land area per farm household was negatively correlated with farmland abandonment nationwide, with the highest and the most significant correlation in the Chugoku region (Figure 10a,b), where farmland occurred in fragmented plots and on a small scale, which readily resulted in abandonment due to the difficulty of maintenance [54]. The number of laborers per farm household exhibited a negative correlation in most regions, while displaying the most significant positive correlation with farmland abandonment in Chugoku (Figure 11a,b), which caused biases, and was beyond our expectations. Considering that our labor variable was calculated from commercial households, and because of the low share of commercial households in Chugoku, the labor condition may not represent the whole region. This could be one of the limitations of our study when calculating variables based on one type of household, due to data availability and their spatial variations. Future analysis is necessary to discuss the labor conditions by considering total farm households.

4. Discussion and Conclusions

4.1. Discussion

In recent years, farmland abandonment has become a serious issue in Japan, which reflects agricultural loss as well as depopulation and an aging society. However, for a better understanding of this issue, the regional characteristics and determinants need to be explored further. This study employed OLS and GWR, which focused on different perspectives, to investigate farmland abandonment. The findings can provide an explicit explanation of the spatial characteristics as well as the determinants of farmland abandonment.
Firstly, spatial patterns of farmland abandonment in Japan were uneven, and different regions shared different extents of farmland abandonment, which strongly corresponded to regional geographical conditions and agricultural development. Compared with the national level and considering their spatial patterns, we divided the seven regions into three categories: low abandonment, moderate abandonment, and high abandonment. Among these, Hokkaido lagged behind the national level and had low abandonment (Figure 12). Here, farmers overcome harsh geographical conditions, develop agriculture sustainably, and also possess different agricultural development paths and land tenure compared with other regions [23]. The Tohoku region and Kinki region had moderate abandonment, while the majority of the low-low abandonment agglomerations or cold spots (Figure 5) and the FLAR were similar to those of the national level. Agriculture in Tohoku is typically well maintained and is famous for the monocropping of rice. In addition, farm households have strong kinship ties and many young generations assist their elder parents in agricultural work [55]. In GWR, paddy field density and the ratio of non-successor farm household also exhibited a strong correlation associated with FLAR in Tohoku (Figure 7 and Figure 9). Northern Kinki has a good farmland condition, while southern Kinki is a mountainous area, and agriculture is experiencing challenges in terms of fruit, vegetable and tea production. On the eastern coast of Tohoku, the FLAR varied greatly from 2010 to 2015 (Figure 4). Meteorological factors play a key role in coastal areas due to the extreme weather conditions throughout the years, such as monsoon and seasonal currents, which adversely affect agriculture. The Chugoku Shikoku, Kanto, Kyushu and Chubu regions exhibited high abandonment levels, which were obviously higher than the national level (Figure 12). In these regions, most of the areas had a high FLAR, along with high-high agglomerations or hot spots (Figure 3 and Figure 4). Farmland in the Kanto and Chubu regions is constrained, either from the high elevation under the Japanese alps or urbanization in association with out-migration of laborers to metropolises [40]. In the Chugoku Shikoku region, rural depopulation first occurred in mountain zones, along with serious aging and issues associated with a lack of agricultural successors [56]. Many plots in coastal areas were previously used for orange production, but from 2010, due to low yields, farmers abandoned their orange fields, which contributed significantly to the increase in the FLAR without any mitigation until now.
Secondly, the combination of global and local regression in interpreting determinants of farmland abandonment in Japan generates a comprehensive understanding. Based on the global regression, geographic variables, such as slope, demonstrated a significantly positive correlation with farmland abandonment, which has already been reported in previous studies [1,15,32,42]. In Japan, soil condition may also relate to regional abandonment. There are cases farmers transport soils (known as soil dressing or Kyakudo in Japanese) from the higher mountains to enrich the fertility of their paddy fields. In contrast, expressway and railroad densities did not exhibit a significant correlation. Agricultural production in Japan is highly mechanized in the face of laborer supply shortages, and so farmers are more concerned about the accessibility of agricultural machines than road conditions, which are well maintained in rural Japan. Socio-economic variables, such as successors of farm households and laborers per farm household determine abandonment, which is similar to previous results [15,18,24,34,35,38,55,57]. However, the significance of variables such as the arable land ratio of self-sufficient farm households, arable area per household and paddy field density are interesting and unique in a Japanese context. The above conclusions were only drawn from the perspective of global regression. In regard to local regression in GWR, Hokkaido had a low FLAR, and it exhibited an obviously different pattern compared with other regions, which corresponds with Osawa et al., (2016) [22]. In addition, we found discrepancies in the other six regions, as well as localized output coefficients, which may depend on local geographical or socio-economic circumstances. In particular, the Chugoku Shikoku region had the highest FLAR among the seven regions in Japan, and it shared a significant spatial correlation with many variables in GWR. Non-successor farm households, the arable land ratio of farm household and laborers per household displayed the most significant correlation here. The explanatory ability of other variables varied greatly across regions, and specific theories and reasons behind this need to be discussed further.
Thirdly, as is heavily depopulated especially in rural areas, Japan has an unfavorable socio-economic condition for agriculture, which adversely promotes the increase of abandoned farmland. Generally, farmland abandonment in Japan is due to its subsistence farming. Because of aging and depopulation in Japan, elderly farmers lack sufficient labor and rely on mechanization while young people have lost their passion for agriculture, and thus the conversion of farm households from commercial to self-sufficient was expected. From our result, the arable land ratio of self-sufficient farm households exhibited the most significant positive effect. It seems that there are limited commercial activities for elderly farmers to engage in agriculture or farming, or many of them engage in agriculture for their own living, thereby increasing the likelihood that farmers will abandon their farmland when encountering difficulties. In addition, monocropping of rice also resulted in farmland abandonment, and in particular dry land and fruit gardens contributed the most to abandonment. Japanese agriculture is centered around rice cropping, where rice paddy fields are essential components of agriculture, accounting for 54.3% of the total arable land area [25]. However, paddy field areas are declining, partially due to policies such as the adjustment of rice production [58], which have been in place since the 1970s to encourage farmers to switch crops and to diversify the use of agricultural land. Eventually, the adjustment of rice production maintained the price of rice in the face of overproduction [59]. However, numerous farm households, especially self-sufficient households, were not willing to change their land to other crops, and this policy became ineffective. Our result showed a negative correlation between the paddy field density and FLAR in most regions, which indicated that paddy fields are easy to maintain, and farmers are fond of rice farming. How to change people’s consciousness and diversify the use of farmlands remains a future challenge for the Japanese government. Lastly, agriculture in Japan relies heavily on subsidies [60]. Besides the adjustment of rice production, a direct payment policy was also issued in 2000 in hilly and mountainous areas to maintain agricultural farmland [61]. In contrast to the European context, this fund is paid to community-based agricultural unions instead of directly to individual households [62]. Many areas ill-suited to agriculture depend heavily on these two subsidies; hence, the approaches were not particularly effective at maintaining the farming of good-quality agricultural land. Thus, the situation brought little benefit to agricultural development, and it was not effective in preventing the expansion of abandonment.
Finally, we discuss the limitations of this study and recommendations for future research. One limitation is the limited number of socio-economic variables to evaluate farmland abandonment. In our study, we only considered data that is available from the agricultural census at former municipalities scale. Although census data can correspond to former municipalities spatially in GWR, some important information such as rural–urban migration [18], labor market [6] etc. are still missing. Future research can consider different scales and variables relate to these aspects as well. Moreover, the concept of farmland abandonment defined by MAFF only considers short-term abandonment and ignores accumulative abandonment, which is a more stable and concise way to discuss abandonment. Furthermore, there is a significant amount of hidden abandonment (hidden abandonment or semi-abandonment is farmland where agricultural production ceases, but the land is maintained as cultivated farmland. Hidden abandonment is between cultivated and abandoned land, which has a high risk of being abandoned in subsequent years [63]), and many abandoned farmlands with unclear ownership. These farmlands have been abandoned for years, and it becomes challenging to find the owners, either because of aging of farmers or a lack of successors. Future research should consider different types of abandonment when discussing this question.

4.2. Conclusions

This study revealed the spatial patterns of farmland abandonment and analyzed its determinants in 2015 from geographical and socio-economic aspects by employing global (OLS) and local (GWR) regressions. Based on the former municipality boundaries, spatial patterns of farmland abandonment and its determinants were displayed and discussed. The main conclusions are as follows:
Firstly, farmland abandonment in Japan displays an uneven pattern and strongly corresponds to the country’s geographical condition and regional agricultural development. While taking the farmland abandonment rate as the measure, a nation-wide distribution of abandoned farmland is firstly displayed. We found that most abandoned farmland is concentrated in the Chugoku Shikoku, Kanto, Kyushu and Chubu regions, in contrast to other regions that have good agricultural conditions, such as the Hokkaido and Tohoku regions.
Secondly, rather than geographical factors, socio-economic variables have a much higher explanatory ability. Household-related variables, such as the arable land ratio of self-sufficient farm households, displayed the most significant positive correlation with farmland abandonment, and non-successor farm households were positively correlated with farmland abandonment. In contrast, the arable land area per farm household and the laborers per farm household were negatively correlated with farmland abandonment. For farmland-related variables, paddy field density exhibited a significant negative correlation with farmland abandonment.
Thirdly, determinants of farmland abandonment are spatially varied regarding local geographical or socio-economic circumstances. Local regression showed its superiority in terms of explanatory ability and goodness of fit for our best model. In short, farmland abandonment is a complex process driven by interactions of multiple determinants. Even within one region, the determinants might be different depending on specific local circumstances.
Finally, in regard to suggestions to prevent further abandonment on the one hand, the Japanese government should institute some new policies or taxation reforms to help farm households, especially self-sufficient farmers, to re-cultivate their land or to allow them easily transfer their land to land-holding cooperatives that have sufficient laborers [23]. Japanese policy on rice production and import restrictions play a key role to keep paddy fields in Japan. As such, policies regarding rice market are crucial for maintaining farmland. On the other hand, farmers should seek more economical pathways to survive. For instance, in terms of non-successor farm households and aging farmers, in order to solve the lack of laborers, strengthening community-based farming, building farmland banks [64] and agricultural networks could be effective countermeasures to prevent future abandonment.

Author Contributions

G.S. and L.C. had the initial idea and designed the research. G.S. collected and analyzed the data and wrote the first draft. H.O. and L.C. reviewed the manuscript. All authors read and approved the final manuscript.

Funding

This research received no external funding.

Acknowledgments

The present work (research) was supported by the Grant-in-Aid for the Scientific Research (B), Japan Society for the Promotion of Science (JSPS) (Project title: Existence Structure of Contemporary Mountain Villages and their Resilience; Principal Investigator: Hidenori Okahashi, Nara University; Project ID: 18H00771) and (in part) through the Hiroshima University TAOYAKA Program for creating a flexible, enduring, peaceful society, funded by the Program for Leading Graduate Schools, Ministry of Education, Culture, Sports, Science and Technology. We would appreciate Kazuo Tomozawa at Hiroshima University, Japan and Ran Liu and Yinghai Ke at Capital Normal University, China for their valuable suggestions to our research. We would also like to thank for the constructive suggestions and comments from the editor and anonymous reviewers.

Conflicts of Interest

The authors declare no conflict of interest.

Appendix A

Table A1. Pearson’s correlation coefficient among different variables.
X1X2X3X4X5X6X7X8X9X10X11X12
X11
X2−0.162 **1
X3−0.091 **0.046 **1
X40.254 **0.036 **0.024 *1
X5−0.131 **0.0150.016−0.0141
X6−0.134 **−0.045 **−0.023 *−0.343 **−0.0101
X7−0.224 **−0.024*0.003−0.293 **0.096 **0.331 **1
X8−0.234 **0.023*0.002−0.128 **−0.027 **0.318 **0.499 **1
X90.236 **−0.071 **−0.035 **0.085 **−0.051 **0.024 *0.0130.0141
X10−0.088 **−0.052 **0.003−0.206 **0.413 **0.060 **0.089 **−0.179 **−0.0031
X11−0.192 **−0.025 *−0.013−0.123 **0.081 **−0.033 **0.163 **0.144 **−0.040 **0.070 **1
X12−0.101 **0.0140.037 **−0.173 **0.191 **−0.018−0.179 **−0.494 **−0.222 **0.389 **−0.118 **1
Numbers whose absolute correlation value is higher than 0.5 are highlighted in bold font. ** Correlation is significant at the 0.01 level (2-tailed). * Correlation is significant at the 0.05 level (2-tailed).

References

  1. MacDonald, D.; Crabtree, J.R.; Wiesinger, G.; Dax, T.; Stamou, N.; Fleury, P.; Lazpita, J.G.; Gibon, A. Agricultural abandonment in mountain areas of Europe: Environmental consequences and policy response. J. Environ. Manag. 2000, 59, 47–69. [Google Scholar] [CrossRef] [Green Version]
  2. Lasanta, T.; Nadal-Romero, E.; Arnáez, J. Managing abandoned farmland to control the impact of re-vegetation on the environment. The state of the art in Europe. Environ. Sci. Policy 2015, 52, 99–109. [Google Scholar] [CrossRef] [Green Version]
  3. Li, S.; Li, X. Global understanding of farmland abandonment: A review and prospects. J. Geogr. Sci. 2017, 27, 1123–1150. [Google Scholar] [CrossRef]
  4. Benayas, J.R.; Martins, A.; Nicolau, J.M.; Schulz, J.J. Abandonment of agricultural land: An overview of drivers and consequences. CAB Rev. Perspect. Agric. Vet. Sci. Nutr. Nat. Resour. 2007, 2, 1–14. [Google Scholar] [CrossRef]
  5. Corbelle-Rico, E.; Crecente-Maseda, R. Evaluating IRENA indicator ‘Risk of Farmland Abandonment’ on a low spatial scale level: The case of Galicia (Spain). Land Use Policy 2014, 38, 9–15. [Google Scholar] [CrossRef]
  6. Yan, J.; Yang, Z.; Li, Z.; Li, X.; Xin, L.; Sun, L. Drivers of cropland abandonment in mountainous areas: A household decision model on farming scale in Southwest China. Land Use Policy 2016, 57, 459–469. [Google Scholar] [CrossRef] [Green Version]
  7. Verburg, P.H.; Overmars, K.P. Combining top-down and bottom-up dynamics in land use modeling: Exploring the future of abandoned farmlands in Europe with the Dyna-CLUE model. Landsc. Ecol. 2009, 24, 1167–1181. [Google Scholar] [CrossRef]
  8. Prishchepov, A.V.; Radeloff, V.C.; Baumann, M.; Kuemmerle, T.; Müller, D. Effects of institutional changes on land use: Agricultural land abandonment during the transition from state-command to market-driven economies in post-Soviet Eastern Europe. Environ. Res. Lett. 2012, 7, 024021. [Google Scholar] [CrossRef]
  9. Zakkak, S.; Radovic, A.; Nikolov, S.C.; Shumka, S.; Kakalis, L.; Kati, V. Assessing the effect of agricultural land abandonment on bird communities in southern-eastern Europe. J. Environ. Manag. 2015, 164, 171–179. [Google Scholar] [CrossRef] [PubMed]
  10. Kolecka, N.; Kozak, J.; Kaim, D.; Dobosz, M.; Ostafin, K.; Ostapowicz, K.; Wężyk, P.; Price, B. Understanding farmland abandonment in the Polish Carpathians. Appl. Geogr. 2017, 88, 62–72. [Google Scholar] [CrossRef]
  11. Prishchepov, A.A.; Müller, D.; Dubinin, M.; Baumann, M.; Radeloff, V.C. Determinants of agricultural land abandonment in post-Soviet European Russia. Land Use Policy 2013, 30, 873–884. [Google Scholar] [CrossRef] [Green Version]
  12. Ramankutty, N.; Heller, E.; Rhemtulla, J. Prevailing myths about agricultural abandonment and forest regrowth in the United States. Ann. Assoc. Am. Geogr. 2010, 100, 502–512. [Google Scholar] [CrossRef]
  13. Löw, F.; Fliemann, E.; Abdullaev, I.; Conrad, C.; Lamers, J.P.A. Mapping abandoned agricultural land in Kyzyl-Orda, Kazakhstan using satellite remote sensing. Appl. Geogr. 2015, 62, 377–390. [Google Scholar] [CrossRef]
  14. Yamaguchi, T.; Ngodup, S.; Nose, M.; Takeda, S. Community-scale analysis of the farmland abandonment occurrence process in the mountain region of Ladakh, India. J. Land Use Sci. 2016, 11, 401–416. [Google Scholar] [CrossRef]
  15. Díaz, G.I.; Nahuelhual, L.; Echeverría, C.; Marín, S. Drivers of land abandonment in Southern Chile and implications for landscape planning. Landsc. Urban Plan. 2011, 99, 207–217. [Google Scholar] [CrossRef]
  16. Xie, H.L.; Wang, P.; Yao, G.R. Exploring the dynamic mechanisms of farmland abandonment based on a spatially explicit economic model for environmental sustainability: A case study in Jiangxi Province, China. Sustainability 2014, 6, 1260–1282. [Google Scholar] [CrossRef]
  17. Kawashima, S. Spatial Regression Analysis on Abandoned Farm Land using Agricultural Census and its Map Data. Tohoku J. Rural Econ. 2010, 28, 23–29. (In Japanese) [Google Scholar] [CrossRef]
  18. Corbelle-Rico, E.; Crecente-Maseda, R.; Santé-Riveira, I. Multi-scale assessment and spatial modelling of agricultural land abandonment in a European peripheral region: Galicia (Spain), 1956–2004. Land Use Policy 2012, 29, 493–501. [Google Scholar] [CrossRef]
  19. Scherr, S.J.; McNeely, J.A. Biodiversity conservation and agricultural sustainability: Towards a new paradigm of “ecoagriculture” landscapes. Phil. Trans. R. Soc. B 2007, 363, 477–494. [Google Scholar] [CrossRef] [PubMed]
  20. Queiroz, C.; Beilin, R.; Folke, C.; Lindborg, R. Farmland abandonment: Threat or opportunity for biodiversity conservation? A global review. Front. Ecol. Environ. 2014, 12, 288–296. [Google Scholar] [CrossRef]
  21. Yamashita, R.; Hoshino, S. Development of an agent-based model for estimation of agricultural land preservation in rural Japan. Agric. Syst. 2017, 164, 264–276. [Google Scholar] [CrossRef]
  22. Osawa, T.; Kohyama, K.; Mitsuhashi, H. Multiple factors drive regional agricultural abandonment. Sci. Total Environ. 2016, 542, 478–483. [Google Scholar] [CrossRef] [PubMed]
  23. Ito, J.; Nishikori, M.; Toyoshi, M.; Feuer, H.N. The contribution of land exchange institutions and markets in countering farmland abandonment in Japan. Land Use Policy 2016, 57, 582–593. [Google Scholar] [CrossRef]
  24. Pazúr, R.; Lieskovský, J.; Feranec, J.; Oťaheľ, J. Spatial determinants of abandonment of large-scale arable lands and managed grasslands in Slovakia during the periods of post-socialist transition and European Union accession. Appl. Geogr. 2014, 54, 118–128. [Google Scholar] [CrossRef]
  25. Rudel, T.K.; Coomes, O.T.; Moran, E.; Achard, F.; Angelsen, A.; Xu, J.; Lambin, E. Forest transitions: Towards a global understanding of land use change. Glob. Environ. Chang. 2005, 15, 23–31. [Google Scholar] [CrossRef]
  26. Larsson, S.; Nilsson, C. A remote sensing methodology to assess the costs of preparing abandoned farmland for energy crop cultivation in northern Sweden. Biomass Bioenergy 2005, 28, 1–6. [Google Scholar] [CrossRef]
  27. Estel, S.; Kuemmerle, T.; Alcántara, C.; Levers, C.; Prishchepov, A.; Hostert, P. Mapping farmland abandonment and recultivation across Europe using MODIS NDVI time series. Remote Sens. Environ. 2015, 163, 312–325. [Google Scholar] [CrossRef]
  28. Lieskovský, J.; Bezák, P.; Špulerová, J.; Lieskovský, T.; Koleda, P.; Dobrovodská, M.; Bürgi, M.; Gimmi, U. The abandonment of traditional agricultural landscape in Slovakia—Analysis of extent and driving forces. J. Rural Stud. 2015, 37, 75–84. [Google Scholar] [CrossRef]
  29. Löw, F.; Prishchepov, A.V.; Waldner, F.; Dubovyk, O.; Akramkhanov, A.; Biradar, C.; Lamers, J. Mapping Cropland abandonment in the Aral Sea Basin with MODIS time series. Remote Sens. 2018, 10, 159. [Google Scholar] [CrossRef]
  30. Mottet, A.; Ladet, S.; Coqué, N.; Gibon, A. Agricultural land-use change and its drivers in mountain landscapes: A case study in the Pyrenees. Agric. Ecosyst. Environ. 2006, 114, 296–310. [Google Scholar] [CrossRef]
  31. Baumann, M.; Kuemmerle, T.; Elbakidze, M.; Ozdogan, M.; Radeloff, V.C.; Keuler, N.S.; Prishchepov, A.V.; Kruhlov, I.; Hostert, P. Patterns and drivers of post-socialist farmland abandonment in Western Ukraine. Land Use Policy 2011, 28, 552–562. [Google Scholar] [CrossRef]
  32. Müller, D.; Leitão, P.J.; Sikor, T. Comparing the determinants of cropland abandonment in Albania and Romania using boosted regression trees. Agric. Syst. 2013, 117, 66–77. [Google Scholar] [CrossRef]
  33. Liu, Y.; Luo, T.; Liu, Z.; Kong, X.; Li, J.; Tan, R. A comparative analysis of urban and rural construction land use change and driving forces: Implications for urban–rural coordination development in Wuhan, Central China. Habitat Int. 2015, 47, 113–125. [Google Scholar] [CrossRef]
  34. Terres, J.M.; Scacchiafichi, L.N.; Wania, A.; Ambar, M.; Anguiano, E.; Buckwell, A.; Coppola, A.; Gocht, A.; Källström, H.N.; Pointereau, P.; et al. Farmland abandonment in Europe: Identification of drivers and indicators, and development of a composite indicator of risk. Land Use Policy 2015, 49, 20–34. [Google Scholar] [CrossRef]
  35. Zhang, Y.; Li, X.; Song, W. Determinants of cropland abandonment at the parcel, household and village levels in mountain areas of China: A multi-level analysis. Land Use Policy 2014, 41, 186–192. [Google Scholar] [CrossRef]
  36. Sang, N.; Dramstad, W.E.; Bryn, A. Regionality in Norwegian farmland abandonment: Inferences from production data. Appl. Geogr. 2014, 55, 238–247. [Google Scholar] [CrossRef]
  37. Uematsu, Y.; Koga, T.; Mitsuhashi, H.; Ushimaru, A. Abandonment and intensified use of agricultural land decrease habitats of rare herbs in semi-natural grasslands. Agric. Ecosyst. Environ. 2010, 135, 304–309. [Google Scholar] [CrossRef]
  38. Heller, P.S. The challenge of an aged and shrinking population: Lessons to be drawn from Japan’s experience. J. Econ. Ageing 2016, 8, 85–93. [Google Scholar] [CrossRef]
  39. Morimoto, T. Idle and abandoned farmland in Kashiwai-cho 4-chome, Ichikawa City, Chiba prefecture. Geogr. Rev. Jpn. 1993, 66, 81–87. (In Japanese) [Google Scholar] [CrossRef]
  40. Yokomichi, K. The Development of Municipal Mergers in Japan; Up-to-date Doc. Local Auton. Japan; Council of Local Authorities for International Relations (CLAIR): Tokyo, Japan, 2007; Volume 4.
  41. Ministry of Internal Affairs and Communications Japan. Statistical Handbook of Japan; MAFF: Tokyo, Japan, 2015.
  42. Gellrich, M.; Baur, P.; Koch, B.; Zimmermann, N.E. Agricultural land abandonment and natural forest re-growth in the Swiss mountains: A spatially explicit economic analysis. Agric. Ecosyst. Environ. 2007, 118, 93–108. [Google Scholar] [CrossRef]
  43. Fukamachi, K. Sustainability of terraced paddy fields in traditional satoyama landscapes of Japan. J. Environ. Manag. 2017, 202, 543–549. [Google Scholar] [CrossRef] [PubMed]
  44. Pirdavani, A.; Bellemans, T.; Brijs, T.; Kochan, B.; Wets, G. Assessing the road safety impacts of a teleworking policy by means of geographically weighted regression method. J. Transp. Geogr. 2014, 39, 96–110. [Google Scholar] [CrossRef]
  45. Kemp, F. Applied multiple regression/correlation analysis for the behavioral sciences. J. R. Stat. Soc. Ser. D 2003, 52, 691. [Google Scholar] [CrossRef]
  46. Tu, J. Spatially varying relationships between land use and water quality across an urbanization gradient explored by geographically weighted regression. Appl. Geogr. 2011, 31, 376–392. [Google Scholar] [CrossRef]
  47. Anselin, L. Local Indicators of Spatial Association—LISA. Geogr. Anal. 1995, 27, 93–115. [Google Scholar] [CrossRef]
  48. Ord, J.K.; Getis, A. Local Spatial Autocorrelation Statistics: Distributional Issues and an Application. Geogr. Anal. 1995, 27, 286–306. [Google Scholar] [CrossRef]
  49. Clement, F.; Orange, D.; Williams, M.; Mulley, C.; Epprecht, M. Drivers of afforestation in Northern Vietnam: Assessing local variations using geographically weighted regression. Appl. Geogr. 2009, 29, 561–576. [Google Scholar] [CrossRef]
  50. Brunsdon, C.; Fotheringham, A.S.; Charlton, M. Some notes on parametric significance tests for geographically weighted regression. J. Reg. Sci. 1999, 39, 497–524. [Google Scholar] [CrossRef]
  51. Oliveira, S.; Pereira, J.M.C.; San-Miguel-Ayanz, J.; Lourenço, L. Exploring the spatial patterns of fire density in Southern Europe using Geographically Weighted Regression. Appl. Geogr. 2014, 51, 143–157. [Google Scholar] [CrossRef]
  52. Jaimes, N.B.P.; Sendra, J.B.; Delgado, M.G.; Plata, R.F. Exploring the driving forces behind deforestation in the state of Mexico (Mexico) using geographically weighted regression. Appl. Geogr. 2010, 30, 576–591. [Google Scholar] [CrossRef]
  53. Chiou, Y.-C.; Jou, R.-C.; Yang, C.-H. Factors affecting public transportation usage rate: Geographically weighted regression. Transp. Res. Part A Policy Pract. 2015, 78, 161–177. [Google Scholar] [CrossRef]
  54. Deininger, K.; Savastano, S.; Carletto, C. Land Fragmentation, Cropland Abandonment, and Land Market Operation in Albania. World Dev. 2012, 40, 2108–2122. [Google Scholar] [CrossRef]
  55. Gen, S.J. Prevention Mechanism of Farmland Abandonment in a Mountain Village in Nishi-Aizu Town. Q. J. Geogr. 2015, 66, 284–297. (In Japanese) [Google Scholar] [Green Version]
  56. Kanzaka, S. Discovering Japan: A New Regional Geography; Teikoku-Shoin: Tokyo, Japan, 2009. [Google Scholar]
  57. Gibon, A.; Sheeren, D.; Monteil, C.; Ladet, S.; Balent, G. Modelling and simulating change in reforesting mountain landscapes using a social-ecological framework. Landsc. Ecol. 2010, 25, 267–285. [Google Scholar] [CrossRef] [Green Version]
  58. Matsuno, Y.; Nakamura, K.; Masumoto, T.; Matsui, H.; Kato, T.; Sato, Y. Prospects for multifunctionality of paddy rice cultivation in Japan and other countries in monsoon Asia. Paddy Water Environ. 2006, 4, 189–197. [Google Scholar] [CrossRef]
  59. Takahashi, D. The Agricultural Adjustment Problem of Japanese Agriculture: Technological Progress, Price Policies and Farmland Policies. J. Rural Econ. Back Issue 2015, 87, 9–22. (In Japanese) [Google Scholar]
  60. George-Mulgan, A. Japan’s Interventionist State: The Role of the MAFF; Taylor & Francis: Didcot, UK, 2004. [Google Scholar]
  61. Yoshizawa, S. Japanese Less Favored Areas & Regional Revitalization; Yoshio Tsurumi: Tokyo, Japan, 2003. [Google Scholar]
  62. Renwick, A.; Jansson, T.; Verburg, P.H.; Revoredo-Giha, C.; Britz, W.; Gocht, A.; McCracken, D. Policy reform and agricultural land abandonment in the EU. Land Use Policy 2013, 30, 446–457. [Google Scholar] [CrossRef]
  63. Grădinaru, S.R.; Iojă, C.I.; Onose, D.A.; Gavrilidis, A.A.; Pătru-Stupariu, I.; Kienast, F.; Hersperger, A.M. Land abandonment as a precursor of built-up development at the sprawling periphery of former socialist cities. Ecol. Indic. 2015, 57, 305–313. [Google Scholar] [CrossRef]
  64. Jentzsch, H. Abandoned land, corporate farming, and farmland banks: A local perspective on the process of deregulating and redistributing farmland in Japan. Contemp. Jpn. 2017, 29, 31–46. [Google Scholar] [CrossRef]
Figure 1. Prefectures and Regions of Japan. Source: DEM: Geospatial Information Authority of Japan (GSI), https://fgd.gsi.go.jp/download/menu.php.
Sustainability 10 03676 g001
Figure 2. Geographical Characteristics of the Study Region. Source: digital elevation model (DEM): Geospatial Information Authority of Japan (GSI), https://fgd.gsi.go.jp/download/menu.php; Road networks: National land numerical information download service, http://nlftp.mlit.go.jp/ksj-e/jpgis/jpgis_datalist.html.
Sustainability 10 03676 g002
Figure 3. Farmland abandonment rates in Japan in 2015.
Sustainability 10 03676 g003
Figure 4. Changes in farmland abandoned areas (ha).
Sustainability 10 03676 g004
Figure 5. Spatial autocorrelation of the FLAR in Japan for 2010 and 2015. (a) 2010; (b) 2015.
Sustainability 10 03676 g005
Figure 6. Spatial distribution of estimated coefficients and pseudo t-values of the arable land ratio of self-sufficient farm households. (a) Coefficients; (b) t-values.
Sustainability 10 03676 g006
Figure 7. Spatial distribution of estimated coefficients and pseudo t-values of paddy field density. (a) Coefficients; (b) t-values.
Sustainability 10 03676 g007
Figure 8. Spatial distribution of estimated coefficients and pseudo t-values of the mean slope. (a) Coefficients; (b) t-values.
Sustainability 10 03676 g008
Figure 9. Spatial distribution of estimated coefficients and pseudo t-values of the ratio of non-successor farm households. (a) Coefficients; (b) t-values.
Sustainability 10 03676 g009
Figure 10. Spatial distribution of estimated coefficients and pseudo t-values of arable land area per farm household. (a) Coefficients; (b) t-values.
Sustainability 10 03676 g010
Figure 11. Spatial distribution of estimated coefficients and pseudo t-values of laborers per farm household. (a) Coefficients; (b) t-values.
Sustainability 10 03676 g011
Figure 12. Farmland abandonment in different regions (2005–2015).
Sustainability 10 03676 g012
Table 1. Explanatory determinants (geographical factors) (2015).
Type of VariableDescriptionMinMaxMeanSD
Dependent variable (Former municipality level, N = 9368)
Y Farmland abandonment rateAbandoned land area/(abandoned land area + total arable land area) (%)010021.3117.83
Independent variables (Former municipality level, N = 9396)
Geographical factors:
X1 Mean slope (degree)To define the steepness038.8413.209.85
X2 Expressway density (km/km2)To describe access by the expressway02.120.0470.11
X3 Railroad density (km/km2)To describe access by railroad 011.850.0500.20
Table 2. Explanatory determinants (socio-economic factors) (2015).
Type of VariableDescriptionMinMaxMeanSD
Independent variables (Former municipality level, N = 9368); Socio-economic factors: Farm household related:
X4 Arable land ratio of self-sufficient farm households (TH)Self-sufficient household arable land area/total arable land area (%)010015.3017.57
X5 Arable land ratio of land tenure non-farm households (TH)Non-farm household arable land area/total arable land area (%)010025.1273.04
X6 Arable land area per farm household (TH)Total arable land area/total farm households (ha)0.08107.781.273.49
X7 Ratio of the first type of part-time farm household (BH)The first type of part-time farm household/total farm households (%)0.517511.787.46
X8 Laborers per farm household (BH)Total agricultural laborers/total farm household (people)0.253.781.530.36
X9 Ratio of non-successor farm households (BH)Farm households without successors/total farm households (%)11.1110071.0211.66
Farmland-related factors:
X10 Ratio of leased (tenanted) land (ME)Leased (tenanted) land area/total arable land area (%)010035.5219.36
X11 Ratio of leased-out land (ME)Leased-out land area/total arable land area (%)01005.785.93
X12 Paddy field density (ME)Paddy field area/total arable land area (%)010071.0828.45
Source: Variable data: Ministry of Agriculture, Forestry and Fishery (MAFF), http://www.maff.go.jp/e/index.html; DEM: Geospatial Information Authority of Japan (GSI), https://fgd.gsi.go.jp/download/menu.php; TH: data were derived from total farm households; BH: data were derived from commercial farm households; ME: data were derived from total agriculture management entities.
Table 3. Farmland abandonment rates (FLARs) in Japan by prefecture, from 2005 to 2015.
Prefecture NameFLAR 2005 (%)FLAR 2010 (%)FLAR 2015 (%)2005–2015 Change (%)Prefecture NameFLAR 2005 (%)FLAR 2010 (%)FLAR 2015 (%)2005–2015 Change (%)
Hokkaido1.971.842.030.05Shiga4.294.916.201.92
Aomori11.7312.7615.543.82Kyoto9.8511.2313.363.51
Iwate9.6812.0115.976.29Osaka14.7415.0416.501.76
Miyagi7.259.1512.255.00Hyogo7.809.2712.034.22
Akita5.066.058.163.10Nara18.5019.0421.192.69
Yamagata6.047.678.792.75Wakayama12.1114.2916.804.70
Fukushima14.9115.6720.405.49Tottori11.1512.5114.573.42
Ibaraki13.7014.7017.513.82Shimane18.3920.4024.095.70
Tochigi7.397.939.772.39Okayama16.8918.6021.144.25
Gunma20.8622.0724.193.33Hiroshima20.3323.2627.146.81
Saitama16.4917.4219.232.74Yamaguchi17.3120.7125.127.80
Chiba15.4716.6119.123.64Tokushima15.9016.6318.812.91
Tokyo14.8014.5416.281.47Kagawa15.3118.6423.658.34
Kanagawa14.3315.0316.241.90Ehime19.1521.9524.655.50
Niigata5.886.467.691.81Kochi15.6816.6718.382.69
Toyama4.645.727.683.04Fukuoka8.8610.6411.302.44
Ishikawa15.3517.3118.753.39Saga8.4815.2816.878.39
Fukui4.675.947.492.82Nagasaki27.1325.9526.72−0.41
Yamanashi23.4124.5126.853.44Kumamoto11.9413.4314.722.78
Nagano17.4618.7419.742.27Oita16.1517.8419.913.76
Gifu11.5612.6616.394.83Miyazaki8.318.5810.191.88
Shizuoka18.5220.2922.604.08Kagoshima12.6512.6913.290.65
Aichi13.2813.0614.871.59Okinawa10.8910.549.35−1.54
Mie12.9713.9416.453.49National9.6610.5612.142.48
Source: Ministry of Agriculture, Forestry and Fishery (MAFF), http://www.maff.go.jp/e/index.html.
Table 4. Model selection and the best-fit model.
VariablesModel 1Model 2Model 3Model 4
Geographical variablesX1 mean slope0.150 **0.386 ** 0.158 **
X2 expressway density−0.044 **0.002
X3 railroad density0.0110.035 **
Socio-economic variablesHousehold-relatedX4 arable land ratio of self-sufficient farm households0.433 ** 0.452 **0.457 **
X5 arable land ratio of land tenure non-farm households0.029 ** 0.016
X6 arable land area per farm household−0.119 ** −0.117 **−0.116 **
X7 ratio of the first type of part-time farm households−0.006 −0.014
X8 laborers per farm household−0.073 ** −0.115 **−0.065 **
X9 ratio of non-successor farm households0.145 ** 0.174 **0.147 **
Farmland-relatedX10 ratio of leased (tenanted) land−0.036 ** −0.031 *
X11 ratio of leased-out land0.027 * 0.007
X12 paddy field density−0.237 ** −0.265 **−0.222 **
AICC(OLS)52,171.9857,092.2352,466.7452,203.11
AICC(GWR)51,142.3155,795.2950,815.7250,399.48
Radj2 (OLS)0.4690.1470.4470.489
Radj2 (GWR)0.5940.1980.6170.637
** Correlation is significant at the 0.01 level (2-tailed); * Correlation is significant at the 0.05 level (2-tailed).
Table 5. Moran’s I statistics of the dependent and selected independent variables.
VariableMoran’s IZ-Scorep-ValueCoefficients
Dependent variableY farmland abandonment rate0.55486.430.001
Independent variablesX1 mean slope0.790126.720.0010.158 **
X4 arable land ratio of self-sufficient farm households0.54184.620.0010.457 **
X5 arable land area per farm household0.773118.680.001−0.116 **
X8 laborers per farm household0.61794.140.001−0.065 **
X9 ratio of non-successor farm households0.31545.550.0010.147 **
X12 paddy field density0.695103.540.001−0.222 **
** Correlation is significant at the 0.01 level (2-tailed); * Correlation is significant at the 0.05 level (2-tailed).

