Global Warming and Acidification Potential Assessment of a Collective Manure Management System for Bioenergy Production and Nitrogen Removal in Northern Italy

 , ,
, ,
Abstract
1. Introduction
1.1. Manure Management Challenges
1.2. Collective Manure Management Systems
1.3. Environmental Assessment of Manure Management Systems
1.4. Aim of the Study
2. Materials and Methods
2.1. Treatment Plant Description and Data Collection
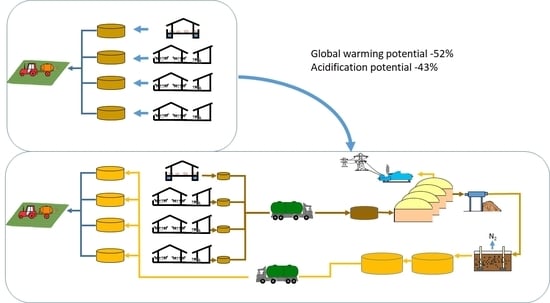
2.2. Description of the Scenarios, System Boundaries and Stages
- Manure collection and short-term storage. This stage includes manure removal from livestock and manure storage under slatted floors or in pits collecting liquid manure before it is placed in the main manure storage.
- On-farm manure storage. The slurry and solid manure are stored in open facilities with a capacity of at least 180 days for liquids and 90 days for solid excreta.
- Transport and field application of manure. The operation is performed by slurry tankers that both transport the slurry to the field and then apply the slurry using a splash plate.
- Manure collection and on-farm manure short-term storage. A storage capacity of 14 days for each livestock production unit is considered. This storage is functional to the transport system that transports manure to the treatment plant and to intermediate storage.
- Transport to the treatment plant. This stage includes the transport of raw manure by trucks and slurry tankers from the livestock units to the intermediate storage of the collective treatment plant
- Intermediate storage of the raw manure in two continuously-mixed pre-treatment tanks (885 m3 and 570 m3).
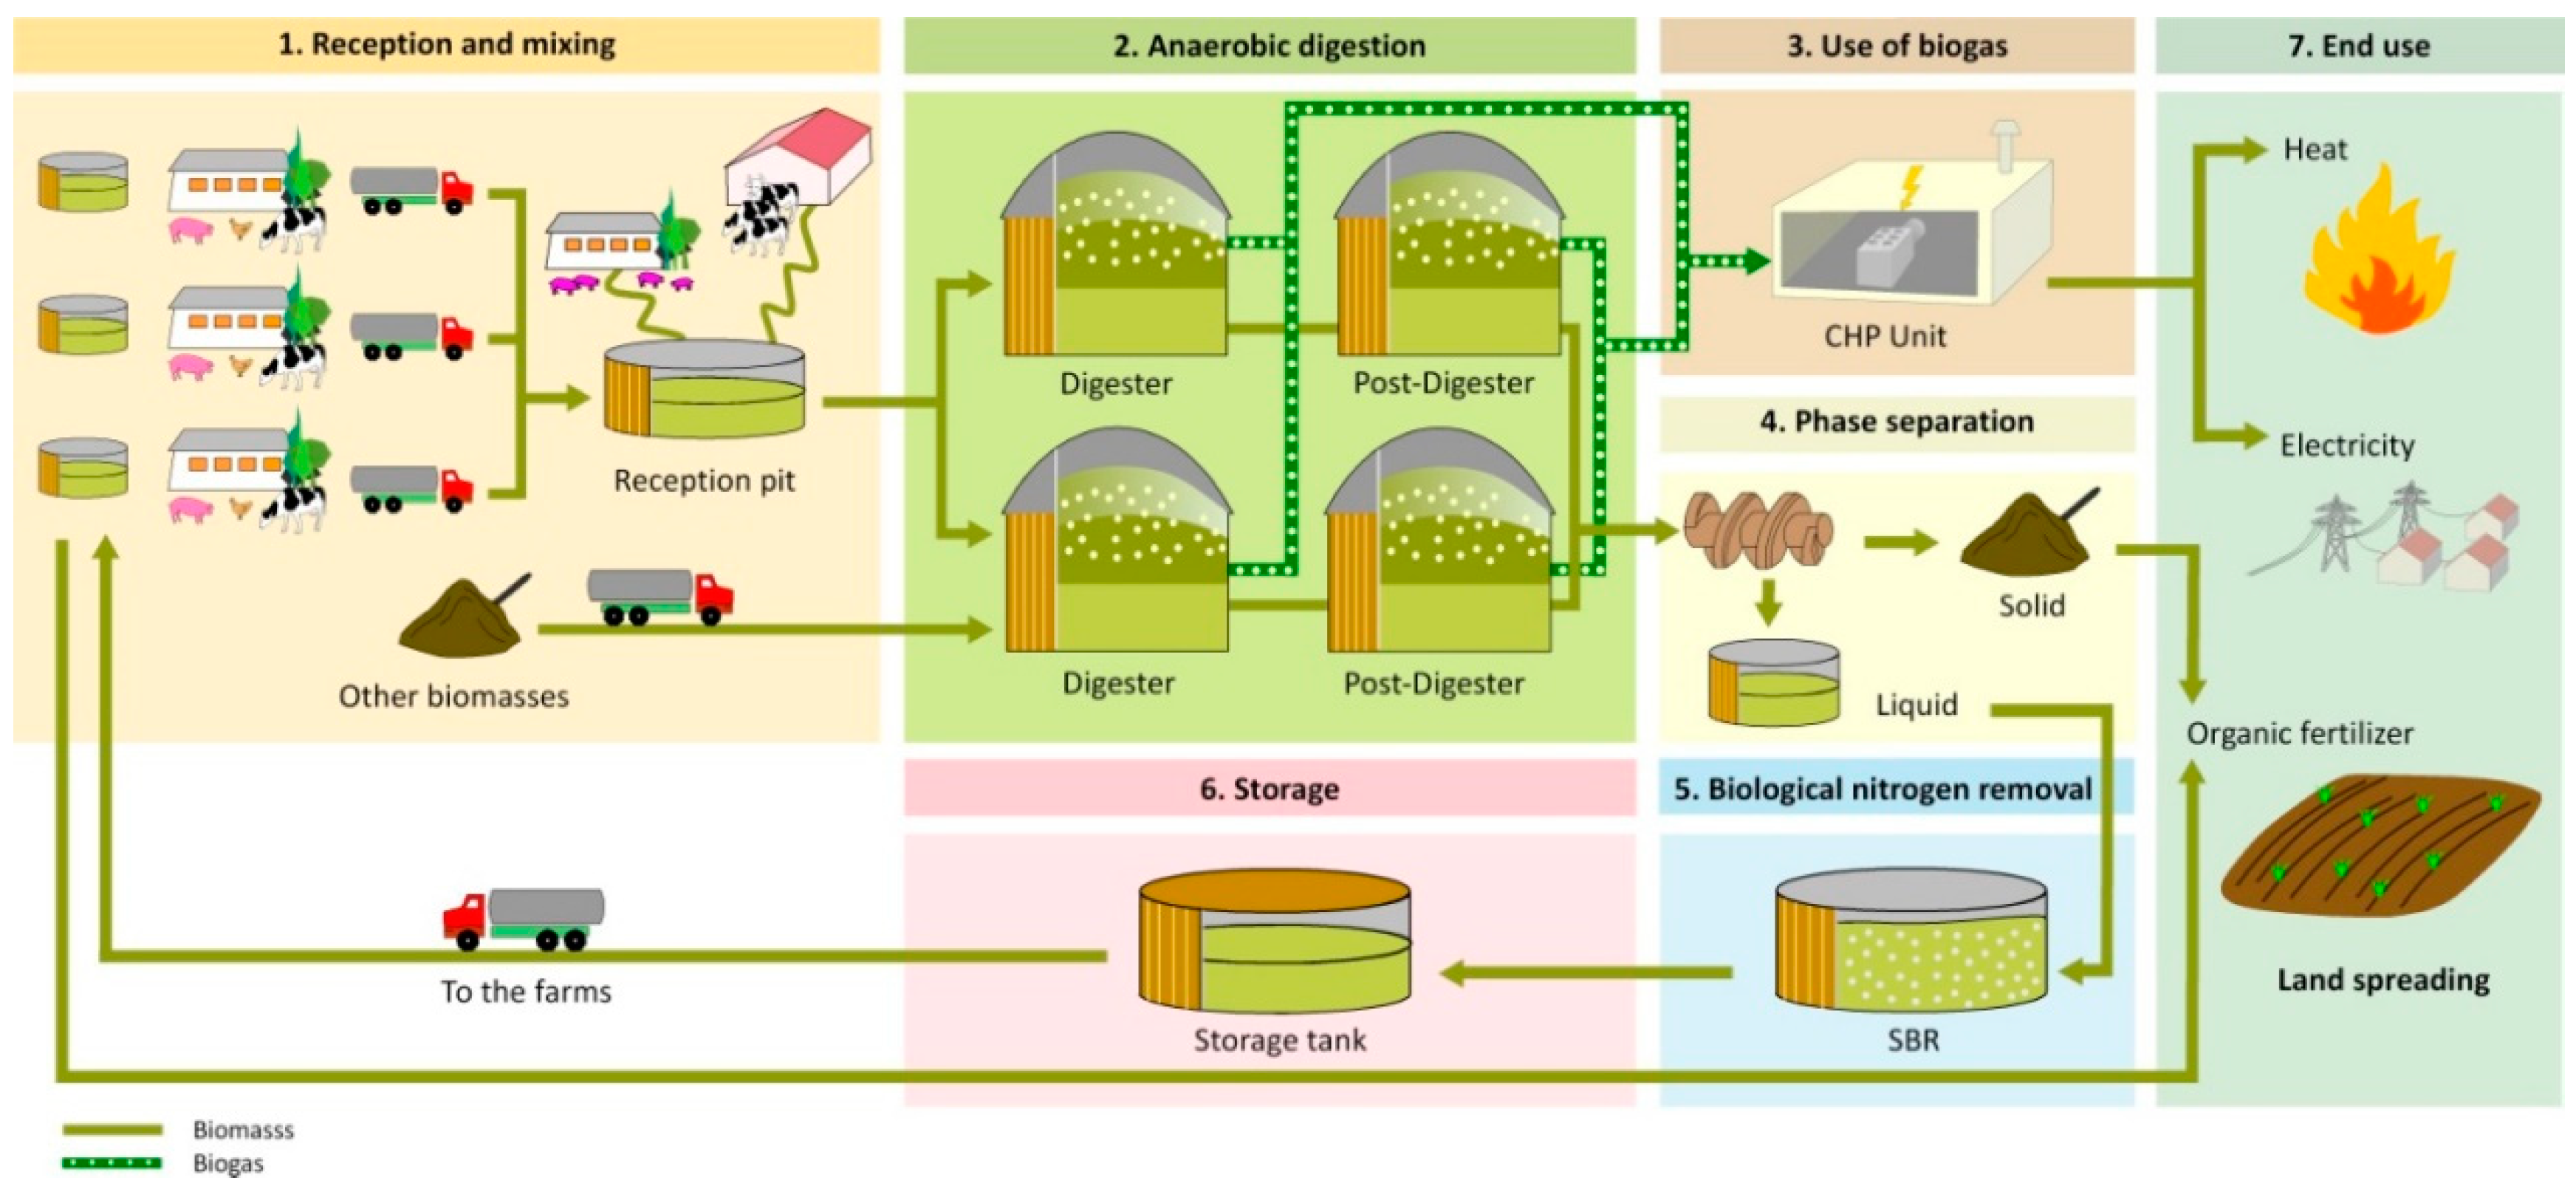
- Treatment (AD, solid-liquid separation, BNR). This stage encompasses: (a) mixture of raw manure with the co-substrates (approximately 10% maize silage, cereals flour, molasses and poultry manure); (b) AD; (c) solid-liquid separation of digestate; (d) BNR; and (e) intermediate storage of the treated effluents. AD is carried out in four digesters (mesophilic conditions, 38–40 °C) and four post-digesters. The total volume of the digesters is 10,930 m3, while the volume of post-digesters is 12,740 m3. The slurry mixture is pumped to the four digesters, where it is anaerobically digested and then conveyed to the post-digesters. The produced biogas is dehumidified, chilled and fed to two combined heat and power (CHP) units, each with an engine of 1 MW of electric power. CHP output are electricity and heat. CHP output are electricity and heat. The electric production is sent to the electric grid and sold as renewable energy; heat is partially used to maintain digester and post-digester in mesophilic conditions (38–40 °C). After retention in the post-digesters, the digested slurry is separated through two decanter-centrifuges. The solid fraction is stored at the plant and sold to nearby farms. In contrast, the liquid fraction is treated through nitrification-denitrification to remove nitrogen in the four SBRs that work in parallel. In each SBR, four phases occur: (i) fill and draw phase (the liquid fraction is pumped in the reactor and the treated slurry conveyed to storages); (ii) mixing phase; (iii) aerobic phase; and (iv) sedimentation phase. An overall value of 70% has been used for nitrogen removal efficiency based on the data collected during the monitoring activity.
- Storage in the treatment plant. After the BNR unit, the treated effluent is pumped to the intermediate storage at the treatment plant, which consists of three covered storage tanks having a total capacity of 12,620 m3.
- Transport of the end-product to the farms. The treated effluent is moved by trucks and slurry tankers from the collective treatment plant to the individual livestock units that contributed raw manure. As the same truck or slurry tanker is used both for the transport of raw and treated the two transport operations are considered together.
- On-farm manure storage. At farm-level the treated effluent is stored in open tanks for an average period of 100 days.
- Field application. The treated effluent is both transported to the field and applied by slurry tankers. The slurry is applied using a splash plate.
2.3. Emissions Assessment
2.4. GWP and AP Calculation
3. Results
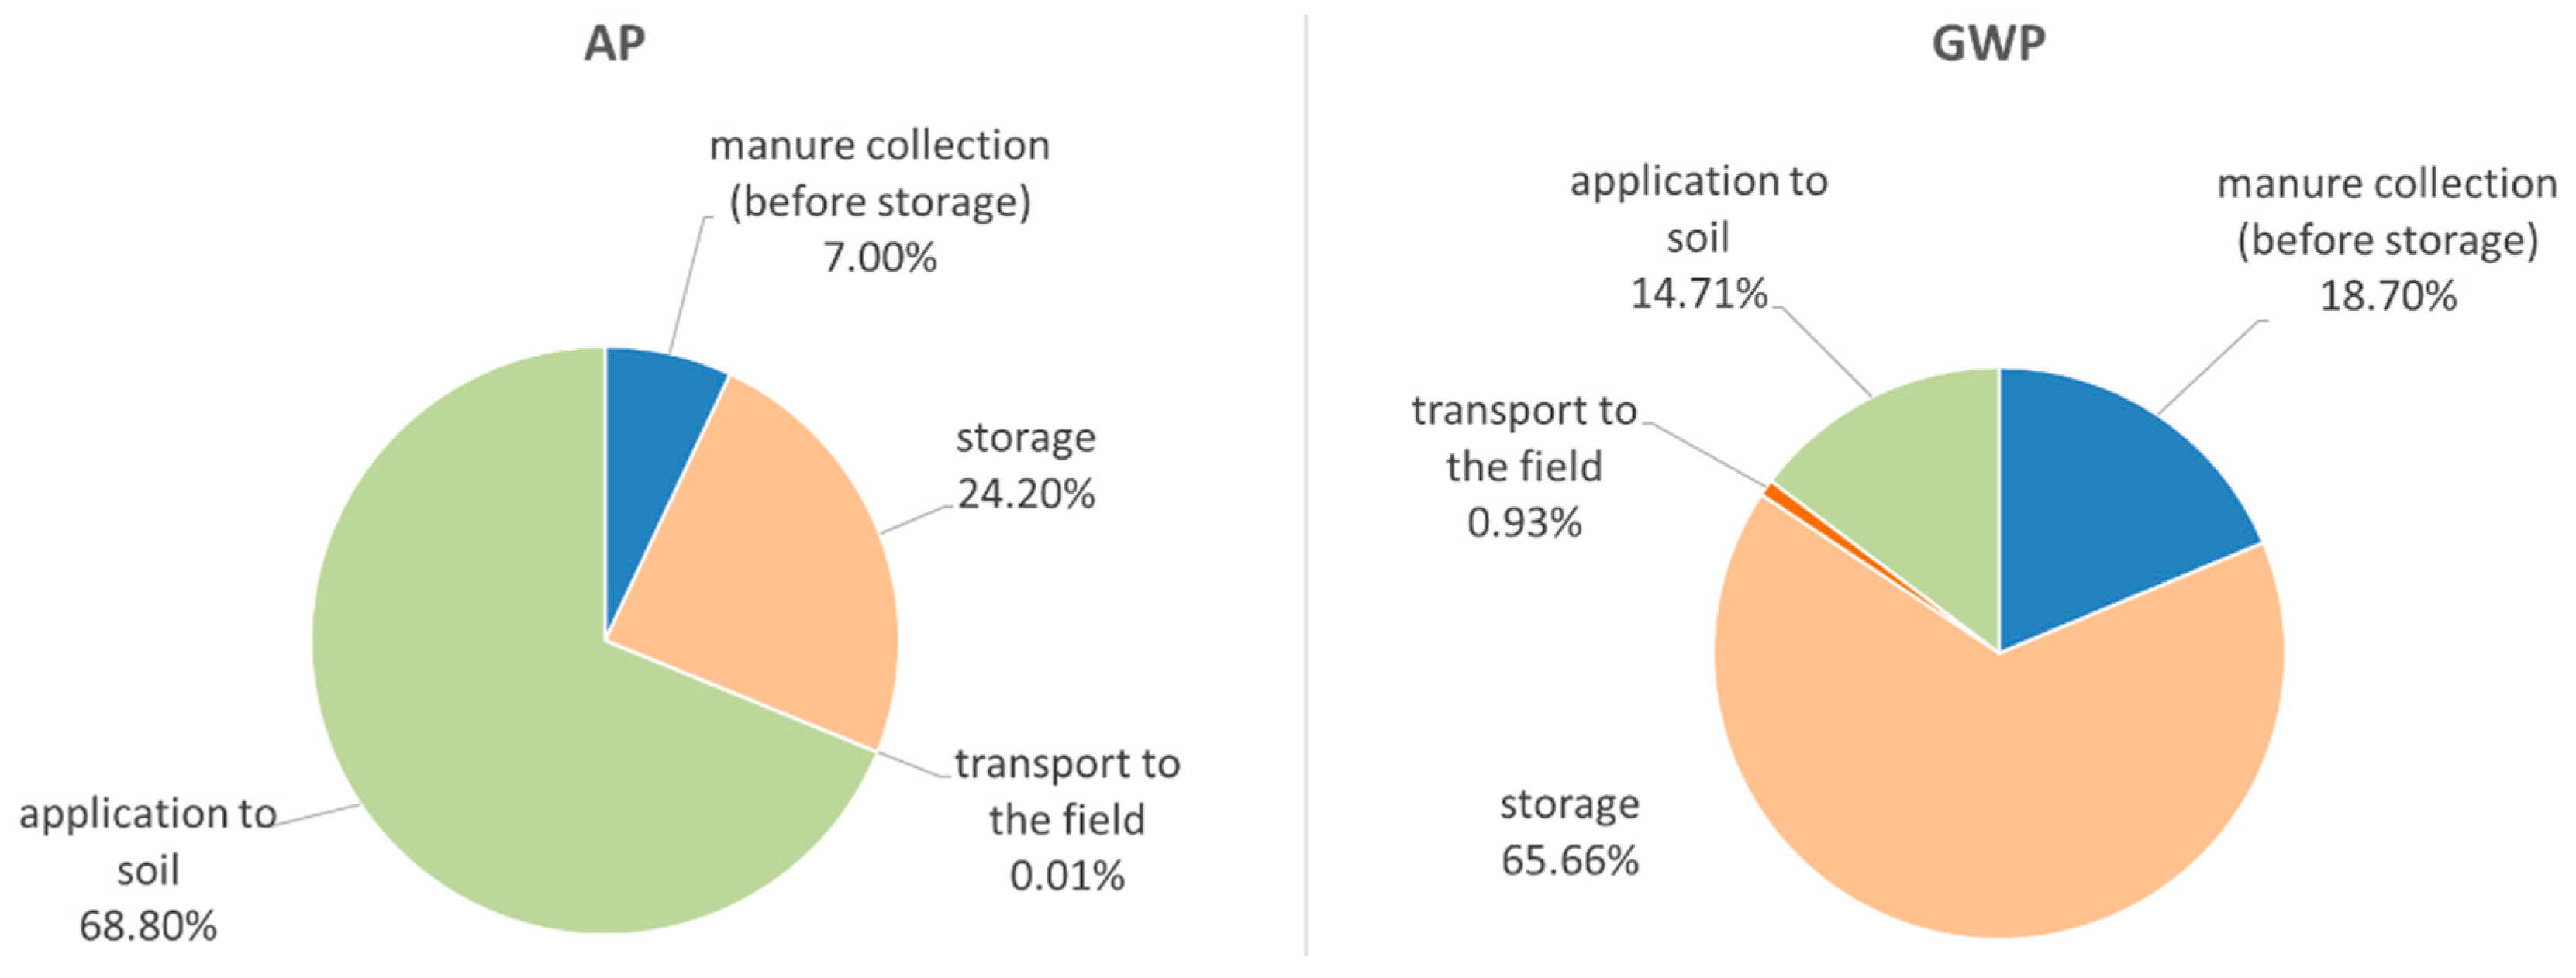
3.1. Emissions in the Baseline Scenario
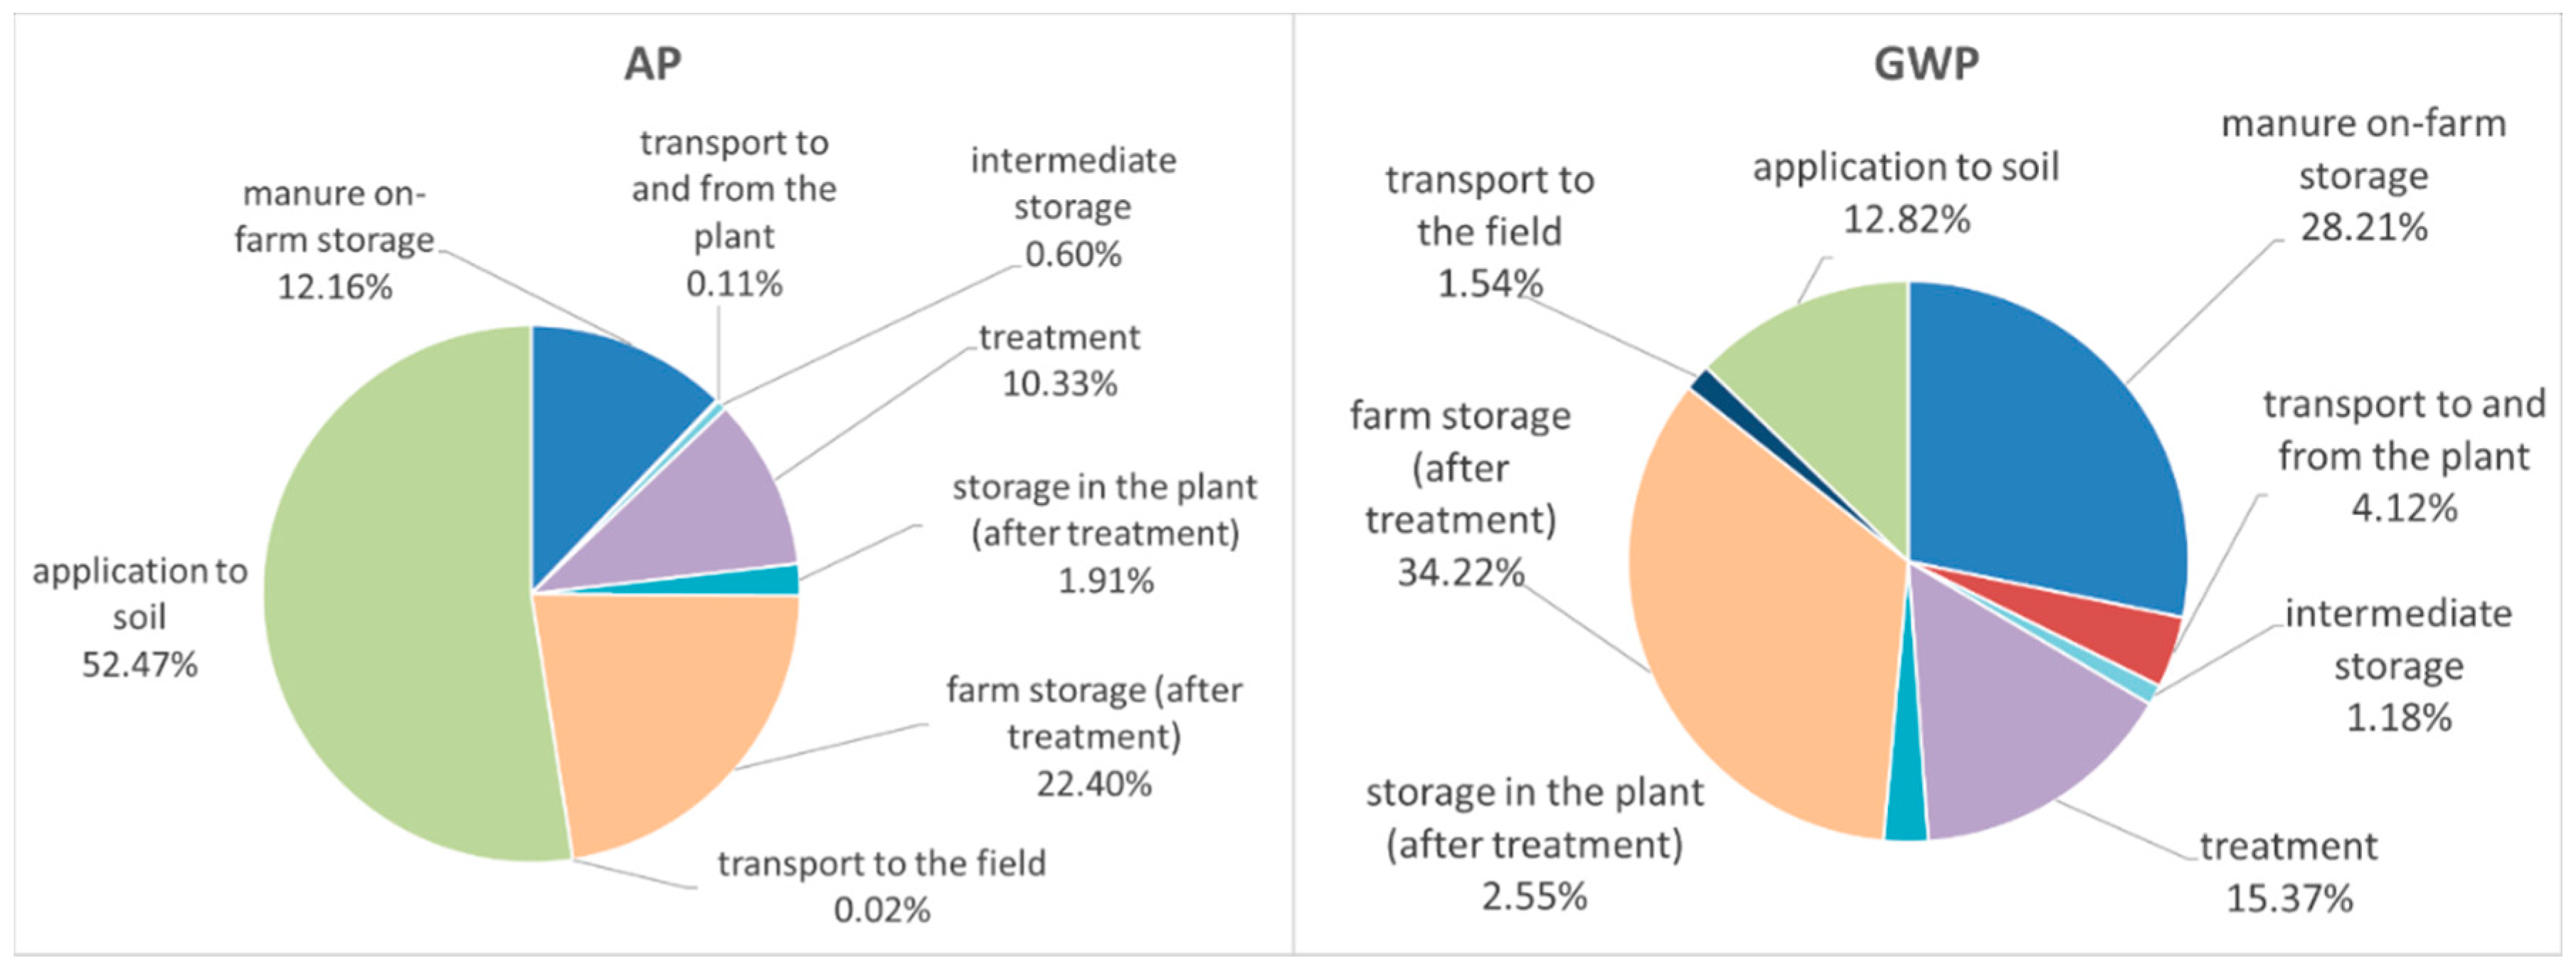
3.2. Emissions in the Collective Treatment Scenario
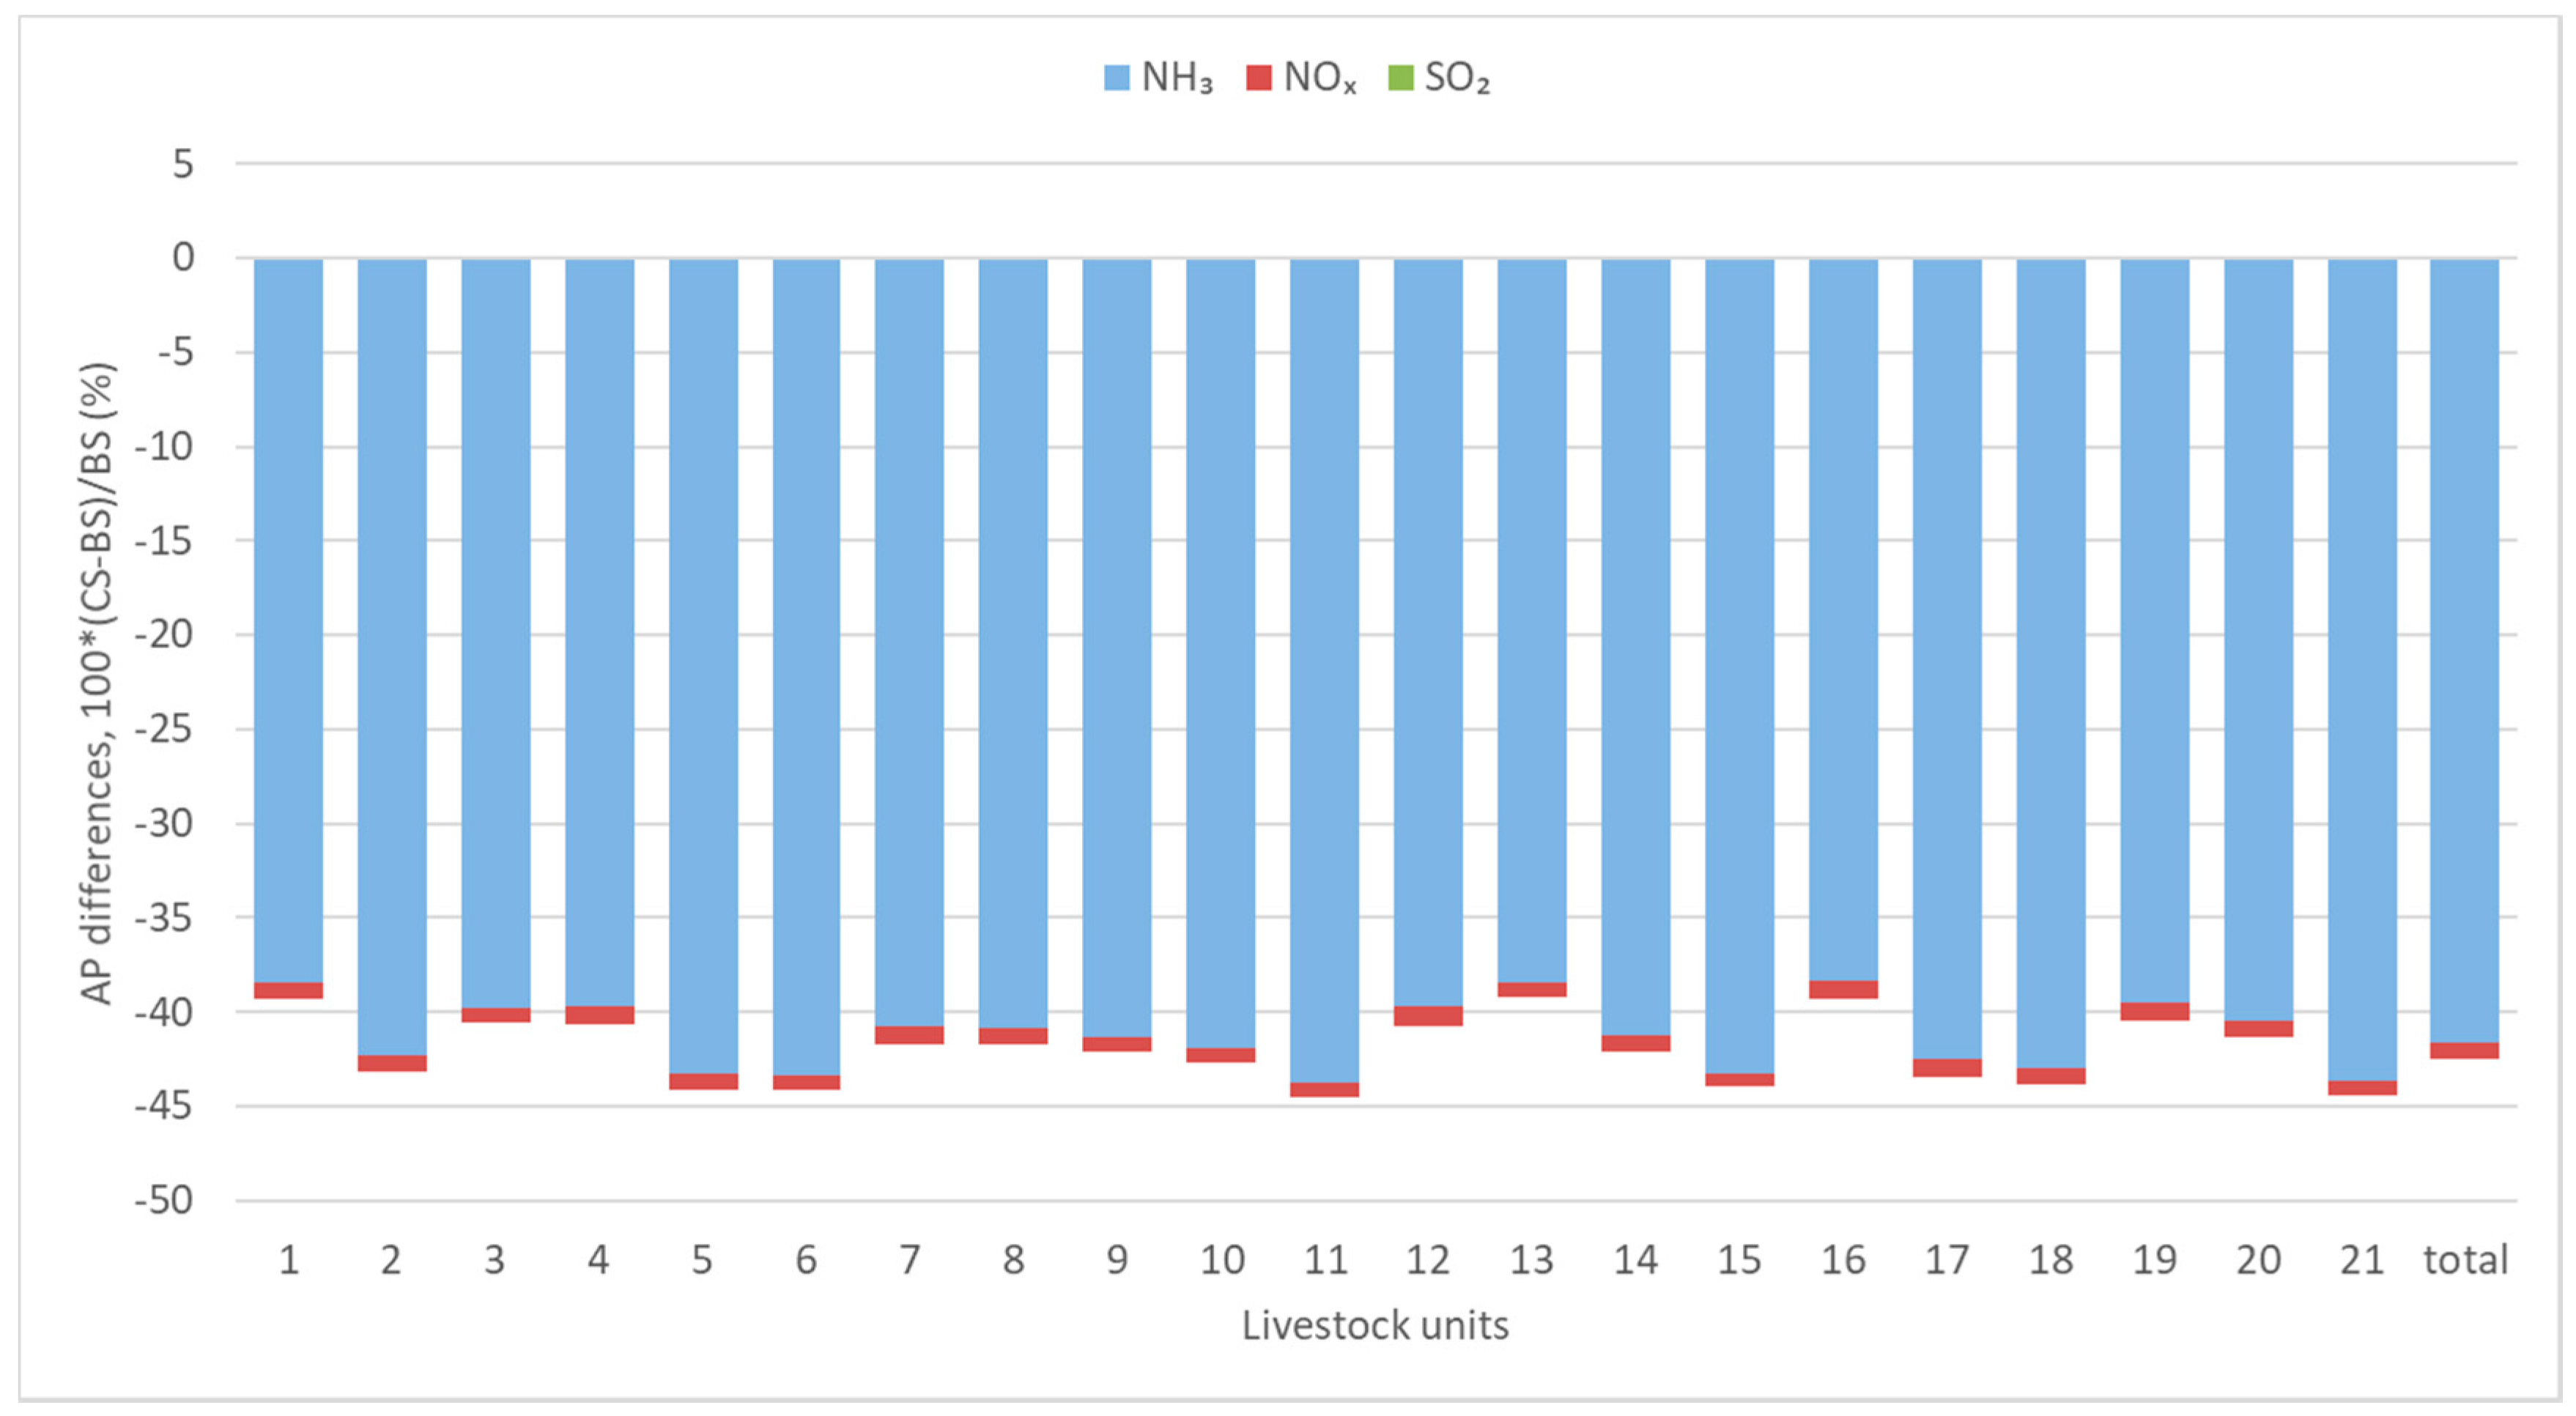
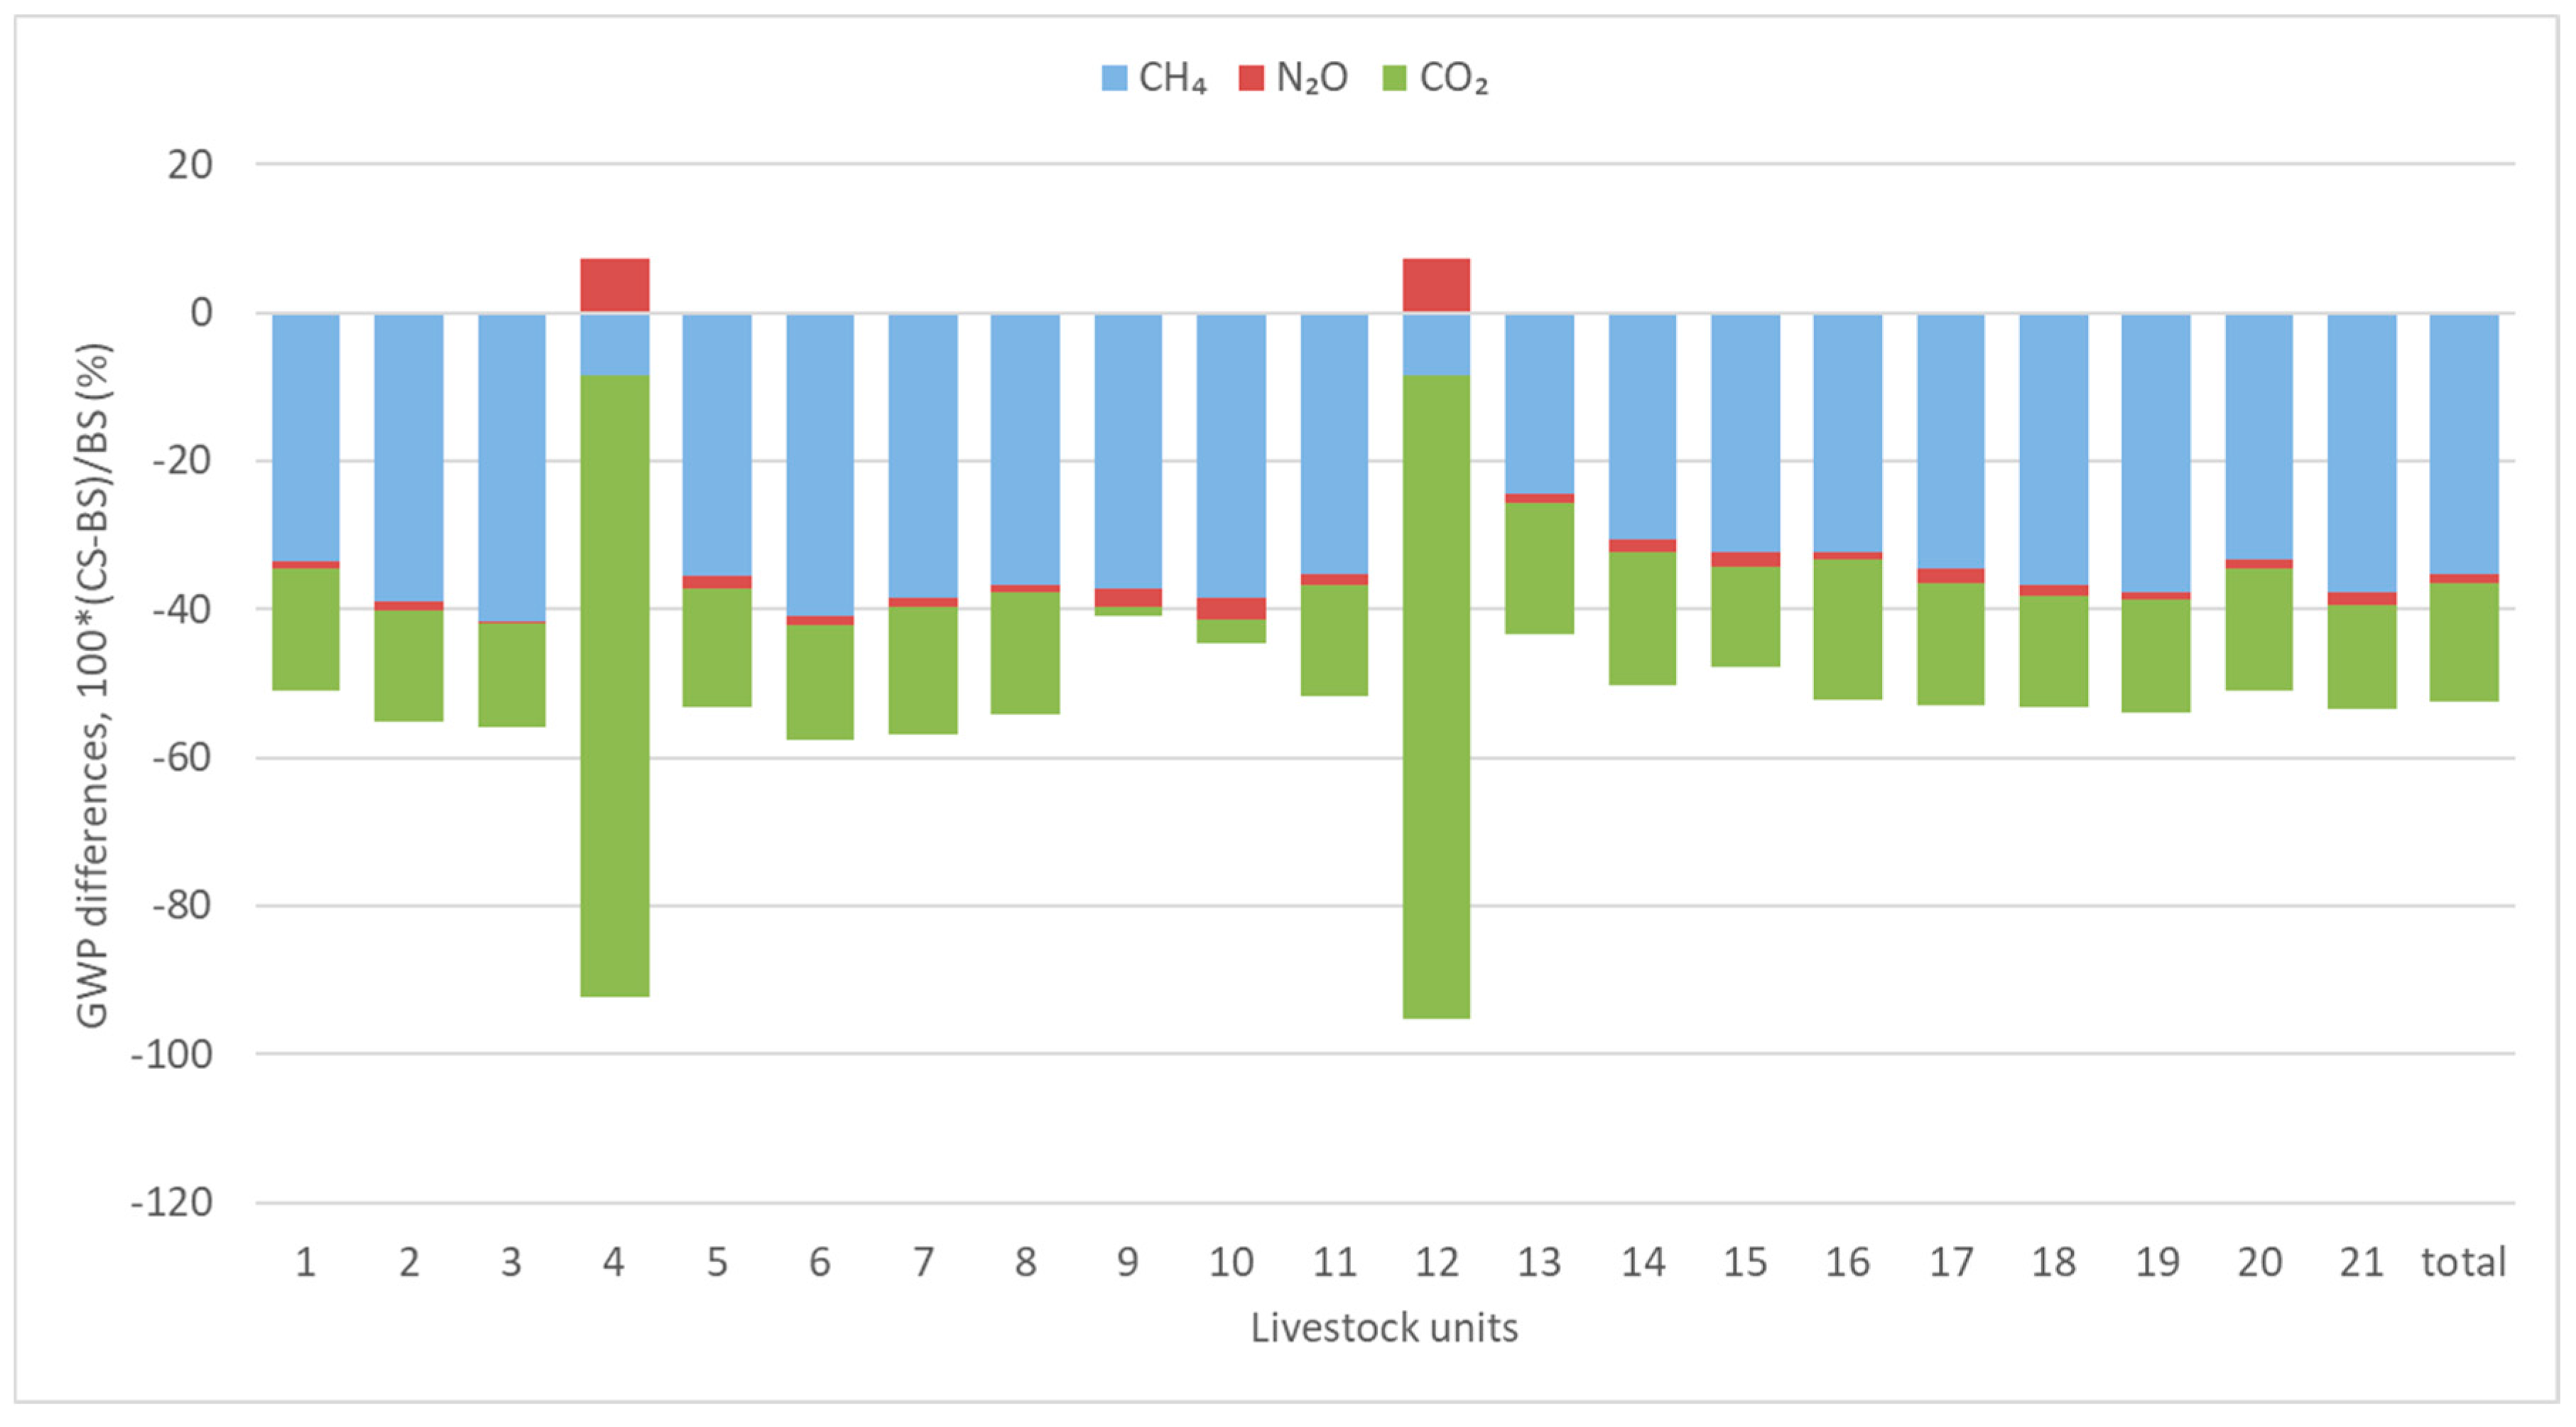
3.3. Comparison of Scenarios
3.4. Discussion
4. Conclusions
Author Contributions
Funding
Acknowledgments
Conflicts of Interest
Abbreviations
| AD | anaerobic digestion |
| AP | acidification potential |
| BNR | biological nitrogen removal |
| BS | baseline scenario |
| CH4 | methane |
| CHP | combined heat and power |
| CO2 | carbon dioxide |
| CS | collective scenario |
| EEA | European Environment Agency |
| EF | emission factor |
| GHGs | greenhouse gases |
| GWP | global warming potential |
| IPCC | Intergovernmental Panel on Climate Change |
| LCA | life cycle assessment |
| MFC | methane conversion factor |
| N2O | nitrous oxide |
| NH3 | ammonia |
| NOx | Nitric oxide |
| SBR | sequencing batch reactor |
| SO2 | Sulfur dioxide |
| TAN | total ammoniacal nitrogen |
References
- OECD. Environmental Performance of Agriculture in OECD Countries Since 1990; OECD Publishing: Paris, France, 2008; Volume 9789264040, ISBN 9789264040854. [Google Scholar]
- Hou, Y.; Velthof, G.L.; Lesschen, J.P.; Staritsky, I.G.; Oenema, O. Nutrient Recovery and Emissions of Ammonia, Nitrous Oxide, and Methane from Animal Manure in Europe: Effects of Manure Treatment Technologies. Environ. Sci. Technol. 2017, 51, 375–383. [Google Scholar] [CrossRef] [PubMed]
- Petersen, S.O.; Sommer, S.G.; Béline, F.; Burton, C.; Dach, J.; Dourmad, J.Y.; Leip, A.; Misselbrook, T.; Nicholson, F.; Poulsen, H.D.; et al. Recycling of livestock manure in a whole-farm perspective. Livest. Sci. 2007, 112, 180–191. [Google Scholar] [CrossRef]
- Laguë, C.; Landry, H.; Roberge, M. Engineering of land application systems for livestock manure: A review. Can. Biosyst. Eng. Genie Biosyst. Can. 2005, 47, 17–28. [Google Scholar]
- Loyon, L. Overview of manure treatment in France. Waste Manag. 2017, 61, 516–520. [Google Scholar] [CrossRef] [PubMed]
- Flotats, X.; Bonmatí, A.; Fernández, B.; Magrí, A. Manure treatment technologies: On-farm versus centralized strategies. NE Spain as case study. Bioresour. Technol. 2009, 100, 5519–5526. [Google Scholar] [CrossRef] [PubMed]
- Pasqual, J.; Bollmann, H.; Scott, C.; Edwiges, T.; Baptista, T. Assessment of Collective Production of Biomethane from Livestock Waste for Urban Transportation Mobility in Brazil and the United States. Energies 2018, 11, 997. [Google Scholar] [CrossRef]
- Skovsgaard, L.; Jacobsen, H.K. Economies of scale in biogas production and the significance of flexible regulation. Energy Policy 2017, 101, 77–89. [Google Scholar] [CrossRef]
- Hadin, Å.; Hillman, K.; Eriksson, O. Prospects for Increased Energy Recovery from Horse Manure—A Case Study of Management Practices, Environmental Impact and Costs. Energies 2017, 10, 1935. [Google Scholar] [CrossRef]
- Lopez-Ridaura, S.; van der Werf, H.; Paillat, J.M.; Le Bris, B. Environmental evaluation of transfer and treatment of excess pig slurry by life cycle assessment. J. Environ. Manag. 2009, 90, 1296–1304. [Google Scholar] [CrossRef] [PubMed]
- Zemo, K.H.; Termansen, M. Farmers’ willingness to participate in collective biogas investment: A discrete choice experiment study. Resour. Energy Econ. 2018, 52, 87–101. [Google Scholar] [CrossRef]
- Manos, B.; Bartocci, P.; Partalidou, M.; Fantozzi, F.; Arampatzis, S. Review of public-private partnerships in agro-energy districts in Southern Europe: The cases of Greece and Italy. Renew. Sustain. Energy Rev. 2014, 39, 667–678. [Google Scholar] [CrossRef]
- Fantozzi, F.; Bartocci, P.; D’Alessandro, B.; Arampatzis, S.; Manos, B. Public-private partnerships value in bioenergy projects: Economic feasibility analysis based on two case studies. Biomass Bioenergy 2014, 66, 387–397. [Google Scholar] [CrossRef]
- Martin, G.; Moraine, M.; Ryschawy, J.; Magne, M.-A.; Asai, M.; Sarthou, J.-P.; Duru, M.; Therond, O. Crop–livestock integration beyond the farm level: A review. Agron. Sustain. Dev. 2016, 36, 53. [Google Scholar] [CrossRef]
- Sajeev, E.P.M.; Winiwarter, W.; Amon, B. Greenhouse gas and ammonia emissions from different stages of liquid manure management chains: Abatement options and emission interactions. J. Environ. Qual. 2018, 47, 30–41. [Google Scholar] [CrossRef] [PubMed]
- Yuan, Z.; Pan, X.; Chen, T.; Liu, X.; Zhang, Y.; Jiang, S.; Sheng, H.; Zhang, L. Evaluating environmental impacts of pig slurry treatment technologies with a life-cycle perspective. J. Clean. Prod. 2018, 188, 840–850. [Google Scholar] [CrossRef]
- Lijó, L.; Lorenzo-Toja, Y.; González-García, S.; Bacenetti, J.; Negri, M.; Moreira, M.T. Eco-efficiency assessment of farm-scaled biogas plants. Bioresour. Technol. 2017, 237, 146–155. [Google Scholar] [CrossRef] [PubMed]
- Sommer, S.G.; Christensen, M.L.; Schmidt, T.; Jensen, L.S. Animal Manure Recycling: Treatment and Management; John Wiley & Sons: Hoboken, NJ, USA, 2013; ISBN 9781118676677. [Google Scholar]
- Rigolot, C.; Espagnol, S.; Robin, P.; Hassouna, M.; Béline, F.; Paillat, J.M.; Dourmad, J.-Y. Modelling of manure production by pigs and NH3, N2O and CH4 emissions. Part II: Effect of animal housing, manure storage and treatment practices. Animal 2010, 4, 1413–1424. [Google Scholar] [CrossRef] [PubMed]
- IPCC. Climate Change 2013: The Physical Science Basis. Contribution of Working Group I to the Fifth Assessment Report of the Intergovernmental Panel on Climate Change; Stocker, T.F., Qin, D., Plattner, G.-K., Tignor, M., Allen, S.K., Boschung, J., Nauels, A., Xia, Y., Bex, V., Midgley, P.M., Eds.; Cambridge University Press: Cambridge, UK; New York, NY, USA, 2013; ISBN 978-1-107-66182-0. [Google Scholar]
- EUROSTAT Agri-Environmental Indicator–Greenhouse Gas Emissions. Available online: http://ec.europa.eu/eurostat/statistics-explained/index.php/Agri-environmental_indicator_-_greenhouse_gas_emissions (accessed on 17 August 2018).
- Huijbregts, M. Life-Cycle Impact Assessment of Acidifying and Eutrophying Air Pollutants. Calculation of Characterisation Factors with Rains-LCA; University of Amsterdam: Amsterdam, The Netherland, 1999. [Google Scholar]
- Jolliet, O.; Antón, A.; Boulay, A.-M.; Cherubini, F.; Fantke, P.; Levasseur, A.; McKone, T.E.; Michelsen, O.; Milà I Canals, L.; Motoshita, M.; et al. Global guidance on environmental life cycle impact assessment indicators: Impacts of climate change, fine particulate matter formation, water consumption and land use. Int. J. Life Cycle Assess. 2018, 1–19. [Google Scholar] [CrossRef]
- Pehme, S.; Veromann, E. Environmental consequences of anaerobic digestion of manure with different co-substrates to produce bioenergy: A review of life cycle assessments. Agron. Res. 2015, 13, 372–381. [Google Scholar]
- García-González, M.C.; Riaño, B.; Teresa, M.; Herrero, E.; Ward, A.J.; Provolo, G.; Moscatelli, G.; Piccinini, S.; Bonmatí, A.; Bernal, M.P.; et al. Treatment of swine manure: Case studies in European’s N-surplus areas. Sci. Agric. 2016, 73, 444–454. [Google Scholar] [CrossRef]
- European Environment Agency. EMEP/EEA Air Pollutant Emission Inventory Guidebook 2016; Publications Office of the European Union: Luxembourg, 2016; ISBN 978-92-9213-806-6. [Google Scholar]
- IPCC. 2006 IPCC Guidelines for National Greenhouse Gas Inventories; Eggleston, H.S., Buendia, L., Miwa, K., Ngara, T., Tanabe, K., Eds.; IGES: Hayama, Japan, 2006; ISBN 4-88788-032-4. [Google Scholar]
- Riaño, B.; García-González, M.C. Greenhouse gas emissions of an on-farm swine manure treatment plant—Comparison with conventional storage in anaerobic tanks. J. Clean. Prod. 2015, 103, 542–548. [Google Scholar] [CrossRef]
- Noussan, M.; Roberto, R.; Nastasi, B. Performance indicators of electricity generation at country level—The case of Italy. Energies 2018, 11, 650. [Google Scholar] [CrossRef]
- Li, Z.; Yin, F.; Li, H.; Wang, X.; Lian, J. A novel test method for evaluating the methane gas permeability of biogas storage membrane. Renew. Energy 2013, 60, 572–577. [Google Scholar] [CrossRef]
- Adams, P.W.R.; Mezzullo, W.G.; McManus, M.C. Biomass sustainability criteria: Greenhouse gas accounting issues for biogas and biomethane facilities. Energy Policy 2015, 87, 95–109. [Google Scholar] [CrossRef]
- Liebetrau, J.; Clemens, J.; Cuhls, C.; Hafermann, C.; Friehe, J.; Weiland, P.; Daniel-Gromke, J. Methane emissions from biogas-producing facilities within the agricultural sector. Eng. Life Sci. 2010, 10, 595–599. [Google Scholar] [CrossRef]
- Snyder, C.S.; Bruulsema, T.W.; Jensen, T.L.; Fixen, P.E. Review of greenhouse gas emissions from crop production systems and fertilizer management effects. Agric. Ecosyst. Environ. 2009, 133, 247–266. [Google Scholar] [CrossRef]
- Gac, A.; Béline, F.; Bioteau, T.; Maguet, K. A French inventory of gaseous emissions (CH4, N2, NH3) from livestock manure management using a mass-flow approach. Livest. Sci. 2007, 112, 252–260. [Google Scholar] [CrossRef]
- Amon, B.; Kryvoruchko, V.; Amon, T.; Zechmeister-Boltenstern, S. Methane, nitrous oxide and ammonia emissions during storage and after application of dairy cattle slurry and influence of slurry treatment. Agric. Ecosyst. Environ. 2006, 112, 153–162. [Google Scholar] [CrossRef]
- Loyon, L.; Guiziou, F.; Beline, F.; Peu, P. Gaseous Emissions (NH3, N2O, CH4 and CO2) from the aerobic treatment of piggery slurry-Comparison with a conventional storage system. Biosyst. Eng. 2007, 97, 472–480. [Google Scholar] [CrossRef]


| Farm | Type of Livestock | Live Weight (t) | Slurry (t) | Solid Manure (t) | Total N (kg) |
|---|---|---|---|---|---|
| 1 | dairy cows | 206 | 10,398 | 903 | 33,589 |
| 2 | dairy cows | 151 | 8809 | 296 | 30,501 |
| 3 | dairy cows | 184 | 11,791 | - | 26,177 |
| 4 | laying hens | 162 | - | 1055 | 12,095 |
| 5 | dairy cows | 100 | 5383 | 255 | 19,477 |
| 6 | dairy cows | 358 | 25,445 | 130 | 78,356 |
| 7 | beef cattle | 25 | 795 | - | 2339 |
| 8 | dairy cows | 164 | 10,384 | 270 | 27,497 |
| 9 | fattening pigs | 76 | 4012 | - | 12,558 |
| 10 | fattening pigs | 242 | 6435 | - | 27,027 |
| 11 | dairy cows | 349 | 15,373 | 416 | 49,837 |
| 12 | laying hens | 176 | - | 2687 | 30,808 |
| 13 | beef cattle | 810 | 22,371 | 2406 | 71,924 |
| 14 | dairy cows | 117 | 4899 | 539 | 20,119 |
| 15 | dairy buffalo | 389 | 17,435 | 570 | 53,944 |
| 16 | dairy cows | 59 | 2760 | 286 | 9276 |
| 17 | dairy cows | 231 | 10,329 | 1024 | 55,154 |
| 18 | dairy cows & laying hens | 440 | 26,955 | 1674 | 128,893 |
| 19 | dairy cows | 181 | 8033 | 279 | 23,768 |
| 20 | dairy cows & beef cattle | 662 | 29,026 | 1946 | 97,530 |
| 21 | dairy cows | 140 | 4957 | 90 | 16,485 |
| Stage | CO2 | CH4 | N2O | NOx | NH3 | SO2 |
|---|---|---|---|---|---|---|
| Farm storage | nd | IPCC, Tier 2 | IPCC, Tier 2 | EEA, Tier 2 | EEA, Tier 2 | nd |
| Transport | IPCC, Tier 2 | IPCC, Tier 3 | IPCC, Tier 3 | EEA, Tier 2 | EEA, Tier 2 | EEA, Tier 1 |
| Intermediate storage | nd | IPCC, Tier 2 | IPCC, Tier 2 | EEA, Tier 2 | EEA, Tier 2 | nd |
| Treatment | Energy mix | IPCC, Tier 2 | IPCC, Tier 2 | EEA, Tier 2 | Monitoring | nd |
| Transport off-road | IPCC, Tier 2 | IPCC, Tier 2 | IPCC, Tier 2 | EEA, Tier 2 | EEA, Tier 2 | EEA, Tier 1 |
| Land application | nd | nd | IPCC, Tier 2 | EEA, Tier 2 | EEA, Tier 2 | nd |
| Livestock Unit | NH3 | NOx | SO2 | SO2 eq. | CH4 | CO2 | N2O | CO2 eq. |
|---|---|---|---|---|---|---|---|---|
| (kg year−1) | (kg year−1) | (kg year−1) | (kg year−1) | (kg year−1) | (kg year−1) | (kg year−1) | (t year−1) | |
| 1 | 9747 | 791 | 0.06 | 15,991 | 22,785 | 11,003 | 636 | 975 |
| 2 | 9888 | 711 | 0.03 | 16,177 | 25,902 | 6453 | 578 | 1059 |
| 3 | 7876 | 622 | 0.06 | 12,913 | 25,809 | 11,489 | 494 | 1036 |
| 4 | 4368 | 300 | 0.00 | 7139 | 1052 | 752 | 153 | 82 |
| 5 | 6704 | 451 | 0.02 | 10,952 | 13,063 | 4000 | 373 | 559 |
| 6 | 26,703 | 1830 | 0.13 | 43,640 | 73,300 | 24,907 | 1489 | 2961 |
| 7 | 668 | 55 | 0.00 | 1096 | 1615 | 567 | 44 | 69 |
| 8 | 8672 | 644 | 0.04 | 14,198 | 21,005 | 7574 | 523 | 877 |
| 9 | 4662 | 292 | 0.01 | 7604 | 5758 | 2851 | 240 | 270 |
| 10 | 9725 | 629 | 0.02 | 15,874 | 13,869 | 4567 | 515 | 630 |
| 11 | 17,826 | 1155 | 0.08 | 29,099 | 30,726 | 15,384 | 956 | 1345 |
| 12 | 11,126 | 764 | 0.01 | 18,183 | 2679 | 1900 | 389 | 209 |
| 13 | 21,339 | 1682 | 0.09 | 34,983 | 34,756 | 17,572 | 1378 | 1610 |
| 14 | 6387 | 468 | 0.02 | 10,454 | 12,631 | 3858 | 385 | 548 |
| 15 | 19,287 | 1245 | 0.07 | 31,481 | 27,179 | 12,764 | 1033 | 1245 |
| 16 | 2670 | 218 | 0.01 | 4381 | 7022 | 2156 | 177 | 294 |
| 17 | 17,108 | 1288 | 0.04 | 28,017 | 36,704 | 8042 | 1048 | 1568 |
| 18 | 41,756 | 3041 | 0.10 | 68,330 | 75,914 | 20,296 | 2290 | 3284 |
| 19 | 6785 | 562 | 0.03 | 11,137 | 19,214 | 5886 | 448 | 793 |
| 20 | 29,792 | 2283 | 0.11 | 48,809 | 62,350 | 21,969 | 1856 | 2695 |
| 21 | 5728 | 382 | 0.02 | 9356 | 11,124 | 3574 | 314 | 475 |
| Total | 268,815 | 19,415 | 0.96 | 439,813 | 524,455 | 187,562 | 15,318 | 22,584 |
| Livestock Unit | NH3 | NOx | SO2 | SO2 eq. | CH4 | CO2 | N2O | CO2 eq. |
|---|---|---|---|---|---|---|---|---|
| (kg year−1) | (kg year−1) | (kg year−1) | (kg year−1) | (kg year−1) | (kg year−1) | (kg year−1) | (t year−1) | |
| 1 | 5908 | 505 | 0.17 | 9705 | 13,145 | −148,289 | 603 | 478 |
| 2 | 5609 | 445 | 0.16 | 9198 | 13,801 | −152,399 | 533 | 476 |
| 3 | 4664 | 416 | 0.21 | 7670 | 13,136 | −133,448 | 481 | 456 |
| 4 | 2595 | 164 | 0.03 | 4234 | 846 | −67,930 | 173 | 12 |
| 5 | 3740 | 277 | 0.07 | 6122 | 7233 | −85,329 | 341 | 262 |
| 6 | 14,874 | 1129 | 0.32 | 24,364 | 37,578 | −430,560 | 1377 | 1257 |
| 7 | 389 | 35 | 0.01 | 639 | 838 | −11,202 | 41 | 30 |
| 8 | 5047 | 405 | 0.09 | 8277 | 11,501 | −137,457 | 497 | 402 |
| 9 | 2697 | 182 | 0.10 | 4406 | 2803 | −31 | 217 | 160 |
| 10 | 5567 | 372 | 0.16 | 9093 | 6748 | −15,371 | 453 | 349 |
| 11 | 9874 | 718 | 0.22 | 16,157 | 16,816 | −183,507 | 880 | 650 |
| 12 | 6610 | 413 | 0.04 | 10,782 | 2154 | −179,324 | 439 | 25 |
| 13 | 12,934 | 1130 | 0.60 | 21,260 | 23,135 | −265,626 | 1311 | 912 |
| 14 | 3693 | 286 | 0.07 | 6052 | 7695 | −94,058 | 354 | 273 |
| 15 | 10,777 | 828 | 0.47 | 17,657 | 15,313 | −155,152 | 959 | 651 |
| 16 | 1619 | 135 | 0.02 | 2658 | 4223 | −52,912 | 167 | 141 |
| 17 | 9664 | 765 | 0.17 | 15,845 | 20,806 | −248,511 | 938 | 738 |
| 18 | 23,425 | 1849 | 0.70 | 38,405 | 40,431 | −472,312 | 2129 | 1537 |
| 19 | 4033 | 355 | 0.11 | 6630 | 10,431 | −115,066 | 424 | 366 |
| 20 | 17,447 | 1428 | 0.41 | 28,629 | 35,990 | −416,836 | 1734 | 1324 |
| 21 | 3178 | 237 | 0.08 | 5204 | 5843 | −62,659 | 288 | 222 |
| Total | 154,341 | 12,075 | 4.22 | 252,987 | 290,466 | −3,427,979 | 14,339 | 10,721 |
© 2018 by the authors. Licensee MDPI, Basel, Switzerland. This article is an open access article distributed under the terms and conditions of the Creative Commons Attribution (CC BY) license (http://creativecommons.org/licenses/by/4.0/).
Share and Cite
Provolo, G.; Mattachini, G.; Finzi, A.; Cattaneo, M.; Guido, V.; Riva, E. Global Warming and Acidification Potential Assessment of a Collective Manure Management System for Bioenergy Production and Nitrogen Removal in Northern Italy. Sustainability 2018, 10, 3653. https://doi.org/10.3390/su10103653
Provolo G, Mattachini G, Finzi A, Cattaneo M, Guido V, Riva E. Global Warming and Acidification Potential Assessment of a Collective Manure Management System for Bioenergy Production and Nitrogen Removal in Northern Italy. Sustainability. 2018; 10(10):3653. https://doi.org/10.3390/su10103653
Chicago/Turabian StyleProvolo, Giorgio, Gabriele Mattachini, Alberto Finzi, Martina Cattaneo, Viviana Guido, and Elisabetta Riva. 2018. "Global Warming and Acidification Potential Assessment of a Collective Manure Management System for Bioenergy Production and Nitrogen Removal in Northern Italy" Sustainability 10, no. 10: 3653. https://doi.org/10.3390/su10103653
APA StyleProvolo, G., Mattachini, G., Finzi, A., Cattaneo, M., Guido, V., & Riva, E. (2018). Global Warming and Acidification Potential Assessment of a Collective Manure Management System for Bioenergy Production and Nitrogen Removal in Northern Italy. Sustainability, 10(10), 3653. https://doi.org/10.3390/su10103653