Article

Exploring Determinants of Urban Form in China through an Empirical Study among 115 Cities

1
School of Architecture and Urban Planning, Huazhong University of Science and Technology, Wuhan 430074, China
2
Hubei Engineering and Technology Research Center of Urbanization, Wuhan 430074, China
3
School of Architecture and Urban Planning, Shenzhen University, Shenzhen 518060, China
4
Department of City and Regional Planning, The University of North Carolina, Chapel Hill, NC 27599, USA
*
Authors to whom correspondence should be addressed.
Sustainability 2018, 10(10), 3648; https://doi.org/10.3390/su10103648
Submission received: 29 August 2018 / Revised: 17 September 2018 / Accepted: 9 October 2018 / Published: 11 October 2018
(This article belongs to the Special Issue Urban Land Use Form in China)

Abstract

:
This study aims to analyze and explain the factors that influence the urban form of Chinese cities through an empirical analysis of a cross-sectional dataset of 115 cities in 2000 and 2010. Four spatial metrics, including population density, a contiguity index, a fractal dimension index, and a shape index, are used to quantify urban form. The paper compares urban form across four economic zones and across cities of different sizes. Ordinary least square and first-difference regression models are used to analyze the determinants of urban form. The results show that urban sprawl in China is characterized by decreased population density and greater irregularity and complexity of urban built-up areas. Metrics, such as Gross Domestic Product, population, transportation costs, and economical structure are associated with urban form in different ways, and urban expansion based on large-scale industrialization and real estate development is unsustainable in the new era.

1. Introduction

Over the last two decades, researchers from multiple disciplines, such as natural sciences, economics, transportation planning, land use planning, and urban design, have made substantial progress in studying urban form [1] Rising concerns over the negative effects of urban sprawl, including traffic congestion, loss of farmland and green space, increasing costs for public services, air and water pollution, physical health, and high energy consumption, have made urban form a popular topic [2,3,4,5,6,7]. A progress to smarter urban form can only be achieved with a thorough understanding of urban form [1], but there remains considerable ambiguity about determinants of urban form.
Urban form has dramatically changed in China over the past few decades. Between 2000 and 2010, urban built-up areas in China increased by 5.1% per year, a much higher level than the urban population growth rate of 1.5% [8]. Urban sprawl has also brought serious environmental problems to Chinese cities, including traffic congestion, air and water pollution, energy consumption, and farmland loss [9,10,11]. For example, our previous study indicates that cities with low-density forms are more likely to endure higher levels of air pollution in China [12]. Despite growing debates, comprehensive assessments of urban form on a national level in China are limited, and rigorous exploration of factors that shape urban form has remained scarce.
This study tries to fill the research gap about determinants of urban form with an empirical study among 115 Chinese cities. Four metrics, namely population density, contiguity index, fractal dimension index, and shape index, are used to assess urban form for 115 large cities in 2000 and 2010. We make an assumption that population, economic growth, transportation costs, and economic structure are the main determinants of urban form for Chinese cities. Spatial metrics are compared across cities in different economic zones and cities of different sizes to analyze the effect of economic growth and population on urban form. Moreover, Ordinary Least Square (OLS) regressions and first-difference models are further used to understand how these factors affect urban form when controlling for other variables.

2. Literature Review

Measuring urban form is important for urban planning and public policy, and a wide variety of metrics have been developed to quantify urban form. The most intuitive metric of urban form may be population density, and it is often considered as the indicator of urban sprawl [13,14]. Although it is not easy to determine who first used this simple metric to describe urban form, population density is still regularly analyzed worldwide. With the development of Geographical Information System, some studies began to use neighborhood-level metrics to measure urban form on a small scale. For example, Ewing, Pendall, and Chen [15] characterized urban form with four factors representing density, land-use mix, degree of centering, and street accessibility. Likewise, Song and Knaap [16] measured the urban form by analyzing density, land-use mixtures, accessibility, pedestrian access, street design, and circulation systems, and some studies used spatial network analysis and traffic data to detect the dynamics of urban form [17]. Neighborhood-level metrics are largely dependent on block-level spatial data, which makes these metrics confined to individual cities. Remote sensing technologies offer an opportunity to measure urban form on a national level, which helps to understand urban form across cities. These metrics, often referred to landscape metrics, could be calculated from satellite images, and they have long been used in landscape ecology [18,19]. For example, shape index and fractal dimension index are usually used to measure shape complexity of urban development, and contiguity index is often employed to quantify urban continuity [20,21,22]. Since remote sensing data (e.g., Landsat) are available worldwide, landscape metrics have also been used to describe urban form for Chinese cities [23,24].
Rising concerns over social, economic, and environmental outcomes from urban sprawl have been motivating scholars searching for determinants of urban sprawl or urban size. Brueckner [25] argued that urban spatial expansion is primarily caused by three powerful factors: a growing population, rising incomes, and falling commuting costs. Quantitative methods emerged as a means to more systematically analyze driving factors of urban sprawl. Through an empirical analysis of 448 cities in the United States, Song and Zenou [26] found that the spatial size of cities is an increasing function of population, income, and transportation expenditure, and higher property taxes can make cities smaller. By analyzing cross-sectional datasets of Chinese cities, Ke, Song, and He [27] and Deng et al. [28] also found that population, income, commuting costs, the price of agriculture land, and economic structure have played powerful roles in China’s urban expansion. Another empirical study also suggested that these variables are associated with levels of urban fragmentation [29]. However, quantitative exploration of drivers of urban form metrics (e.g., population density, contiguity index, fractal dimension index, and shape index) has remained scarce. It could be assumed that factors determining urban sizes in past studies may be associated with these spatial metrics.

3. Data and Methodology

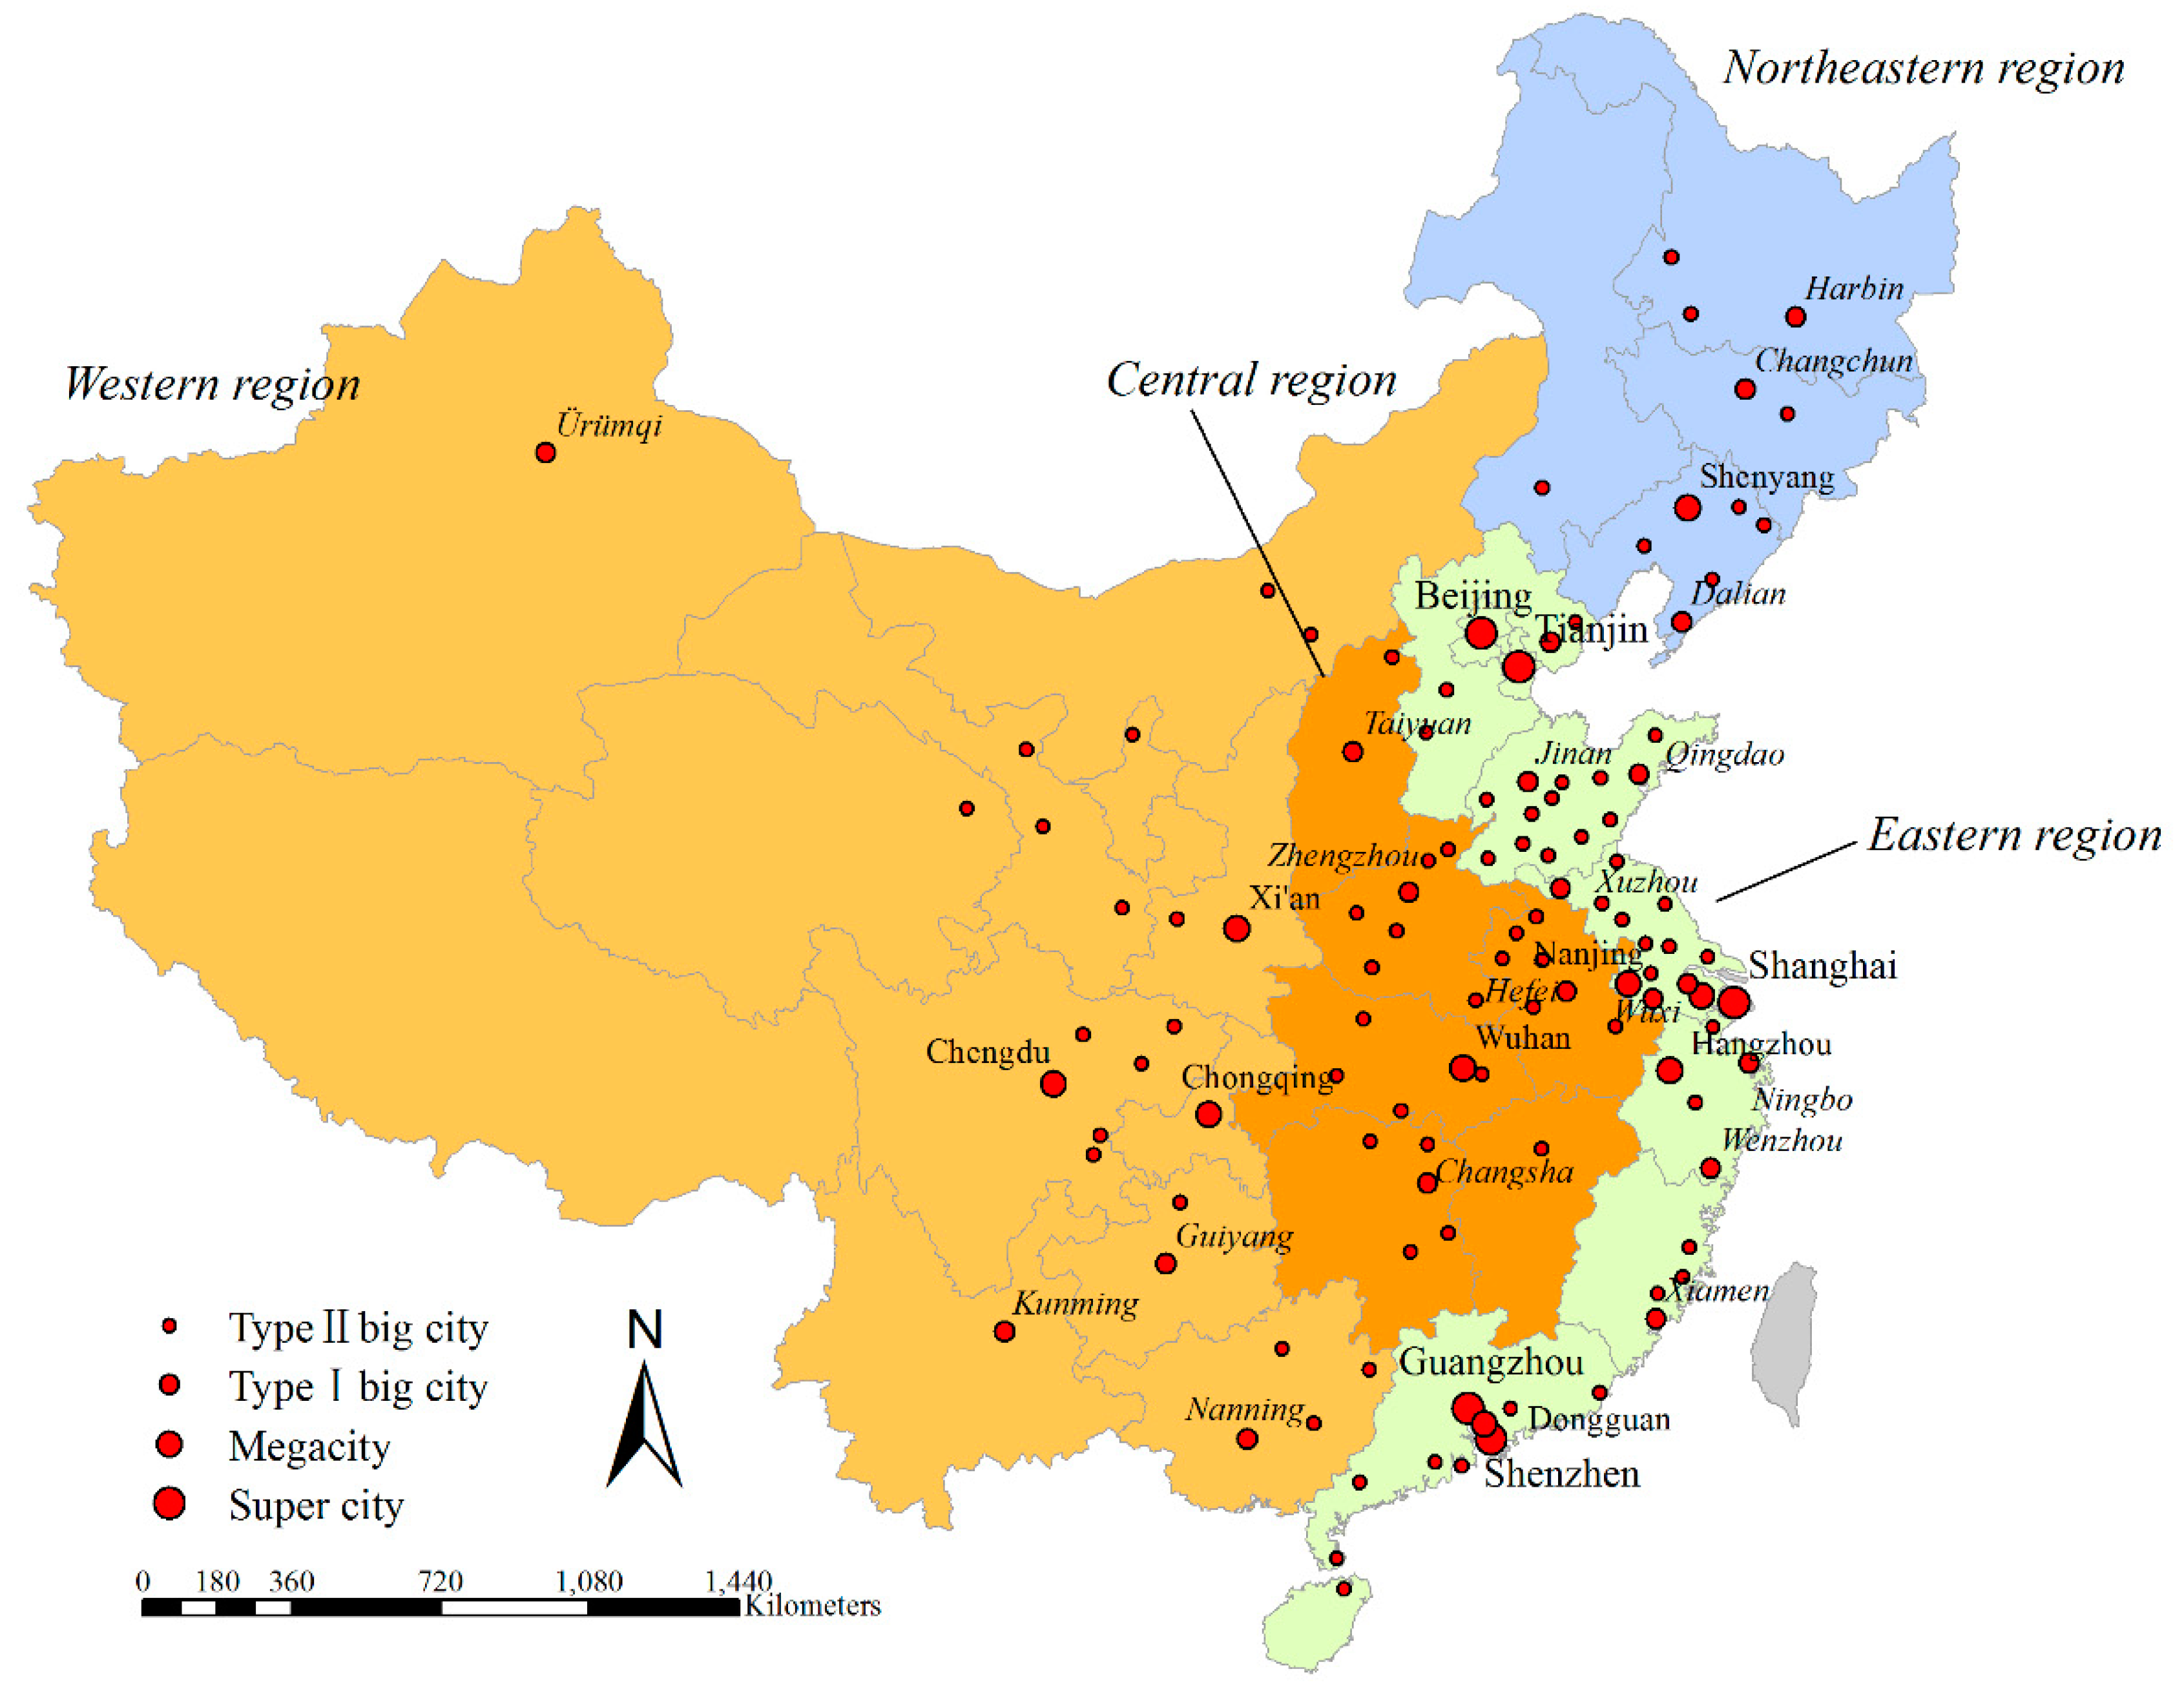
3.1. Study Area and Data

This study selected 115 cities at the prefecture level and above with urban populations greater than 1 million (according to the Sixth National Population Census in 2010) (Figure 1). The sample includes 4 autonomous municipalities, 26 provincial capitals, and 85 prefecture-level cities. According to the latest standard for urban size developed by the State Council of China in 2014, these cities are classified into four types based on urban populations: 5 “super cities” (populations > 10 million), 9 “megacities” (populations between 5 and 10 million), 20 Type I large cities (populations between 3 and 5 million), and 81 Type II large cities (population between 1 and 3 million). These cities are located in different economic regions, with 52 in the eastern region, 12 in the northeastern region, 27 in the central region, and 24 in the western region.
Data used in this study include the 2010 nighttime light data from the Defense Meteorological Satellite Program’s Operational Linescan System (DMSP/OLS), urban expansion areas across the East Asia region between 2000 and 2010 produced by the University of Wisconsin [30], 2000 and 2010 population distribution data from the Landscan database, socio-economic data (GDP and structure of the economy) from the 2000 and 2010 China City Statistical Yearbooks, topographic data (elevation and slopes, 1 km resolution) from the China Digital Elevation Model Database in Cold and Arid Regions Sciences Data Center, and data of water bodies (e.g., rivers, canals, and lakes) from the DIVA-GIS website (http://www.diva-gis.org/gdata).
Prior studies often utilized DMSP/OLS nighttime light data to delineate urban built-up boundaries [31]; therefore, we used 2010 DMSP/OLS nighttime light data, which has been validated by Jiang [32], to delineate urban built-up boundaries for the 115 cities. These boundaries were used to derive the spatial patterns of urban land and population distribution. Data of urban land in 2000 and 2010 are from satellite-based maps of urban expansion (250 m resolution) provided by the World Bank [30]. These maps were produced with MODIS data and Google Earth imagery, with map accuracies reaching 83% for urban extent and 71% for urban expansion [33]. Figure 2 provides examples of urban built-up boundaries and urban land for several cities.

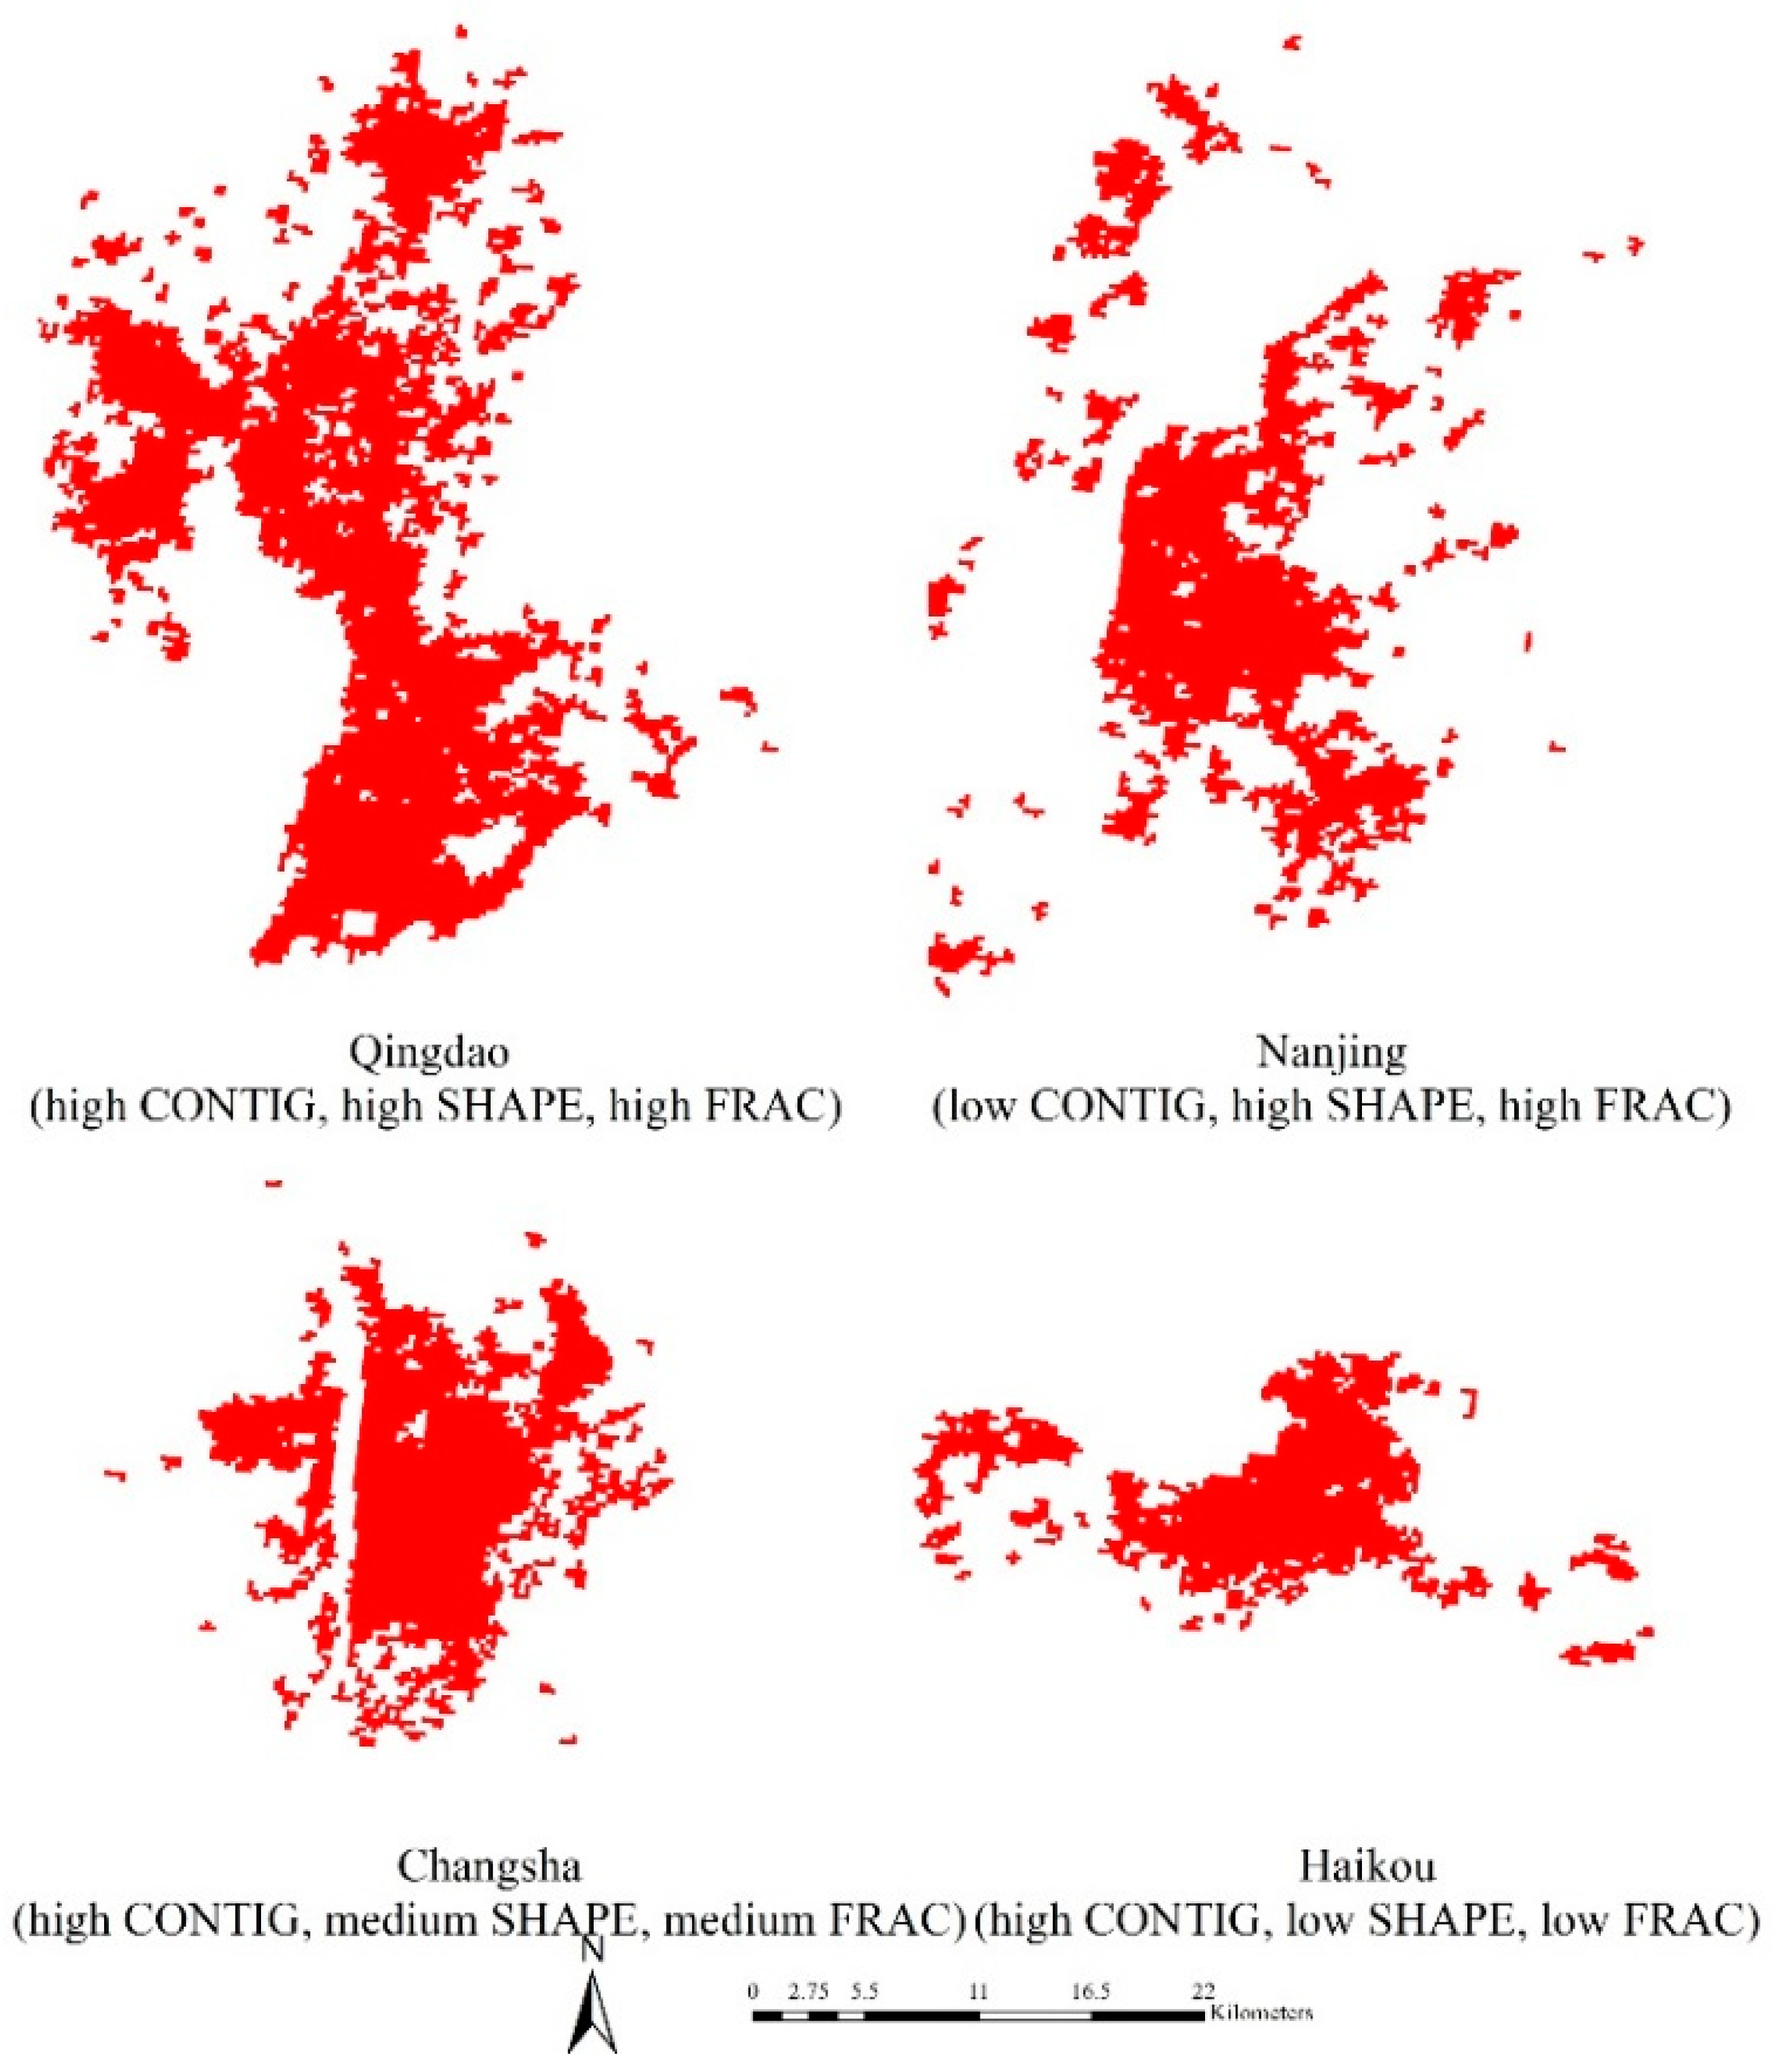
3.2. Urban Form Metrics

According to previous studies, population density, contiguity index, fractal dimension index, and shape index are usually used to quantify urban form, and data for these metrics are available at a national scale. Hence, the four metrics are selected to reflect different dimensions of urban form, namely density, spatially continuous level, shape irregularity, and spatial complexity.
Rather than using census-defined boundaries, we utilized urban built-up areas to calculate the population density, and population data are from LandScan Population Database (ORNL) with 1 km resolution. The contiguity index (CONTIG) is used to characterize the spatially continuous level of urban lands, and discontinuous urban growth, such as leapfrog development, may fragment farmland and wildlife habitat [34]. The lowest CONTIG value equals 0 for a most discontinuous urban form and increases to a limit of 1 as urban contiguity increases. The shape index (SHAPE) represents the shape irregularity of urban lands, and irregular boundaries among suburban areas are expected to increase automotive trips, tailpipe emissions, and energy consumption [10,23]. The higher the SHAPE value, the more irregular the urban form (value ranging from 0 to 100). The fractal dimension index (FRAC) evaluates the spatial complexity (value ranging from 1 to 2), and a higher value generally indicates that urban lands are more jagged [24]. We utilized Fragstats 4.2 to calculate CONTIG, SHAPE, and FRAC metrics for each city. Examples of urban form are shown in Figure 3.

3.3. Determinants

Four main factors, including economic growth, population, transportation costs, and economic structure, are assumed to be associated with urban form metrics in the following model:
U r b a n F o r m M e t r i c i t = a 1 G D P i t + a 2 P o p u l a i t i o n i t + a 3 B u s i t + a 4 G D P 2 S h a r e i t + a 5 G D P 3 S h a r e i t + a 6 U r b a n A r e a i t + a 7 E l e v a t i o n i + a 8 S l o p e i + a 9 WaterShare i + b
The variable UrbanFormMetricit is one of the three metrics of urban form (CONTIG, SHAPE, and FRAC) for the ith city in the year t (2000 or 2010). The explanatory variables are as followings. Gross Domestic Production (GDPit) is the indicator for economic development, and Populationit is calculated from LandScan data within the urban land boundaries. Because there is no direct way to measure commuting cost across Chinese cities over time, we included the number of buses per 10,000 people (Busit) to represent transportation costs. The underlying assumption is that an increase in buses makes travel more convenient and cheap, thus enabling people to live in cheaper housing further from downtowns while paying lower commuting costs. The change of economic structure has an impact on urbanization in developing countries [35], so it was included in our model. GDP2Shareit represents the share of the industrial sector in local GDPs, and GDP3Shareit represents the share of the service sector in local GDPs. Urban land area (UrbanAreait) is also included to control for the impact of urban expansion on urban form at different sizes and scales. All of the above variables vary over time from 2000 to 2010. To make administrative regions consistent within urban built-up areas, we used the value of GDPit, Busit, GDP2Shareit, and GDP3Shareit in urban districts for each of the 115 cities in the China City Statistical Yearbooks, thus excluding data from counties and county-level cities also governed by the 115 cities. Because high agricultural rents may hinder urban expansion [28], prior studies on the econometric model often account for the value of agricultural land. We initially attempted to use the share of the primary sector in the GDP as a proxy for agricultural land rent because data on agricultural rent during our sample time is unavailable. However, given its multicollinearity with GDP2Shareit and GDP3Shareit, this factor was not included in our final model.
Several topographic variables [29] are controlled in the model, and they did not vary over time. For each city, average elevation (Elevationi), average slope (Slopei), and ratio of water bodies (WaterSharei) within the urban built-up area were measured. Because these three variables can be correlated with difficulties related to constructing buildings and infrastructure, these factors provide a control for the ruggedness of each city’s terrain. Population density is not used as a dependent variable, for Populationit and UrbanAreait are independent variables in the regression models. Table 1 summarizes the list of variables.
It is possible that additional unobserved or unmeasured variables, which are correlated with urban form, are not included in the model. For example, urban form may be affected by historical and cultural differences between northern and southern China; the power of a political center may also impact urban expansion. When time-series data are available, a first-difference model may help to reduce the impacts of unmeasured factors [28]. Therefore, a first-difference model was also used in this paper, and six time-variant factors in Equation 1 were redefined by calculating the difference values between 2000 and 2010. The redefined model (Equation (2)) is as follows:
Δ U r b a n F o r m M e t r i c i = a 1 Δ G D P i + a 2 Δ P o p u l a i t i o n i + a 3 Δ B u s i + a 4 Δ G D P 2 S h a r e i + a 5 Δ G D P 3 S h a r e i + a 6 Δ U r b a n A r e a i + b

4. Results

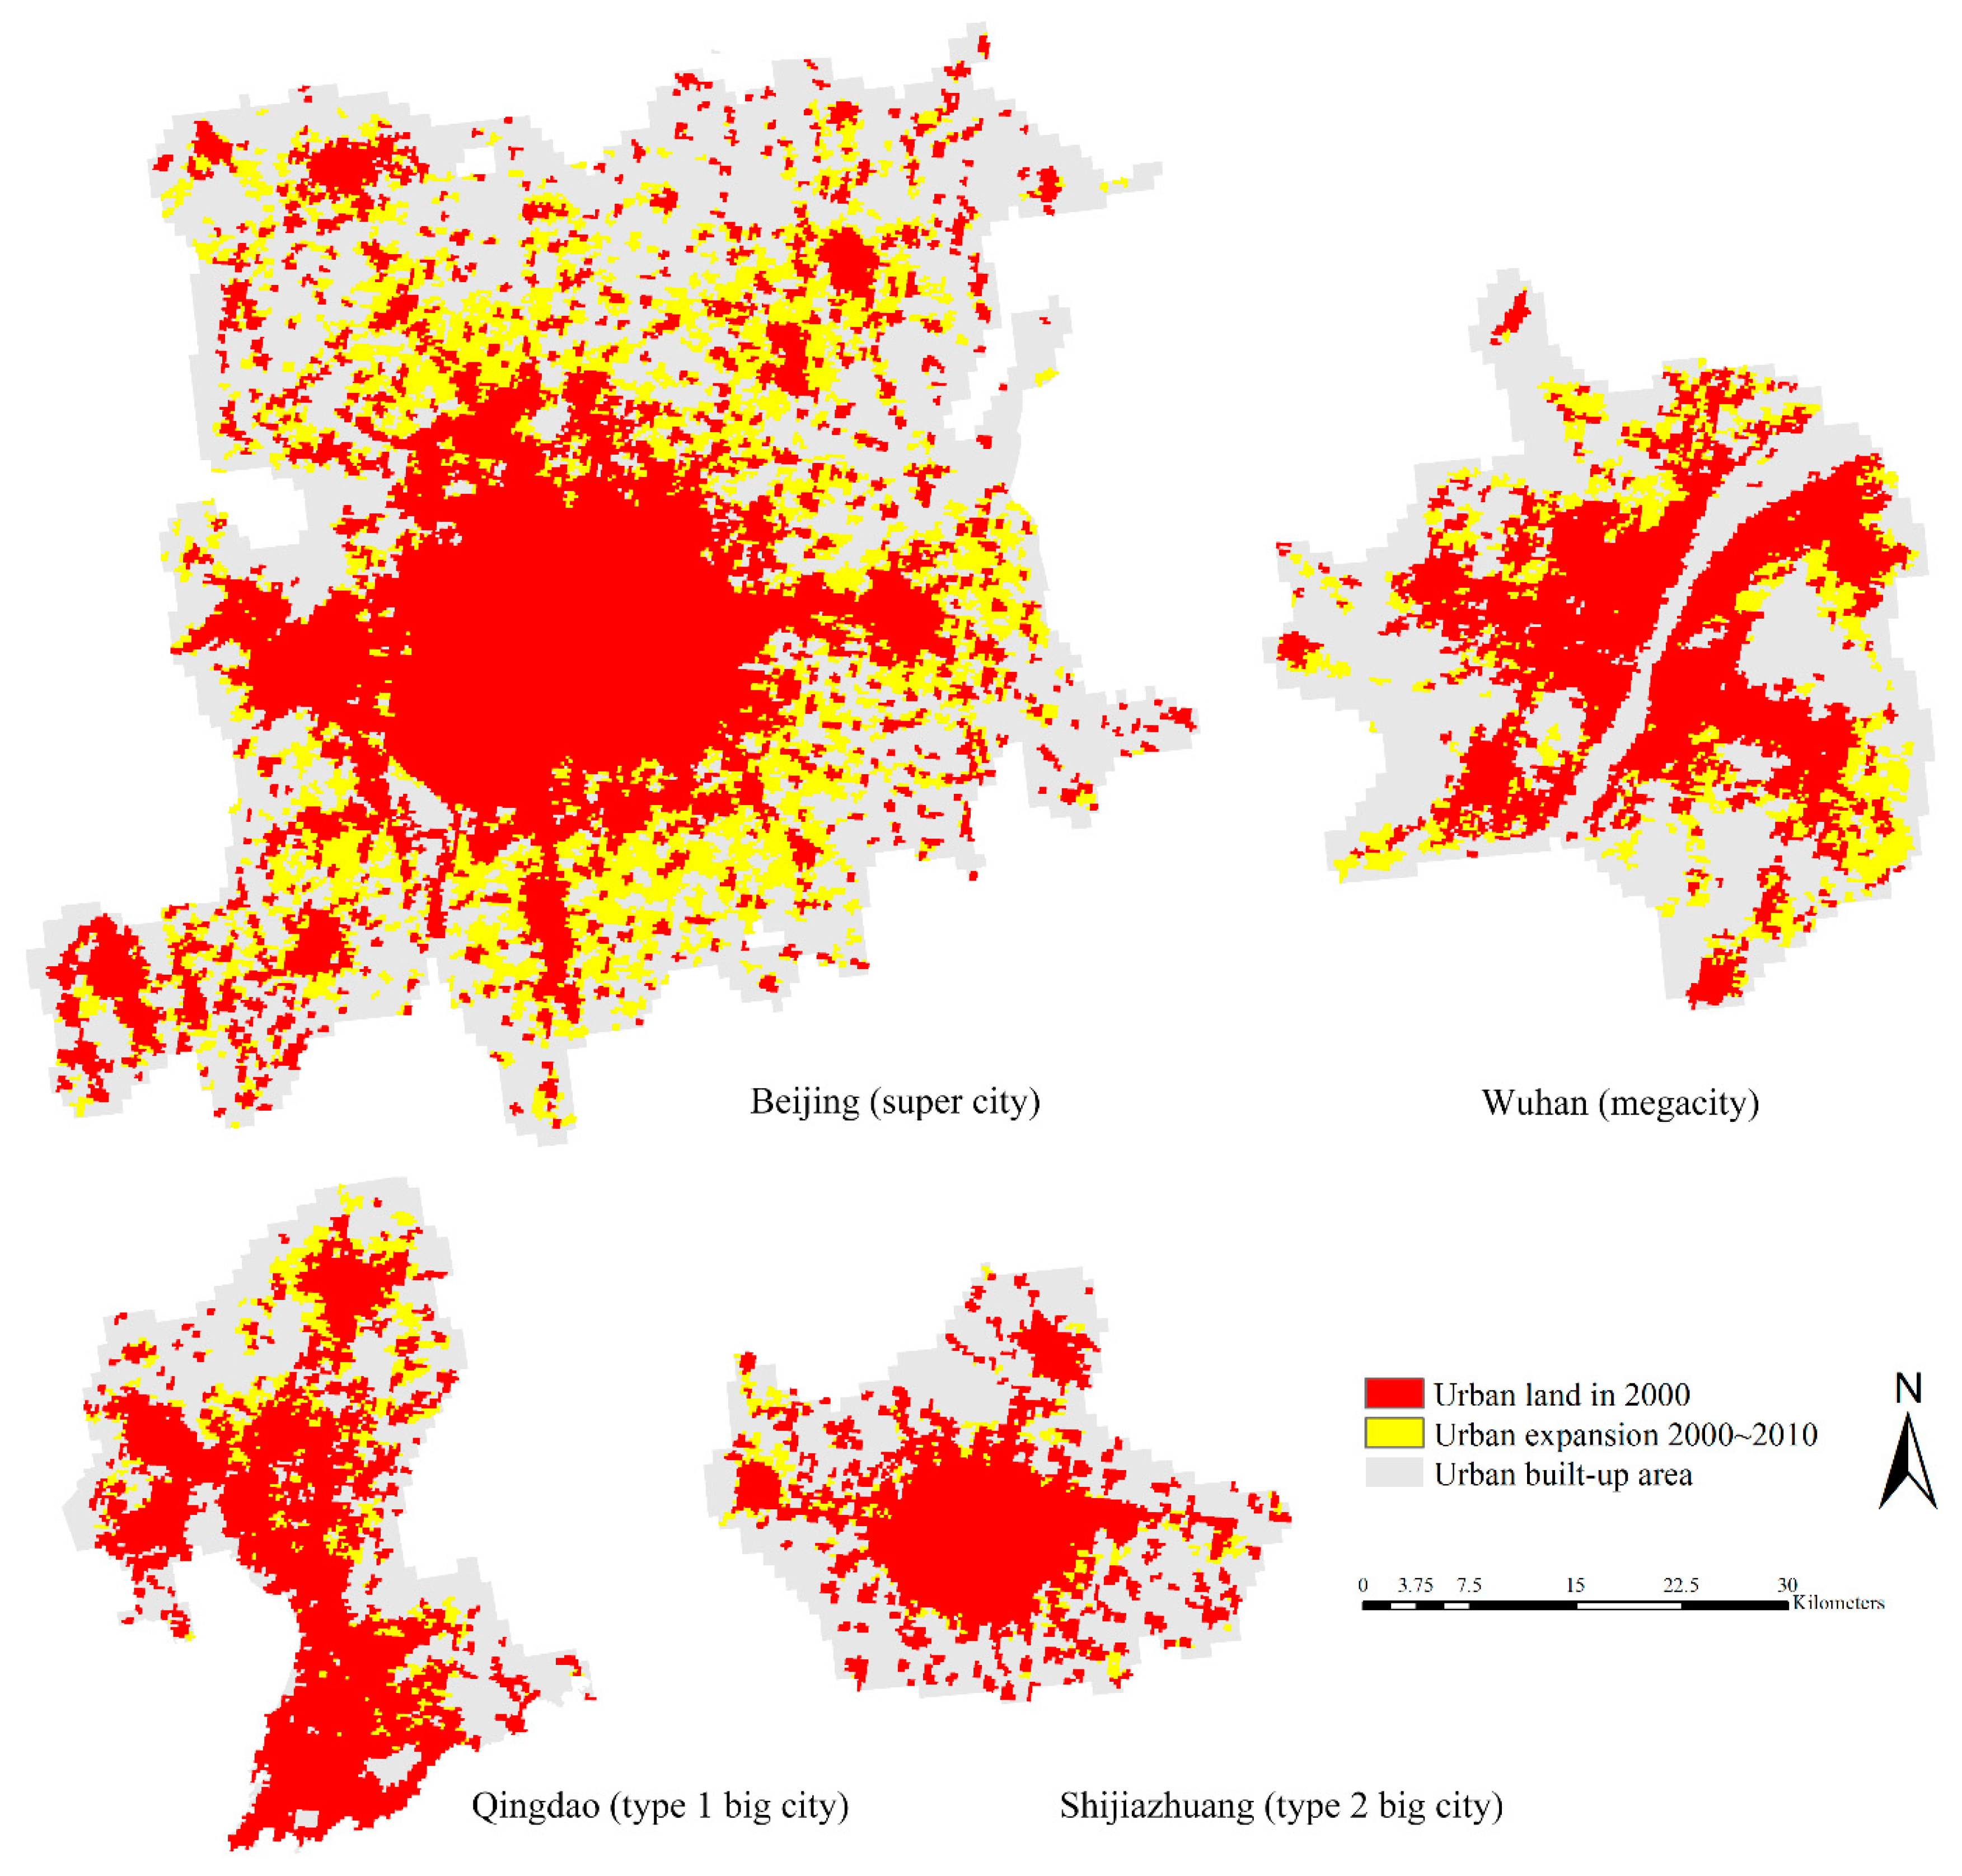
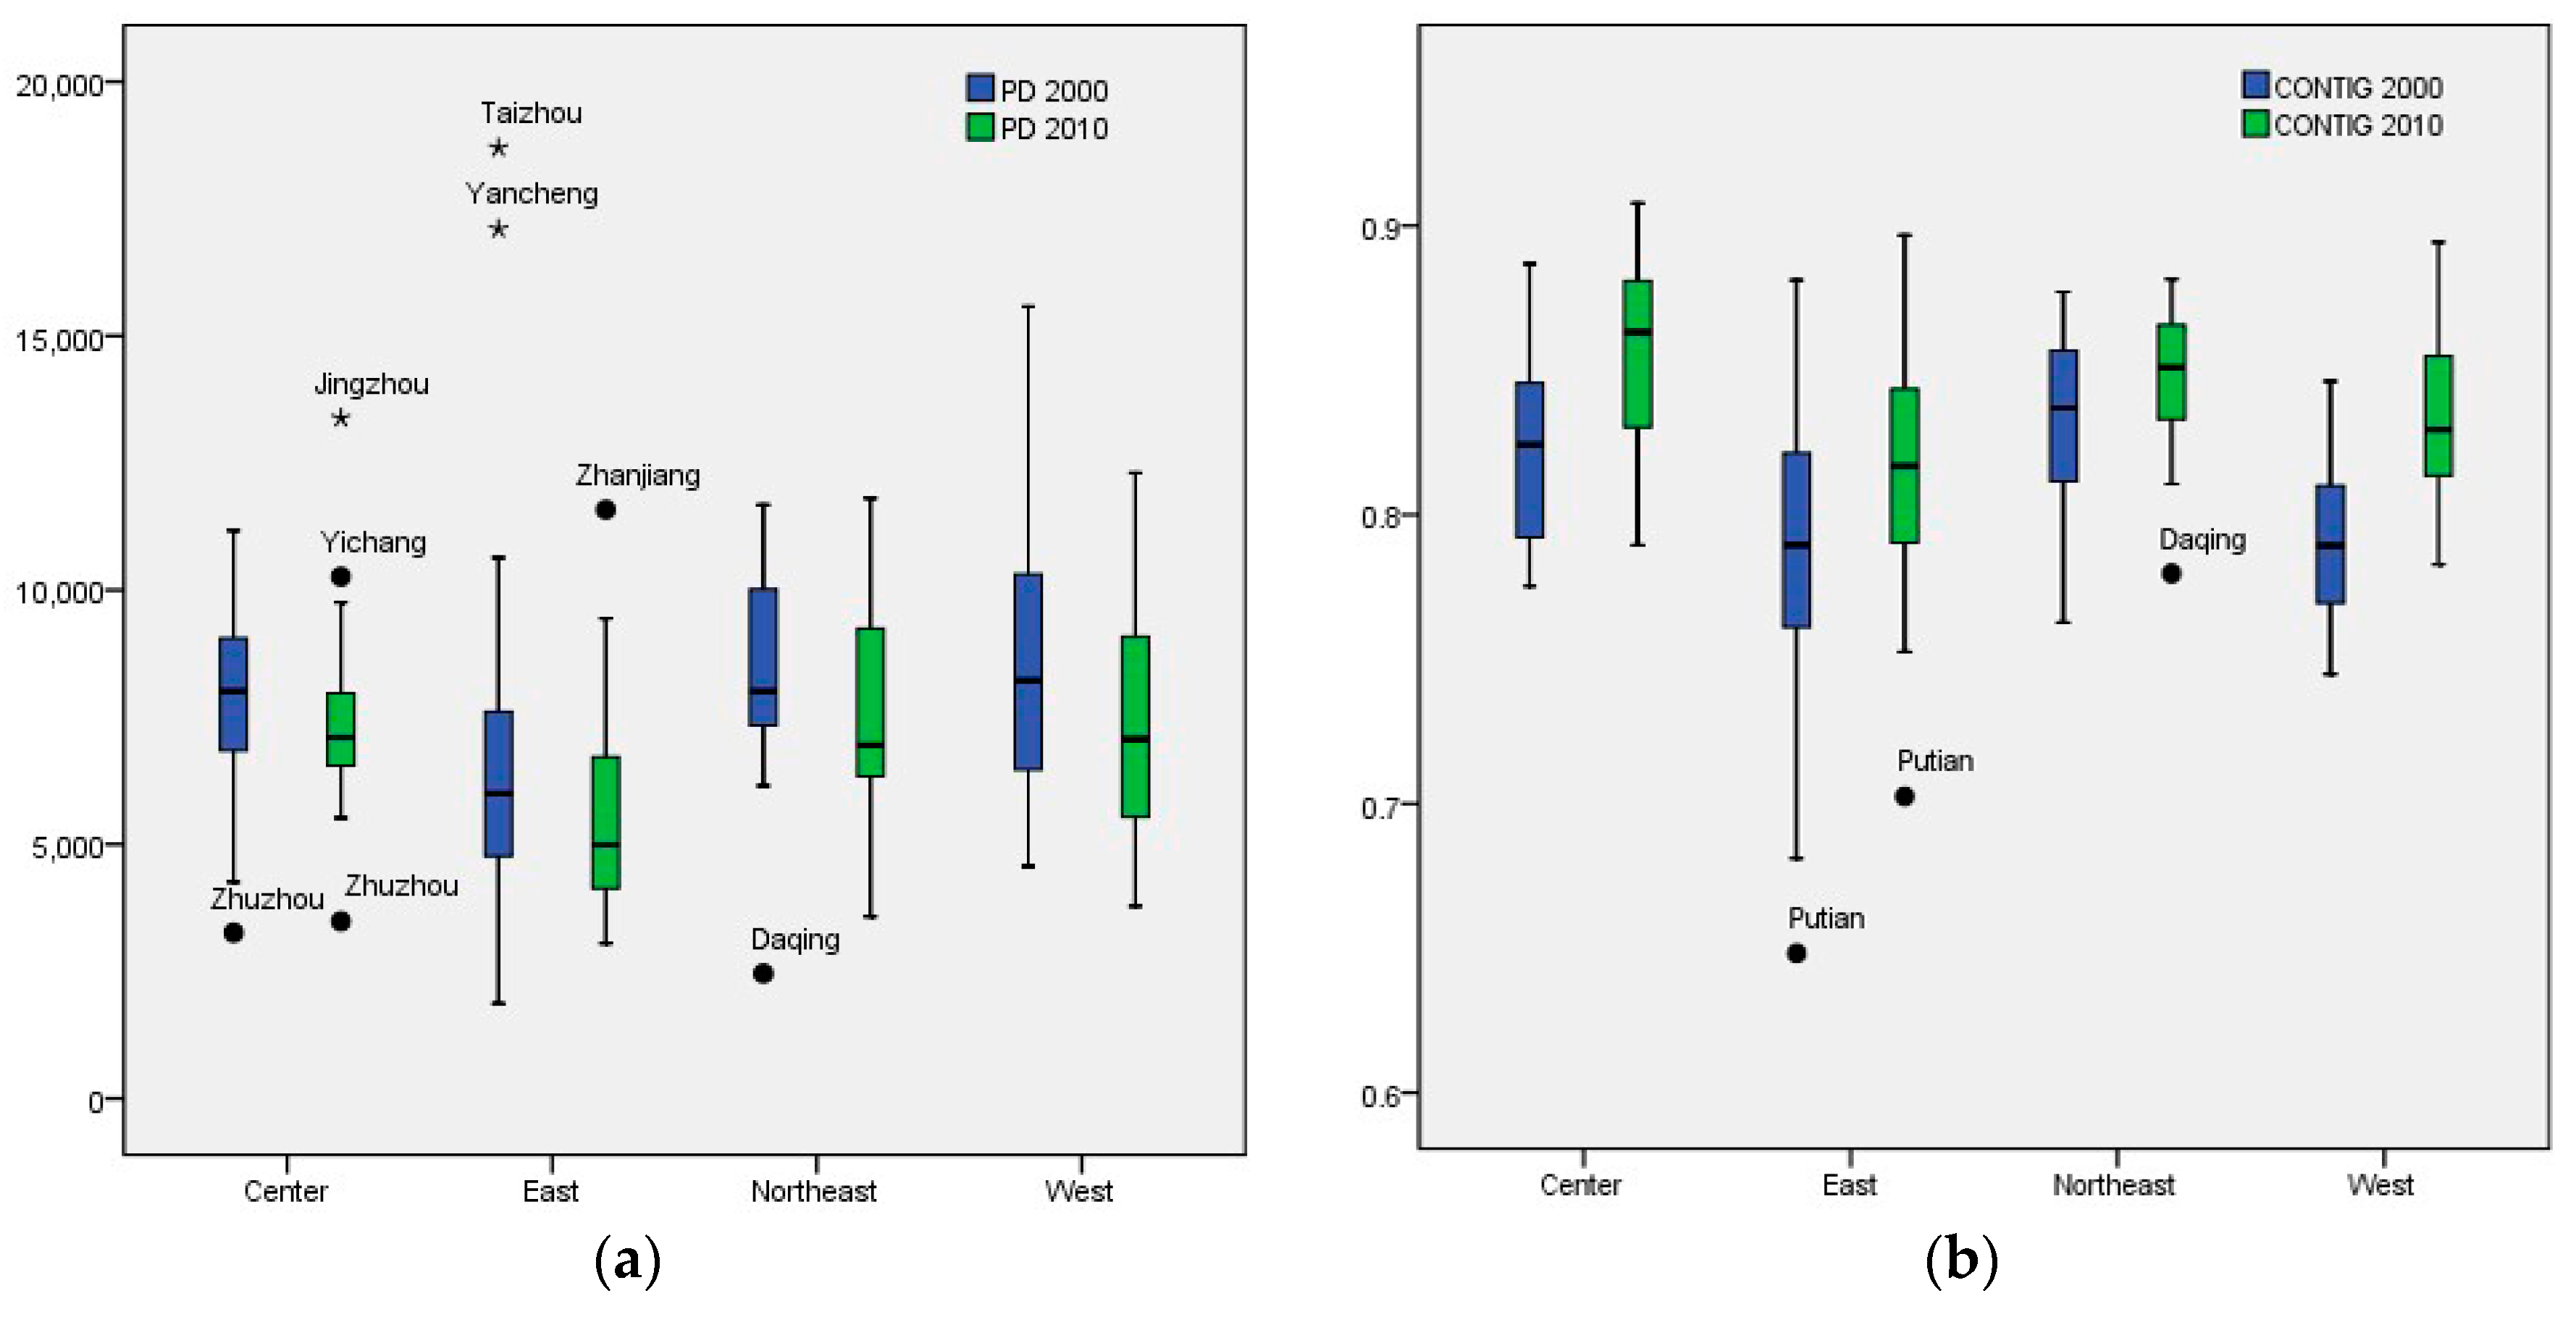
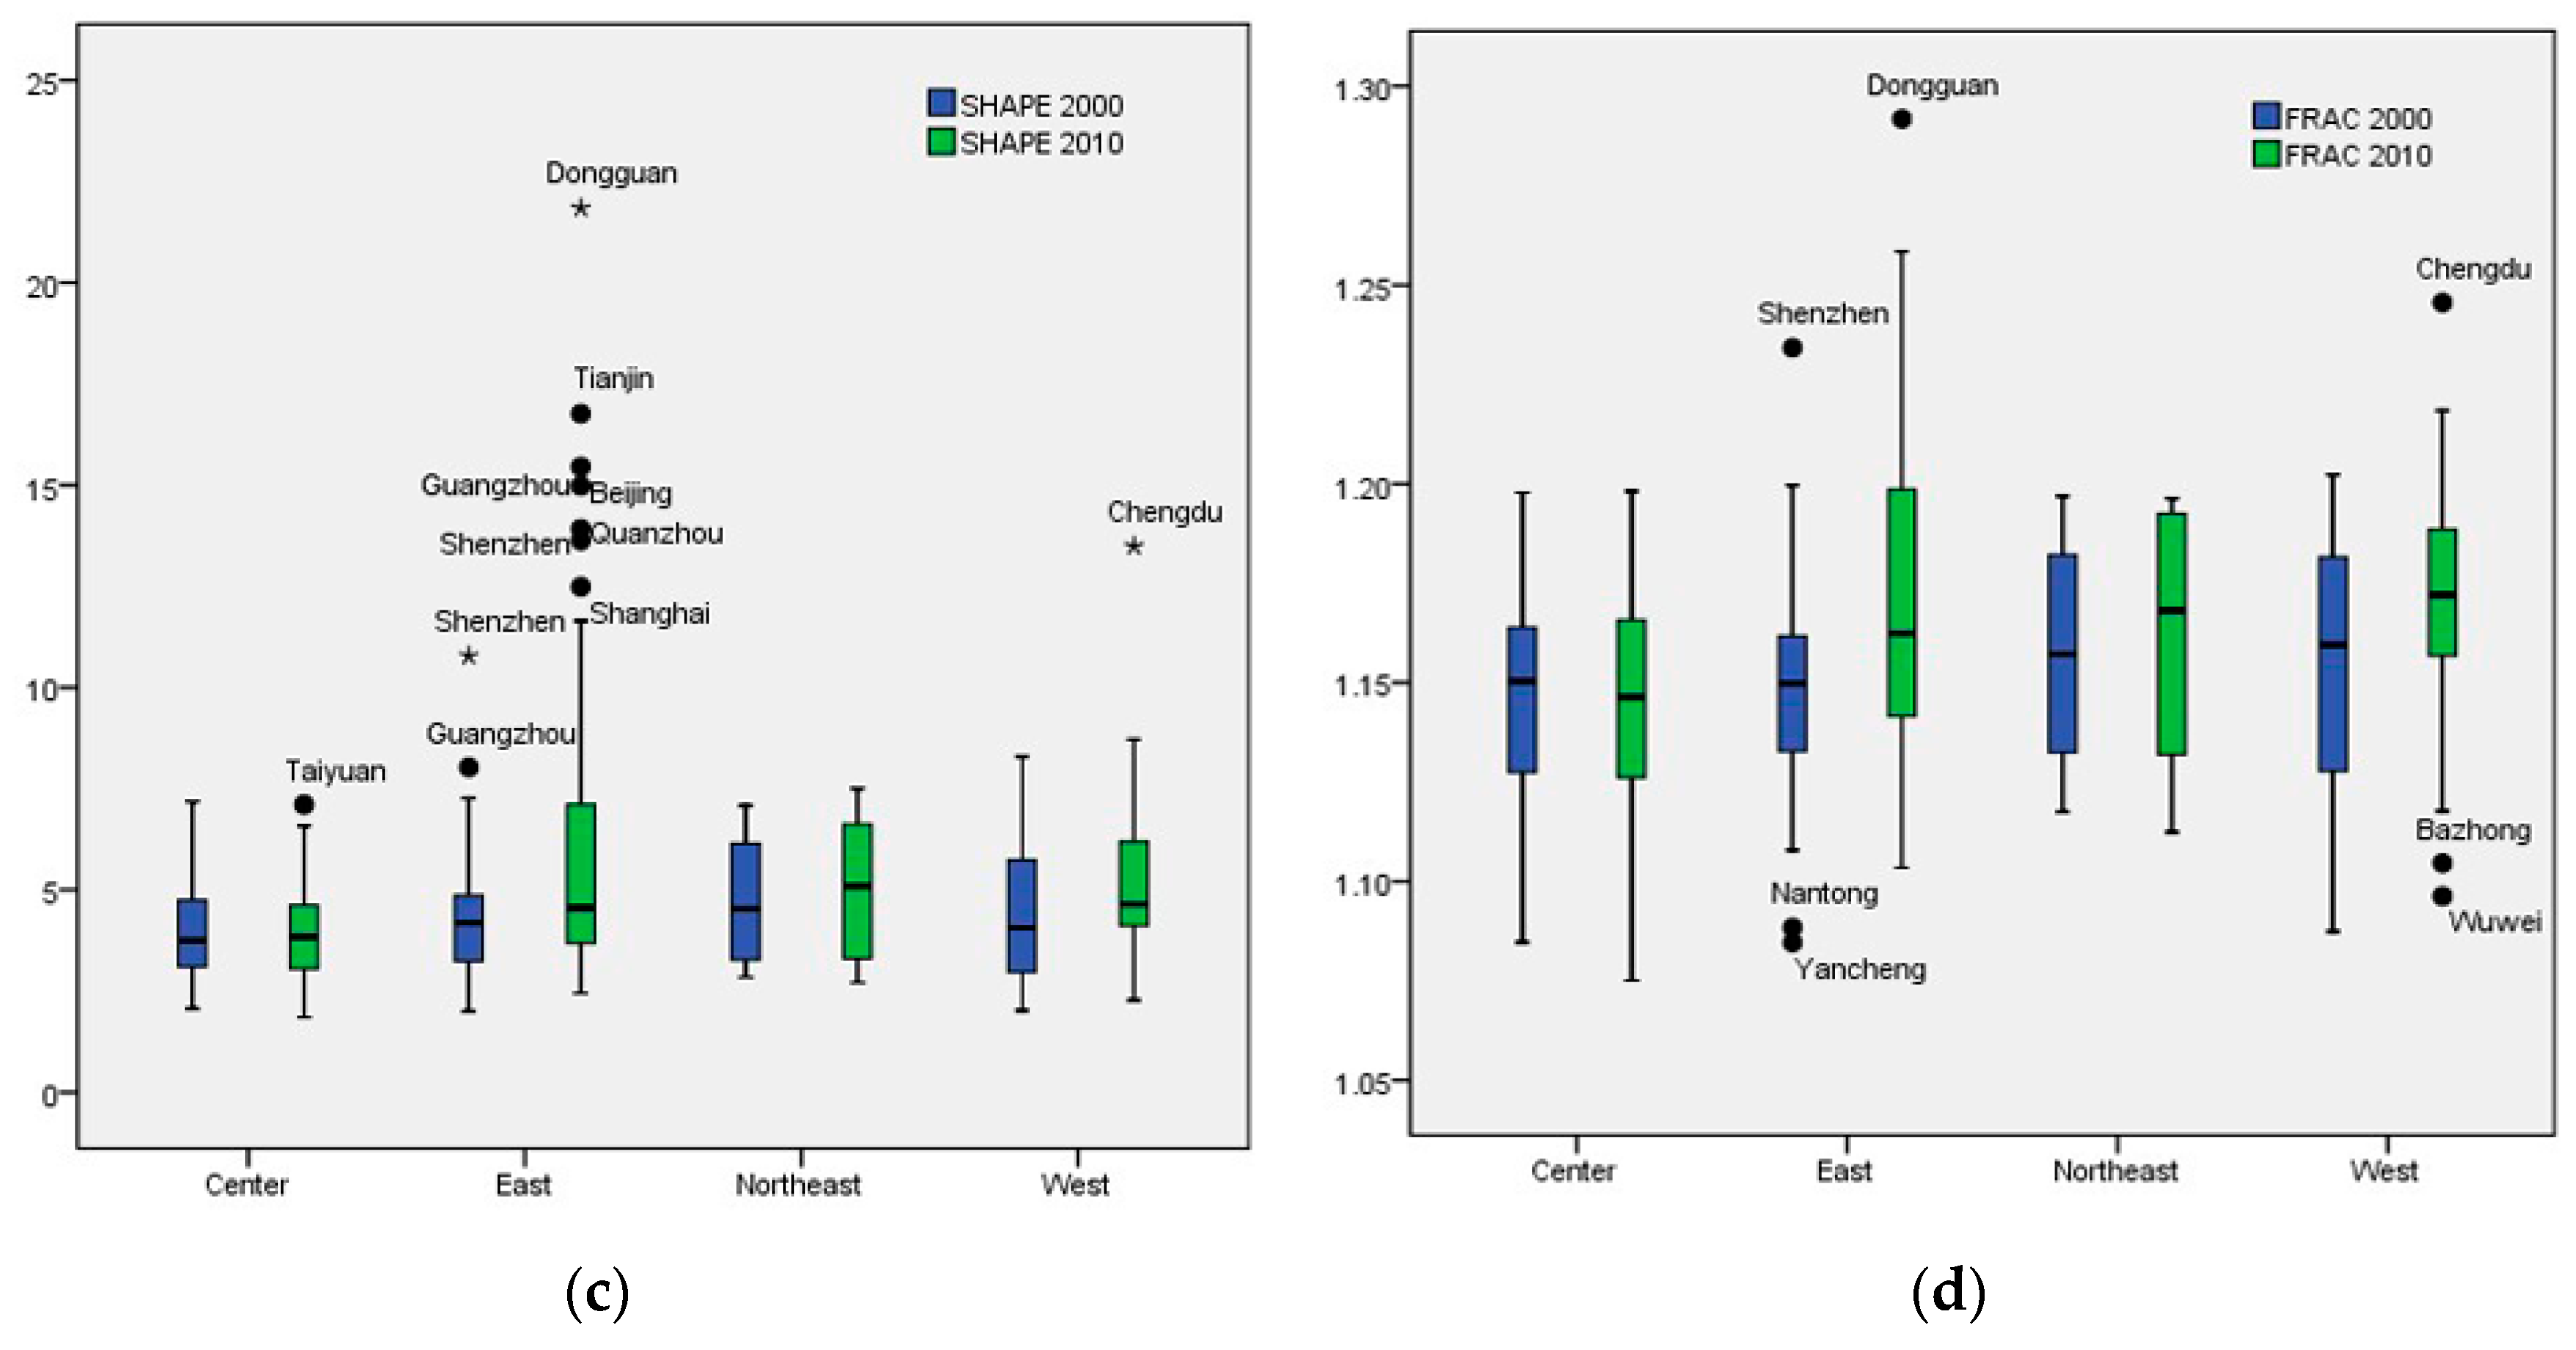
4.1. Comparison of Urban Form

Descriptive statistics for the measured variables are shown in Table 2. Comparison of urban form among different regions (Figure 4) show that urban form was different between the developed region (the eastern region) and developing regions (the western, central, and northeastern regions). Eastern cities showed the lowest population density in both 2000 and 2010, followed by central cities. The mean differences in population densities between the eastern region and other regions, except for the central region, grew from 2000 to 2010. Western cities exhibited the densest population in 2000, but they were surpassed by northeastern cities in 2010, although the difference was not significant. From the paired sample test (Table 3), we found that population density in 2000 was significantly different from 2010. Population density decreased in 70 cities (61%), whereas it increased in the other 45 cites (39%). The mean population density decreased by 11.73% from 2010, which resulted from the fast expansion of urban land when compared to the lower increase in urban populations. Population density decreased in 34 eastern cities (65%), 16 central cities (59%), 13 western cities (54%), and 7 northeastern cities (58%), which indicates that decreasing density was most prevalent in the eastern region.
In 2000, eastern cities had the lowest contiguity index value among the four regions. On one hand, the policy of opening up brings new economic and technological development zones to the eastern area, which may have resulted in leapfrog-style development patterns. On the other hand, the separation of dense water networks, such as lakes and rivers, may have decreased CONTIG values in the eastern region. The SHAPE and FRAC values show that eastern and western cities showed greater irregularity and complexity on average than central cities. This phenomenon was much more apparent in 2010, which exhibited larger mean differences and greater significance than in 2000. For example, although the SHAPE values for eastern cities were not significantly higher than western and northeastern cities in 2010, the outliers in Figure 4 (e.g., Dongguan, Tianjin, Beijing) had much higher values. As measured by SHAPE and FRAC values, cities in the central region were the most compact. From 2000 to 2010, the increase of SHAPE and FRAC values displayed a higher level of irregularity and complexity in the urban form of Chinese cities. Both SHAPE and FRAC values increased for 55 cities (48%), with more than half of the eastern cities (28 cities, 54%), 11 central cities (41%), 12 western cities (50%), and 4 northeastern cities (33%).
In general, cities in the eastern region exhibited the most complex and irregular shapes, the lowest population density, and the least continuous urban form. Western and northeastern cities showed moderate metrics for urban form when compared with results for the central region. Developed cities in the eastern region showed differences in urban form from cities in developing regions, which may have been due to the difference in urban expansion between the eastern region and the other regions. Export-led industrialization, foreign investment, and provincial-led infrastructure investment has made the eastern region a growth hub for urban development in China [36].
Comparing results for super cities, megacities, type I big cities, and type II big cities shows the association between urban form and city size (Figure 5). Super cities exhibited the lowest population density in 2000, even though they had the largest populations. From 2000 to 2010, urban sprawl was quite common in megacities, where the density decreased in 8 of 9 megacities. Most super cities (4 of 5) and type I big cities (11 of 20 cities) became more irregular and complex, whereas only 2 of 7 megacities followed this trend. Increases of CONTIG values show that urban form became more continuous than before. This may have been the result of new developments between urban cores and fringe areas [11]. The CONTIG values for 9 cities decreased, all of which were type II big cities. In 2010, the mean population densities of super cities and megacities were lower than those in type I and type II big cities. The boxplots for SHAPE and FRAC values show stair step-like shapes that increased with city size, and the value of these metrics for a high-level city was bigger than a low-level city. For example, the FRAC value for super cities was significantly higher than that of megacities, and the latter was significantly higher than that of type I big cities. In all, the results show that the level of complexity and irregularity increased as city sizes increased. During this period, many cities grew rapidly, along with the development of the urban economy and population [37]. Medium and large cities have accommodated most of the urban population growth, which makes super cities and megacities possible [38]. In addition, some big cities expanded their administrative areas by merging their suburban counties, thus accelerating urban sprawl.

4.2. Analysis of Determinants

As Table 4 and Table 5 shows, OLS models and first-difference models were highly significant in illustrating patterns of SHAPE and FRAC across Chinese cities, with adjusted R2 values ranging from 0.4 to 0.75. When comparing Table 4 and Table 5, we found that some coefficients of all-time varying variables of the first-difference model were different. Although eastern cities showed greater SHAPE and FRAC values than cities in other regions, regression results indicated that GDP exhibited a negative relationship with the levels of irregularity and complexity when holding other socio-economic factors constant. This issue is discussed in the next section. The association between population and SHAPE or FRAC values was not statistically significant in the OLS regression models, but the coefficient for SHAPE became significantly positive in the first-difference model. New towns or real estate developments in suburban areas may have caused the increasing values of SHAPE. The positive relationship between population and CONTIG values implies population expansion of urban infill developments, which may have decreased green lands and open spaces. The negative and statistically significant relationship between GDP and CONTIG reflected fragmented urban land patterns caused by the development of industrial parks far away from urban cores [39].
The variable accounting for the number of buses per 10,000 people, a proxy for transportation costs, was statistically significant with the expected sign for SHAPE and FRAC values. When bus networks are dense or well developed, the cost of transportation on travelling time and money (transfer fees) is low. Residents are able to work or live in places far away from the city center, which allows cities to expand more freely with irregular and complex shapes.
The share of the industrial sector, GDP2Share, was positive and significant on the FRAC value in 2010, which indicates that industrialization may have increased the complexity of urban form. Industrial parks or economic development zones played an important role in Chinese industrialization and its growing economy, and these industrial zones are often scattered on urban fringes and occupy large areas of land with low densities, making urban land fragmented and increasing the complexity of city shapes [40]. Likewise, increases to the service sector, GDP3Share, exhibited a positive and significant relationship with FRAC values in 2010. The urbanization level rose from 36% in 2000 to 50% in 2010, and the share of the tertiary industry increased from 39% to 43.2% (National Bureau of Statistics). The land development of service sectors on urban fringes (e.g., college towns, research centers, and logistic districts) may have increased the complexity of urban form [39]. The coefficient for the industrial sector variable was larger than that of the service sector variable; this could be because industrial growth required greater areas of land, leading to more complex urban form.
It may be somewhat surprising that the coefficients for topographic variables (Elevation, Slope, and WaterShare) were not significant. Most cities in our sample were located in plain areas with low mean values for slopes (0.72 degree), elevation (227 m), and ratio of water areas (3.62%), which may explain their insignificance in the models. Nevertheless, the signs of their coefficients were consistent with our expectation that increases in slope, elevation, and ratio of water areas made cities more complex and irregular.

5. Discussion

The results show that the expansion of the economy and population was associated with decreased population density and greater irregularity and complexity of urban lands in Chinese cities from 2000 to 2010. After the 1994 tax reform, local governments had to sell land through rapid urban expansion to meet their financial demands, and land economy had become a main driving force of urbanization in this period. Local governments were obsessed with irrational city construction of various forms, with decreasing population density [36]. Local governments often attracted large national or international companies with depressed industrial land price and tax relief, which was subsidized by soaring housing prices [41]. Land finance stimulated local governments to sell lands in newly-developed areas, and new towns and development zones had become a tool for land acquisition [36]. New towns and development zones with excessive land supplies not only caused decreasing population density and complexity of urban form, but also led to many problems, such as ghost cities and sleeping towns. China is estimated to increase in its urban population by nearly 300 million over the upcoming decades, and the urbanization level is projected to reach 76% by 2050 [42]. In the new era, the economic growth based on large-scale industrialization and real estate development is unsustainable. The transformation of national development goals in the new era calls for the transformation of the city development pattern, and Chinese cities have entered a new era of innovation-driven development. Economic growth guided by the five development concepts of innovation, coordination, green, openness, and sharing may help to shape sustainable urban form in Chinese cities. The Ministry of Natural Resources was established after the 19th CPC National Congress in 2018, and past urban planning for city growth will give way to resource management planning. There are still some limitations in this study. Only metrics like the shape index and the fractal dimension index were quantified, and metrics, such as polycentric structure, should be explored. National and local policies are not explicitly included in the model, and they may be responsible for unexplained residuals.

6. Conclusions

This paper analyzed urban form metrics, including population density, contiguity index, fractal dimension index, and shape index for 115 Chinese cities. Four spatial metrics were compared across cities in different economic zones and cities of different sizes. Population, economic growth, transportation costs, and economic structure were assumed to mainly determine urban form for Chinese cities, and OLS models and first-difference models were utilized to explore the associations between the factors and spatial metrics. Cities in the developed region appear to be the most discontinuous, complex, irregular, and least dense, and larger cities show a higher level of complexity and irregularity. By analyzing changes in urban form from 2000 to 2010, we found that urban sprawl continued to grow in most Chinese cities. On average, population densities were decreasing, and the shapes of cities were becoming more complex and irregular, but more continuous. GDP, population, transportation costs, and economical structure affected urban form in different ways, and land finance led to decreasing population density and complexity of urban form. City growth based on large-scale industrialization and real estate development would be weakened, and the innovation-driven development is required to make urban form more sustainable. Overall, this study presented a panoramic view on the urban form of Chinese cities from 2000–2010, and we contributed towards filling the research gap about the quantitative association between urban form and determinants.

Author Contributions

Methodology, Writing—original draft, M.Y.; Conceptualization, Writing—review & editing, Y.S.; Conceptualization, review & editing, L.G.

Funding

This research was funded by National Natural Science Foundation of China (grant: 51708234, 51678259).

Conflicts of Interest

The authors declare no conflict of interest.

References

  1. Clifton, K.; Ewing, R.; Knaap, G.J.; Song, Y. Quantitative analysis of urban form: A multidisciplinary review. J. Urban. 2008, 1, 17–45. [Google Scholar] [CrossRef]
  2. Bartholomew, K.; Ewing, R. Land use–transportation scenarios and future vehicle travel and land consumption: A meta-analysis. J. Am. Plan. Assoc. 2008, 75, 13–27. [Google Scholar] [CrossRef]
  3. Ewing, R.; Cervero, R. Travel and the built environment: A meta-analysis. J. Am. Plan. Assoc. 2010, 76, 265–294. [Google Scholar] [CrossRef]
  4. Brand, C.; Tran, M.; Anable, J. The UK transport carbon model: An integrated life cycle approach to explore low carbon futures. Energy Policy 2012, 41, 107–124. [Google Scholar] [CrossRef] [Green Version]
  5. Frank, L.D.; Sallis, J.F.; Conway, T.L.; Chapman, J.E.; Saelens, B.E.; Bachman, W. Many pathways from land use to health: Associations between neighborhood walkability and active transportation, body mass index, and air quality. J. Am. Plan. Assoc. 2006, 72, 75–87. [Google Scholar] [CrossRef]
  6. Loh, T.H. Understanding Urban Development and Water Quality through Scenarios; The University of North Carolina: Chapel Hill, NC, USA, 2012. [Google Scholar]
  7. McCarty, J.; Kaza, N. Urban form and air quality in the United States. Landsc. Urban Plan. 2015, 139, 168–179. [Google Scholar] [CrossRef]
  8. OECD. OECD Economic Surveys: China 2013; OECD Publishing: Paris, France, 2013. [Google Scholar]
  9. Chen, H.; Jia, B.; Lau, S.S. Sustainable urban form for Chinese compact cities: Challenges of a rapid urbanized economy. Habitat Int. 2008, 32, 28–40. [Google Scholar] [CrossRef]
  10. Chen, Y.; Li, X.; Zheng, Y.; Guan, Y.; Liu, X. Estimating the relationship between urban forms and energy consumption: A case study in the Pearl River Delta, 2005–2008. Landsc. Urban Plan. 2011, 102, 33–42. [Google Scholar] [CrossRef]
  11. Yang, J.; Shen, Q.; Shen, J.; He, C. Transport impacts of clustered development in Beijing: Compact development versus overconcentration. Urban Stud. 2012, 49, 1315–1331. [Google Scholar] [CrossRef]
  12. Yuan, M.; Song, Y.; Huang, Y.; Hong, S.; Huang, L. Exploring the Association between Urban Form and Air Quality in China. J. Plan. Educ. Res. 2017. [Google Scholar] [CrossRef]
  13. Churchman, A. Disentangling the concept of density. J. Plan. Lit. 1999, 13, 389–411. [Google Scholar] [CrossRef]
  14. Galster, G.; Hanson, R.; Ratcliffe, M.R.; Wolman, H.; Coleman, S.; Freihage, J. Wrestling sprawl to the ground: Defining and measuring an elusive concept. Hous. Policy Debate 2001, 12, 681–717. [Google Scholar] [CrossRef]
  15. Ewing, R.; Pendall, R.; Chen, D. Measuring Sprawl and Its Impact. Smart Growth Am. 2002, 57, 320–326. [Google Scholar]
  16. Song, Y.; Knaap, G.J. Measuring urban form: Is Portland winning the war on sprawl? J. Am. Plan. Assoc. 2004, 70, 210–225. [Google Scholar] [CrossRef]
  17. Zhong, C.; Arisona, S.M.; Huang, X.; Batty, M.; Schmitt, G. Detecting the dynamics of urban structure through spatial network analysis. Int. J. Geogr. Inf. Sci. 2014, 28, 2178–2199. [Google Scholar] [CrossRef]
  18. Gustafson, E.J. Quantifying landscape spatial pattern: What is the state of the art? Ecosystems 1998, 1, 143–156. [Google Scholar] [CrossRef]
  19. Turner, M.G.; Gardner, R.H.; O’neill, R.V. Landscape Ecology in Theory and Practice: Pattern and Process; Springer Science & Business Media: New York, NY, USA, 2001. [Google Scholar]
  20. Bereitschaft, B.; Debbage, K. Urban form, air pollution, and CO2 emissions in large US metropolitan areas. Prof. Geogr. 2013, 65, 612–635. [Google Scholar] [CrossRef]
  21. Bechle, M.J.; Millet, D.B.; Marshall, J.D. Effects of income and urban form on urban NO2: Global evidence from satellites. Environ. Sci. Technol. 2011, 45, 4914–4919. [Google Scholar] [CrossRef] [PubMed]
  22. Clark, L.P.; Millet, D.B.; Marshall, J.D. Air quality and urban form in US urban areas: Evidence from regulatory monitors. Environ. Sci. Technol. 2011, 45, 7028–7035. [Google Scholar] [CrossRef] [PubMed]
  23. Ou, J.; Liu, X.; Li, X.; Chen, Y. Quantifying the relationship between urban forms and carbon emissions using panel data analysis. Landsc. Ecol. 2013, 28, 1889–1907. [Google Scholar] [CrossRef]
  24. Wang, X.S.; Liu, J.Y.; Zhuang, D.F.; Wang, L. Spatial-temporal Changes of Urban Spatial Morphology in China. Acta Geogr. Sin. 2005, 60, 392–400. [Google Scholar]
  25. Brueckner, J.K. Urban sprawl: Diagnosis and remedies. Int. Reg. Sci. Rev. 2000, 23, 160–171. [Google Scholar] [CrossRef]
  26. Song, Y.; Zenou, Y. Property tax and urban sprawl: Theory and implications for US cities. J. Urban Econ. 2006, 60, 519–534. [Google Scholar] [CrossRef] [Green Version]
  27. Ke, S.; Song, Y.; He, M. Determinants of urban spatial scale: Chinese cities in transition. Urban Stud. 2009, 46, 2795–2813. [Google Scholar] [CrossRef]
  28. Deng, X.; Huang, J.; Rozelle, S.; Uchida, E. Growth, population and industrialization, and urban land expansion of China. J. Urban Econ. 2008, 63, 96–115. [Google Scholar] [CrossRef]
  29. Oueslati, W.; Alvanides, S.; Garrod, G. Determinants of urban sprawl in European cities. Urban Stud. 2015, 52, 1594–1614. [Google Scholar] [CrossRef] [PubMed] [Green Version]
  30. Schneider, A.; Mertes, C.M.; Tatem, A.J.; Tan, B.; Sulla-Menashe, D.; Graves, S.J.; Patel, N.N.; Horton, J.A.; Gaughan, A.E.; Rollo, J.T.; et al. A new urban landscape in East–Southeast Asia, 2000–2010. Environ. Res. Lett. 2015, 10, 034002. [Google Scholar] [CrossRef] [Green Version]
  31. Sutton, P.C.; Goetz, A.R.; Fildes, S.; Forster, C.; Ghosh, T. Darkness on the edge of town: Mapping urban and peri-urban Australia using nighttime satellite imagery. Prof. Geogr. 2010, 62, 119–133. [Google Scholar] [CrossRef]
  32. Jiang, B. Head/tail breaks for visualization of city structure and dynamics. Cities 2015, 43, 69–77. [Google Scholar] [CrossRef] [Green Version]
  33. Mertes, C.M.; Schneider, A.; Sulla-Menashe, D.; Tatem, A.J.; Tan, B. Detecting change in urban areas at continental scales with MODIS data. Remote. Sens. Environ. 2015, 158, 331–347. [Google Scholar] [CrossRef] [Green Version]
  34. Randolph, J. Environmental land use planning and management. Environ. Land Use Plan. Manag. 2004, 24, 172–185. [Google Scholar]
  35. Seto, K.C.; Kaufmann, R.K. Modeling the drivers of urban land use change in the Pearl River Delta, China: Integrating remote sensing with socioeconomic data. Land Econ. 2003, 79, 106–121. [Google Scholar] [CrossRef]
  36. Gu, C.; Hu, L.; Cook, I.G. China’s urbanization in 1949–2015: Processes and driving forces. Chin. Geogr. Sci. 2017, 27, 847–859. [Google Scholar] [CrossRef]
  37. Wu, F. Globalization and the Chinese City; Routledge: London, UK, 2006. [Google Scholar]
  38. Gu, C.; Han, S. Climate change and China’s mega urban regions. Front. Arch. Civ. Eng. China 2010, 4, 418–430. [Google Scholar] [CrossRef]
  39. Jiating, W.; Juntao, Z. Measurement on the urban spreading in China: Empirical study based on the panel data of 35 large and middle cities. Economist 2010, 10, 56–63. [Google Scholar]
  40. Chengri, D. Growth, Structure, and Efficiency: Assessment of Spatial Development Patterns in Chinese Cities. Planners 2009, 24, 35–39. [Google Scholar]
  41. Zhao, Y. Urbanization 2.0 and Transition of Planning: Explanation based on a Two-Phase Model. City Plan. Rev. 2017, 41, 85–93. [Google Scholar]
  42. Heilig, G.K. (Ed.) World Urbanization Prospects: The 2014 Revision; United Nations, Department of Economic and Social Affairs (DESA), Population Division, Population Estimates and Projections Section: New York, NY, USA, 2014. [Google Scholar]
Figure 1. The 115 cities included in the study.
Sustainability 10 03648 g001
Figure 2. Examples of urban built-up areas and urban expansion in 2000 and 2010.
Sustainability 10 03648 g002
Figure 3. Examples of urban form metrics in 2010.
Sustainability 10 03648 g003
Figure 4. Comparison of metrics across four economic regions: (a) PD, (b) CONTIG, (c) SHAPE, and (d) FRAC.
Sustainability 10 03648 g004aSustainability 10 03648 g004b
Figure 5. Comparison of metrics among cities of various sizes: (a) PD, (b) CONTIG, (c) SHAPE, and (d) FRAC.
Sustainability 10 03648 g005
Table 1. Description and Data source of variables.
VariablesDescriptionData SourceUnit
PDRatio of population to area (km2)2000/2010 LandScan population dataPersons/km2
CONTIGAverage contiguity value minus 1, divided by the sum of the template values minus 1Urban expansion data between 2000 and 2010 from WorldBank
SHAPEPatch perimeter divided by the square root of patch area, adjusted by a constant to adjust for a square standard
FRACTwo times the logarithm of patch perimeter divided by the logarithm of patch area
GDPGross Domestic ProductionChina City Statistical Yearbook 2000 and 201010,000 yuan
PopulationPopulation 2000/2010 LandScan population dataPersons
BusNumber of buses per 10,000 peopleChina City Statistic Yearbook 2000 and 2010Vehicles
GDP2ShareShare of industrial sector in GDP%
GDP3ShareShare of service sector in GDP%
UrbanAreaArea of urban landUrban expansion data between 2000 and 2010 from WorldBankkm2
ElevationAverage elevation in the urban built-up areaCold and Arid Regions Sciences Data Centerm
SlopeAverage slope in the urban built-up areaDegree
WaterShareRatio of inland water to overall urban built-up areaDIVA-GIS%
Table 2. Descriptive statistics for the measured variables.
Variables (Year)MinimumMaximumMeanStd. DeviationN
PD (2000)187018,7007460 2991 115
PD (2010)305013,3846586 2198 115
CONTIG (2000)0.65 0.89 0.80 0.04 115
CONTIG (2010)0.70 0.91 0.83 0.04 115
SHAPE (2000)2.00 10.78 4.29 1.57 115
SHAPE (2010)1.85 21.85 5.51 3.31 115
FRAC (2000)1.08 1.23 1.15 0.03 115
FRAC (2010)1.08 1.29 1.17 0.04 115
GDP (2000)199,586 40,986,400 3,354,693 5,270,149 113
GDP (2010)1,054,562 169,715,503 17,151,345 25,420,000 115
Population (2000)74,12010,336,9321,173,041 1,487,203 115
Population (2010)93,23113,489,3551,638,764 2,010,851 115
Bus (2000)0.36 91.97 7.31 9.00 112
Bus (2010)0.43 103.11 9.60 10.20 115
GDP2Share (2000)15.90 92.30 49.46 10.65 113
GDP2Share (2010)19.61 85.45 51.15 10.69 115
GDP3Share (2000)7.30 71.70 43.48 9.37 113
GDP3Share (2010)14.01 78.66 43.87 11.20 115
UrbanArea (2000)11.56 1419.00 174.45 204.96 115
UrbanArea (2010)12.00 2159.25 270.61 343.12 115
Elevation2.00 2328.00 227.35 424.80 115
Slope0.03 4.12 0.72 0.73 115
WaterShare0.00 27.67 3.62 5.37 115
Note: Hezhou, Guangxi and Wuwei, Gansu became prefecture cities in 2002 and 2000, so there is no statistical data for these two cities in 2000. There is no data for buses per 10,000 people for Bazhong, Sichuan from 2000.
Table 3. Paired sample test between 2000 and 2010.
MetricMeanS.D.tSig.Smallest FiveLargest Five
PD−875 2421 −3.874 0.000 Taizhou, Yancheng, Tianshui, Zigong, WuweiJingzhou, Shenzhen, Zhuhai, Dongguan, Wenzhou
CONTIG0.033 0.026 13.678 0.000 Yangzhou, Zhuzhou, Jiaxing, Taizhou, QiqiharDongguan, Changde, Ningbo, Kunming, Changsha
SHAPE1.213 2.402 5.413 0.000 Yueyang, Wuhan, Changsha, Nanyang, HaikouDongguan, Tianjin, Beijing, Suzhou, Quanzhou
FRAC0.015 0.027 6.219 0.000 Yueyang, Nanyang, Changsha, Haikou, EzhouDongguan, Suzhou, Ningbo, Hangzhou, Beijing
Table 4. Standardized B coefficients of the OLS model in 2000 and 2010.
VariableCONTIGSHAPEFRAC
200020102000201020002010
GDP−0.493 −0.326 −0.374 −0.670 −0.407 −0.626
(0.067)(0.352)(0.034)(0.000)(0.063)(0.006)
Population1.249 1.191 0.282 −0.112 0.331 0.091
(0.000)(0.006)(0.197)(0.613)(0.224)(0.738)
Bus0.242 0.050 0.395 0.198 0.318 0.174
(0.055)(0.647)(0.000)(0.001)(0.002)(0.015)
GDP2Share−0.174 −0.051 0.058 0.076 0.122 0.451
(0.219)(0.810)(0.529)(0.494)(0.288)(0.001)
GDP3Share−0.141 0.168 0.106 −0.051 0.163 0.354
(0.365)(0.489)(0.299)(0.686)(0.201)(0.025)
UrbanArea−0.869 −0.974 0.618 1.550 0.467 1.138
(0.000)(0.006)(0.000)(0.000)(0.018)(0.000)
Elevation−0.003 0.106 0.042 0.013 0.045 0.019
(0.983)(0.376)(0.596)(0.831)(0.645)(0.805)
Slope−0.055 −0.108 0.071 0.058 0.118 0.112
(0.643)(0.343)(0.359)(0.328)(0.224)(0.126)
WaterShare−0.092 −0.050 0.009 0.034 0.070 0.013
(0.315)(0.586)(0.876)(0.479)(0.351)(0.821)
Ajusted R20.1010.1040.6160.7550.4040.632
(0.017)(0.013)(0.000)(0.000)(0.000)(0.000)
Note: bold value is at a 95% significance level.
Table 5. Standardized B coefficients of the first-difference model.
VariableStandardized B, Sig.
CONTIGSHAPEFRAC
GDP−0.564 (0.005)−0.467 (0.001)−0.589 (0.001)
Population0.543 (0.000)0.244 (0.012)−0.019 (0.874)
Bus−0.010 (0.916)0.030 (0.634)0.110 (0.168)
GDP2Share0.044 (0.644)0.023 (0.853)−0.198 (0.205)
GDP3Share0.086 (0.353)−0.035 (0.782)−0.221 (0.157)
UrbanArea0.382 (0.054)1.008 (0.000)1.117 (0.000)
Ajusted R20.194 (0.000)0.624 (0.000)0.398 (0.000)
Note: bold values are at a 95% significance level.

