1. Introduction
Urbanization is a process of mass accumulation of human beings, materials, and energies. Regional concentration inevitably gives rise to a series of environmental and ecological problems, such as urban built-up land expansion [
1,
2,
3,
4], a shortage of water resources, urban heat islands [
5,
6], air pollution [
7], traffic congestion, and so on. As one of the key issues of urbanization, the expansion of urban built-up land is a common phenomenon that is associated with urbanization around the world. The blindness of urban built-up land expansion and disordered planning have led to the uncontrolled conversion of cultivated land into built-up land, which has created food security problems and landless farmers in some countries [
8]. At the same time, urban built-up land expansion and encroachment on natural forests land and lakes have also produced ecological problems, which have seriously threatened the survival of urban residents and species richness [
9]. Governments have begun to realize the seriousness of the problems that have been caused by the urban built-up land expansion, and they are making great efforts to readjust and upgrade the industrial structure and land use for sustainable urban development [
10,
11]. Therefore, scientifically analyzing the differences in the expansion of urban built-up land will help us to understand the factors that affect urban expansion in different cities, formulate plans for urban land use, and control urban sprawl rationally.
The studies of urban built-up land expansion have covered a wide range of topics. One of the most important topics are the factors that drive urban built-up land expansion. Scholars around the world have done a lot of exploration of the factors that drive urban built-up land expansion in countries such as the United States, India, Iran, Spain, and China [
12]. These driving factors include social and economic development [
13,
14,
15,
16], policies [
17,
18,
19,
20,
21,
22], population [
23,
24], and transportation [
25,
26,
27]. Besides, many scholars have focused on the spatial scales [
28,
29,
30], internal structures [
31,
32,
33], landscape features [
34,
35,
36], and simulated and predicted methods [
29,
37,
38]. As a summary, previous studies have focused on how economic and social factors drive urban built-up land expansion and the regular changes in its structure, or have analyzed the economic and social factors that cause such structural changes by combing the distribution of the built-up land and its expansion characteristics. This paper will focus on whether geographical features impact urban built-up land expansion, and if so, by how much. A further question to ponder is: what role do geographical features play in the expansion of urban built-up land? The answers to these questions will allow us to effectively guide the sustainable expansion of these cities.
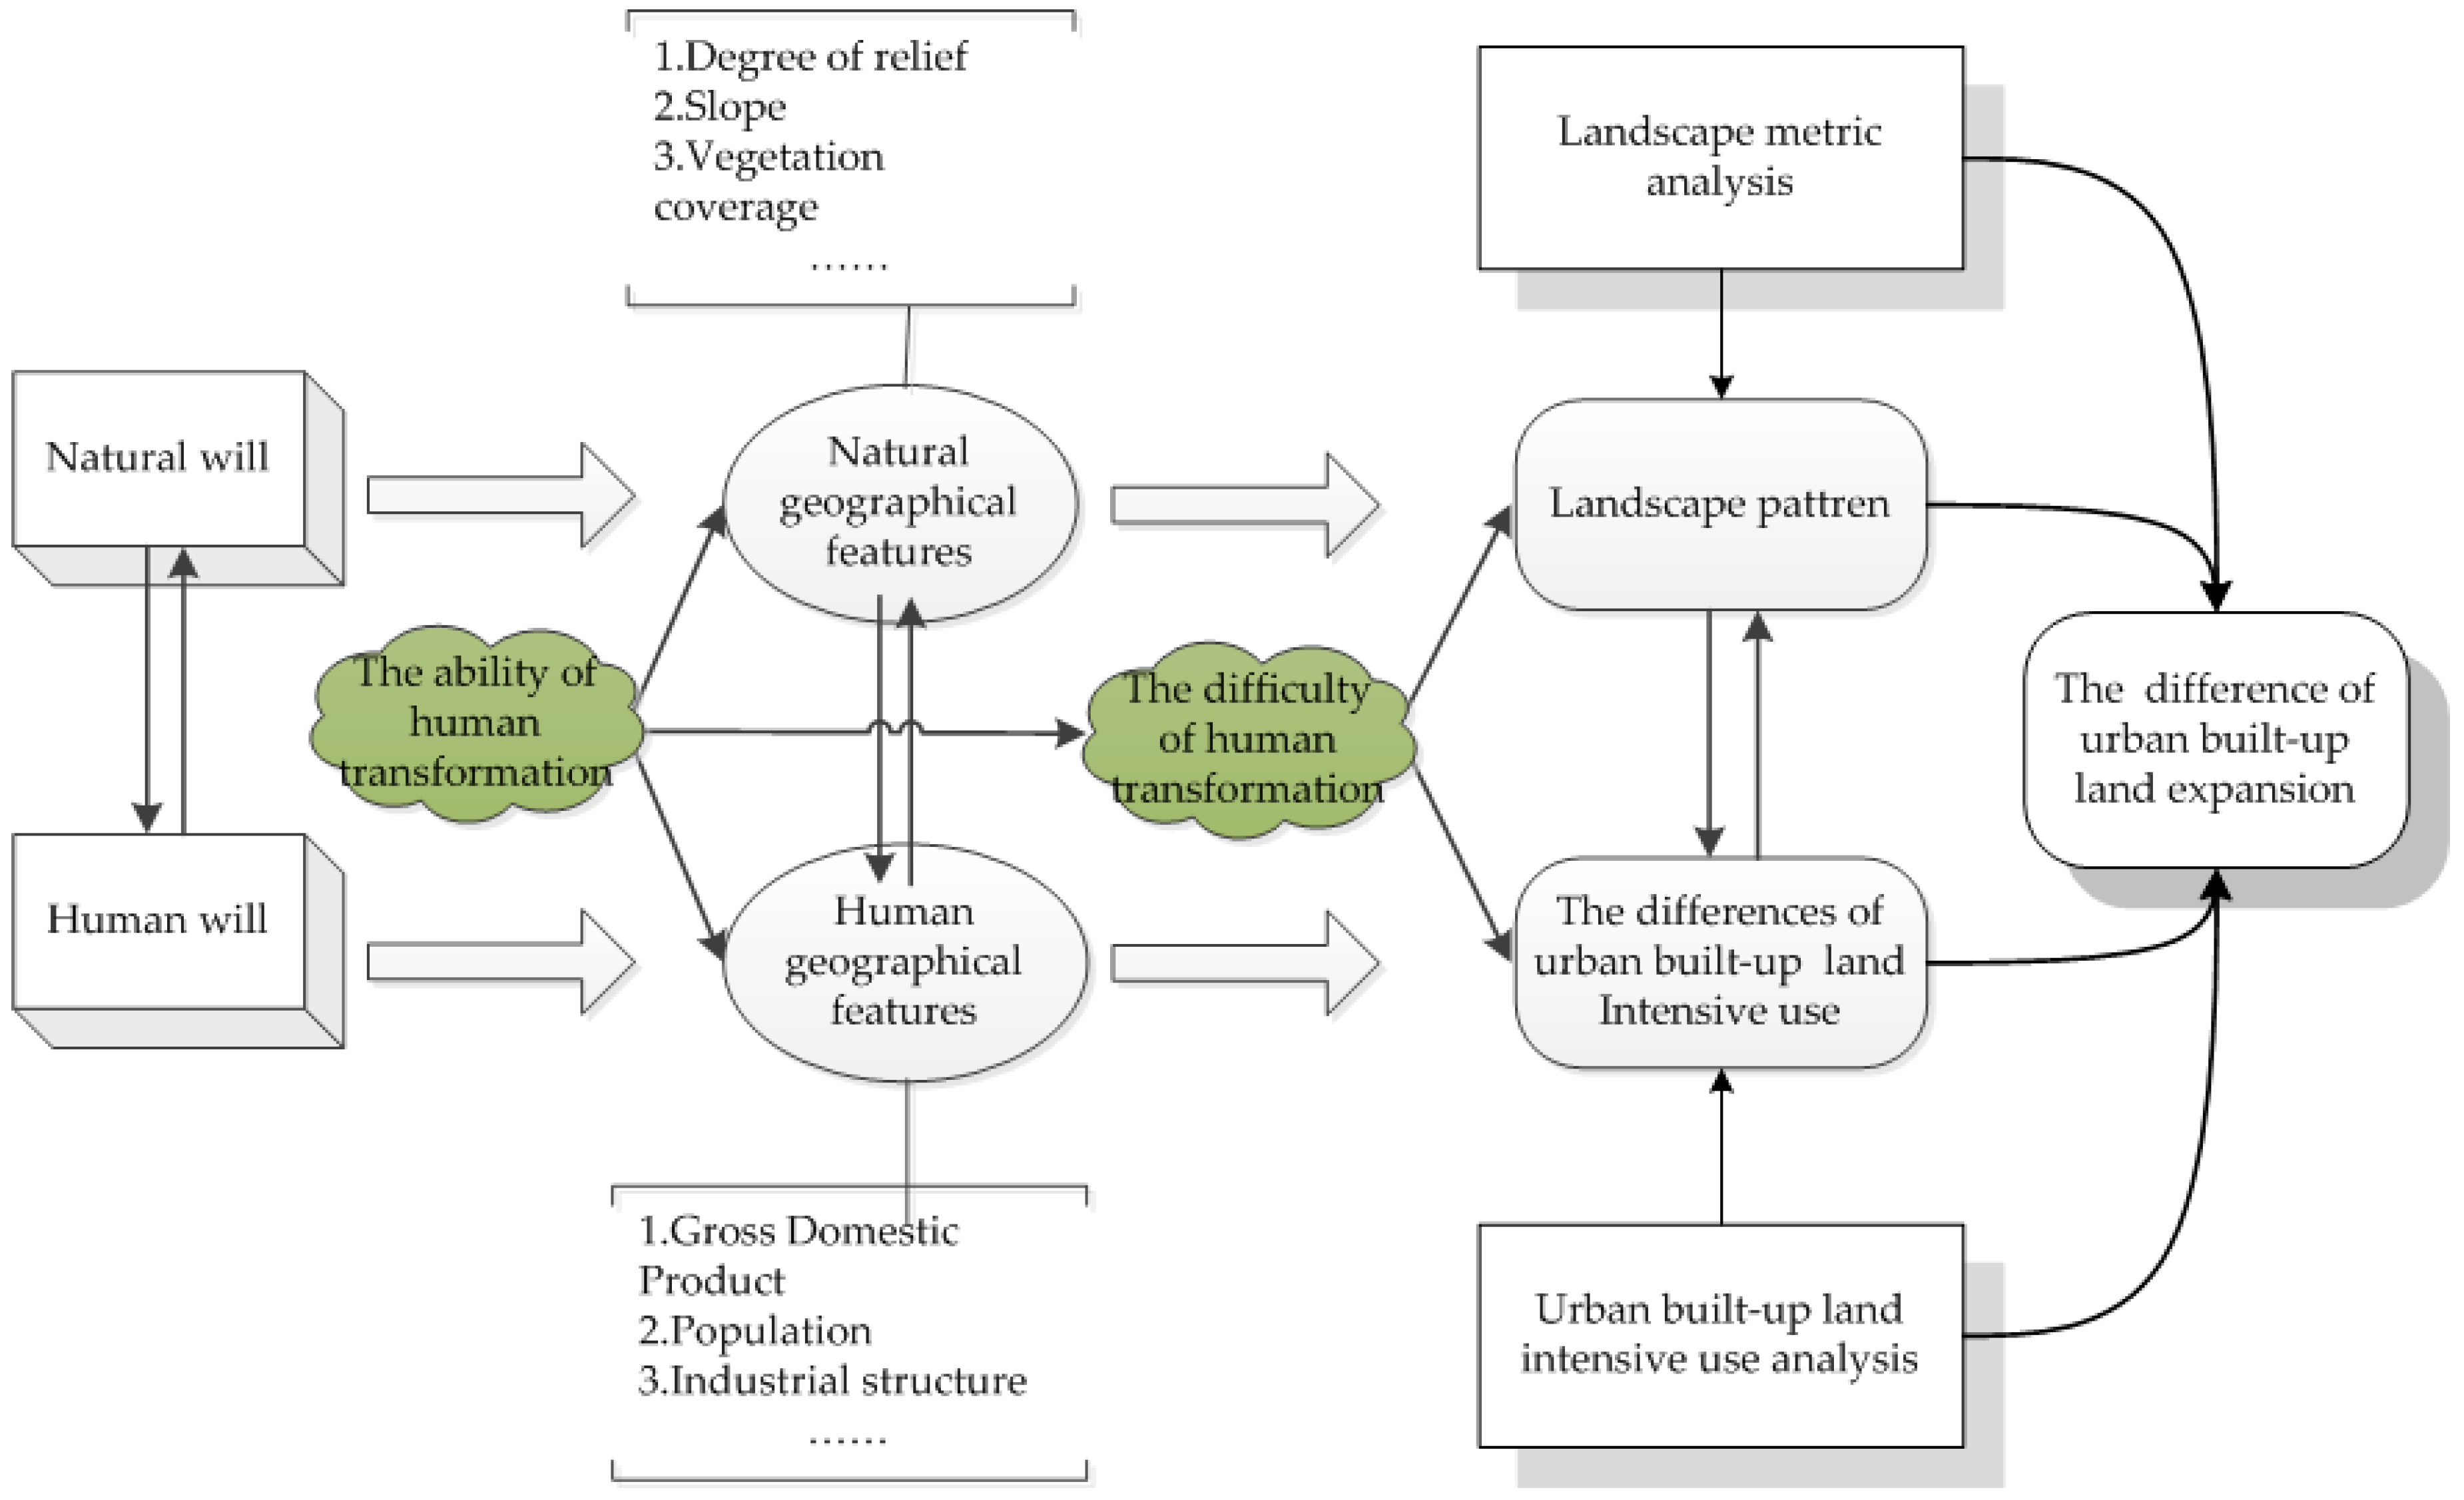
Although a few studies have concentrated on comparing the urban built-up land expansion in different cities [
39,
40], they didn’t reveal any differences in terms of geographical features and only analyzed the factors that caused these differences. Therefore, in this paper, we have selected two cities that have similar economic and social conditions, which means that they have similar human geographical features, but had quite different natural geographical features during the initial period of study. Due to the difference between natural will and human will, mankind will continue to transform the natural geographical features and develop human geographical features in the coming decades, but they will encounter great difficulties due to their limited capability to transform these features. Will doing this lead to differences in human geographical features and in urban built-up land intensive use after several decades? This study explores whether the landscape patterns and the economic–social structure have undergone profound changes according to a landscape metric analysis and an urban built-up land intensive use analysis, and analyzes the mechanism that underlies urban built-up land expansion (
Figure 1).
2. Study Area
2.1. Changsha
Changsha is located in the middle reach of the Yangtze River. Changsha has six core districts and one county, and hosts two county-level cities that are within five national development zones and nine provincial industrial zones. It is the center for politics, economics, culture, science–education, and business in Hunan province. Its annual GDP reached 851.113 billion RMB in 2015, up by 9.9 percent over the previous year, which included an added value of 34.178 billion RMB from the primary industry, an added value of 447.82 billion RMB from the secondary industry, and an added value of 369.015 billion RMB from the tertiary industry. In 2015, the registered population was 6.804 million in the city, and it has increased rapidly every year.
Changsha has a total area of 11,816.0 km2, and its built-up area is 363.69 km2. The city has an annual mean temperature of 18.6 °C. The maximum temperature exceeds 37.8 °C in summer and drops to a minimum of −0.1 °C in winter. The climate is mild and the seasons are clear. From the topography and the geomorphology, the terrain is complex. It comprises alluvial plains on both sides of the Xiangjiang River, and mountains and low hills are around the city. Dawei Mountain is the highest mountain in Changsha and is 1607.9 m above sea level. Cezhan Lake has the lowest elevation in Changsha and is 23.5 m above sea level. The Xiangjiang River flows from south to northwest across the city.
2.2. Zhengzhou
Zhengzhou is an important city in the central region of China (112°42′ E–114°14′ E, 34°16′ N–34°58′ N). It is the country’s important integrated transport hub, the core city of the Central Plains Economic Zone, and is located in the south of the North China Plain along with the Yellow River. The city is the political, economic, cultural, science–education, and business center of Henan province. Its annual GDP reached 731.15 billion RMB in 2015, up by 10.0 percent over the previous year, which included the primary industry contributing an added value of 15.090 billion RMB, the secondary industry contributing an added value of 360.42 billion RMB, and the tertiary industry contributing an added value of 355.64 billion RMB. The city’s population was 9.569 million in 2015.
In addition, Zhengzhou has six districts, five county-level cities, and one county. It has a total area of 7446 km
2, and a built-up area of 437.6 km
2. The temperature ranges from 2.15 °C to 25.9 °C. Winter is dry and cold, and rain and snow are scarce. Spring is dry with a little rain. Summer is hot and autumn is cool. From the topography and the geomorphology, Zhengzhou includes minor mountains in the Southwest, and the built-up area of Zhengzhou is mainly comprised of alluvial plains. The Yellow River runs along the region and delineates the northern boundary of Zhengzhou (
Figure 2).
This study analyzes the urban built-up land expansion in Zhengzhou and Changsha. Zhengzhou and Changsha are both in China’s abdomen, and are both national center cities. Also, they are connected by a North–South axis and are crossed by the main traffic road that connects the South and North. Zhengzhou is the capital city of Henan province, which carries 5000 years of history in China. Changsha is the capital of Hunan province, which carries the history of the modern Chinese military revolution and the development of the Chinese Communist Party. In summary, considering the extreme similarities between the cities, this study would analyze the characteristics of urban built-up land expansion purely from the perspective of geographical features, so as to deeply reveal the mechanism that underlies urban built-up land expansion.
3. Material and Methods
3.1. Data Description
We used multispectral remote sensing images to study the urban land expansion process, which included the Landsat TM images for 1990, 1995, 2000, and 2005, and the Landsat ETM+ images for 2008 and 2010. The resolution of the remote sensing image data is 30 m × 30 m. We used a combination of supervised classification and manual interpretation (using ENVI5.3 and maps in Google Earth) to classify and interpret the images. The processing resulted in five major classes: cultivated land, green land (forest, grassland), water, built-up land, and unused land. These five major classes contained 25 subtypes. The built-up land class included urban built-up land, rural built-up land, and other built-up land, which are the main types of land that reflect urban land expansion.
In addition to using the mentioned remote-sensing data, this paper also used two types of nonremote sensing data: one type to reflect the features of natural geography, and the other to reflect the features of human geography. The natural geography data included a digital elevation model (DEM) from the geospatial data cloud platform (
http://www.gscloud.cn), and data on a river system that have been derived from the visual interpretation of remote-sensing images for Changsha and Zhengzhou. Also, we had collected a large amount of statistical data from the statistics bureau. These data included demographic and economic data, such as population, GDP, and industrial structure data, statistical data on population, which mainly referred to the census registered population, and statistical data on industrial structure, including the classifications of primary industry, secondary industry, and tertiary industry. The DEM was mainly utilized to analyze the topography of an urban expansion boundary and restrictive topographical factors for regional urban development.
3.2. The Geographical Features Analysis
There are two types of geographical features: natural geographical features and human geographical features. Natural geographical features refer to features such as location, topography, climate, hydrology, soil, biology, and land-use types. Considering that the topography, land-use types, and geographical features have an obvious impact on urban built-up land expansion, we chose the degree of relief, the average slope, and the proportion of different land-use types as the indicators to reflect the differences in natural geographical features (
Table 1).
Human geographical features cover features such as population, industrial structure, social culture, and economic aggregates. Therefore, household population, the proportion of primary industry, secondary industry, and tertiary industry, public finance expenditure, public revenue, gross domestic product, and the investment volume were selected to represent the human geographical features (
Table 2), characterize the changes in human geographical features under human transformation by establishing a human geographical indicator system, and identify the differences between the human geographical features in the two cities.
3.3. The Landscape Metrics Analysis
This paper established a set of landscape metrics that link geographical features with urban built-up land expansion. The metrics were mainly selected from area and edge metrics, shape metrics, and aggregation metrics. The set included the number of patches (NP), the patch density (PD), the largest patch index (LPI), the perimeter–area fractal dimension (PAFRAC), the contagion index (CONTAG), and the interspersion and juxtaposition index (IJI). Among the metrics, the PAFRAC reflects the shape complexity across a range of spatial scales (patch sizes); the shape is regular and simple if the value is close to 1, which also indicates that the degree of human interference is greater; conversely, if the value is close to 2, the shape is complex. The CONTAG describes the degree of agglomeration or extension in the landscape. The dominant patch type has a good connection to the landscape when the CONTAG value is larger; on the contrary, when the CONTAG value is smaller, the landscape is characterized by a variety of landscape types and the degree of landscape fragmentation is high. The IJI reflects the landscape isolation distribution characteristics of those patch types that are severely restricted by certain natural conditions; a landscape has a better isolation distribution with higher values of IJI. All of the landscape metrics that have been chosen are related to the geographical features, especially the natural geographical features, and have been calculated through the Fragstats 4.2 platform.
3.4. The Urban Built-Up Land Intensive Use Analysis
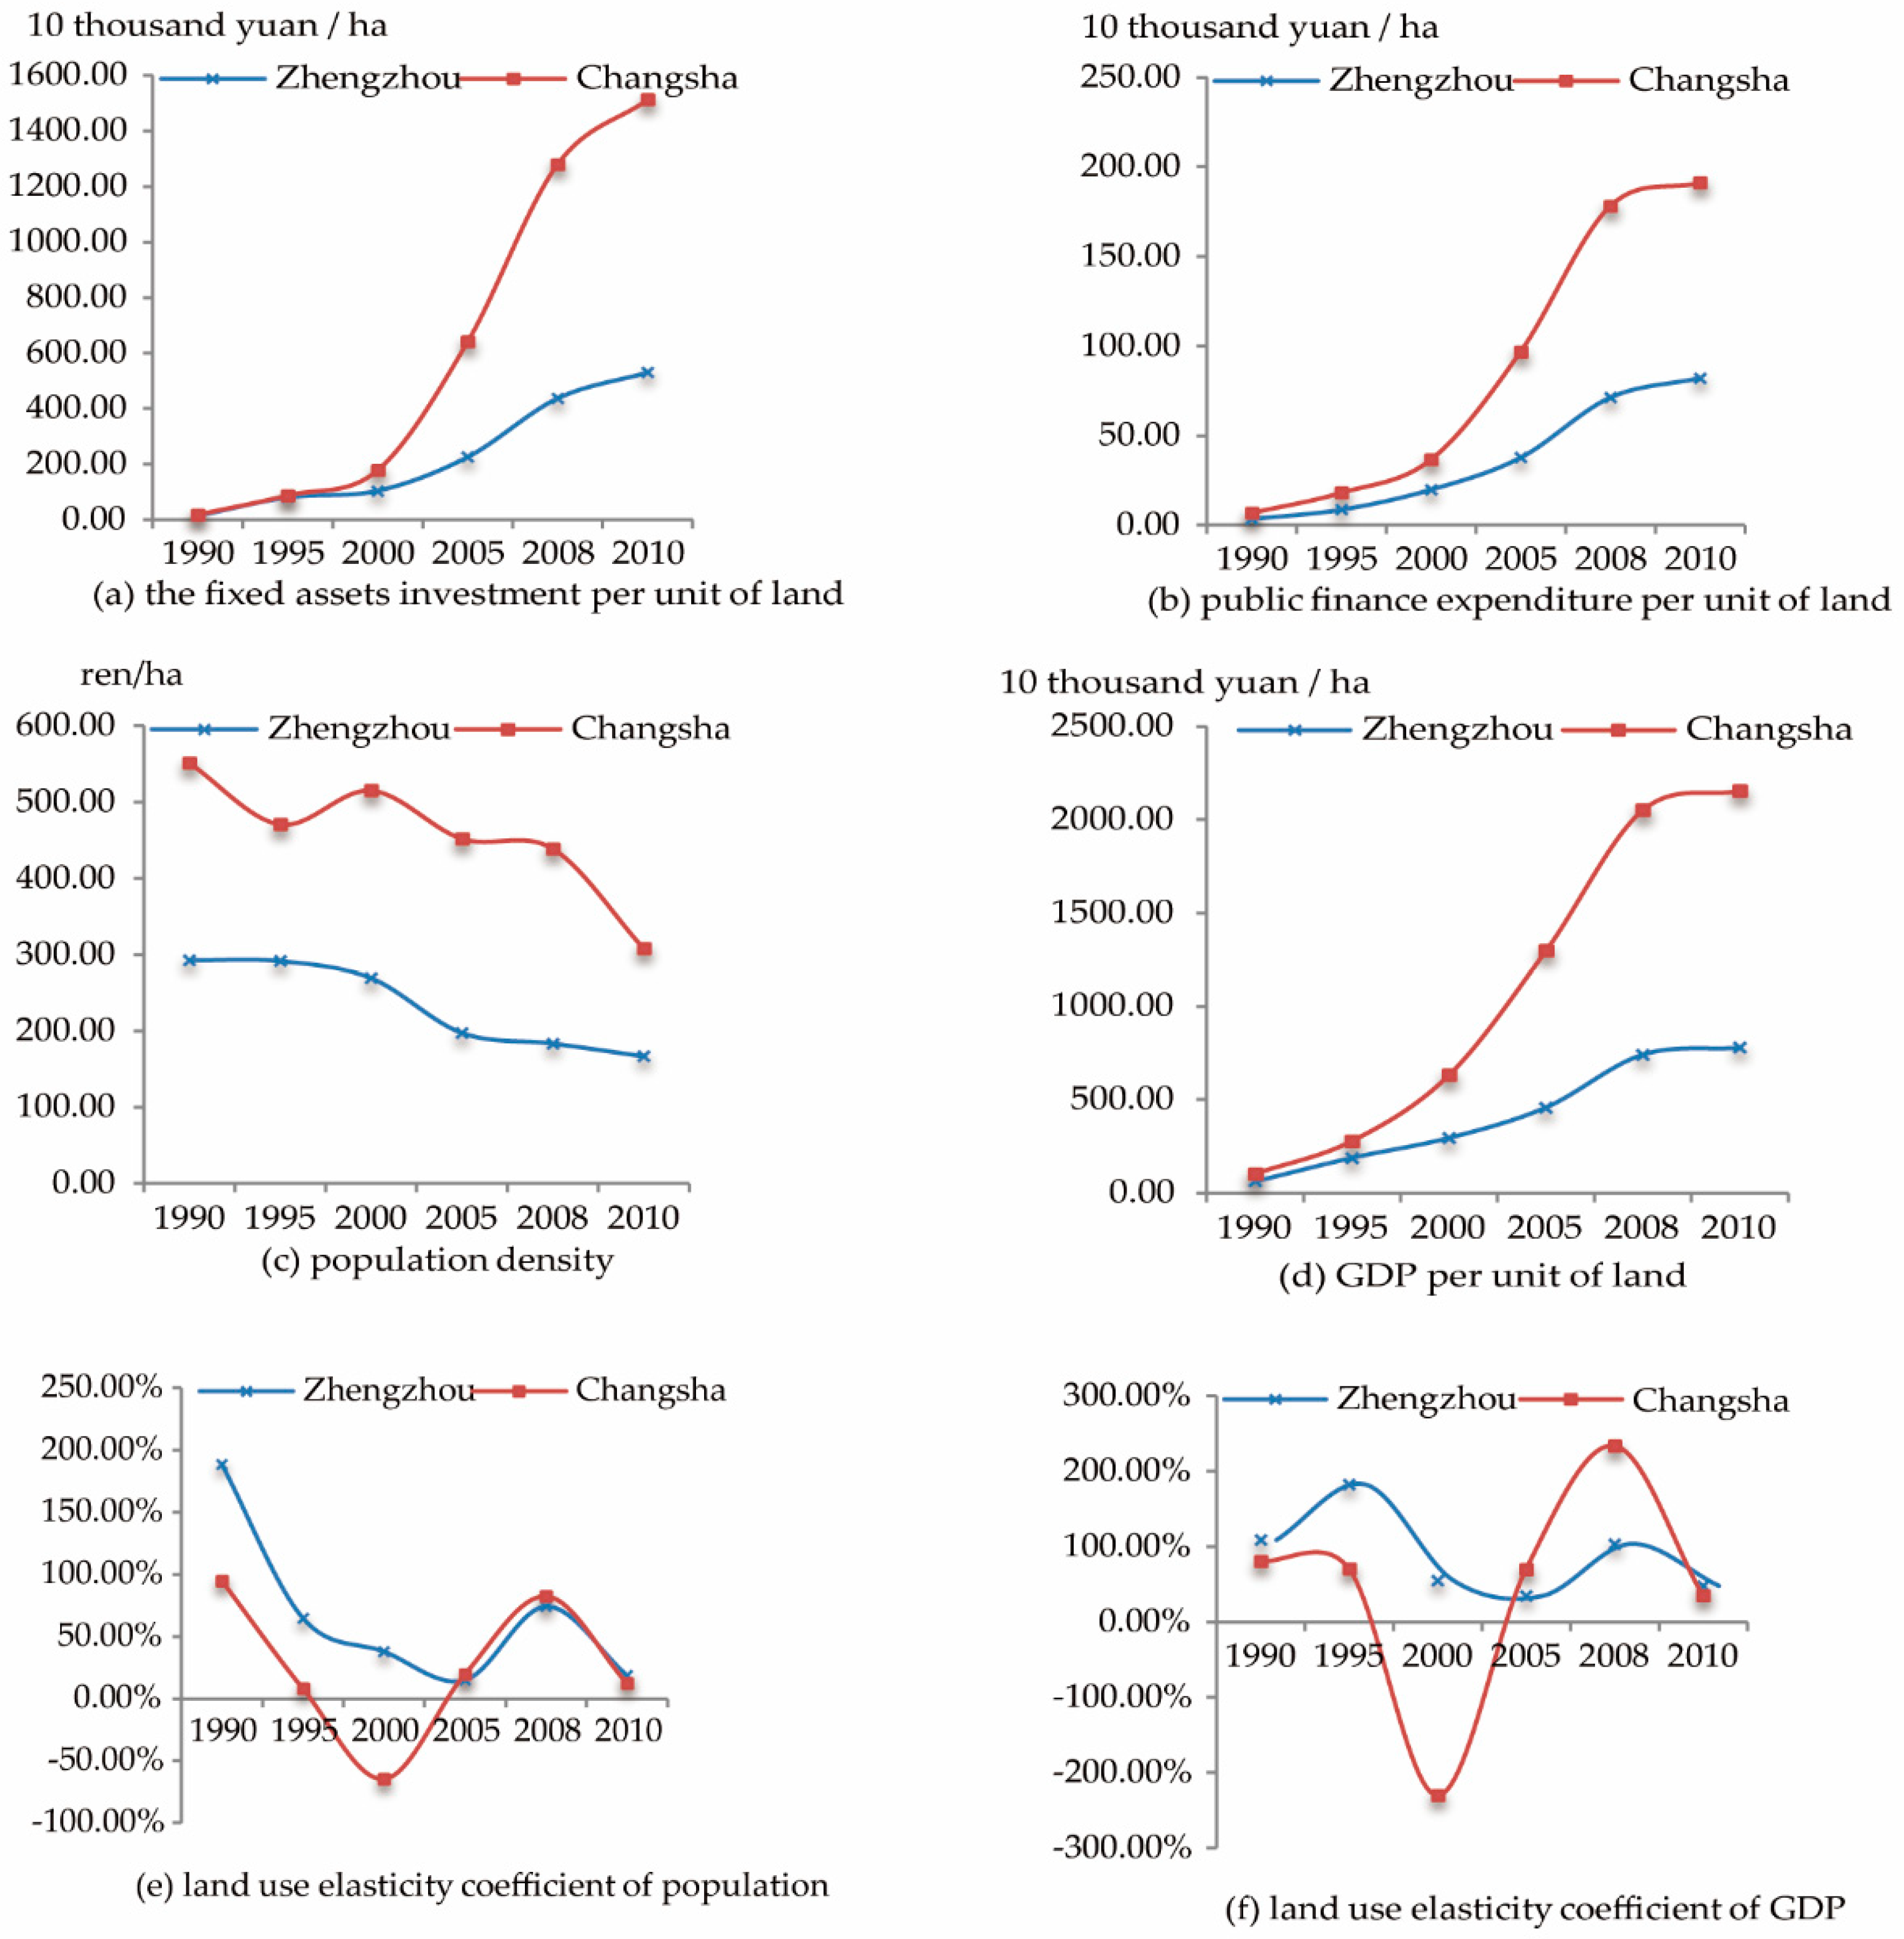
The variables for urban built-up land intensive use were chosen from the land input intensity and the land output efficiency. Land input intensity refers to the funds or labor that are put into the land, and is the consequence of human activities. Land output efficiency refers to the economic value that is gained on a unit of land. Therefore, this paper chose the fixed assets investment per unit of land (FAIPUL), the public finance expenditure per unit of land (PFEPUL), the population density (PODE), the GDP per unit of land (GDPPUL), the land-use elasticity coefficient of population (LUECP), and the land-use elasticity coefficient of GDP (LUECGDP) as the indicators to reflect the degree of urban built-up land intensive use, all of which are related to the geographical features, especially the human geographical features.
4. Results
4.1. The Comparsion of the Geographical Features
4.1.1. Land-Use Change
Based on the results from the land-use classification for 1990, 1995, 2000, 2005, 2008, and 2010, the change in the land-use types was analyzed in the two cities, and an obvious change in the composition of the different land-use types was found. However, the change was different for each city. In Zhengzhou, the proportion of built-up land increased from 17.97% to 48.98% during the period 1990–2010; however, the proportion of the cultivated land and green land decreased from 68.11% to 42.11% and from 2.21% to 0.49%, respectively. Also, the proportion of water area decreased from 11.14% to 8.42%. Similarly, in Changsha, the proportion of built-up land increased from 28.56% to 60.42%, during the period 1990–2010; however, the proportion of cultivated land, green land, and water area decreased from 37.93% to 14.57%, from 21.26% to 15.30%, and from 12.13% to 9.70%, respectively. The trend of changes is similar between Zhengzhou and Changsha (
Figure 3).
The proportion of cultivated land in Zhengzhou was higher than that in Changsha, and almost remained stable; however, the proportion of cultivated land in Changsha had a significant reduction from 2008 to 2010. The trend of reduction in the proportion of cultivated land in Changsha was also more obvious from 2008 to 2010. In terms of the proportion of green land, that in Changsha was obviously higher than that in Zhengzhou, and the proportion of green land in Zhengzhou was slowly decreasing at the same time. However, the proportion of green land in Changsha rose sharply from 2005 to 2010, which shows that the living environment in Changsha was continuously being improved, while the opposite was true for Zhengzhou.
4.1.2. The Natural Geographical Features
The degree of relief in Changsha was larger than that in Zhengzhou, and the undulation of the terrain was larger in Changsha. Moreover, the proportion of green land in Changsha was much larger than the proportion of green land in Zhengzhou and the proportion of cultivated land in Zhengzhou accounted for a large proportion of its total land from the land-use change, which indicates a great relationship with the degree of relief. From the perspective of the remote-sensing images, Changsha was surrounded by forests and Zhengzhou was surrounded by cultivated land. The average slope was 5.50 in Zhengzhou, and the average slope was 6.25 in Changsha (
Table 3).
4.1.3. The Human Geographical Features
As can be seen from
Figure 4, the indicators of human geographical features have shown regular and continuous growth in the two cities; however, the growth rate is different. The two cities exhibited different trends in household population growth. Zhengzhou’s household population showed explosive growth during the next two decades; however, Changsha’s increased slowly (
Figure 4a). The growth trend of different industrial output value was different. The output value of Changsha’s primary industry had always been higher than that of Zhengzhou’s. However, the growth trends of the secondary industry and the tertiary industry were similar, which led to the amount of gross domestic product being basically the same from 1990 to 2010 (
Figure 4b,c,d,g). In addition, Changsha’s public finance expenditure growth trend was similar to Zhengzhou’s, and Changsha’s investment volume growth trend was also similar to Zhengzhou’s. Nevertheless, Changsha’s public revenue fluctuated sharply in 2008; afterward, the amount of public revenue in Changsha was larger than that in Zhengzhou’s (
Figure 4e,f,h).
4.2. The Natural Geographical Features and the Landscape Metrics of Urban Built-Up Land
In terms of NP in the built-up area, the number of patches in Zhengzhou was significantly larger than that in Changsha (
Figure 5a). The patch density showed a declining trend year by year, and there was an obvious decrease in Zhengzhou, which indicates that the urban built-up land in Zhengzhou was relatively fragmented (
Figure 5b). However, the largest patch index increased from 1990 to 2010 (
Figure 5c).
From the perspective of the perimeter–area fractal dimension, the value of Zhengzhou’s had been smaller than that of Changsha’s for the past 20 years, which showed that Zhengzhou’s landscape had strong regularity and was simple, but that the contrary was true in Changsha (
Figure 5d). The value of urban built-up landscape contagion index in both cities had been increasing from 1990 to 2010, indicating that the urban built-up land in each city was constantly connected; however, the value of Changsha’s contagion index experienced a significant decline from 1995 to 2008; this was mainly due to the restriction of the natural geographical features in Changsha. Overall, the landscape connectivity in Changsha was always better than that in Zhengzhou (
Figure 5e). On the other hand, Changsha and Zhengzhou have both had to adopt loose land policies to stimulate economic growth because of the economic downturn caused by the economic crisis, which also led to the disorderly expansion of urban built-up land. Thus, the contagion index dropped in both cities around 2008. We had chosen IJI (the interspersion and juxtaposition index) to describe the correlation among rural residential land, urban built-up land, and other built-up land in different cities. Zhengzhou’s IJI value was smaller than Changsha’s. Even after some years had elapsed, the correlation degree remained at 0, which showed that Zhengzhou had a strong grip on the expansion of urban built-up land. The reason for this was that Zhengzhou’s natural geographical features were relatively simple (
Figure 5f).
We argue that the expansion of urban built-up land had a high correlation with the natural geographical features of Zhengzhou. Because the degree of relief and the average slope in Zhengzhou were less than those in Changsha, the land development costs were lower, resulting in the disorderly expansion of urban built-up land.
4.3. The Human Geographical Features and the Level of Urban Built-Up Land Intensive Use
Whether it was the fixed assets investment per unit of land (
Figure 6a), the public finance expenditure per unit of land (
Figure 6b), or the GDP per unit of land (
Figure 6d), the growth rate of Changsha had been faster than that of Zhengzhou during the past two decades, which shows that the level of built-up land intensive use in Changsha was higher than that in Zhengzhou, and the land-use efficiency in Changsha was higher at the same time. From another point of view, the urban built-up land expansion in Zhengzhou was more obvious in terms of changes in human geographical features, as economic and social development have both had a strong dependence on the built-up land expansion.
Judging from the population density (
Figure 6c), the density became smaller as time went by in both cities, and Zhengzhou’s population density was lower than Changsha’s. However, Zhengzhou’s population was larger than Changsha’s, which shows that the built-up land use in Zhengzhou was more extensive than that in Changsha. From the perspective of the land-use elasticity coefficient of population (
Figure 6e) and the land-use elasticity coefficient of GDP (
Figure 6f), Changsha showed a negative value in 2000. The reason for this was that the value of land growth in the built-up land was negative according to the original data. On the other hand, the value of the two indicators was larger before 2000, which reveals that land was not the major driving factor of economic growth at that time. However, after 2000, the two indicators showed violent fluctuations. The value of the two indicators in Changsha has been larger than the value of the two indicators in Zhengzhou since 2005, which shows that population and economic growth in Zhengzhou were becoming increasingly dependent on the expansion of urban built-up land, while the dependence of Changsha on urban built-up land was lower.
Regarding the regularity of human geographical features, the level of built-up land intensive use does not show regular changes in the human geographical features; on the contrary, it presents greater volatility. This shows that the expansion of urban built-up land is driven by the human geographical features. More importantly, it is also affected by other factors such as relevant land use policies and the natural geographical features.
4.4. The Differentiation Analysis of the Influence of Human and Natural Geographical Features
We calculated the PCC of the landscape metrics and the indicators of urban built-up land intensive use in Zhengzhou and Changsha (
Table 4). From the results, we found a strong correlation between NP and PODE, PD and LUECP, LPI and PODE, PAFRAC and PODE, PAFRAC and GDPPUL. Overall, the landscape pattern is only highly correlated with PODE, which indicates that human geographical features also have an important impact on the landscape pattern. However, there are significant differences in the impact of human geographical features and natural geographical features on urban built-up land use. The role that human geographical features play is to drive the expansion of built-up land. Natural geographical features are either convenient or limiting to the expansion of built-up land.
5. Discussion
The rapid expansion of urban built-up land is a problem that every city has to face. In this paper, we chose to study Changsha and Zhengzhou, two cities in China, and analyzed their geographical features and the differences in the urban built-up land expansion under different geographical features in detail. The reason for selecting Changsha and Zhengzhou as the study area was that the social and economic conditions of the two cities are very similar, but their natural geographical features had great differences in 1990. However, urban built-up land expansion in Changsha and Zhengzhou showed different characteristics under the influence of different geographical features after two decades.
In summary, the most direct manifestation of the change in urban built-up land expansion was the change in the landscape pattern. The existing research is based on the changes in the land landscape pattern and analyzes the causes of urban land landscape changes. The reason for the change of the landscape pattern in Europe is the abandonment of land, which has mainly been due to economic and social growth, transportation, and the transformation and utilization of human beings, especially for urban land use [
41,
42,
43,
44,
45]. However, human beings have a limited ability to transform nature. At the existing level of social and economic development, the natural geographical features impose a great restriction on urban built-up land use, which has also led to large differences in landscape patterns in Changsha and Zhengzhou. For example, there are many mountains in Changsha, and the difficulties that arise in using them make the landscape more fragmented. Zhengzhou is mainly comprised of plains and has more cultivated land; therefore, urban built-up land expansion is low-cost, resulting in an overall strong landscape pattern change and rapid expansion.
We also find that, with the dramatic changes in human geographical features such as population and economic structure, the expansion of urban built-up land is inevitable, and there is a positive correlation between them, which is basically consistent with the findings of previous studies [
46,
47,
48]. Human geographical features, such as population, are the dominant drivers of urban built-up land expansion; however, population, the economic structure, and other factors are independent of land-use policies, which explains why land intensive use is not as regular as human geographical features: specific policies are constantly changing. Moreover, we find that the natural geographical features affect the level of built-up land intensive use, because it involves the cost of land for economic and social development. For instance, high mountains and rich water systems make land development costs increase, and lead governments to choose policies that develop flat land with lower development costs, resulting in a large amount of cultivated land being occupied as built-up land [
49,
50]. However, with the continuous expansion of the urban built-up land, the costs increase more and more. Finally, urban built-up land begins to expand internally. Judging from the comparison between Changsha and Zhengzhou, the expansion of urban built-up land in Zhengzhou is more extensive. It is necessary to strengthen the connection between land-use policies and human geographical features, formulate more rational land-use policies, and get rid of dependence on land economy.
6. Conclusions
On the one hand, different geographical features have always influenced the development cost and development direction of urban built-up land; the sequence and manner of the influence of natural and human geographical features are also different in urban built-up land expansion, which, in turn, reflect in the spatial pattern and utilization efficiency of land. In detail, relatively simple natural geographical features lead to lower costs of urban built-up land development, therefore, they are more dependent on the land economy, which leads to rapid expansion of urban built-up land with a lower degree of urban built-up land intensive use, and is reflected on the landscape pattern. However, if the changes of human geographical features are obvious, such as the high growth of economy or population, which are bound to be constrained by the features of natural geography, these lead to the expansion of built-up land with a high level of land intensive use, and also reflect on the landscape pattern.
On the other hand, the economic and social development of the region with complex natural geographical features needs to consider making the quality land exert its maximum value because of the limitations to the natural geographical features. Land-use policies of the region which have complex natural geographical features are closely related to human geographical features, such as economic structure. However, land-use policies of the region which have simple natural geographical features are relatively more independent. The expansion of urban built-up land is not only driven solely by human geographical features, but is also influenced more by natural geographical features than we have imagined, which are often overlooked and even one-sided. Therefore, in the management of urban built-up land, we should focus on the analysis of natural geographical features in the first place, and then analyze the human geographical features or economic structure, so as to make differentiated built-up land management policies. The conclusions of this paper can provide reference for the cities with different human geographical features and natural geographical features that are making plans on urban built-up land management.
Author Contributions
H.Z. and Z.W. conceived and designed the research. J.C. analyzed the data. Z.W. wrote the paper. H.Z. revised the paper, H.Z. and Z.W. contributed equally to this work. All authors have read and approved the final manuscript.
Funding
Research on the performance evaluation and promotion mechanism of urban construction land under the background of new urbanization: 71673258.
Acknowledgments
This work was supported by the National Natural Science Foundation of China (Grant No. 71673258).
Conflicts of Interest
The authors declare no conflict of interest.
References
- Dadras, M.; Shafri, H.Z.M.; Ahmad, N. Land Use/Cover Change Detection and Urban Sprawl Analysis in Bandar Abbas City, Iran. Sci. World J. 2014, 2014, 690872. [Google Scholar] [CrossRef]
- Haregeweyn, N.; Fikadu, G.; Tsunekawa, A. The dynamics of urban expansion and its impacts on land use/land cover change and small-scale farmers living near the urban fringe: A case study of Bahir Dar, Ethiopia. Landsc. Urban Plan. 2012, 106, 149–157. [Google Scholar] [CrossRef]
- Hepcan, S.; Hepcan, C.C.; Kilicaslan, C. Analyzing Landscape Change and Urban Sprawl in a Mediterranean Coastal Landscape: A Case Study from Izmir, Turkey. J. Coast. Res. 2013, 29, 301–310. [Google Scholar] [CrossRef]
- Salvati, L.; Sateriano, A.; Bajocco, S. To grow or to sprawl? Land Cover Relationships in a Mediterranean City Region and implications for land use management. Cities 2013, 30, 113–121. [Google Scholar] [CrossRef]
- Cui, Y.P.; Liu, J.Y.; Qin, Y.C. The impact of urban sprawl on heat island intensity in Beijing. Chin. J. Ecol. 2015, 34, 3485–3493. [Google Scholar] [CrossRef]
- Qiao, Z.; Tian, G.J.; Zhang, L.X. Influences of Urban Expansion on Urban Heat Island in Beijing during 1989–2010. Adv. Meteorol. 2014, 2014, 187169. [Google Scholar] [CrossRef]
- Mccarty, J.; Kaza, N. Urban form and air quality in the United States. Landsc. Urban Plan. 2015, 139, 168–179. [Google Scholar] [CrossRef]
- Liu, Y.L.; Cai, E.X.; Jing, Y. Analyzing the Decoupling between Rural-to-Urban Migrants and Urban Land Expansion in Hubei Province, China. Sustainability 2018, 10, 345. [Google Scholar] [CrossRef]
- Concepción, E.D.; Obrist, M.K.; Moretti, M. Impacts of urban sprawl on species richness of plants, butterflies, gastropods and birds: Not only built-up area matters. Urban Ecosyst. 2016, 19, 225–242. [Google Scholar] [CrossRef]
- Bai, X.M.; Roberts, B.; Chen, J. Urban sustainability experiments in Asia: Patterns and pathways. Environ. Sci. Policy 2010, 13, 312–325. [Google Scholar] [CrossRef]
- Huang, Q.X.; He, C.Y.; Gao, B. Detecting the 20 year city-size dynamics in China with a rank clock approach and DMSP/OLS nighttime data. Landsc. Urban Plan. 2015, 137, 138–148. [Google Scholar] [CrossRef]
- Xu, J.Y.; Zhang, Z.X.; Zhao, X.L. Spatial-Temporal Characteristics and Driving Forces of Urban Sprawl for Major Cities of the Pearl River Delta Region in Recent 40 Years. Beijing Da Xue Xue Bao Zi Ran Ke Xue Bao 2015, 51, 1119–1131. [Google Scholar] [CrossRef]
- Hortas-Rico, M. Urban sprawl and municipal budgets in Spain: A dynamic panel data analysis. Pap. Reg. Sci. 2014, 93, 703–890. [Google Scholar] [CrossRef]
- Huang, Z.J.; Wei, Y.D.; He, C. Urban land expansion under economic transition in China: A multi-level modeling analysis. Habitat Int. 2015, 47, 69–82. [Google Scholar] [CrossRef]
- Jain, M.; Dimri, A.P.; Niyogi, D. Urban Sprawl Patterns and Processes in Delhi from 1977 to 2014 Based on Remote Sensing and Spatial Metrics Approaches. Earth Interact. 2016, 20, 1–29. [Google Scholar] [CrossRef]
- Wu, K.Y.; Zhang, H. Land use dynamics, built-up land expansion patterns, and driving forces analysis of the fast-growing Hangzhou metropolitan area, eastern China (1978–2008). Appl. Geogr. 2012, 34, 137–145. [Google Scholar] [CrossRef]
- Frederic Deng, F.; Huang, Y.Q. Uneven land reform and urban sprawl in China: The case of Beijing. Prog. Plan. 2004, 61, 211–236. [Google Scholar] [CrossRef]
- Gar-On Yeh, A.; Li, X. Economic Development and Agricultural Land Loss in the Pearl River Delta, China. Habitat Int. 1999, 23, 373–390. [Google Scholar] [CrossRef]
- Siedentop, S.; Fina, S.; Krehl, A. Greenbelts in Germany’s regional plans-An effective growth management policy? Landsc. Urban Plan. 2016, 145, 71–82. [Google Scholar] [CrossRef]
- Sun, P.J.; Feng, X.P.; Sun, H. Comparative analysis of characteristics, effects and driving factors of urban sprawl in Changchun-Jilin during 2000–2009. Prog. Geogr. 2013, 32, 381–388. [Google Scholar] [CrossRef]
- Harris, R. Perverse cities: Hidden subsidies, wonky policy, and urban sprawl by Pamela Blais. Can. Geogr. 2013, 57, E12–E13. [Google Scholar] [CrossRef]
- Yew, C.P. Pseudo-Urbanization? Competitive government behavior and urban sprawl in China. J. Contemp. China 2012, 21, 281–298. [Google Scholar] [CrossRef]
- Ma, Y.L.; Xu, R.S. Remote sensing monitoring and driving force analysis of urban expansion in Guangzhou City, China. Habitat Int. 2010, 34, 228–235. [Google Scholar] [CrossRef]
- Xiao, J.Y.; Shen, Y.J.; Ge, J.F. Evaluating urban expansion and land use change in Shijiazhuang, China, by using GIS and remote sensing. Landsc. Urban Plan. 2006, 75, 69–80. [Google Scholar] [CrossRef]
- Zhao, G.L.; Zheng, X.Q.; Yuan, Z.Y. Spatial and temporal characteristics and correlation analysis of road networks and urban sprawl. Trans. Chin. Soc. Agric. Eng. 2015, 3, 220–229. [Google Scholar] [CrossRef]
- Klug, S.; Hayashi, Y. Urban Sprawl and Local Infrastructure in Japan and Germany. J. Infrastruct. Syst. 2012, 18, 232–241. [Google Scholar] [CrossRef]
- Li, S.Y.; Liu, X.P.; Li, Z.G. Spatial and Temporal Dynamics of Urban Expansion along the Guangzhou–Foshan Inter-City Rail Transit Corridor, China. Sustainability 2018, 10, 593. [Google Scholar] [CrossRef]
- Gao, B.; Huang, Q.X.; He, C.Y. How does sprawl differ across cities in China? A multi-scale investigation using nighttime light and census data. Landsc. Urban Plan. 2016, 148, 89–98. [Google Scholar] [CrossRef]
- Hou, H.; Estoque, R.C.; Murayama, Y. Spatiotemporal analysis of urban growth in three African capital cities: A grid-cell-based analysis using remote sensing data. J. Afr. Earth Sci. 2016, 123, 381–391. [Google Scholar] [CrossRef]
- Zhou, D.C.; Zhao, S.Q.; Liu, S.G. Spatiotemporal trends of terrestrial vegetation activity along the urban development intensity gradient in China’s 32 major cities. Sci. Total Environ. 2014, 488, 136–145. [Google Scholar] [CrossRef] [PubMed]
- Jiang, G.H.; Ma, W.Q.; Wang, D.Q. Identifying the internal structure evolution of urban built-up land sprawl (UBLS) from a composite structure perspective: A case study of the Beijing metropolitan area, China. Land Use Policy 2017, 62, 258–267. [Google Scholar] [CrossRef]
- Jiang, G.H.; Ma, W.Q.; Qu, Y.B. How does sprawl differ across urban built-up land types in China? A spatial-temporal analysis of the Beijing metropolitan area using granted land parcel data. Cities 2016, 58, 1–9. [Google Scholar] [CrossRef]
- Kuang, W.H.; Liu, J.Y.; Dong, J. The rapid and massive urban and industrial land expansions in China between 1990 and 2010: A CLUD-based analysis of their trajectories, patterns, and drivers. Landsc. Urban Plan. 2016, 145, 21–33. [Google Scholar] [CrossRef]
- He, C.; Liu, Z.; Tian, J. Urban expansion dynamics and natural habitat loss in China: A multiscale landscape perspective. Glob. Chang. Biol. 2014, 20, 2886–2902. [Google Scholar] [CrossRef] [PubMed]
- Jiao, L.M.; Mao, L.F.; Liu, Y.L. Multi-order Landscape Expansion Index: Characterizing urban expansion dynamics. Landsc. Urban Plan. 2015, 137, 30–39. [Google Scholar] [CrossRef]
- Feng, L.; Du, P.J.; Zhu, L.J. Investigating Sprawl Along China’s Urban Fringe from a Spatio-Temporal Perspective. Appl. Spat. Anal. Policy 2016, 9, 233–250. [Google Scholar] [CrossRef]
- Han, J.; Hayashi, Y.; Cao, X. Application of an integrated system dynamics and cellular automata model for urban growth assessment: A case study of Shanghai, China. Landsc. Urban Plan. 2009, 91, 133–141. [Google Scholar] [CrossRef]
- Zeng, C.; Liu, Y.L.; Stein, A. Characterization and spatial modeling of urban sprawl in the Wuhan Metropolitan Area, China. Int. J. Appl. Earth Obs. Geoinf. 2015, 34, 10–24. [Google Scholar] [CrossRef]
- Rubiera Morollon, F.; Gonzalez Marroquin, V.M.; Perez Rivero, J.L. Urban sprawl in Spain: Differences among cities and causes. Eur. Plan. Stud. 2016, 24, 207–226. [Google Scholar] [CrossRef]
- Wang, L.G.; Han, H.Y.; Lai, S.K. Do plans contain urban sprawl? A comparison of Beijing and Taipei. Habitat Int. 2014, 42, 121–130. [Google Scholar] [CrossRef]
- Plieninger, T.; Draux, H.; Fagerholm, N. The driving forces of landscape change in Europe: A systematic review of the evidence. Land Use Policy 2016, 57, 204–214. [Google Scholar] [CrossRef]
- Deng, J.S.; Wang, K.; Hong, Y. Spatio-temporal dynamics and evolution of land use change and landscape pattern in response to rapid urbanization. Landsc. Urban Plan. 2009, 92, 187–198. [Google Scholar] [CrossRef]
- Solon, J. Spatial context of urbanization: Landscape pattern and changes between 1950 and 1990 in the Warsaw metropolitan area, Poland. Landsc. Urban Plan. 2009, 93, 250–261. [Google Scholar] [CrossRef]
- Li, S.C.; Gong, J.; Deng, Q.H. Impacts of the Qinghai–Tibet Railway on accessibility and economic linkage of the Third Pole. Sustainability 2018, 10, 3982. [Google Scholar] [CrossRef]
- Salata, S. Land use change analysis in the urban region of Milan. Manag. Environ. Qual. Int. J. 2017, 28, 879–901. [Google Scholar] [CrossRef]
- Hasse, J.E.; Lathrop, R.G. Land resource impact indicators of urban sprawl. Appl. Geogr. 2003, 23, 159–175. [Google Scholar] [CrossRef]
- Quan, B.; Bai, Y.J.; Römkens, M.J.M. Urban land expansion in Quanzhou City, China, 1995–2010. Habitat Int. 2015, 48, 131–139. [Google Scholar] [CrossRef]
- Wu, C.Y.; Wei, Y.D.; Huang, X.J. Economic transition, spatial development and urban land use efficiency in the Yangtze River Delta, China. Habitat Int. 2017, 63, 67–78. [Google Scholar] [CrossRef]
- Su, S.L.; Jiang, Z.L.; Zhang, Q. Transformation of agricultural landscapes under rapid urbanization: A threat to sustainability in Hang-Jia-Hu region, China. Appl. Geogr. 2011, 31, 439–449. [Google Scholar] [CrossRef]
- Su, S.L.; Ma, X.Y.; Xiao, R. Agricultural landscape pattern changes in response to urbanization at ecoregional scale. Ecol. Indic. 2014, 40, 10–18. [Google Scholar] [CrossRef]
© 2018 by the authors. Licensee MDPI, Basel, Switzerland. This article is an open access article distributed under the terms and conditions of the Creative Commons Attribution (CC BY) license (http://creativecommons.org/licenses/by/4.0/).


