Article

New Energy Empowerment Using Kernel Principal Component Analysis in Insulated Gate Bipolar Transistors Module Monitoring

1
State Key Laboratory of Reliability and Intelligence of Electrical Equipment, Hebei University of Technology, Tianjin 300130, China
2
Key Laboratory of Electromagnetic Field and Electrical Apparatus Reliability of Hebei Province, Hebei University of Technology, Tianjin 300130, China
3
Institute of Innovation and Circular Economy, Asia University, Taichung 41354, Taiwan
4
School of Business, Dalian University of Technology, Panjin 124221, China
*
Authors to whom correspondence should be addressed.
Sustainability 2018, 10(10), 3644; https://doi.org/10.3390/su10103644
Submission received: 11 September 2018 / Revised: 30 September 2018 / Accepted: 2 October 2018 / Published: 11 October 2018

Abstract

:
At present, energy exhausted and environmental pollution are important issues, vigorously promoting new energy and improving the utilization efficiency and management level of new energy is an important way to achieve sustainable social development. Insulated gate bipolar transistors are important components in power converters and are widely used in new energy generation, new energy vehicles, high-speed rail and industrial production. However, the power module’s age is related to all aspects of its performance change, precluding the use of a single parameter to fully and accurately express the aging state. To monitor this state and evaluate the aging state, this study presents a method to analyze and process the state data of Insulated gate bipolar transistors power module aging tests using kernel principal component analysis and establishes a multi-dimensional grey model to evaluate the power module aging state. Using the temperature cycle aging test platform, the 7000 temperature cycling tests are implemented to accelerate the age of the power module to failure, the dynamic parameters of the power modules are measured after every 1000 cycles. During the accelerated aging process, the case temperature change rate, collector-emitter voltage drop Vce(SAT) and Miller platform of the gate signal of Vge are found to exhibit different variation trends at different aging stages. The result showed that multiple parameters are combined into integrated attributes to enable more accurate implementation of the state monitoring of power modules using the proposed method, which improves the status monitoring level of Insulated gate bipolar transistors modules. The proposed method is beneficial to improve the utilization efficiency and new energy source management level.

1. Introduction

With the development of science and technology, the application of power electronics technology is extensive, and the insufficient energy supply and environmental pollution are becoming serious. Non-renewable energy sources such as coal, oil, and natural gas will generate a large amount of pollutants, which is the main cause of acid rain and global warming. At present, the world is striving to explore new energy sources and seek a path of sustainable development. Human beings have entered the new energy era. The continuous expansion of the application scope of new energy is an important means to promote the sustainable development of the whole society. The new energy sources mainly include wind energy and solar energy. These energy resources are extensive and have little environmental pollution. More importantly, compared with non-renewable energy sources, new energy sources such as wind and solar energy are inexhaustible. Replacing non-renewable energy with new energy sources can not only reduce environmental pollution, but also better realize the sustainable development of human society. At present, new energy industries such as wind and solar energy are developing rapidly, and their application range is increasing; therefore, it is important to improve the level of new energy management. Insulated Gate Bipolar Transistor (IGBT) power module is one of the most important components of the power conversion and transmission device, which is widely used in converters in new energy power generation systems. Therefore, improving the reliability and stability of new energy power generation systems will further expand the application scale of new energy sources, which can help to manage the global ecological crisis, improve people’s quality of life and promote the sustainable development of society [1,2].
However, a failure of the power module leads to the interruption of power electronic systems and even has the potential to cause severe economic loss and safety accidents [3]. Therefore, the power module reliability has received increasing attention from the equipment manufacturers and equipment managers [4]. Traditional methods to improve the power module reliability included improving the design and manufacturing process, such as improving the materials, enhancing the heat dissipation and controlling the operating conditions of the power electronic equipment. The cost savings and improvements allowed by traditional methods are limited with the development and maturity of power electronics technology. Currently, IGBT power module reliability is focused mainly on state monitoring [5,6,7], life prediction and reliability modeling [8,9]. The rapidly developing areas of state monitoring and aging state assessment are effective ways to improve the IGBT modules reliability.
To achieve early detection of abnormal devices and improve the power module reliability, the power module’s external characteristic parameters are measured using a variety of detection methods, which are combined with historical data to evaluate whether the current working state is normal. Xiang et al. [10] monitored several measurable quantities available for IGBT condition monitoring: the module current temperature, the output current harmonics, the phase-leg resistance and the dv/dt values associated with the rising and falling edges of Pulse Width Modulated output voltage, which is to monitor the system for normal operation. The above parameters are easy to measure. Ji et al. [11] use a temperature sensor and a current sensor to establish a condition monitoring system inside the electric vehicle to monitor the aging of the solder layer of the IGBT, thereby further monitoring the operation of the vehicle. Li et al. [12] established a switching loss prediction model based on the support vector machine optimized by improved chicken optimization algorithm, which compares the real switching loss with the prediction results of the new model and the other two models. The results indicate that the model has higher convergence precision and prediction accuracy and can predict switching losses accurately. The above literature describes three methods of IGBT condition monitoring, namely state monitoring and evaluation methods based on device surface features, sensor-based state monitoring and evaluation methods, and model-based state monitoring and evaluation methods.
The power module’s internal structure changes with aging, potentially exhibiting an increase of the IGBT collector-emitter voltage drop Vce(SAT), which is caused by thermal stress and welding layer damage, and an increase of the junction temperature Tj, which is caused by aging of the welding layer and increases in the power loss.
In the literature, Choi et al. [13] proposed a real-time collector-emitter voltage drop measurement circuit by monitoring the collector-emitter voltage in which the failure condition is detected. Bęczkowski et al. [14] proposed a Vce online monitoring circuit, which accurately predicts IGBT failure. Both of the above studies make use of the characteristic that the on-state voltage drop of the IGBT suddenly rises before its failure, and the failure of the IGBT is judged by monitoring the change of the on-state voltage drop. However, the changing collector-emitter voltage drop of the power module depends on the different aging periods. There is no detectable change of collector-emitter voltage drop in the early stages, but a sudden increase occurs before a failure. This study proposes that this proposed method is effectively monitoring the power module failure but not its aging condition. Hence, there is a need to integrate and monitor this aging condition in the process.
Still, Li et al. [15] studied the influence of the junction temperature on the aging states of the Power module, and a calculation method of junction temperature is proposed. The junction temperature prediction value of this model is compared with the junction temperature prediction value based on the particle swarm optimization support vector machine model. It is proved that the proposed model has better calculation accuracy and the proposed model is more innovative. Riedel et al. [16] introduced the viewpoint that failure of the welding layer is a common failure of the IGBT power module. The degradation effect of thermal dissipation in the power device aging process was analyzed and a method to monitor the thermal characteristics was proposed. Compared with the previous methods, the method can identify the abnormal thermal characteristics of the device earlier, the convergence is fast and the calculation amount is small. However, this proposed method requires accurate measurement of the junction temperature, a requirement that undoubtedly damages the power module package structure and increases costs. Denk et al. [17] studied the state monitoring of the thermal characteristics. Changes of thermal characteristics before and after the aging of the power module through thermal cycle tests were analyzed, including changes in temperature and thermal resistance and thermal capacity. The result showed that the variation of the temperature amplitude is related to the failure of the weld layer during the thermal cycle and that the minimum temperature is associated with the cooling system failure. The state monitoring system is based on this principle and solves the problems associated with limited time and accuracy but also faces the problem of performing junction temperature measurements.
As mentioned earlier, the aging of the power module is related to many aging state parameters, and a single parameter cannot accurately evaluate the IGBT aging state. The junction temperature is not straightforward to obtain accurately, and most indicators exhibit different trends in different aging stages. In the case, there is no measurement of the junction temperature, the integrated attribute of the power module state monitoring has been calculated using kernel principal component analysis (KPCA) with the gate switch signal Vge, collector-emitter voltage Vce, collector current Ic and case temperature Tc. In the present study, first, the measured Vge, Vce, Ic and Tc are used to calculate the parameters that are related to the junction temperature, such as the switching loss, collector-emitter voltage drop and temperature rise rate. Then, these parameters are centered, and their dimensions are reduced using KPCA. The integrated attributes after the analysis and calculation can reduce the computational load and improve the accuracy of the state monitoring, and the aging state of the power module is accurately evaluated by the multi-dimensional grey model using the integrated attributes. Thereby, the monitoring and evaluation of the operating state of the power module is realized, and the reliability of the operation of the entire new energy system is improved.
The rest of this study is organized as follows: Section 2 covers Materials and Methods, which establishes the temperature cycle accelerated aging test, introduces the KPCA and the modeling process of grey model; Section 3 is the Results section of this paper, which provides the results of the state monitoring, the three comprehensive characteristic vectors using KPCA and IGBT aging evaluation results obtained by using the grey model. Section 4 provides the Discussion of this article, highlighting the outstanding contributions of this paper compared to previous studies. Section 5 gives the Conclusions of this paper.

2. Materials and Methods

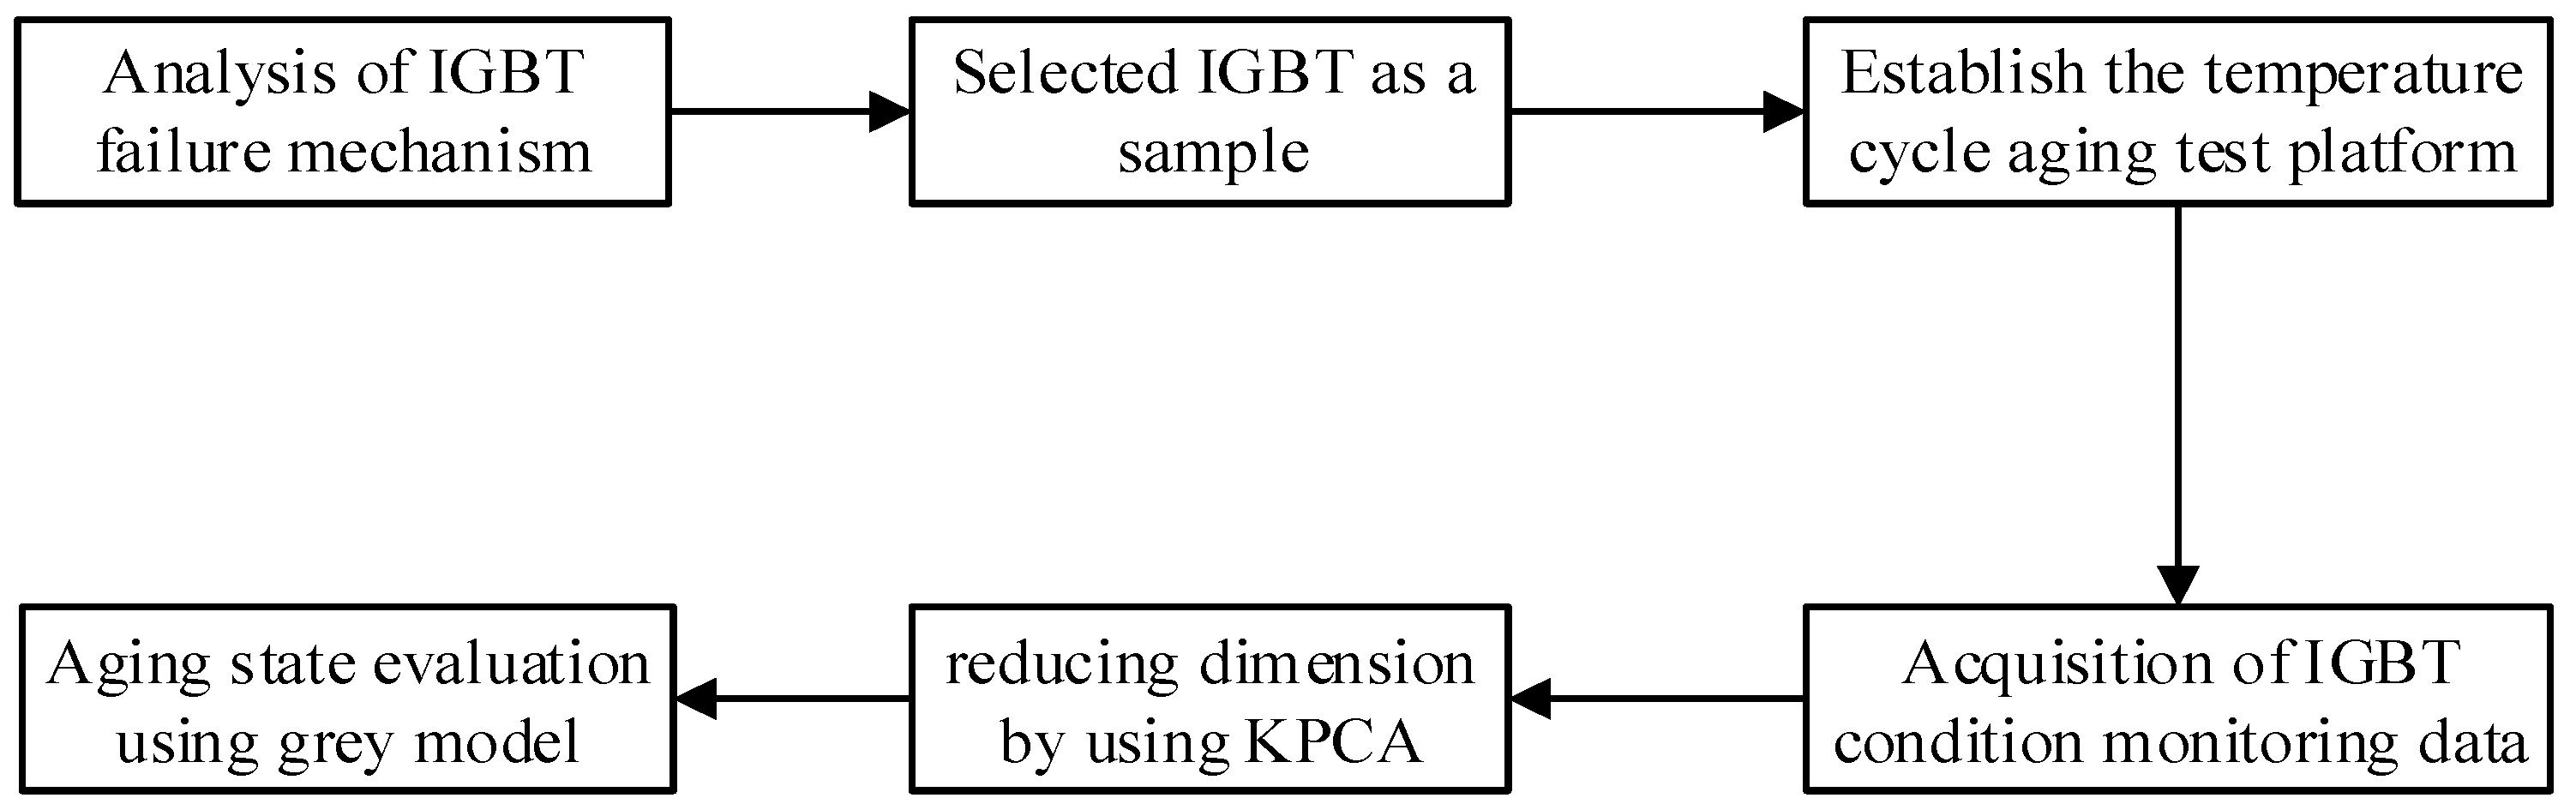
This section introduces the Power module failure mechanism, ageing test platform, the KPCA method and the grey model modeling process required for data processing. The specific research route of this paper is shown in Figure 1.

2.1. IGBT Power Module Failure Mechanism

The failure mechanism of power modules is the basis of condition monitoring, and the failure rate of the converter equipment caused by the failed Power module is relatively high [18]. In applications, the power modules are typically combined with a diode to form a converter circuit that achieves a certain function. A double-packaged IGBT power module is showed in Figure 2.
The module package structure provides the function of the IGBT chip and the external connection, heat transfer, insulation and other functionalities. Therefore, the failure of the Power module involves multiple factors, such as electrical, thermal, and mechanical factors, among other modes. Such failure is a result of interaction between the internal fatigue accumulation and the external operating environment. Previous reports have reviewed the failure mechanisms of Power modules [19]. According to the surveyed failure causes, failure of the power module is subdivided into failure of the package and failure of the chip.
We first address package-related failure. The profile of a Power module is shown in Figure 3, illustrating the multi-layer packaging structure. Due to the special structure of the Power module and the difference between the thermal expansion coefficients of different packaging materials, the module is expected to ultimately fail from bond wire fracture or from a temperature increase after the material fatigues from long-term thermal shock. If cracks and voids are generated in the welding layer or bond wire during the manufacturing process, fatigue of the packaging material is accelerated.
Figure 2 and Figure 3 show that the IGBT chip in the module is connected to the port through an aluminum wire, which is one of the weakest links in the power module. Bond wire failure is typically caused by thermal stress, mechanical stress, bonding pressure or cracks on the interface between chips. With continuous power cycling, the effect of the bond wire binding continues to accumulate and spread and ultimately surpasses the welding capacity, leading to welding bond wire liftoff.
Chip-related failure, the second subclass of module failure, is a process of accumulation and development. The main reasons for the failure of the chip are electrical stress, static charge, the latch-up effect, and hot carrier injection. When failure occurs, the external characteristics of the power module are altered. State monitoring technology can capture and analyze the external characteristics to determine the health status of the Power module. Ciappa et al. [20] noted that an increase in Vce (SAT) is an important indication to evaluate the failure of an IGBT; a 5% increase has been used as the criterion of failure. This test also uses this standard to evaluate the failure of the power module.

2.2. The Temperature Cycle Accelerated Aging Test Platform of IGBT

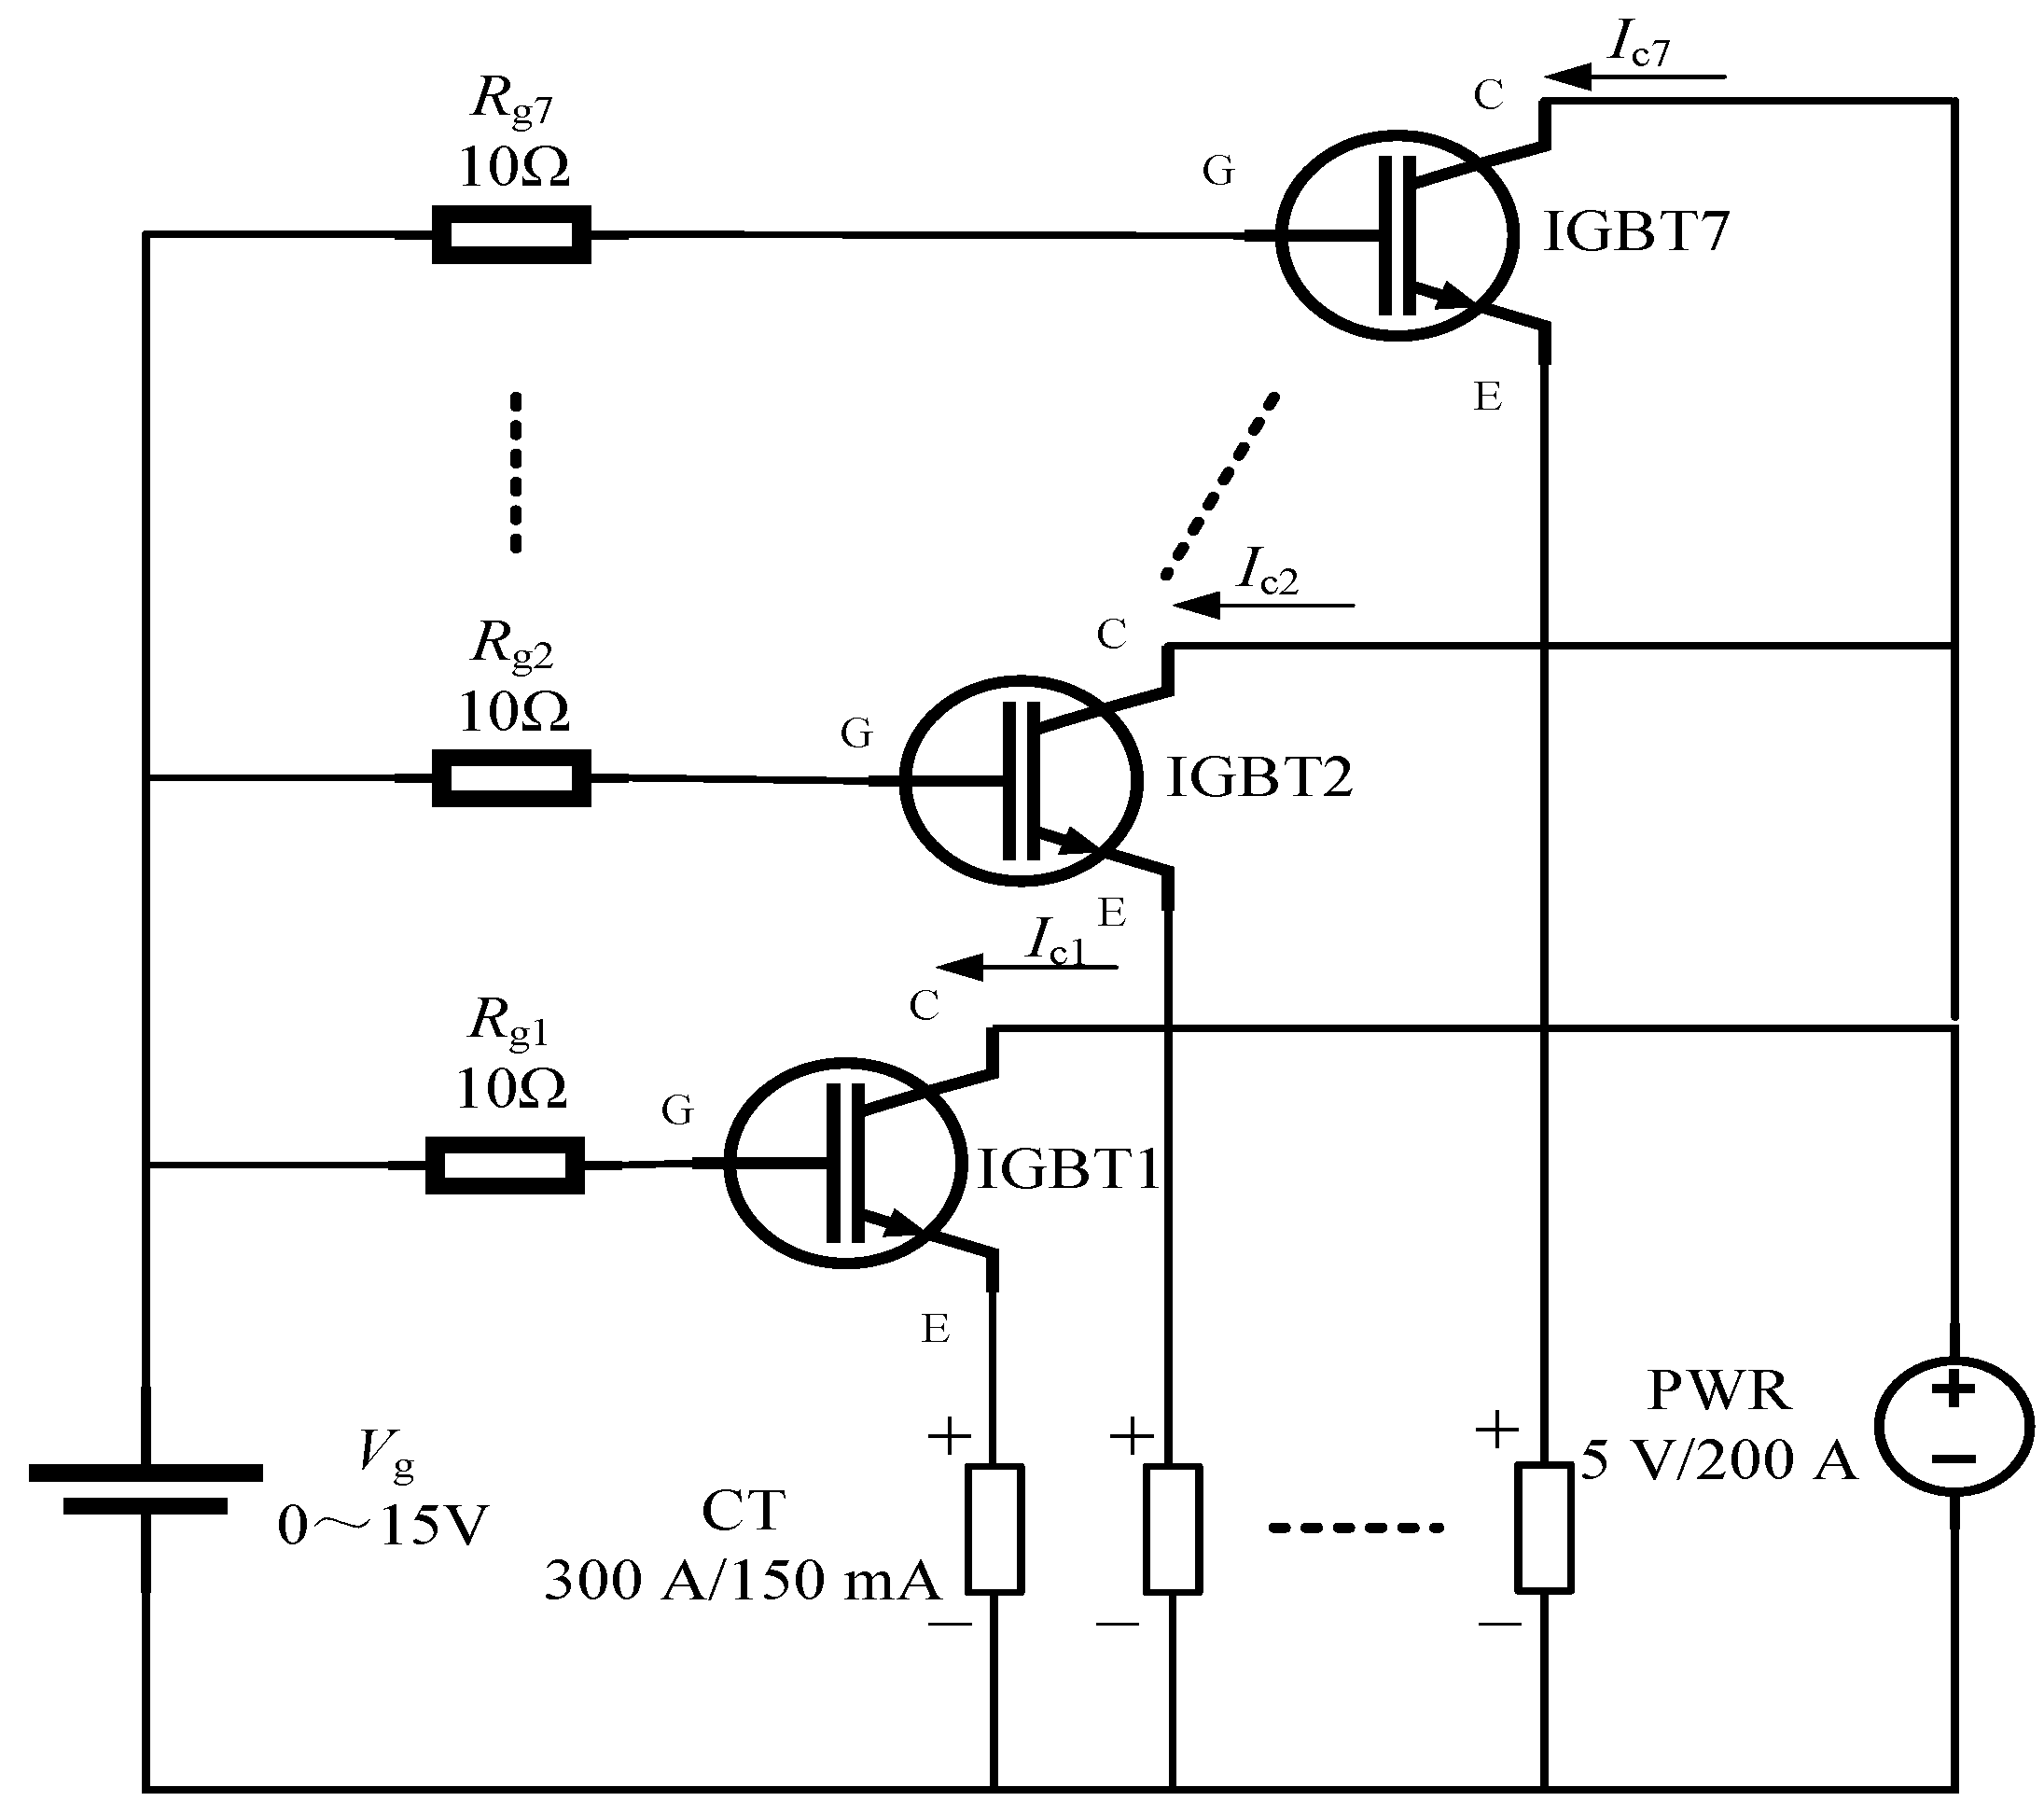
In the test, seven groups of power modules are connected in parallel to realize the accelerated aging of a Power module. The power module life is as long as 10 years; thus, age testing under normal operating conditions is unrealistic. Therefore, this test consists of an accelerated thermal cycle aging test using an IGBT chip from the MACMIC Company (the company is located in ChangZhou, JiangSu, China), whose model is MMG75S120B6HN and whose rating is 1200 V/75 A. The test circuit is shown in Figure 4.
Figure 4 indicated the IGBT denotes the tested power module; PWR is the programmable power supply (5 V/300 A); Vg is the gate signal (0–15 V) provided by the programmable power supply; Rg is the series resistance of the G pin (10 Ω/2 W); and CT is the current transformer (0–300 A). The test procedure is as follows:
(1)
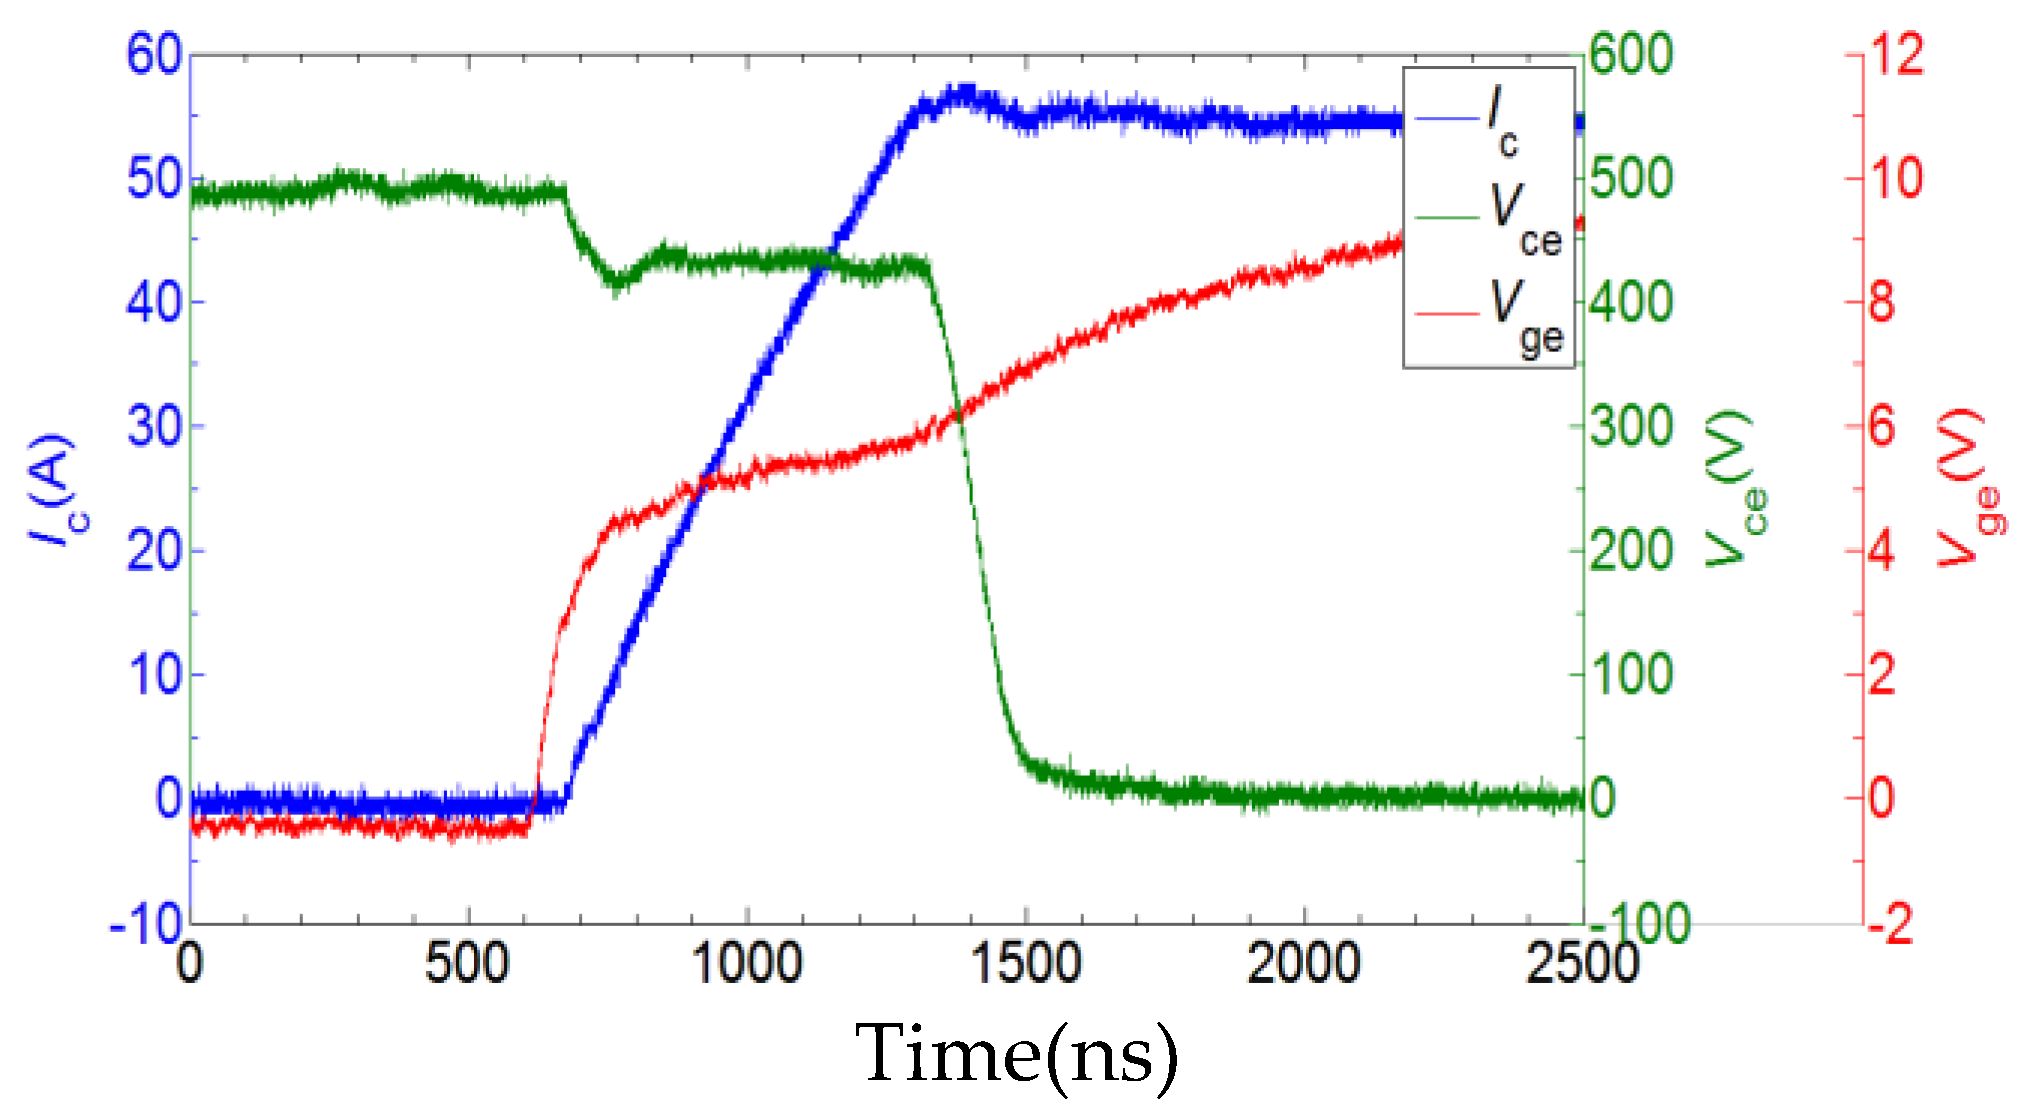
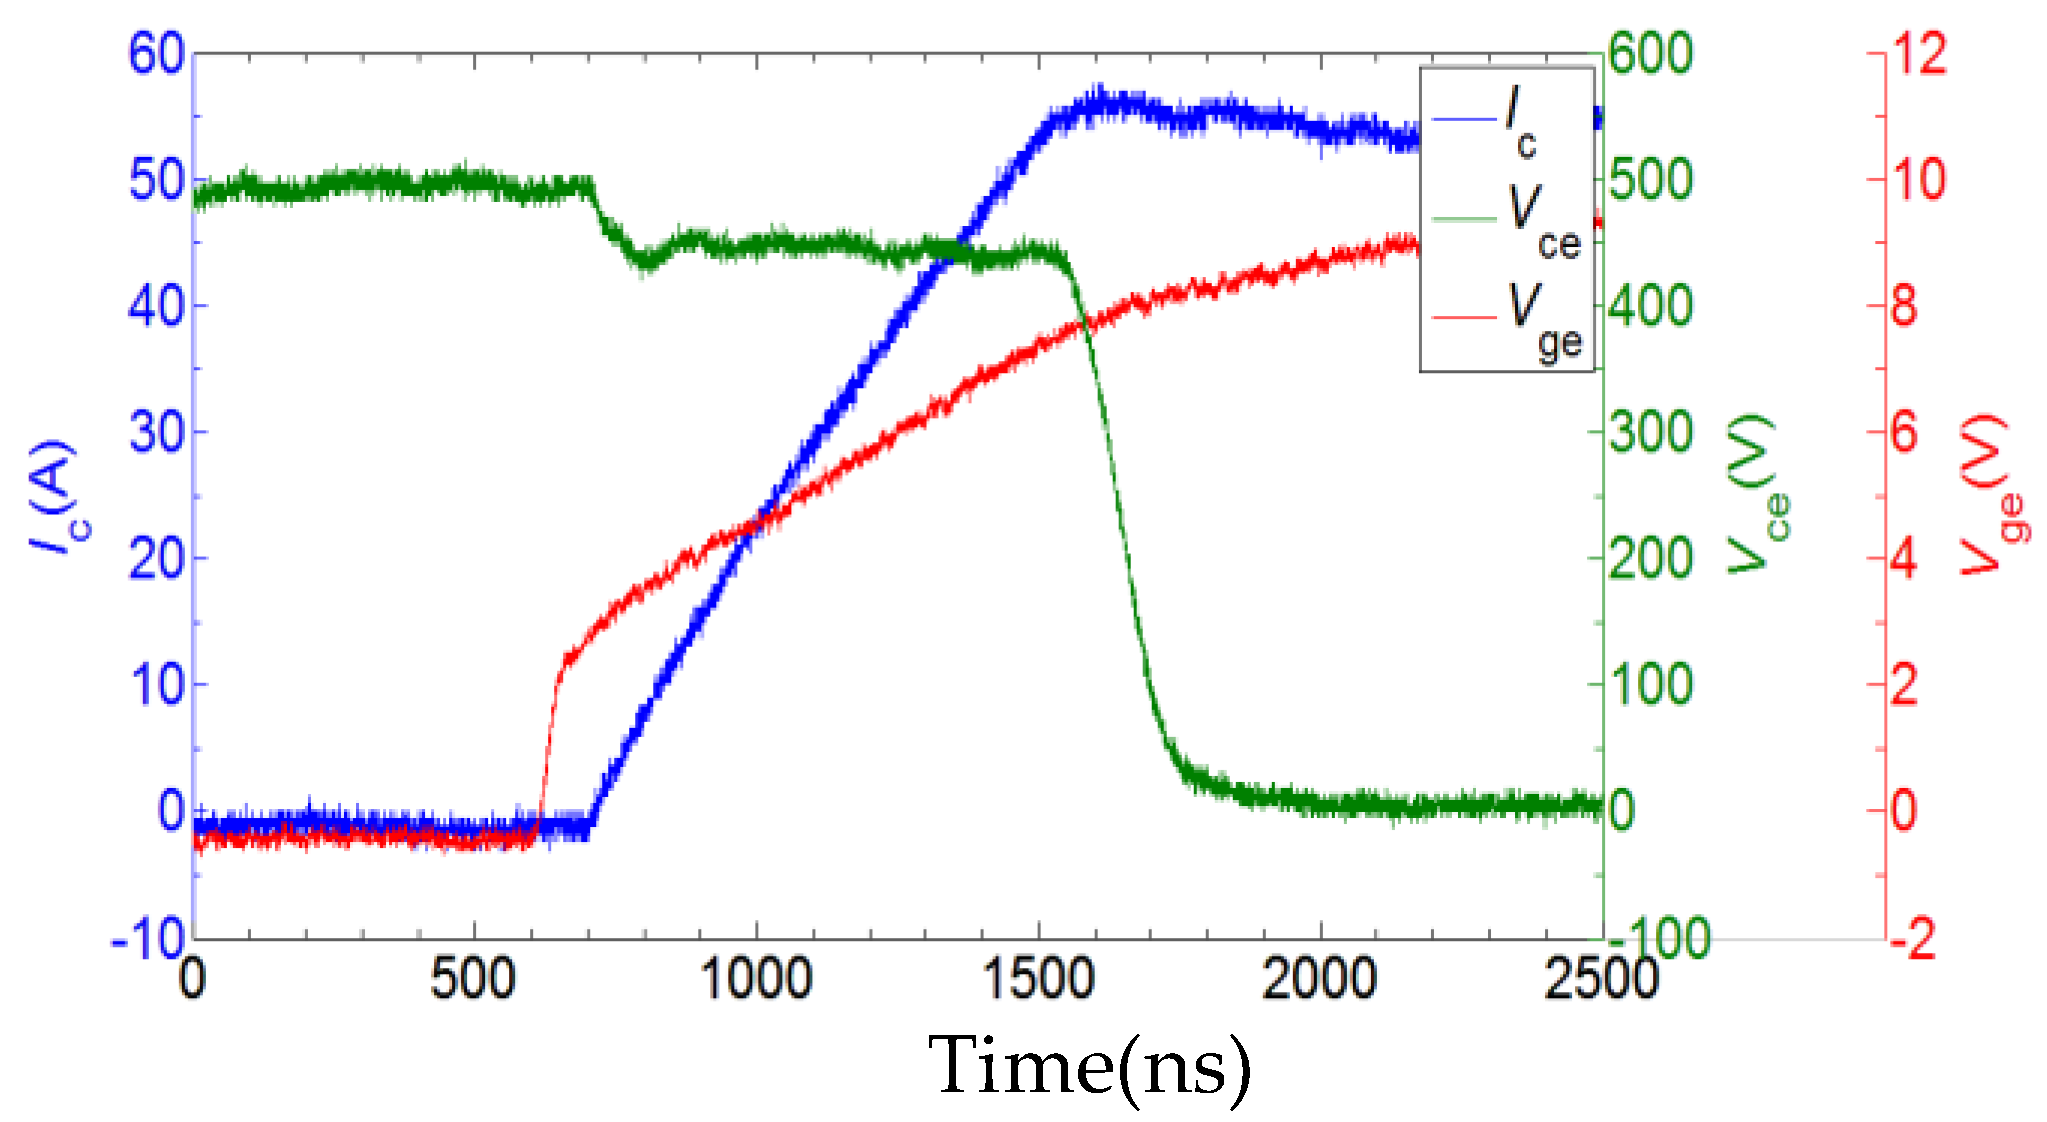
Test the new IGBT device to measure the dynamic waveform of the switch as characterized by Vge, Vce, and Ic, among other parameters.
(2)
Perform the thermal cycle aging test of the power module using the following test conditions: the supply voltage (Vdd) is 75.00 V, the clamping voltage (Vc1) is 450.00 V, the collector current (Ic) is 60 A, the gate pulse width (Pulse) is 20.0 µs, the gate voltage (Vge) is 15.0 V, and the gate series resistance (Rg) is 10 Ω. After the circuit is turned on and the temperature rises to 100 °C, the circuit is cut off, and the module is cooled using a fan; when the temperature drops to 50 °C, the circuit is turned on again.
(3)
After every 1000 cycles, test the power module again to obtain the attributes listed in step (1).
(4)
When the power module fails, stop the test.
During the test, the number of cycles, number of samples, running time, Ic, Vce, Vge and case temperature in each power module and each cycle are recorded. In addition, the dynamic performance of the power module is tested after every 1000 cycles. The purpose of the thermal cycling test is to assess the power module’s ability to withstand short-term temperature changes considering the thermal matching performance between various structural materials. The defects of the power module exposed the defects in package hermeticity, bond wire failure, weak tube core welding, silicon cracks, and thermal defects of the PN junction.

2.3. Kernel Principal Component Analysis

KPCA is an effective tool for dimensionality reduction and is a nonlinear generalization of the principal component analysis [21]. The proposed method is used to reduce the feature parameters of the IGBT module of the aging process.
The input of the system is specified using the d × N matrix X = [ x 1 , x 2 , , x N ] , implying that the number of data sets is N and the dimension of each data set is d, representing d attributes. The goal of the KPCA is to use a K-dimensional data set to represent the original d-dimensional data.
Φ : X d F is defined as a mapping, in which the F is a representation of the Hilbert functional space. Φ ( x i ) , i = 1 , 2 , , n implements the mapping from the input space to the feature space. In the feature space, this study assumed that the mapped data is centered. The covariance matrix is defined as follows.
C ¯ = 1 N Φ ( x i ) Φ ( x i ) T = 1 N Φ ( X ) Φ ( X ) T
This study obtained the performing eigenvalue decomposition
U = [ u 1 , u 2 , , u a ]
C ¯ U = U Λ C ¯ = U Λ U T
C ¯ u a = λ a u a
where, λ a is a characteristic value of C ¯ , and its feature vector is u a , which is expanded into the following form.
u a = i = 1 N α i a Φ ( x i )
where, α i a = x i T u λ a .
Defining K i j = Φ ( x i ) , Φ ( x j ) = Φ ( x i ) T Φ ( x j ) , then K α a = λ a K α a , in which λ a K = N λ a . Therefore, u a is obtained by calculating the eigenvector αa of matrix K. In the projection of principal components, only matrix U is needed. Assuming that the new data is t, the projection of t in the u a direction is
u a T = i = 1 k α i a K ( x i , t )
If the covariance matrix is not centered, then the matrix K is centered to KC, thus avoiding the computation of Φ ( x i ) . Assuming that Φ i C = Φ i 1 N k = 1 N Φ k , this study found that Φ i = Φ ( x i ) ; 1 N is an N × N matrix, whose elements are all 1 / N :
K C = K 1 N l = 1 N K i l 1 N k = 1 N K k t + 1 N 2 k = 1 N l = 1 N K k l
The contribution rate of the principal component λ k is λ k / i = 1 n λ i , and the cumulative contribution rate (CCR) of the first k principal components is i = 1 k λ i / i = 1 n λ i .
The size of the contribution rate of the principal component represents the amount of information carried by the principal element. If the CCR of the first k principal components reaches 90%, then the k principal element can represent 90% of the information from the original data.

2.4. Establishment of Grey Theory Model

This study presented the integrated attributes obtained in different aging states belonging to the case of less data and poor information, while the grey theory is a method to research the problems of less data, poor information and uncertainty. The grey theory is usually used to study small samples or uncertain systems with some information known and some information unknown [22]. Through the change and generation of the known information of the original part, the law of grey theory is mined to realize the description and prediction of the future of the system. Therefore, a multi-dimensional grey theory model is established to predict the aging number N, and then the aging state of the power module is evaluated. The modeling process of GM (1, n) is as follows
Set the original sequence to have n attributes, and each attribute corresponds to the sequence of m groups data.
{ x i ( 0 ) ( k ) } ( k = 1 , 2 , , m ; i = 1 , 2 , , n )
The original sequence x i ( 0 ) ( k ) is accumulated to generate a new data sequence x i ( 1 ) ( k )
x i ( 1 ) ( k ) = j = 1 k x i ( 0 ) ( j )
Let z 1 ( 1 ) ( k ) be a generated sequence from the nearest mean of sequence x 1 ( 1 ) ( k )
z 1 ( 1 ) ( k ) = 0.5 x 1 ( 1 ) ( k ) + 0.5 x 1 ( 1 ) ( k 1 ) , k = 2 , 3 , , n
Then, the data matrix B and the vector matrix y n expressed as follows
B = [ Z 1 ( 1 ) ( 2 ) x 2 ( 1 ) ( 2 ) x n ( 1 ) ( 2 ) Z 1 ( 1 ) ( 3 ) x 2 ( 1 ) ( 3 ) x n ( 1 ) ( 3 ) Z 1 ( 1 ) ( m ) x 2 ( 1 ) ( m ) x n ( 1 ) ( m ) ]
y n = [ x 1 ( 1 ) ( 2 ) , x 1 ( 0 ) ( 3 ) , , x 1 ( 0 ) ( 3 ) ] T
The parameter identification package P n = ( a , b 2 , b 3 , , b n ) is
P n = [ a b 2 b 3 b n ] = ( B T B ) 1 B T y n
The prediction model is expressed as
x ˆ 1 ( 0 ) ( k ) = i = 2 m b i x i ( 1 ) ( k ) a z 1 ( 1 ) ( k )
The accuracy error of the model is presented
e ( k ) = | x ˆ 1 ( 0 ) ( k ) x 1 ( 0 ) ( k ) | x 1 ( 0 ) ( k ) × 100 %
According to the above process, because the input variables obtained in this paper are three comprehensive characteristic vectors, the GM (1, 3) is built in Matlab 2016a, which lays a foundation for the assessment of the aging state of the IGBT in Section 3.3.

3. Results

In this section, the KPCA method is used to process multiple parameters collected during the aging test. The characteristic variables are selected to indicate the aging state of the IGBT module during aging. Finally, using this integrated variable, the aging state of the IGBT was evaluated by the established grey model.

3.1. Switching Time

The IGBT turn-on process is divided into three sections: ton = td(on) + tir + tvf. Among these, td(on) is the turn-on delay time from the time point when Vge rises to 10% of its final amplitude to the time point when Ic reaches 10% of its final amplitude, tir is the current rise time from the time point when Ic reaches 10% of its final amplitude to the time point when Icm reaches 90% of its final value, and tvf is the voltage drop time, which is the Vce decreased time.
The IGBT turn-off process is divided into two sections: toff = td(off) + tif. The parameter td(off) is the turn-off delay time from the time point when Vge is reduced to 90% of its earlier amplitude to the time point when Ic decreases to 90% of its earlier amplitude, and tif is the current fall time after Ic begins to decline after MOSFET exit saturation. Figure 5 shows the turn-on waveform of a new IGBT module, and Figure 6 shows the turn-on waveform of a power module failed.
Through observation and comparison, this study determined that the rate of increase of Ic was lower in the waveform of a power module failed than in that of a new one. Furthermore, the parameters presented in Table 1 are calculated using the dynamic waveform.
Figure 7 shows the change in the switching time with the cycle times. The change trend of the switching parameters in the thermal cycle test is relatively small, but an accelerated rise emerges just before the failure of the IGBT module.

3.2. Switching Losses

The power loss in the power module includes conduction losses and switching losses. The switching loss is one of the main contributors to power loss in the power modules. Excessive temperature is caused by excessive switching losses, affecting the power module reliability. The calculation methods for switching losses is divided into physical and mathematical methods. Physical methods build a physical model with simple components to simulate the power module in simulation software, allowing the switching voltage and current to be calculated. Mathematical methods include various schemes to calculate the switching losses. The following formulas are used to calculate the switching losses.
E on = 0 t on I c ( t ) V ce ( t ) d t
E off = 0 t off I c ( t ) V ce ( t ) d t
where, Eon is the opening loss, Eoff is the off loss, ton is the turn-on time, toff is the turn-off time, Vce is the collector-emitter voltage, and Ic is the collector current. Table 2 shows the IGBT module switching loss for every 1000 thermal cycles as calculated using the measured data. Since the switching loss varies with the switching frequency and the ambient temperature, the switching frequency and the ambient temperature are kept constant in the thermal test. Figure 8 shows the change trend of the switching loss.

3.3. IGBT Gate Signal

The difference in the gate signals in the aging process is caused primarily by the Miller platform. With the aging of the power module, the IGBT Miller capacitance and Miller platform change with a decreasing tendency. Figure 9 compared the gate signal waveform for various aging cycles during the aging process.
The Miller platform is formed as a result of the Miller effect. The Miller effect refers to the phenomenon in which Cgc is fed back to the gate through the gate collector capacitance Vce in the process of IGBT turn-on. The Cgc is also called the Miller capacitance. The Miller effect occurs when the variation in the Vce is equivalent to the internal current source of the bias circuit. The size of the effect is
i g = C gc ( V ce ) × d V ce / dt
The magnitude of Cgc in Equation (16) is a function of the independent attribute Vce. A simplified IGBT equivalent circuit is shown in Figure 9 [23]. The modulation voltage of the base resistance and the turn-on voltage of the IGBT internal diode are not considered. Therefore, this study assumes that the depletion region D and collector C are equivalent and that the source S is equivalent to the emitter E. Figure 10 presents that the depletion layer region is characterized by the gate depletion layer capacitance Cgd. At each IGBT turn-on time point, the number of carriers in the region varies greatly; thus, the region is the weakest point of the IGBT.
Figure 10 presented the gate depletion layer capacitance Cgd which consists of a depletion layer capacitance Cdep and stacked oxide capacitor Coxd, which are connected in series [24]. The formula for Cdep is given in Equation (17) [25].
C dep = A gd q N B ε si 2 ( V ds V gs )
where, Agd is the area of the gate depletion layer, ε si is the silicon dielectric constant, NB is the base doping concentration, and q is the charge quantity of the gate depletion region. With the aging of the IGBT module, the size of Agd, q and NB change, which ultimately affects the magnitude of Cdep. Since D and C are equivalent, S and E are also equivalent; thus, CgdCgc, VdsVce, and VgsVge. For a given IGBT module,
C gc = C oxd C dep C oxd + C dep
C dep = A gd q N B ε si 2 ( V ce V ge )
Figure 5 indicates that, in the turn-on stage of the IGBT, Vce is much greater than Vge. As the IGBT opens, Vce is at a high level, and Vge is either 0 or a negative voltage. Since the gate has a constant charging current, the gate voltage Vge increases linearly. When Vce drops, the gate bias current is used to charge Cgc, and the gate voltage remains constant. Then, when Vce drops and Cgc changes, the bias current disappears. Ultimately, the charging current becomes smaller than the bias current; thus, Vge continues to rise. This process forms the Miller platform of the IGBT opening phase.
The time it takes for Vge to rise to 4.3 V was selected as a characteristic value and is represented as t4.3 to compare the differences in the gate-switching signal Vge for various aging cycles. Table 3 records the threshold time t4.3 for various aging cycles.
Figure 11 showed the change trend of the threshold time t4.3. The change of the Miller platform is more prominent during early aging than it is closer to IGBT module failure.

3.4. Temperature Rise Rate

The switching and conduction losses increase with the aging of the IGBT module as a result of the change in the stray inductance parameters. The increase of the power loss affects the junction and case temperatures. In addition, with the aging of the IGBT module, the thermal resistance also changes, which affects both the junction and case temperature trends. In the test, heat dissipation in the IGBT module is achieved using a cooling fan with a constant speed. The temperature in the laboratory is constant (25 °C); thus, the performance of the heat dissipation for each thermal cycle is considered constant. Figure 12 shows the temperature variation of a single cycle during the IGBT cycle test. The device collector case temperature is shown at approximately every two seconds.
As can be seen from Figure 12, the temperature changes of a single temperature cycle with 1000 cycles, 3000 cycles, and 6000 cycles are collected. It can be found that as the number of power cycles increases, the time during which the temperature rise reaches the peak is less, and the speed at which it rises and the temperature at which the temperature drops eventually stabilizes are also accelerated.
Here, the temperature rise rate of each cycle is defined as
U T = Δ T t u
where, Δ T is the temperature range for each cycle. In this test, the variation range of the temperature during each cycle is from 50 °C to 100 °C, or 50 °C. The parameter t u is the time required for the temperature to reach its peak in each cycle. The temperature rise rate with the aging cycles was calculated and is presented in Figure 13.
Figure 13 showed that the rate of increase of the IGBT module case temperature tends to rise with additional aging cycles. The rate of temperature increase calculated after every 1000 cycles is reported as the mean value of the nearby numbers to reflect the true situation.
Table 4 indicates that the temperature rise rate increases with the number of thermal cycles, which means that with the aging of the IGBT module, both the switching loss and the thermal resistance increase.

3.5. On-State Voltage Drop of Collector-Emitter

A collector-emitter voltage drop Vce (SAT) increase of 5% is used as a failure criterion for the power module. Therefore, Vce (SAT) is an important index to characterize the aging state. For different Ic and junction temperatures Tj, the value of Vce (SAT) is varied. In the conditions of this test, the measured values of Vce (SAT) under various aging conditions are given in Table 5. Figure 14 shows the change trend of Vce (SAT) during the aging process. The test shows that Vce (SAT) does not increase gradually but rather increases suddenly, and immediately before failure occurs.
Figure 14 shows the trend of Vce (SAT) during the aging of IGBT. It can be seen that the value of Vce (SAT) is not obvious before the number of aging tests reaches 6000 times. It suddenly increases linearly before 7000 times. The on-state voltage drop can reflect the failure condition of the IGBT, and its value will suddenly increase in the event of a near failure. From this figure, it can be judged that the IGBT module fails when the number of power cycles reaches 7000.

3.6. Data Processing Results Based on KPCA

Table 6 shows the aging parameters of each group of thermal cycles. Two typical kernel functions of the kernel principal component are used to obtain an improved dimensionality reduction effect. The kernel functions are a polynomial (Poly) and Gauss radial basis function (rbf). The method for the polynomial kernel function symbol is Poly with a kernel parameter of 2. Gauss rbf methods are symbolized as Rbf1 and Rbf2, with the kernel parameters of 300 and 700.
The comparison of the contribution rates of each principal component after the calculation is shown in Table 7. The eigenvalue (λi) cumulative contribution rate is designated the CCR.
Table 7 shows that the three methods for the KPCA all achieve excellent results. The polynomial kernel function obtains a first principal component contribution rate of over 90%; the third and fourth CCRs are as high as 100%. Considering the dimensionality reduction and the calculation speed, the Rbf2 method is used to reduce the aging state data. The feature attributes of the first three principal components are selected as the input data of the next step. The data from Table 6 was processed using Rbf2, and the results are shown in Table 8.

3.7. Aging State Assessment of IGBT Based on Grey Model

In this section, using the established multi-dimensional grey model GM(1,3), and the feature attributes of the first three principal components (which are selected as the input data of the next aging assessment to evaluate the aging state of the power module), the predicted values are obtained and shown in Table 9.
The average error between the actual values and the predicted values of the IGBT aging number is e ¯ = i = 1 8 e ( i ) = 1.176 % .
The curve comparison between the predicted value and the real value obtained by the grey model is shown in Figure 15.
Figure 15 presented that the average error between the temperature cycle number N predicted by the multi-dimensional grey model and the actual values is only 1.176%. Therefore, the multi-dimensional grey model GM (1, 3) can predict the temperature cycle number N accurately, and the IGBT aging state is accurately evaluated.

4. Discussions

Achieving sustainable development is the permanent theme of human society. The new energy industry is an important road to achieving sustainable development of mankind, and it is changing every day. Effective use of new energy sources and improvement of the new energy management system are of paramount importance. As an important core component in the converter, IGBT plays a very important role in the new energy power generation system. Condition monitoring of IGBT is an important aspect to improve the reliability of IGBT. In the previous methods of IGBT condition monitoring, no matter which method is used, a specific electro-thermal parameter is selected as a parameter for monitoring the aging state of IGBT, such as, collector-to-emitter voltage, switching loss, junction temperature, and case temperature. Monitoring the specific state parameter can evaluate the aging state of the IGBT, but there are two shortcomings: (1) The change of the single parameter is difficult to accurately express the failure condition of the IGBT. For example, the collector-emitter voltage will rise suddenly before the IGBT fails. Although this feature can be used to monitor whether the IGBT module is ineffective, it is not obvious in the previous period, so it cannot fully reflect the aging state of the IGBT. (2) Sensor-based condition monitoring and model-based monitoring have large errors. Sensor-based condition monitoring requires the installation of sensors inside the device, which will destroy the package structure of the IGBT and affect measurement accuracy. While the model-based condition monitoring method avoids destroying the package structure of the module, the accuracy of the model has a great influence on the monitoring results. In view of the shortcomings of the above research, this paper builds a temperature cycle aging test platform and proposes a KPCA-based condition monitoring method, which increases the state parameters of the monitored IGBT to five and greatly improves the level of IGBT state monitoring. Using the KPCA method reduces the dimension of the parameters, while alleviating too many data parameters, minimizing information loss and improving the visualization of the data. Three comprehensive characteristic vectors are also beneficial to the aging state evaluation of the IGBT using the grey model. The comparison with the actual aging times also shows that the three sets of integrated variables obtained in this paper are accurate and effective, and can reflect the aging state of the IGBT, which proves the effectiveness of the method.
In the field of actual new energy generation, there are multiple IGBT modules in the converter, and the healthy operation of each module is very important. Therefore, monitoring the state parameters of multiple IGBTs is beneficial to comprehensively grasp the operating state of the IGBT. Once an abnormality of a certain parameter is found, the fault can be found in time to avoid the expansion of the fault and further economic loss. Therefore, the work of this paper can not only evaluate the aging state of IGBT, but also quickly identify the cause of IGBT failure through an abnormality of a certain parameter, which is of great significance for practical industrial applications, and is conducive to the promotion and application of new energy and sustainable development.

5. Conclusions

This study improves the state monitoring capability and effectively evaluates the aging state; the proposed method monitors the working state of the power conversion device in the new energy system and predicts the future working state, which is beneficial to the enterprise to enhance its regulation and management capabilities in the new energy system. After research and analysis of the results, this study draws the following conclusions:
(1) This study analyzed the parameters affecting the aging state. To obtain these attributes, this study is necessary to measure the external characteristics of the power module without measuring the junction temperature, the package of the power module does not have to be destroyed; therefore, the accuracy of the state monitoring is improved and the cost is reduced.
(2) This paper uses KPCA to reduce the dimensionality of multiple variables, which improves the visualization of IGBT power module status monitoring data. It is found that the KPCA using the polynomial kernel function is the best because it compares the cumulative contribution rates under different kernel functions. The integrated attributes obtained by this method can more fully reflect the aging state of the power module.
(3) The IGBT temperature cycle aging number N obtained by the grey model is compared with the actual value, and the error is only 1.176%, which indicates that the aging state of the IGBT is evaluated by the number of temperature cycle aging times N, and the fault conditions of IGBT power module can be further judged by the aging state.
The work done in this paper is to improve the monitoring level of IGBT and thus improve the reliability of IGBT.One remaining aspect to reflect upon consists in how to further improve the monitoring level and achieve an accurate evaluation of the aging state of the IGBT. In the future, it will be an important task to collect a large amount of IGBT state monitoring data at more sampling points and then use the intelligent algorithm with better prediction accuracy to evaluate the aging state of IGBT.

Author Contributions

Conceptualization, B.-Y.L. and G.-S.W.; Formal analysis, G.-S.W. and Z.-G.L.; Methodology, M.-L.T. and K.-J.W.; Supervision, Z.-G.L.; Writing—Original draft, B.-Y.L. and G.-S.W.; Writing—Review & editing, M.-L.T. and K.-J.W.

Funding

This research was funded by the National Natural Science Foundation of China [grant numbers 51475136] and the Key Project of Natural Science Foundation of Hebei Province [grant numbers E2017202284].

Acknowledgments

This work was supported by the National Natural Science Foundation of China [grant numbers 51475136] and the Key Project of Natural Science Foundation of Hebei Province [grant numbers E2017202284].

Conflicts of Interest

The authors declare no conflict of interest.

References

  1. Alhmoud, L. Reliability Improvement for a High-Power IGBT in Wind Energy Applications. IEEE Trans. Ind. Electron. 2018, 65, 7129–7137. [Google Scholar] [CrossRef]
  2. Ning, G.; Chen, W.; Shu, L.; Guang, Y.Q. A Hybrid Resonant ZVZCS Three-Level Converter forMVDC-Connected Offshore Wind Power Collection Systems. IEEE Trans. Power Electron. 2018, 33, 6633–6645. [Google Scholar] [CrossRef]
  3. Pedersen, K.B.; Brincker, M.; Ghimire, P. Monitoring of IGBT Modules-Temperature and Degradation Simulation. In Proceedings of the CIPS 2016, 9th International Conference on Integrated Power Electronics Systems, Nuremberg, Germany, 8–10 March 2016. [Google Scholar]
  4. Yang, S.; Xiang, D.; Bryant, A. Condition Monitoring for Device Reliability in Power Electronic Converters: A Review. IEEE Trans. Power Electron. 2010, 25, 2734–2752. [Google Scholar] [CrossRef]
  5. Choi, U.M.; Blaabjerg, F.; Munk-Nielsen, S. Reliability Improvement of Power Converters by Means of Condition Monitoring of IGBT Modules. IEEE Trans. Power Electron. 2017, 32, 7990–7997. [Google Scholar] [CrossRef]
  6. Sun, P.; Gong, C.; Du, X. Condition Monitoring IGBT Module Bond Wires Fatigue Using Short-Circuit Current Identification. IEEE Trans. Power Electron. 2017, 32, 3777–3786. [Google Scholar] [CrossRef]
  7. Tian, B.; Qiao, W.; Wang, Z. Monitoring IGBT’s Health Condition via Junction Temperature Variations. In Proceedings of the Applied Power Electronics Conference and Exposition (APEC), 2014 Twenty-Ninth Annual IEEE, Fort Worth, TX, USA, 16–20 March 2014; pp. 2550–2555. [Google Scholar]
  8. Schilling, O.; Schäfer, M.; Mainka, K. Power cycling testing and FE modelling focused on Al wire bond fatigue in high power IGBT modules. Microelectron. Reliab. 2012, 52, 2347–2352. [Google Scholar] [CrossRef]
  9. Xiang, D.; Ran, L.; Tavner, P. Monitoring Solder Fatigue in a Power Module Using the Rise of Case-above-ambient Temperature. IEEE IEEE Trans. Ind. Appl. 2010, 47, 2578–2591. [Google Scholar] [CrossRef]
  10. Xiang, D.W.; Yang, S.Y.; Li, R. Change of Terminal Characteristics of a Voltage Source Inverter (VSI) due to Semiconductor Device Degradation. In Proceedings of the 13th European Conference on Power Electronics and Applications, Barcelona, Spain, 8–10 September 2009; pp. 1–10. [Google Scholar]
  11. Ji, B.; Pickert, V.; Cao, W.P.; Xing, L. Onboard Condition Monitoring of Solder Fatigue in IGBT Power Modules. In Proceedings of the 2013 9th IEEE International Symposium on Diagnostics for Electric Machines, Power Electronics and Drives (SDEMPED), Valencia, Spain, 27–30 August 2013; pp. 9–15. [Google Scholar]
  12. Li, L.L.; Lv, C.M.; Tseng, M.L. Renewable energy utilization method: A novel Insulated Gate Bipolar Transistor switching losses prediction model. J. Clean. Prod. 2018, 176, 852–863. [Google Scholar] [CrossRef]
  13. Choi, U.M.; Blaabjerg, F.; Munk-Nielsen, S.; Jorgensen, S.; Rannestad, B. Reliability Improvement of Power Converters by Means of Condition Monitoring of IGBT Modules. IEEE Trans. Power Electron. 2016, 32, 7990–7997. [Google Scholar] [CrossRef]
  14. Bęczkowski, S.P.; Ghimre, A.R.; Vega, D.; Munk-Nielsen, S.; Rannestad, B. Online Vce Measurement Method for Wear-Out Monitoring of High Power IGBT Modules. In Proceedings of the 15th European Conference on Power Electronics and Applications (EPE), Lille, France, 3–5 September 2013; pp. 1–7. [Google Scholar]
  15. Li, L.L.; Zhang, X.B.; Tseng, M.L.; Han, Y. Sustainable energy saving: A junction temperature numerical calculation method for power insulated gate bipolar transistor module. J. Clean. Prod. 2018, 185, 198–210. [Google Scholar] [CrossRef]
  16. Riedel, G.; Valov, J.M. Simultaneous Testing of Wirebond and Solder Fatigue in IGBT Modules. In Proceedings of the CIPS 2014, 8th International Conference on Integrated Power Electronics Systems, Nuremberg, Germany, 25–27 February 2014. [Google Scholar]
  17. Denk, M.; Bakran, M.M.; Schafferhans, S. Case Sensitive Condition Monitoring of an IGBT Inverter in a Hybrid Car. In Proceedings of the CIPS 2016, 9th International Conference on Integrated Power Electronics Systems, Nuremberg, Germany, 8–10 March 2016; pp. 1–6. [Google Scholar]
  18. Kostandyan, E.E.; John, D.; Rensen, S. Reliability Assessment of Solder Joints in Power Electronic Modules by Crack Damage Model for Wind Turbine Applications. Energies 2011, 4, 2236–2248. [Google Scholar] [CrossRef] [Green Version]
  19. Breglio, G.; Irace, A.; Napoli, E. Experimental Detection and Numerical Validation of Different Failure Mechanisms in IGBTs During Unclamped Inductive Switching. IEEE Trans. Electron Devices. 2013, 60, 563–570. [Google Scholar] [CrossRef]
  20. Ciappa, M. Selected failure mechanism of modern power modules. Microelectron. Reliab. 2002, 42, 653–667. [Google Scholar] [CrossRef]
  21. Rodriguez-Blanco, M.A.; Claudio-Sanchez, A.; Theilliol, D.; Aguayo, J.A. Failure-Detection Strategy for IGBT Based on Gate-Voltage Behavior Applied to a Motor Drive System. IEEE Trans. Ind. Electron. 2011, 58, 1625–1633. [Google Scholar] [CrossRef]
  22. Yu, C.; Yuan, J.S.; Yang, H. MOSFET linearity performance degradation subject to drain and gate voltage stress. IEEE Trans. Device Mater. Reliab. 2005, 4, 681–689. [Google Scholar] [CrossRef]
  23. Hefner, A.R., Jr.; Blackburn, D.L. An analytical model for the steady-state and transient characteristics of the power insulated-gate bipolar transistor. Solid State Electron. 1988, 31, 1513–1532. [Google Scholar] [CrossRef]
  24. Hoffmann, H. Kernel PCA for novelty detection. Pattern Recognit. 2006, 40, 863–874. [Google Scholar] [CrossRef]
  25. Xu, N.; Dang, Y.; Gong, Y. Novel grey prediction model with nonlinear optimized time response method for forecasting of electricity consumption in China. Energy 2017, 118, 473–480. [Google Scholar] [CrossRef]
Figure 1. The research flow chart of this paper.
Sustainability 10 03644 g001
Figure 2. IGBT power module shape and internal structure.
Sustainability 10 03644 g002
Figure 3. IGBT power module packaging structure profile.
Sustainability 10 03644 g003
Figure 4. Circuit diagram of the power module accelerated aging test.
Sustainability 10 03644 g004
Figure 5. Turn-on waveform of a new IGBT module.
Sustainability 10 03644 g005
Figure 6. Turn-on waveform of a power module failed.
Sustainability 10 03644 g006
Figure 7. Change in the switching time with the number of cycles.
Sustainability 10 03644 g007
Figure 8. Variation in the switching loss with the cycle time.
Sustainability 10 03644 g008
Figure 9. Comparison of the switching signals for various aging stages.
Sustainability 10 03644 g009
Figure 10. Equivalent circuit of the IGBT seen from the gate to the emitter.
Sustainability 10 03644 g010
Figure 11. The trend of t4.3 with the cycle time.
Sustainability 10 03644 g011
Figure 12. Temperature variation of a single thermal cycle.
Sustainability 10 03644 g012
Figure 13. Variation of the temperature rise in each cycle.
Sustainability 10 03644 g013
Figure 14. Variation of the collector-emitter voltage drop at different aging times.
Sustainability 10 03644 g014
Figure 15. Comparison curve between predicted values and actual values.
Sustainability 10 03644 g015
Table 1. IGBT switching time under repeated thermal cycles.
Cycling Timeston(ns)toff
0927.21119.6
1000961.21116.4
2000970.81162.0
3000991.61158.8
40001018.81166.8
50001023.61192.4
60001166.81277.6
70001332.41384.8
Table 2. Switching loss data of IGBT module thermal cycle test.
Cycling TimesEon(mJ)Eoff(mJ)
017.246.49
100017.736.64
200017.947.12
300018.37.2
400018.647.27
500018.657.5
600021.528.18
700024.419.67.
Table 3. Threshold time when Vge reaches 4.3 V at various aging times.
Cycling TimesThreshold Time (ns)
0142
1000162
2000214
3000255
4000283
5000314
6000339
7000356
Table 4. Temperature rising rate of different ageing times.
Cycling TimesRate
00.212
10000.208
20000.224
30000.239
40000.242
50000.244
60000.258
70000.279
Table 5. Collector-emitter voltage drop Vce (SAT) for various aging times.
Cycling TimesVce (SAT)
01.924
10001.914
20001.936
30001.923
40001.947
50001.924
60001.952
70002.108
Table 6. Characteristic parameters of various aging cycles.
TypeSwitching TimeSwitching Losst4.3UTVce(SAT)
0927.21119.617.246.491420.2121.924
1000961.21116.417.736.641620.2081.914
2000970.81162.017.947.122140.2241.936
3000991.61158.818.37.22550.2391.923
40001018.81166.818.647.272830.2421.947
50001023.61192.418.657.53140.2441.924
60001166.81277.621.528.183390.2581.952
70001332.41384.824.419.673560.2792.108
Table 7. Results of the kernel principal component analysis for various parameters and functions.
No.PolyRbf1Rbf2
λiCCRλiCCRλiCCR
12.11 × 10120.9921.8240.6520.3940.908
21.47 × 10100.9990.7650.9250.0370.992
33.22 × 10991.0000.1670.9840.0020.996
45.67 × 1061.0000.0230.9930.0010.999
51.97 × 1061.0000.0150.9982.8 × 10-41.000
Table 8. Comprehensive characteristic vectors of various aging conditions.
TypeV1V2V3
00.23120.28150.3586
1000−0.6933−0.7985−0.6341
2000−0.5414−0.22860.1680
30000.13290.20980.3171
40000.14290.20730.3223
5000−0.1252−0.1400−0.1181
60000.34070.35160.4694
7000−0.05440.0270−0.0488
Table 9. Comparison of predicted values and actual values.
Number12345678
Actual values01000200030004000500060007000
Predicted values01009198730344091484059847058
Error (%)00.9200.6751.1432.2803.2082.2720.837

