Study on Population Distribution Pattern at the County Level of China


Abstract
1. Introduction
2. Methodology
2.1. Data
2.2. Method
- (1)
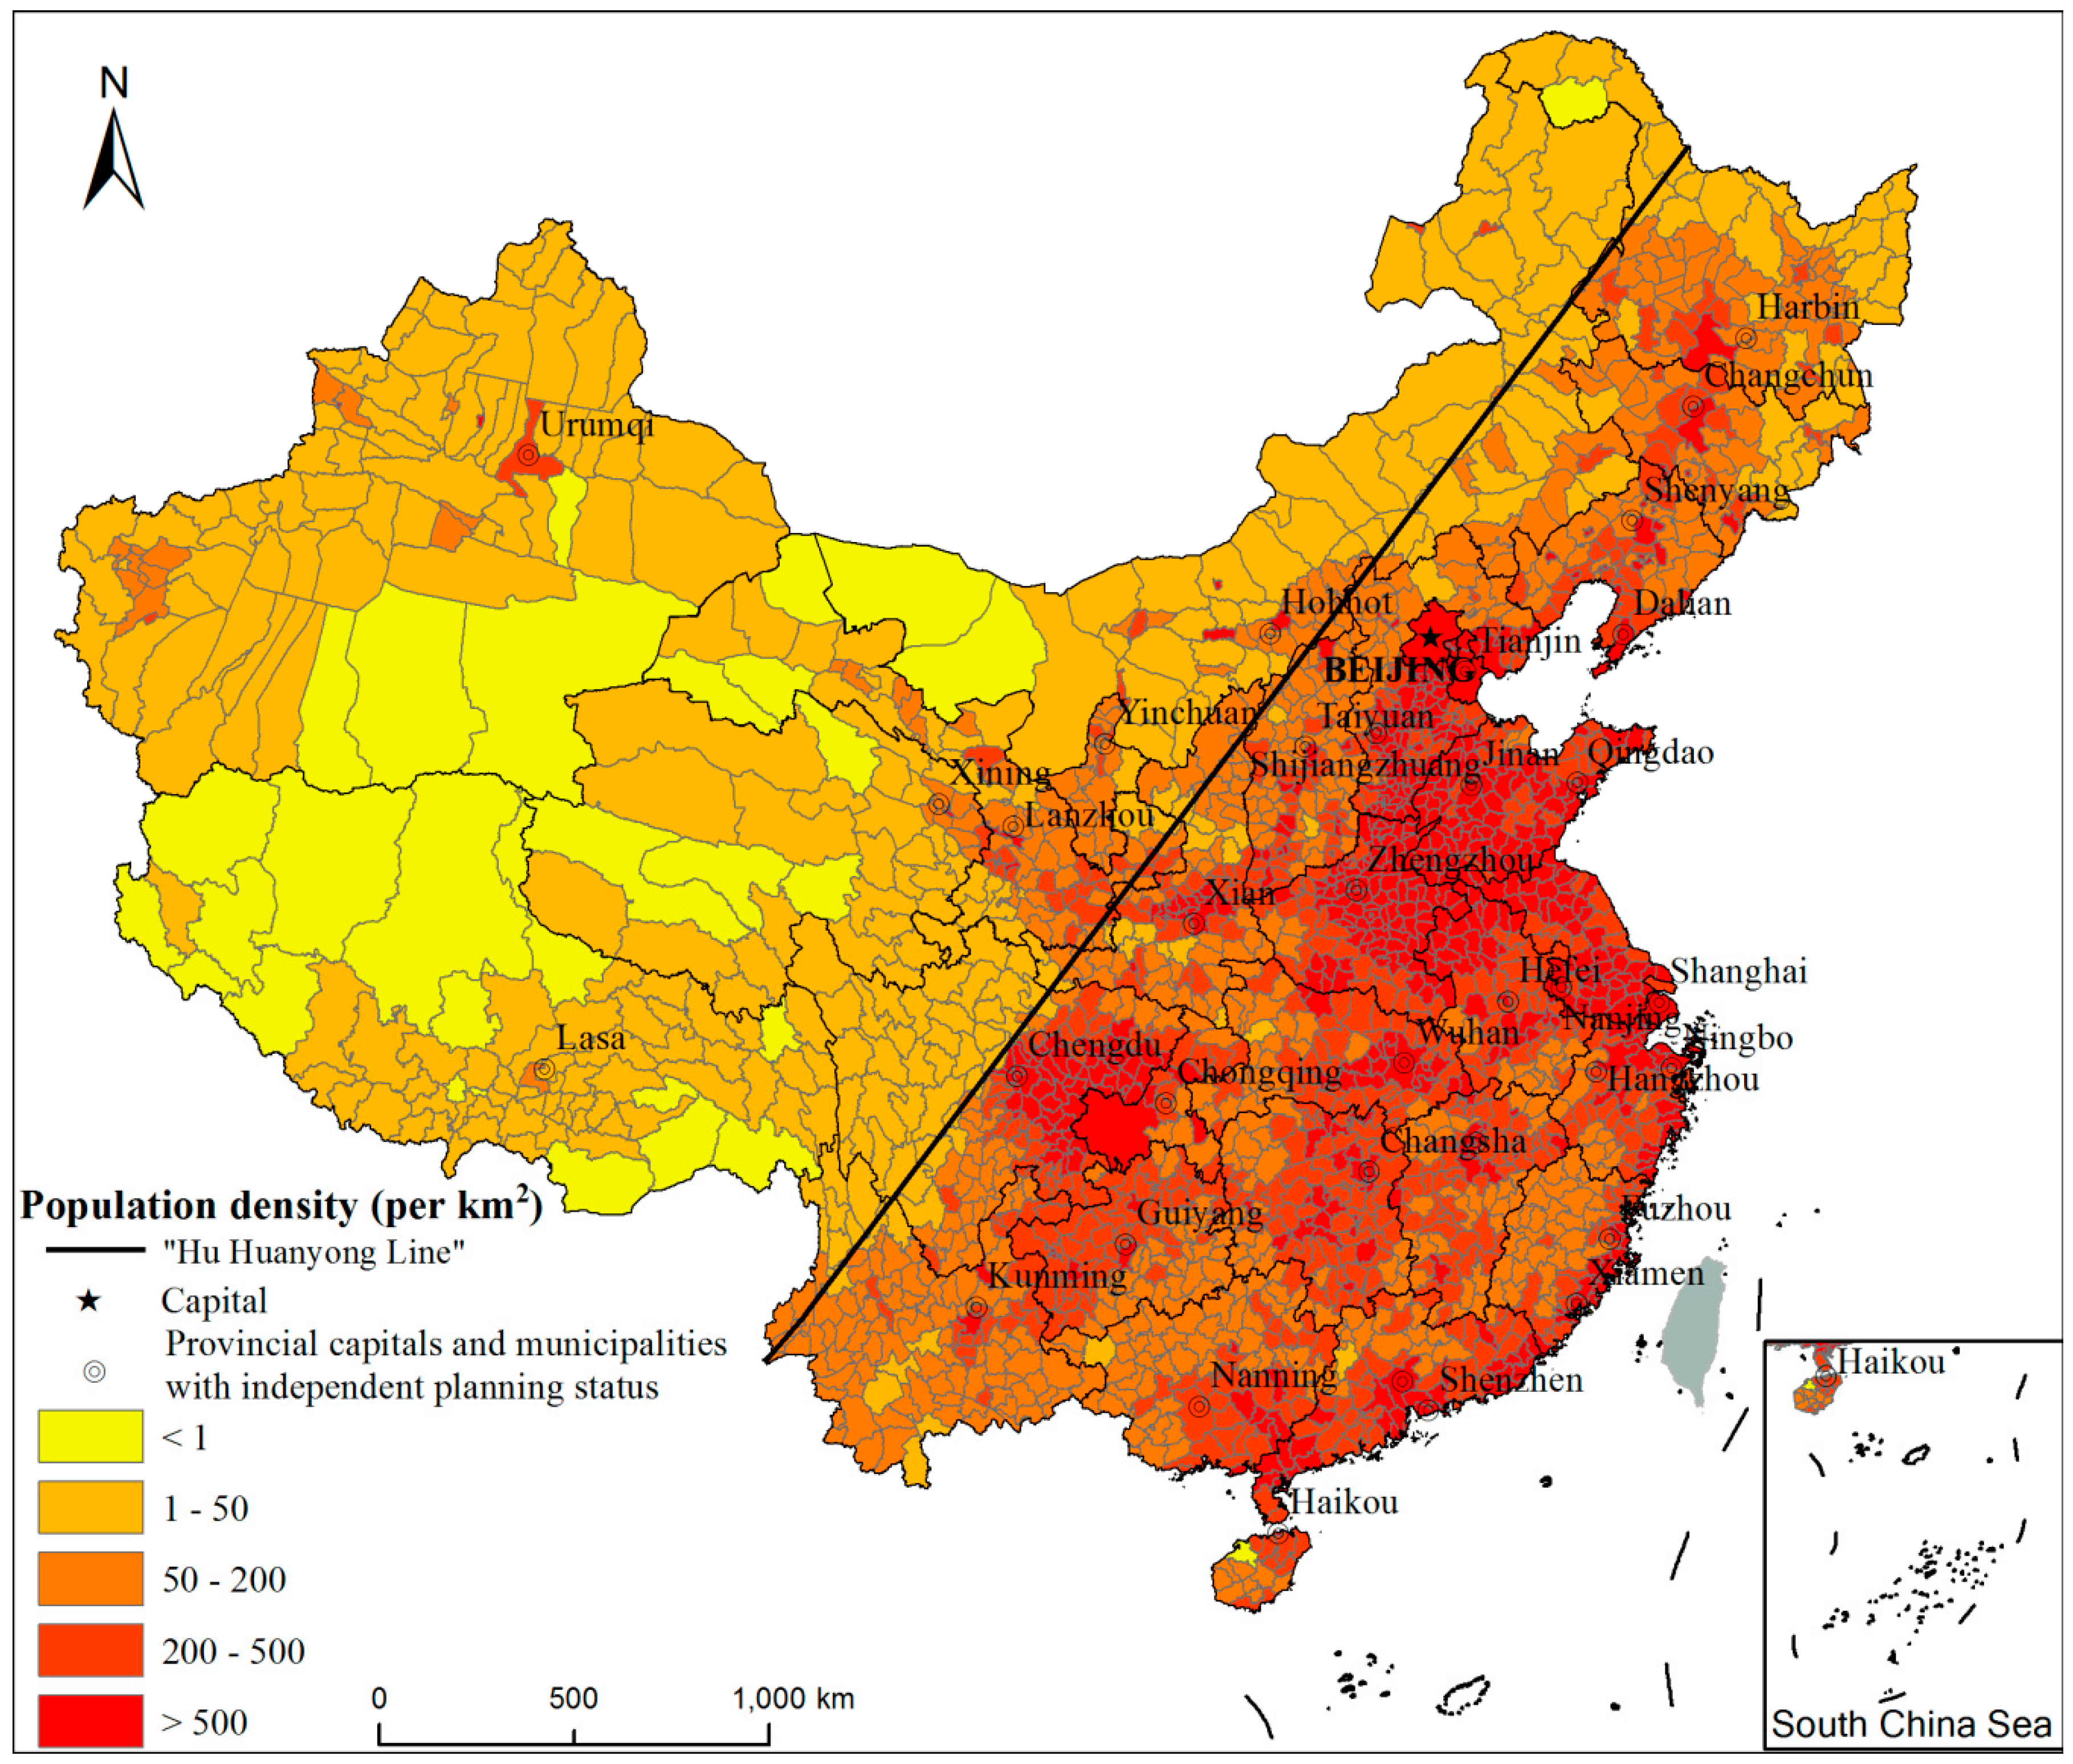
- Population, land area and GDP data are used to analyze the characteristics of the population distribution pattern in China at the county level. First, the characteristics of population density in 2015 is analyzed, and formed five classes of population areas by ranking the population density from high to low; second, the proportion of population and land area on both sides of the “Hu Huanyong line” are analyzed to reveal the pattern of Chinese population in 2015.
- (2)
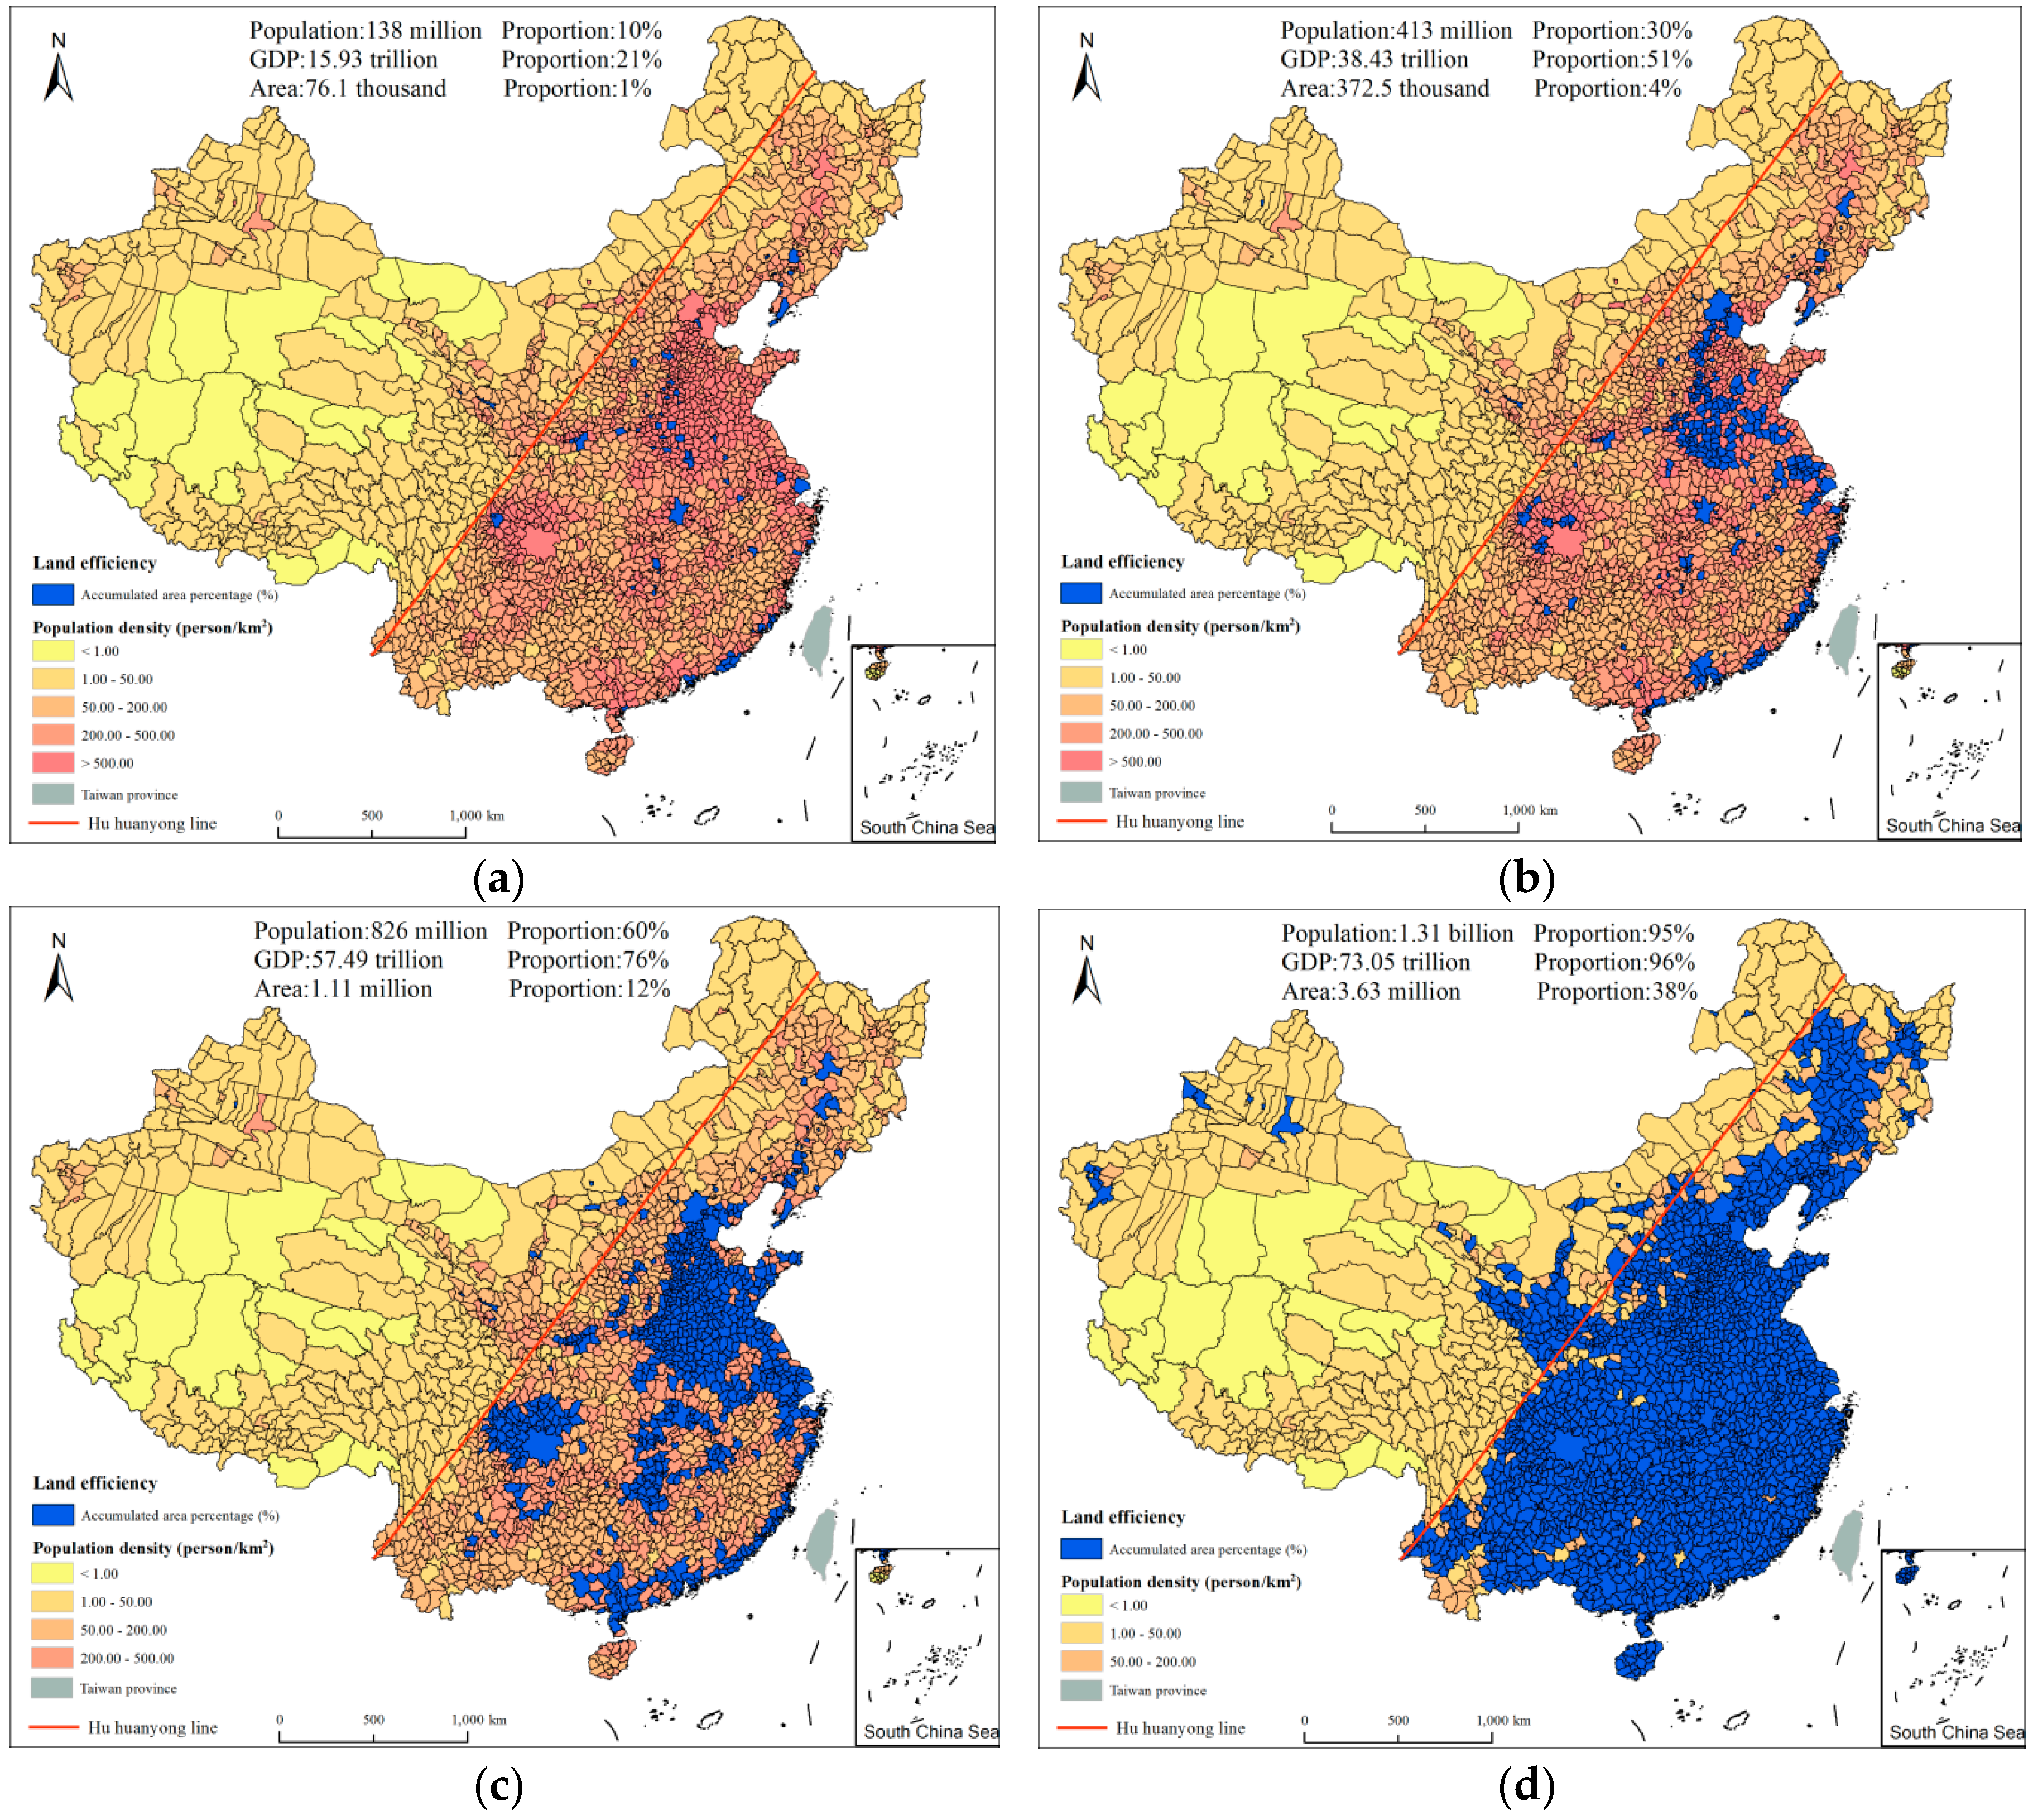
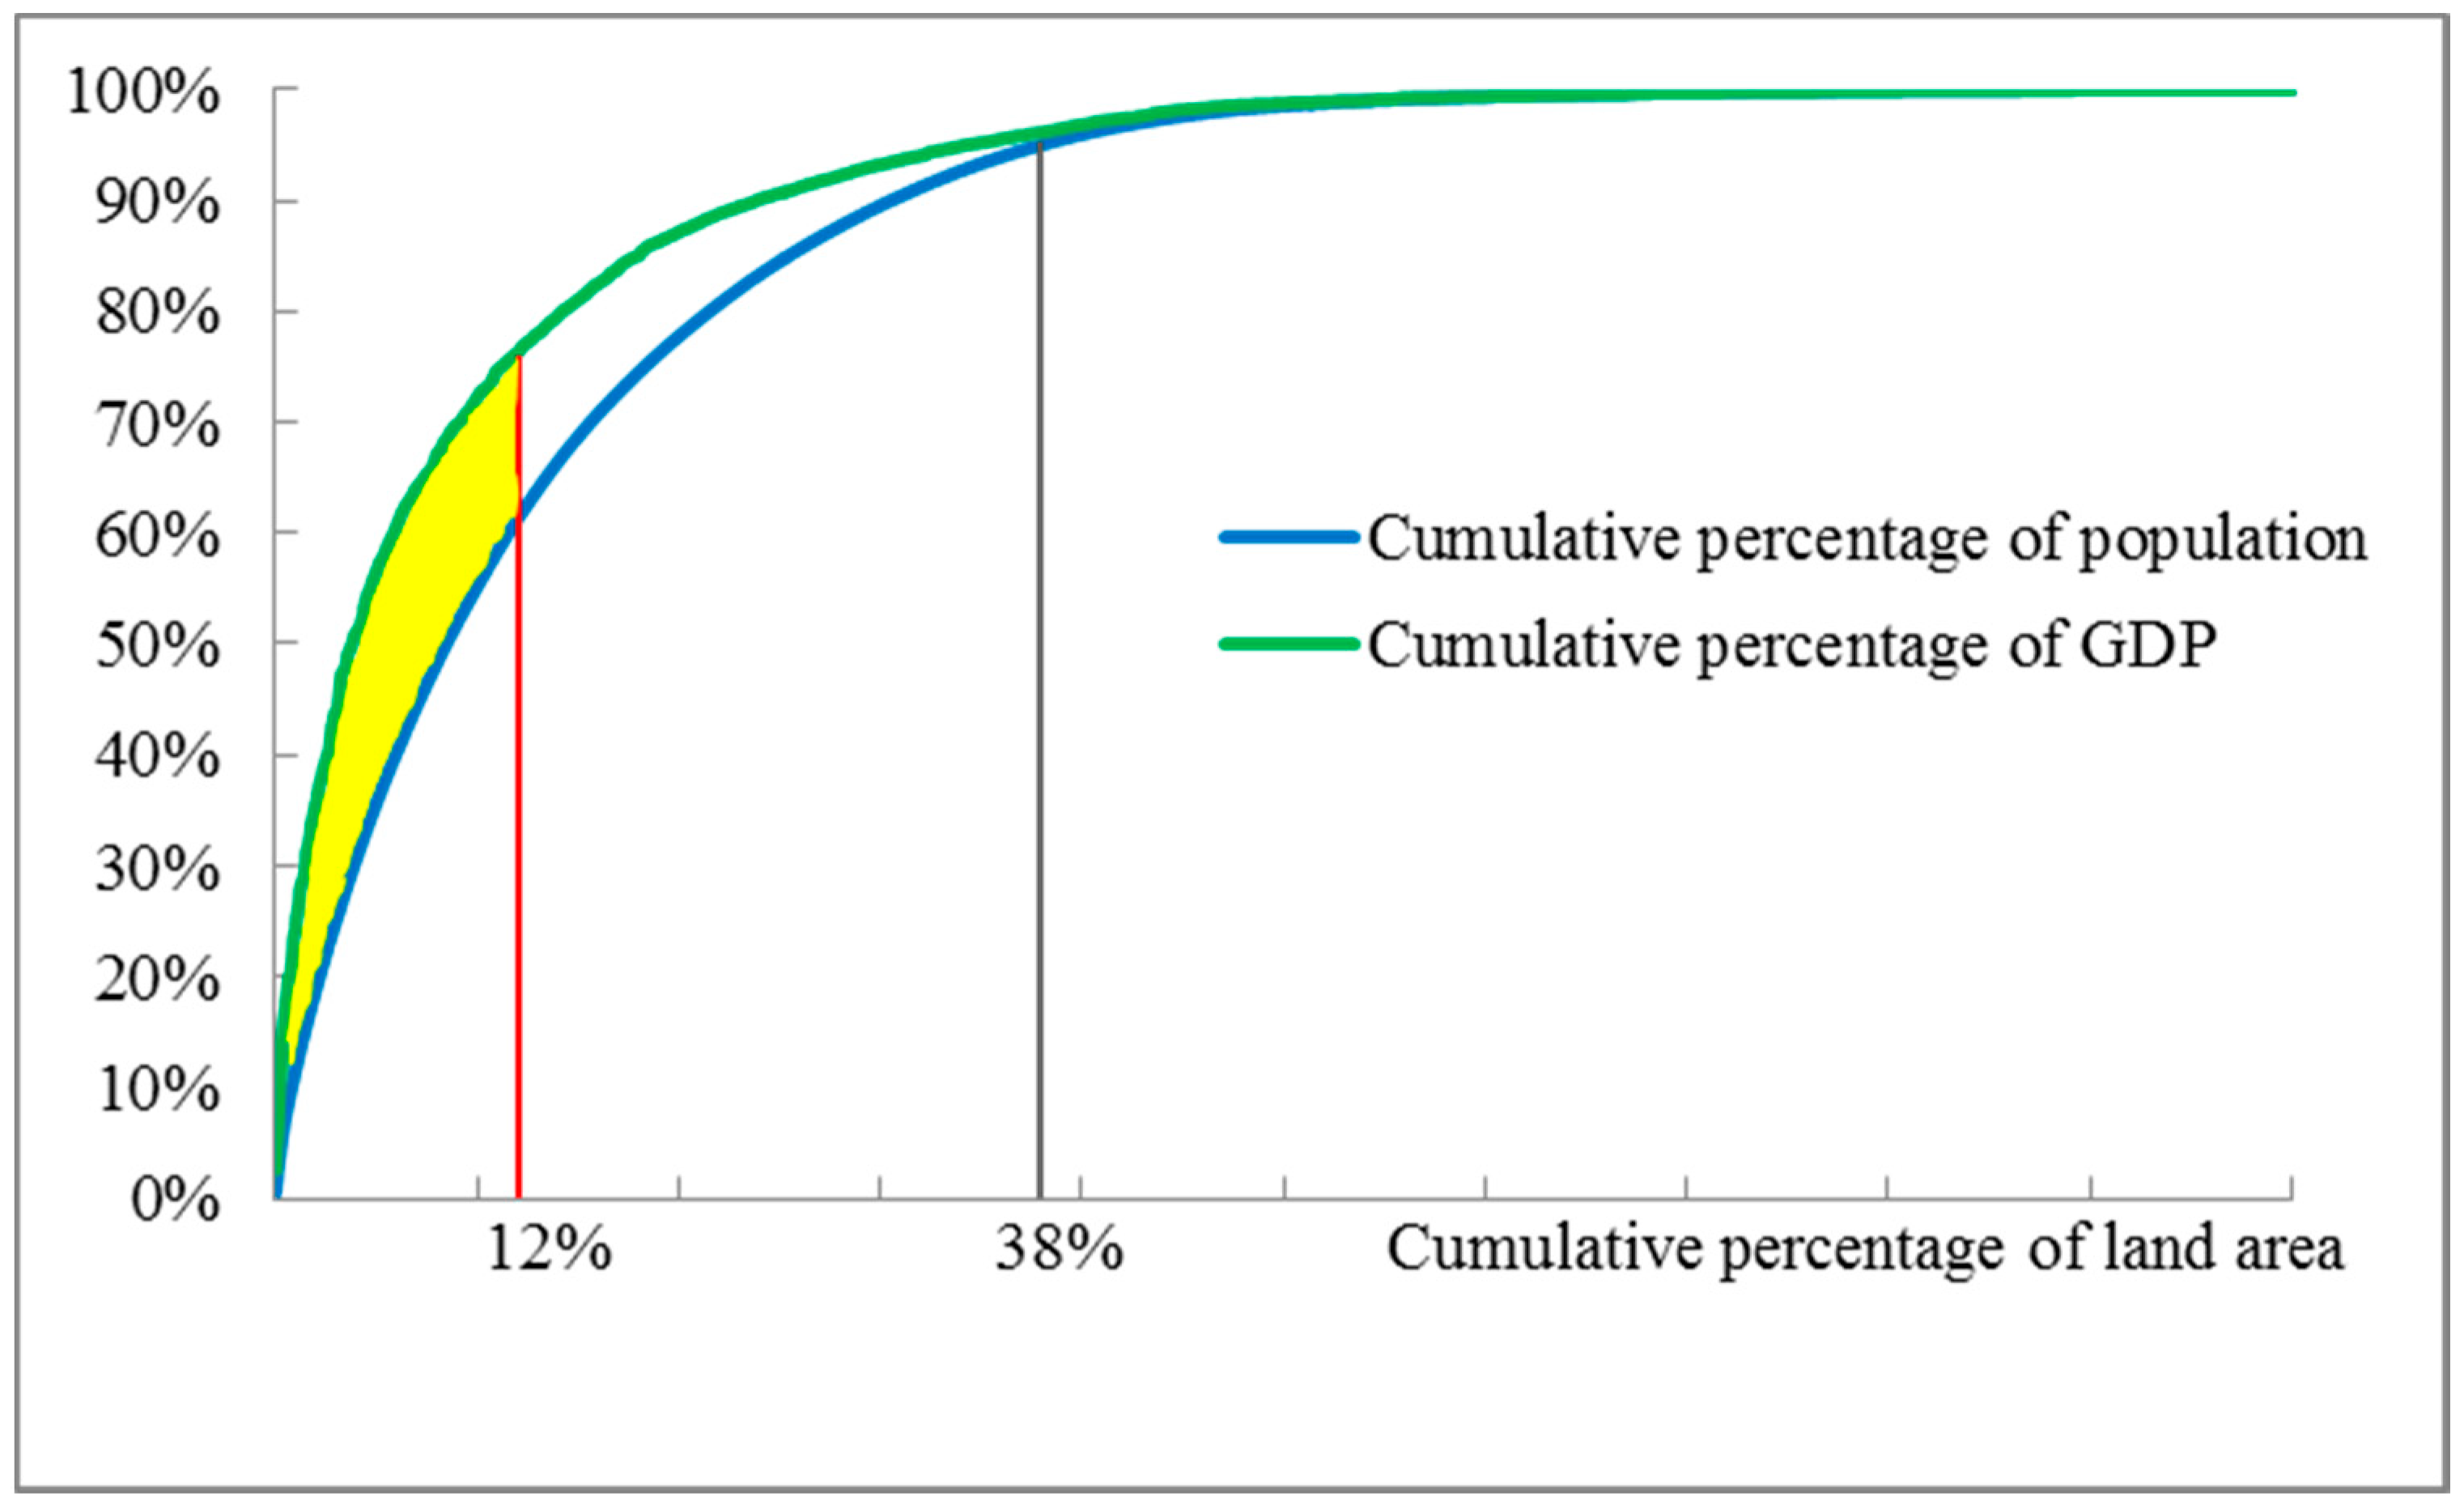
- Based on the spatial distribution characteristics of population density, population, land area and GDP, the population density is ranked from high to low, and the correlation between cumulative percentage of land area and cumulative percentage of population and GDP is analyzed to reveal the efficiency of land in terms of population and economy in China.
- (3)
- Based on the overlapping distribution of population, GDP and land area, the spatial distribution structure of population is putted forward for the future urbanization.
3. Results
3.1. Population Distribution in China
3.2. The Overlapping Distribution of Land Area, Population and GDP
3.3. Spatial Distribution Structure of Population
4. Discussions
4.1. Population Distribution and National Strategy
4.2. Division of Spatial Distribution Structure of Population
5. Conclusions
- (1)
- In 2015, the distribution of population density of China based on the county-level administrative regions presents a pattern of high in the southeast and low in the northwest. The areas with high population density are mainly concentrated in the middle and lower reaches of the Yellow River, the Yangtze River Delta, the Sichuan Basin and the southeastern coastal area. The population densities differ significantly on both side of the “Hu Huanyong Line”, and the population main lives in the southeast of China. In the study of Chen et al. (2016), the Chinese population showed a trend of migration to the northwest of the country from 1933 to 2010, while the whole distribution pattern of population has not changed [18]. Therefore, our results are consistent with Chen et al. (2016)’s study although this study uses the household population, and Chen et al. (2016) uses the census data, namely, there is inconsistency in the population statistics. This study considers that the analysis of the distribution pattern of population by household population demographics can more accurately reflect the current status of urbanization in China.
- (2)
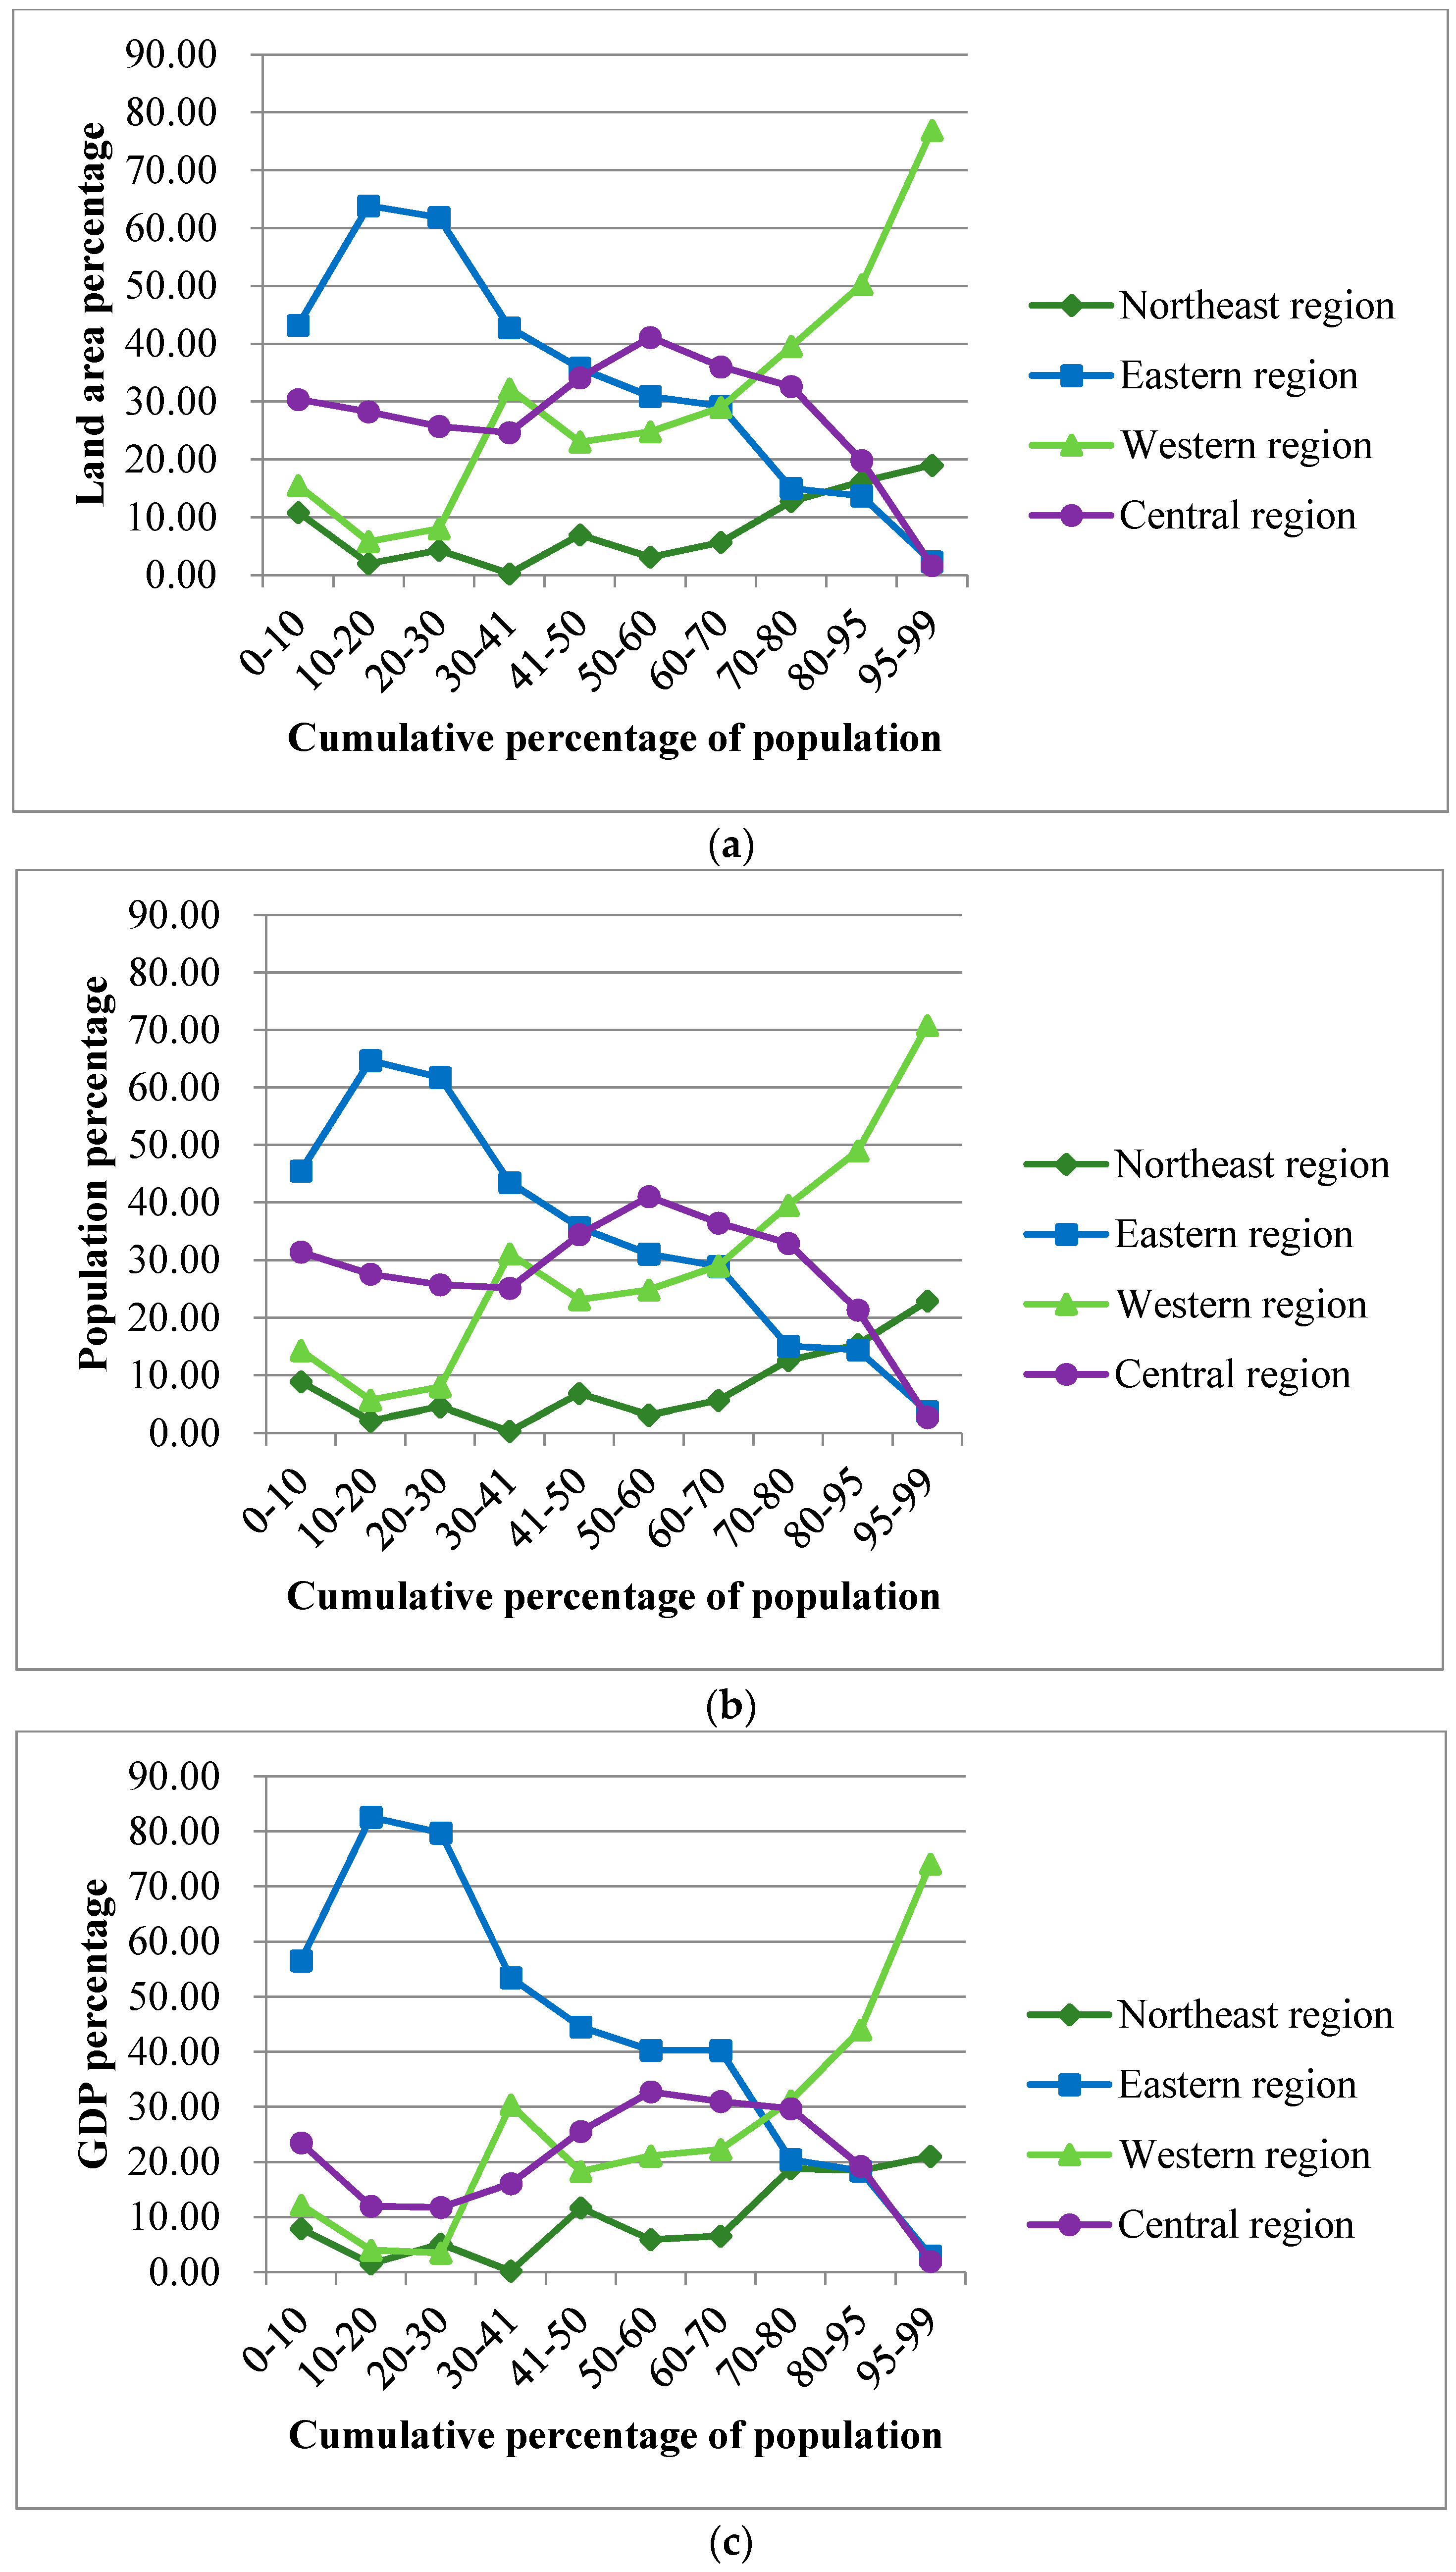
- There is a great difference of the spatial correlation between land area, population and GDP in China. Based on the population density from high to low, the cumulative percentages of population and GDP are increase with the cumulative percentage of land area. The economic concentration is higher than the population concentration. In the areas with highly aggregated population and GDP, per capita GDP is higher. These regions can be used as main development areas for urbanization in China.
- (3)
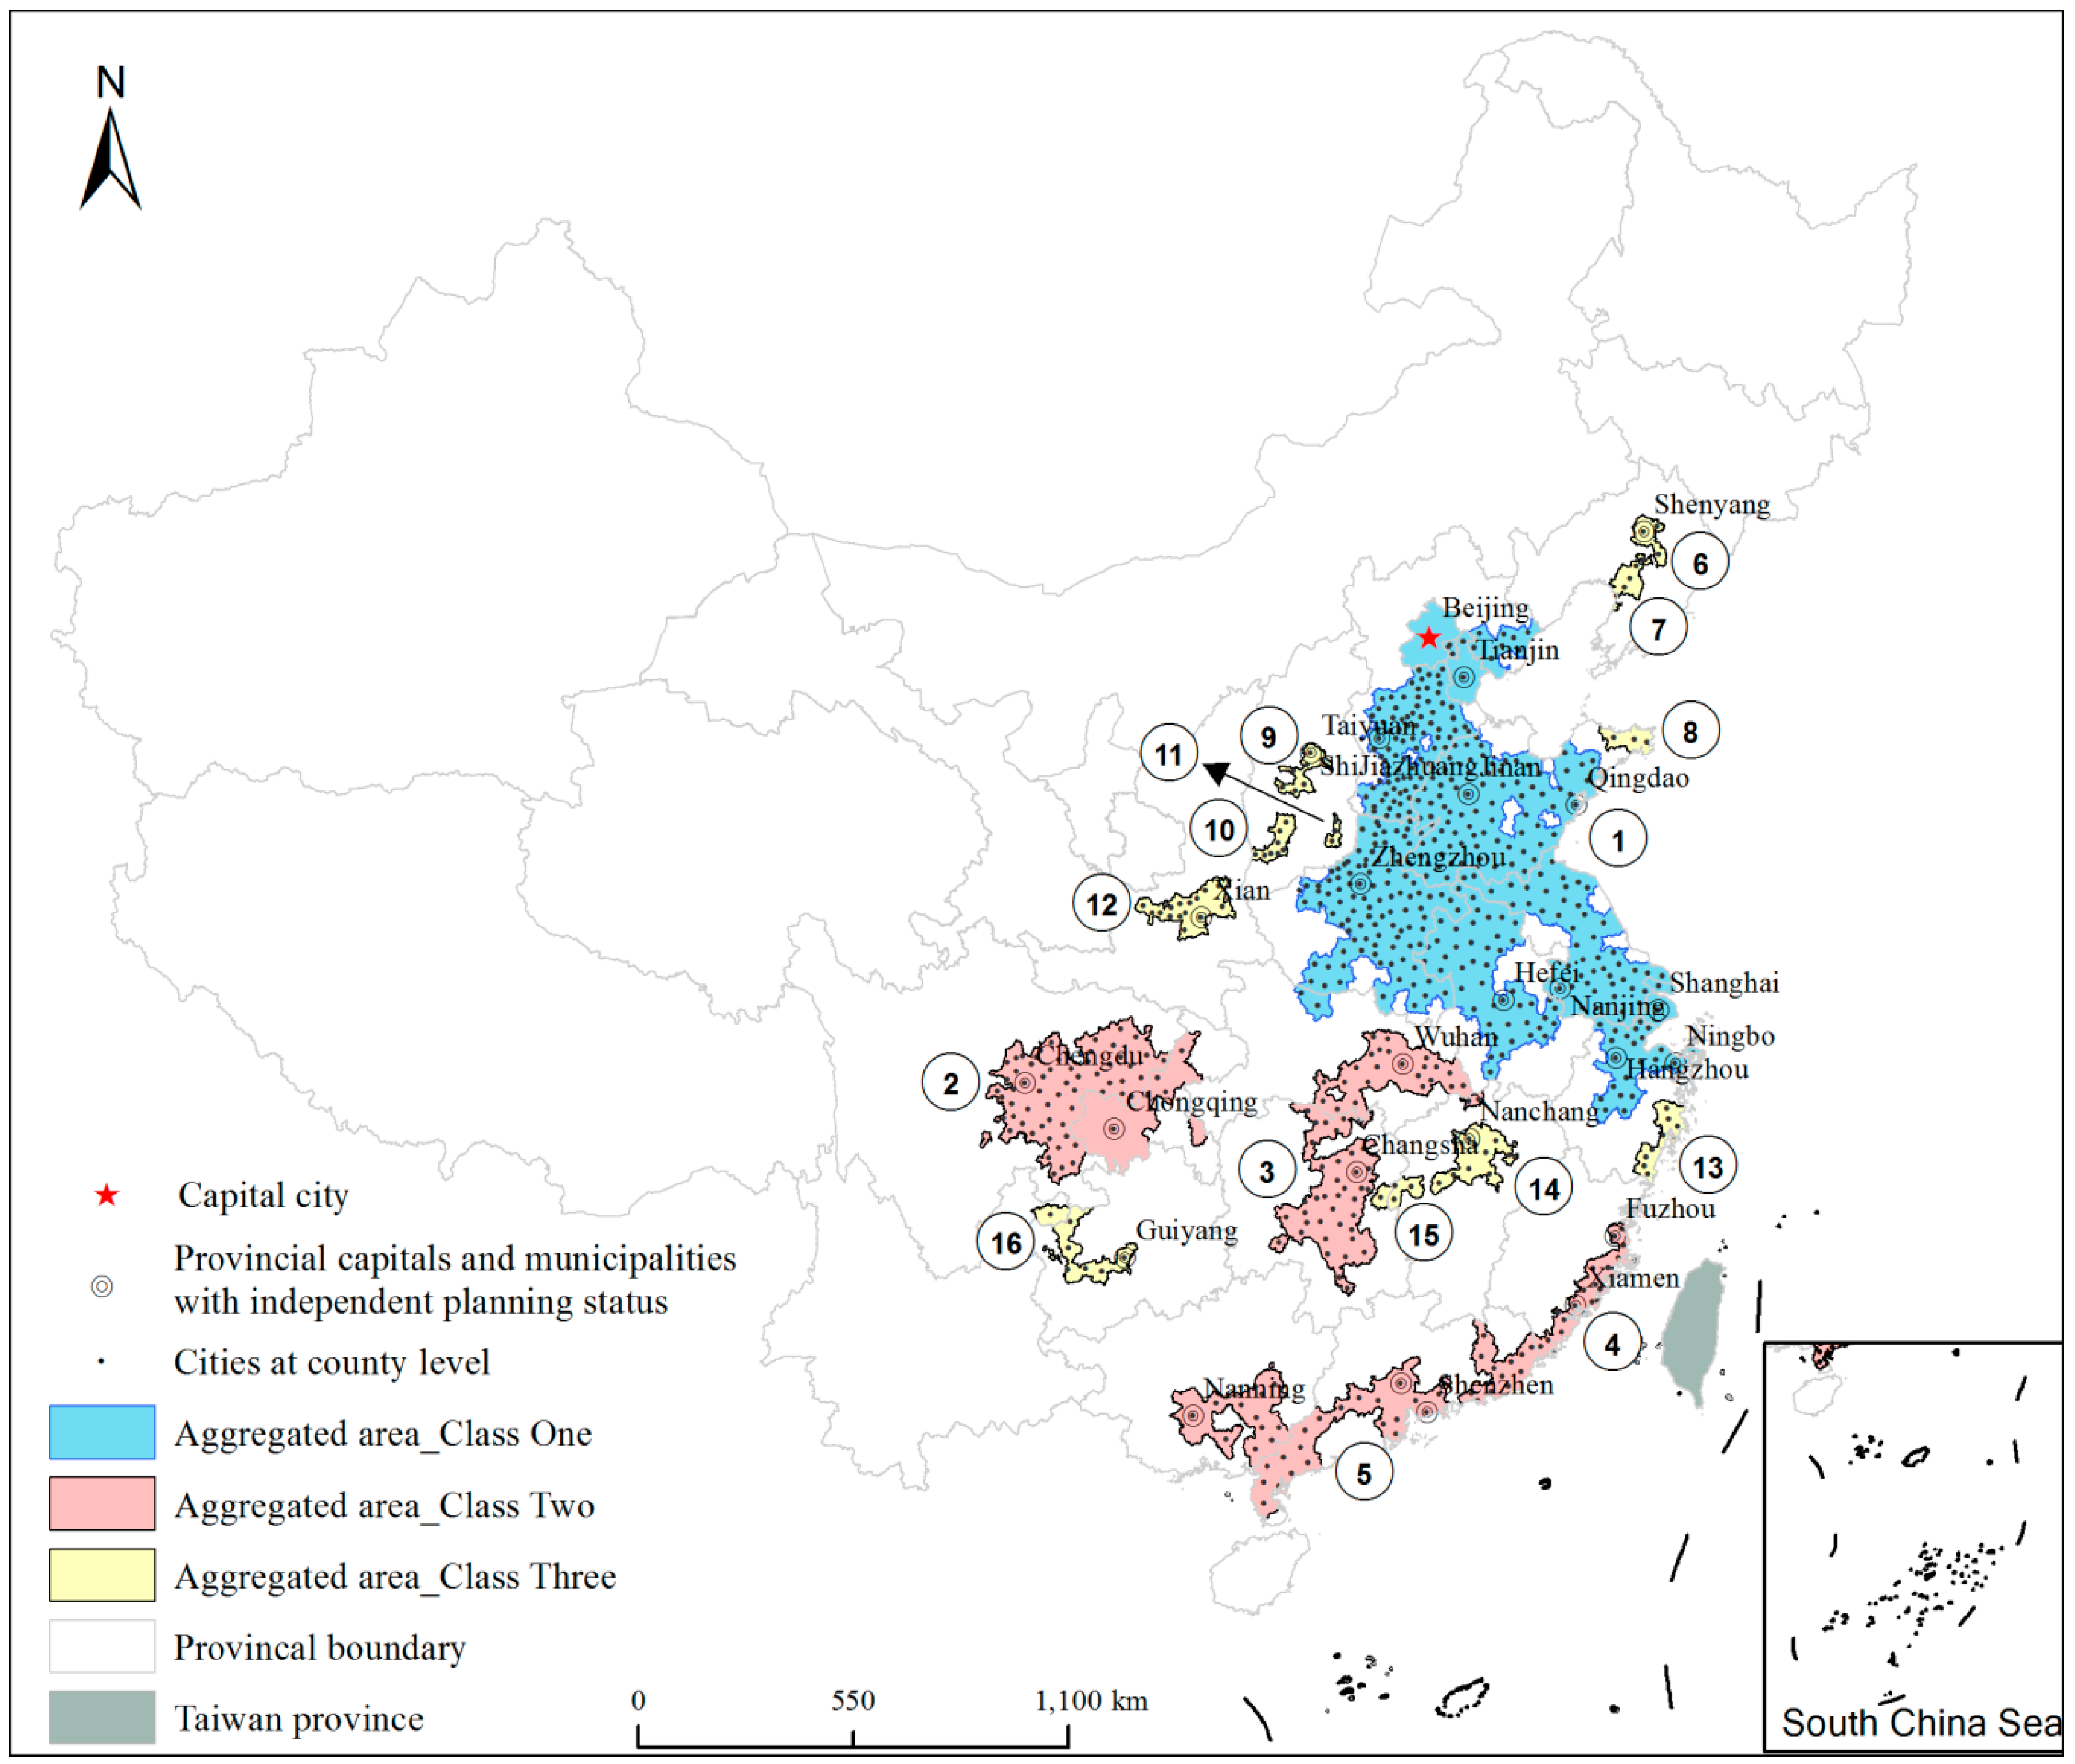
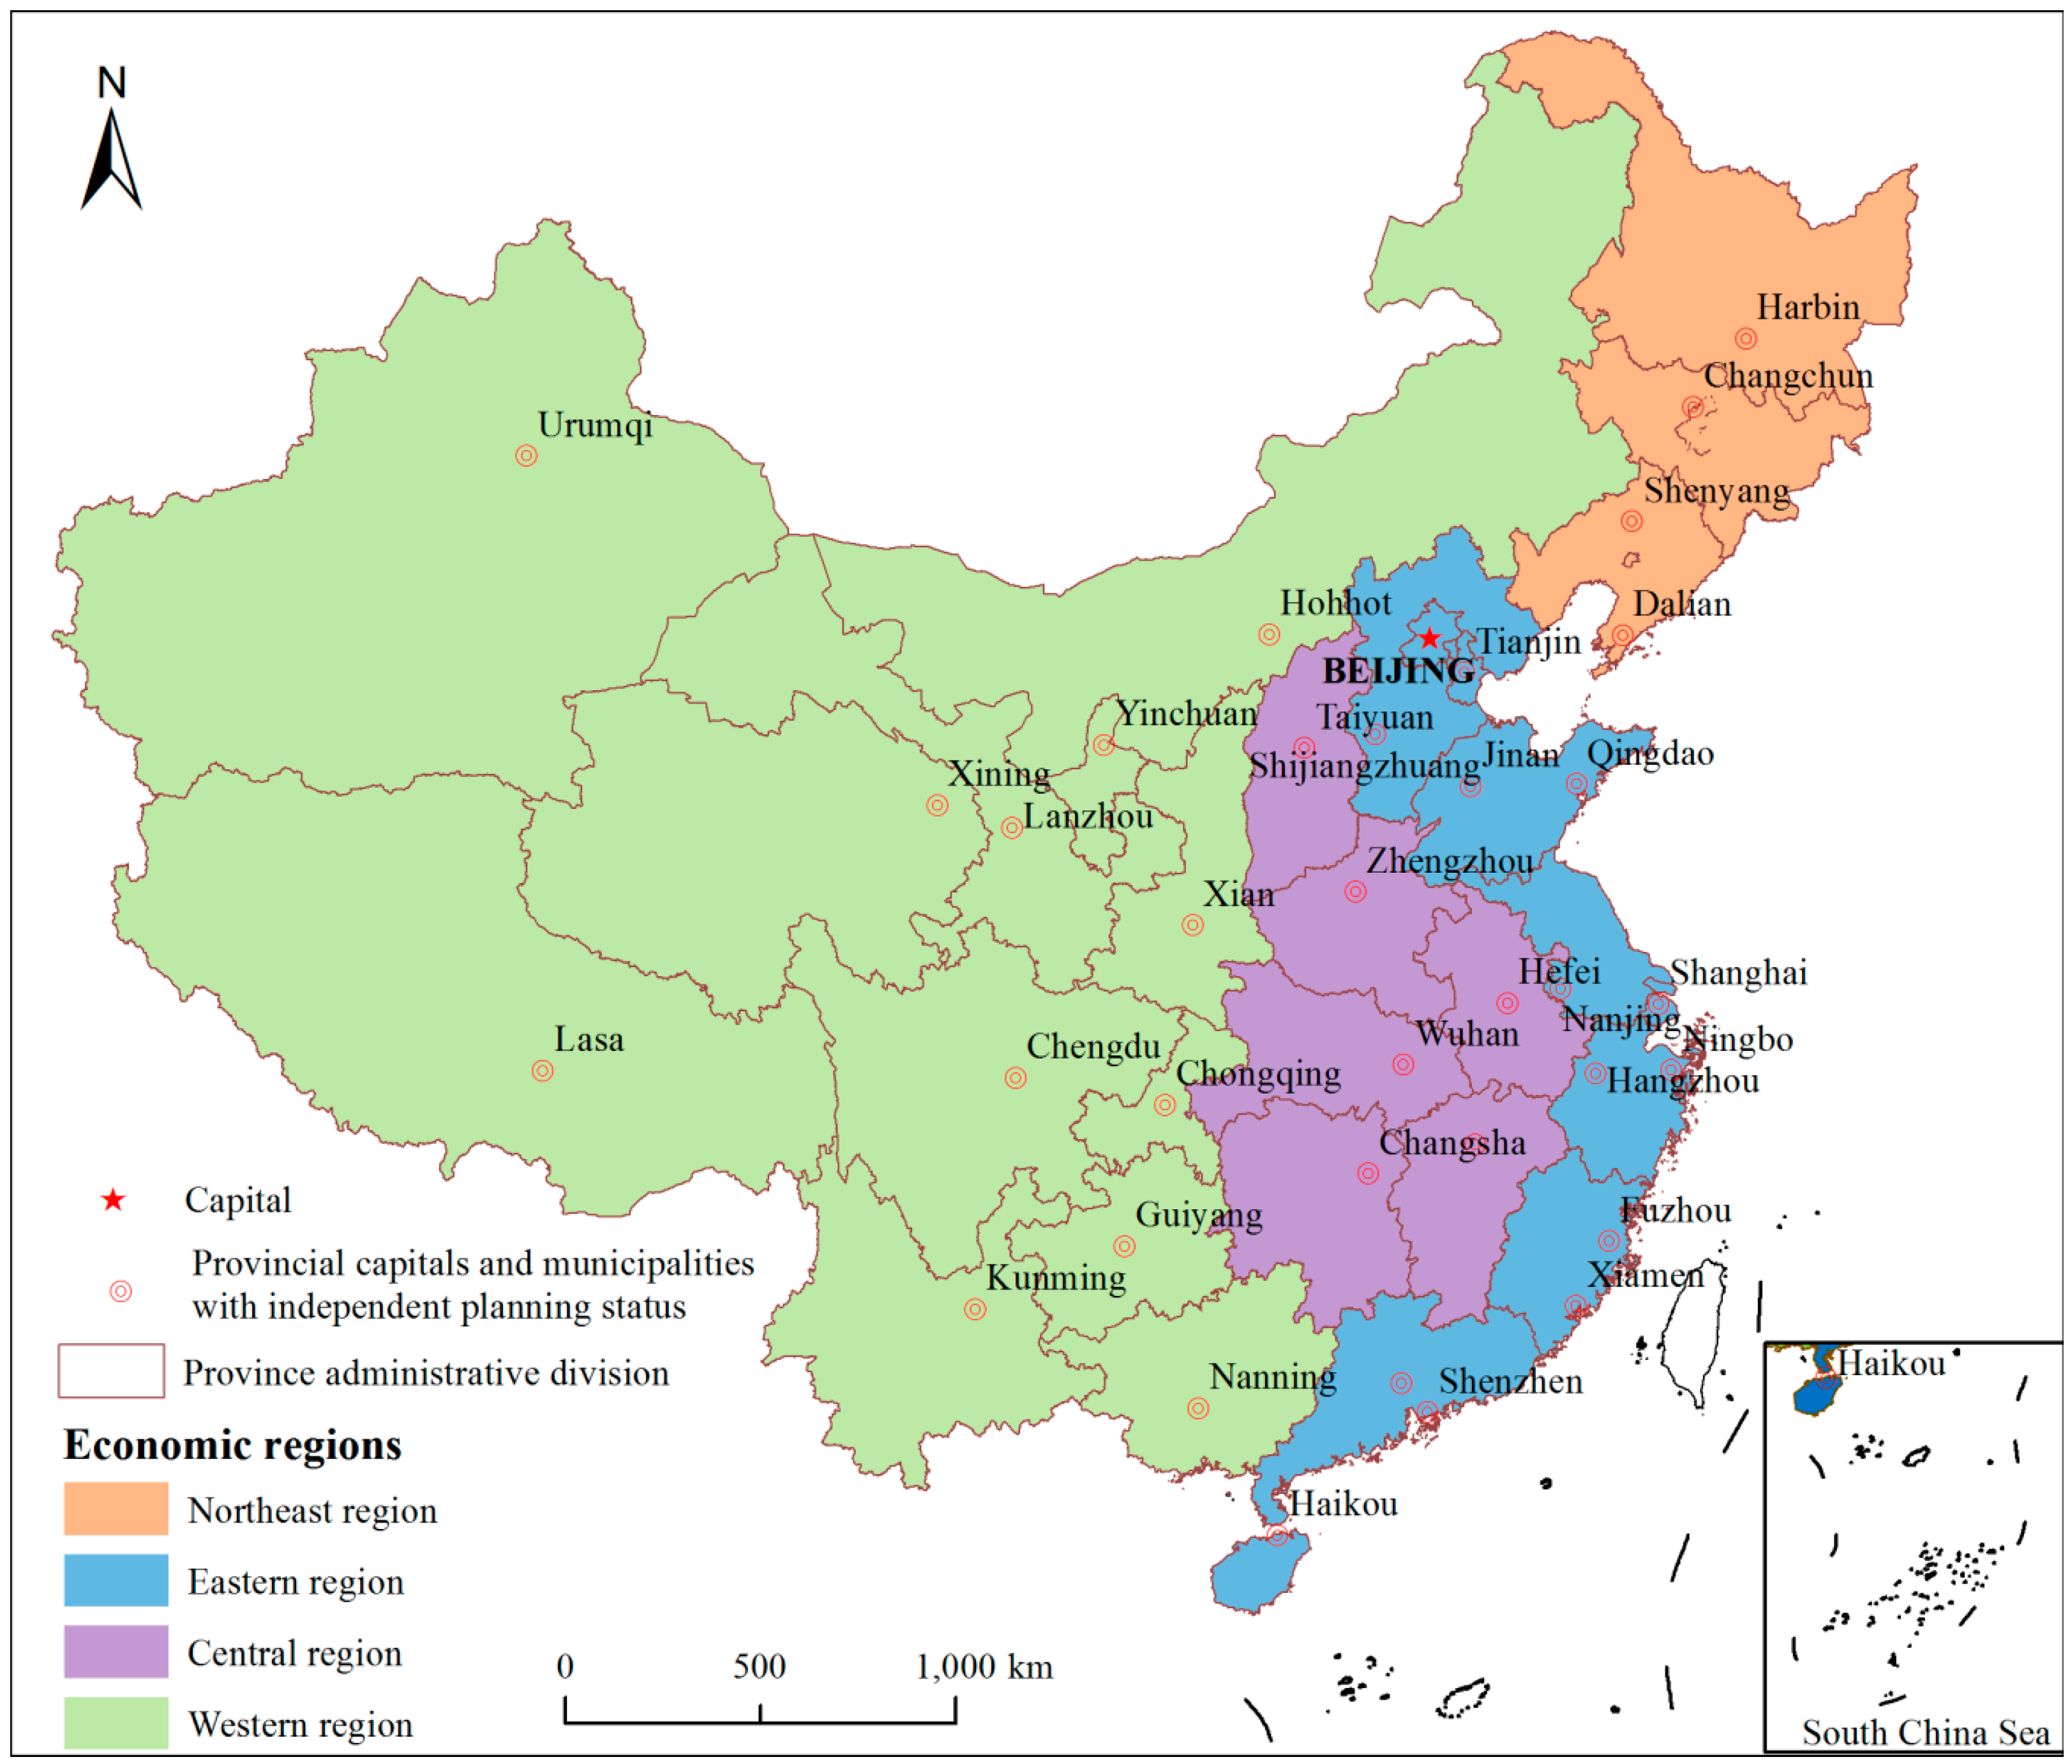
- Based on the areas with highly aggregated population and GDP, the spatial distribution structure of population of “1 + 4 + 11” for China’s urbanization is put forward, including one national-level aggregated area of population and economic production, 4 regional-level aggregated areas of population and economic production and 11 local regional aggregated areas of population and economic production, which would account for 10.72% of the land area, support 55.56% of the total population and produce 67.22% of the GDP. This spatial distribution structure enriches the theoretical characterization of population, and also points out the future direction of China’s urbanization according to the aggregation of population and GDP.
Author Contributions
Funding
Acknowledgments
Conflicts of Interest
References
- Clarke, J.I. Population geography. Prog. Hum. Geogr. 1980, 4, 385–391. [Google Scholar] [CrossRef] [PubMed]
- Li, S.C.; Cai, Y.L. Some scaling issues of geography. Geogr. Res. 2005, 23, 16–26. [Google Scholar] [CrossRef]
- The World Bank. World Development Indicators. Available online: https://data.worldbank.org (accessed on 7 June 2018).
- Food and Agriculture Organization of the United Nations. FAOSTAT. Available online: www.fao.org/faostat/en/#home (accessed on 7 June 2018).
- Clark, C. Urban population densities. J. R. Stat. Soc. Ser. A 1951, 114, 490–496. [Google Scholar] [CrossRef]
- John, Q.S.; Warntz, W. Physics of population distribution. J. Reg. Sci. 1958, 1, 99–121. [Google Scholar] [CrossRef]
- Newling, B.E. The spatial variation of urban population densities. Geogr. Rev. 1969, 59, 242–252. [Google Scholar] [CrossRef]
- Berry, B.J.L.; Kim, H.M. Challenges to the Monocentric Model. Geogr. Anal. 2010, 25, 1–4. [Google Scholar] [CrossRef]
- Griffith, D.A. Modelling urban population density in a multi-centered city. J. Urban Econ. 1981, 9, 298–310. [Google Scholar] [CrossRef]
- Crols, T.; Vanderhaegen, S.; Canters, F.; Engelen, G.; Poelmans, L.; Uljee, I.; White, R. Downdating high-resolution population density maps using sealed surface cover time series. Landsc. Urban Plan. 2017, 160, 96–106. [Google Scholar] [CrossRef]
- Clark, D.E.; Cushing, B.M. Rural and urban traffic fatalities, vehicle miles, and population density. Accid. Anal. Prev. 2004, 36, 967–972. [Google Scholar] [CrossRef] [PubMed]
- Guimond, L.; Simard, M. Gentrification and neo-rural populations in the Québec countryside: Representations of various actors. J. Rural Stud. 2010, 26, 449–464. [Google Scholar] [CrossRef]
- Hagedoorn, P.; Vandenheede, H.; Vanthomme, K.; Gadeyne, S. Socioeconomic position, population density and site-specific cancer mortality: A multilevel analysis of belgian adults, 2001–2011. Int. J. Cancer 2017, 142, 23–35. [Google Scholar] [CrossRef] [PubMed]
- Graves, P.E.; Clawson, M. Rural to urban migration: Population distribution patterns. Surv. Agric. Econ. Lit. 1981, 3, 362–390. Available online: https://works.bepress.com/philip_graves/79/ (accessed on 7 June 2018).
- Hudson, J. Density and pattern in suburban fringes. Ann. Assoc. Am. Geogr. 1973, 63, 28–39. [Google Scholar] [CrossRef]
- Hu, H.Y. Distribution of China’s Population—Attached statistical table and density chart. Acta Geogr. Sin. 1935, 2, 33–74. [Google Scholar]
- Hu, Z.C.; Wang, Y.L.; Liu, Y.S.; Long, H.L.; Peng, J. Spatio-temporal patterns of urban-rural development and transformation in east of the “hu huanyong line”, China. ISPRS Int. J. Geo-Inf. 2016, 5, 24. [Google Scholar] [CrossRef]
- Chen, M.X.; Gong, X.H.; Li, Y.; Lu, D.D.; Zhang, H. Population distribution and urbanization on both sides of the Hu Huanyong Line: Answering the Premier’s question. J. Geogr. Sci. 2016, 26, 1593–1610. [Google Scholar] [CrossRef]
- Fan, J.; Tao, A.; Ren, Q. On the Historical Background, Scientific Intentions, Goal Orientation, and Policy Framework of Major Function-Oriented Zone Planning in China. J. Resour. Ecol. 2010, 4, 289–299. [Google Scholar] [CrossRef]
- Fang, C.; Wang, J. A Theoretical Analysis of Interactive Coercing Effects between Urbanization and Eco-environment. Chin. Geogr. Sci. 2013, 23, 147–162. [Google Scholar] [CrossRef]
- Chen, M.; Liu, W.; Lu, D. Challenges and the way forward in China’s new-type urbanization. Land Use Policy 2016, 55, 334–339. [Google Scholar] [CrossRef]
- Deng, C.; Min, L.I.; Jin, Y.B. Spatial-Temporal Variation Characteristics and Main Influence Factors Analysis of Population Distribution Pattern in Hunan Province. Econ. Geogr. 2017, 37, 41–48. [Google Scholar]
- Tan, S.; Li, Y.; Song, Y.; Luo, X.; Zhou, M.; Zhang, L.; Kuang, B. Influence factors on settlement intention for floating population in urban area: A China study. Qual. Quant. 2017, 51, 147–176. [Google Scholar] [CrossRef]
- Xu, W.P.; Jiang, H.; Li, Y.W. Study on Difference between the Environmental Effects of Population Agglomeration and Economic Agglomeration in China: Based on Analysis of Provincial Panel Data. Ecol. Econ. 2018, 34, 123–127. [Google Scholar]
- Qian, Y.Y.; Weingast, B.R. China’s transition to markets: Market-preserving federalism, Chinese style. J. Econ. Policy Reform 1996, 1, 149–185. [Google Scholar] [CrossRef]
- Mayer, J. The fallacy of composition: A review of the literature. World Econ. 2010, 25, 875–894. [Google Scholar] [CrossRef]
- Lu, C. A framework of evolution and optimization of regional population distribution for sustainable development in China. Eur. J. Biochem. 2015, 238, 88–96. [Google Scholar] [CrossRef]
- Guan, X.; Wei, H.; Lu, S.; Su, H. Mismatch distribution of population and industry in china: Pattern, problems and driving factors. Appl. Geogr. 2018, 97, 61–74. [Google Scholar] [CrossRef]
- Yao, S.M. Urban Agglomerations of China; University of Science and Technology of China Press: Hefei, China, 2006. [Google Scholar]
- Gu, C.L.; Yu, T.F.; Li, W.M. Urbanization in China: Pattern, Process and Mechanism; Science Press: Beijing, China, 2008. [Google Scholar]
- Fang, C.L.; Bao, C.; Ma, H.T. Urban Agglomeration Development in China; Science Press: Beijing, China, 2016. [Google Scholar]
- Ministry of Civil Affairs of the People’s Republic of China. Administrative Division of the People’s Republic of China; Chinese Social Publishing House: Beijing, China, 2017.
- National Bureau of Statistics of China. China County Statistical Yearbook; China Statistics Press: Beijing, China, 2016.
- National Bureau of Statistics of China. China City Statistical Yearbook-2016; China Statistics Press: Beijing, China, 2016.
- Beijing Municipal Bureau of Statistics. Beijing Statistical Bulletin on National Economic and Social Development in 2017. Available online: http://www.bjstats.gov.cn/zxfb/201802/t20180225_393332.html (accessed on 3 September 2018).
- Chongqing Statistics. Chongqing Statistical Bulletin on National Economic and Social Development in 2017. Available online: http://www.cqtj.gov.cn/tjsj/shuju/tjgb/201803/t20180316_447954.htm (accessed on 3 September 2018).
- Gottmann, J. Megalopolis or the urbanization of the northeastern seaboard. Econ. Geogr. 1957, 33, 189–200. [Google Scholar] [CrossRef]
- Zhou, Y.X.; Laurence, J.; Ma, C. Economic restructuring and suburbanazation in China. Urban Geogr. 2000, 21, 205–236. [Google Scholar] [CrossRef]
- Yao, S.M.; Liu, T. The evolution of urban spatial structure in the open area of southeastern coastal China. Urban Geogr. 2013, 16, 561–576. [Google Scholar] [CrossRef]
- Stimson, E.B.R.; Stough, R.R.; Nijkamp, P. Endogenous regional development: Perspectives, measurement and empirical investigation. J. Reg. Sci. 2011, 51, 1022–1024. [Google Scholar] [CrossRef]
- National Bureau of Statistics of China. Available online: http://www.stats.gov.cn/ztjc/zthd/sjtjr/dejtjkfr/tjkp/201106/t20110613_71947.htm (accessed on 7 June 2018).
- Guan, X.; Wei, H.; Lu, S.; Dai, Q.; Su, H. Assessment on the urbanization strategy in China: Achievements, challenges and reflections. Habitat Int. 2018, 71, 97–109. [Google Scholar] [CrossRef]


| Index | 2015 |
|---|---|
| Number of counties | 2209.00 |
| Area (Ten thousand km2) | 956.37 |
| Population (100 million) | 13.75 |
| Population density (person/km2) | 143.82 |
| GDP per capita (Ten thousand Yuan /person) | 5.52 |
| GDP per area (Ten thousand Yuan/km2) | 794.55 |
| Construction land per capita (m2/person) | 283.64 |
| Year | Northwest of the “Hu Huanyong Line” | ||
| Area Proportion (%) | Population Percentage (%) | Population Density (People/km2) | |
| 2015 | 57.25 | 6.12 | 15.34 |
| Year | Southeast of the “Hu Huanyong Line” | ||
| Area Proportion (%) | Population Percentage (%) | Population Density (People/km2) | |
| 2015 | 42.75 | 93.88 | 314.85 |
| ID | Name | Population (100 Million) | Area (10 Thousand km2) | GDP (Trillion Yuan) | Class | Regions |
|---|---|---|---|---|---|---|
| 1 | Aggregated area of northern and eastern China | 4.34 | 56.17 | 29.38 | 1 | Taking Beijing, Tianjin, Shijiazhuang, Jinan, Qingdao, Zhengzhou, Hefei, Nanjing, Hangzhou and Ningbo as the centers |
| 2 | Aggregated area of Cheng Yu | 0.89 | 13.45 | 3.90 | 2 | Taking Chongqing and Chengdu as the centers |
| 3 | Aggregated area of central Yangtze River | 0.64 | 9.94 | 3.72 | 2 | Taking Wuhan and Changsha as the centers |
| 4 | Aggregated area of the west side | 0.41 | 4.18 | 2.29 | 2 | Taking Fuzhou and Xiamen as the centers |
| 5 | Aggregated area of Guangdong and Guangxi | 0.59 | 8.60 | 6.92 | 2 | Taking Guangzhou, Shenzhen and Nanning as the centers |
| 6 | Aggregated area of central Liaoning | 0.08 | 0.64 | 0.76 | 3 | Taking Shenyang as the center |
| 7 | Aggregated area of eastern Liaoning | 0.05 | 0.68 | 0.38 | 3 | Taking Yingkou as the center |
| 8 | Aggregated area of coastal Shandong | 0.04 | 0.69 | 0.53 | 3 | Taking Yantai as the center |
| 9 | Aggregated area of the central Shanxi | 0.06 | 0.74 | 0.35 | 3 | Taking Taiyuan as the center |
| 10 | Aggregated area of western Shanxi | 0.04 | 0.64 | 0.10 | 3 | Taking Linfen as the center |
| 11 | Aggregated area of eastern Shanxi | 0.02 | 0.18 | 0.07 | 3 | Taking Changzhi as the center |
| 12 | Aggregated area of Guanzhong | 0.15 | 1.68 | 0.80 | 3 | Taking Xian as the center |
| 13 | Aggregated area of eastern Zhejiang | 0.11 | 1.13 | 0.72 | 3 | Taking Wenzhou as the center |
| 14 | Aggregated area of central Jiangxi | 0.11 | 1.92 | 0.66 | 3 | Taking Nanchang as the center |
| 15 | Aggregated area of Xiang-Gan junction | 0.04 | 0.65 | 0.15 | 3 | Taking Yichun as the center |
| 16 | Aggregated area of central Guizhou | 0.09 | 1.64 | 0.36 | 3 | Taking Guiyang as the center |
| Total | Aggregated areas | 7.64 | 102.92 | 51.08 | - | Southeastern China |
© 2018 by the authors. Licensee MDPI, Basel, Switzerland. This article is an open access article distributed under the terms and conditions of the Creative Commons Attribution (CC BY) license (http://creativecommons.org/licenses/by/4.0/).
Share and Cite
Li, M.; He, B.; Guo, R.; Li, Y.; Chen, Y.; Fan, Y. Study on Population Distribution Pattern at the County Level of China. Sustainability 2018, 10, 3598. https://doi.org/10.3390/su10103598
Li M, He B, Guo R, Li Y, Chen Y, Fan Y. Study on Population Distribution Pattern at the County Level of China. Sustainability. 2018; 10(10):3598. https://doi.org/10.3390/su10103598
Chicago/Turabian StyleLi, Minmin, Biao He, Renzhong Guo, You Li, Yu Chen, and Yong Fan. 2018. "Study on Population Distribution Pattern at the County Level of China" Sustainability 10, no. 10: 3598. https://doi.org/10.3390/su10103598
APA StyleLi, M., He, B., Guo, R., Li, Y., Chen, Y., & Fan, Y. (2018). Study on Population Distribution Pattern at the County Level of China. Sustainability, 10(10), 3598. https://doi.org/10.3390/su10103598