Road Safety Impact of Increased Rural Highway Speed Limits in British Columbia, Canada


Abstract
1. Introduction
2. Methods
2.1. Overview
2.2. Data Sources
2.2.1. Fatal Crashes
2.2.2. Insurance Claims
2.2.3. Ambulance Dispatches
2.2.4. Gasoline Sales
2.2.5. Travel Speed
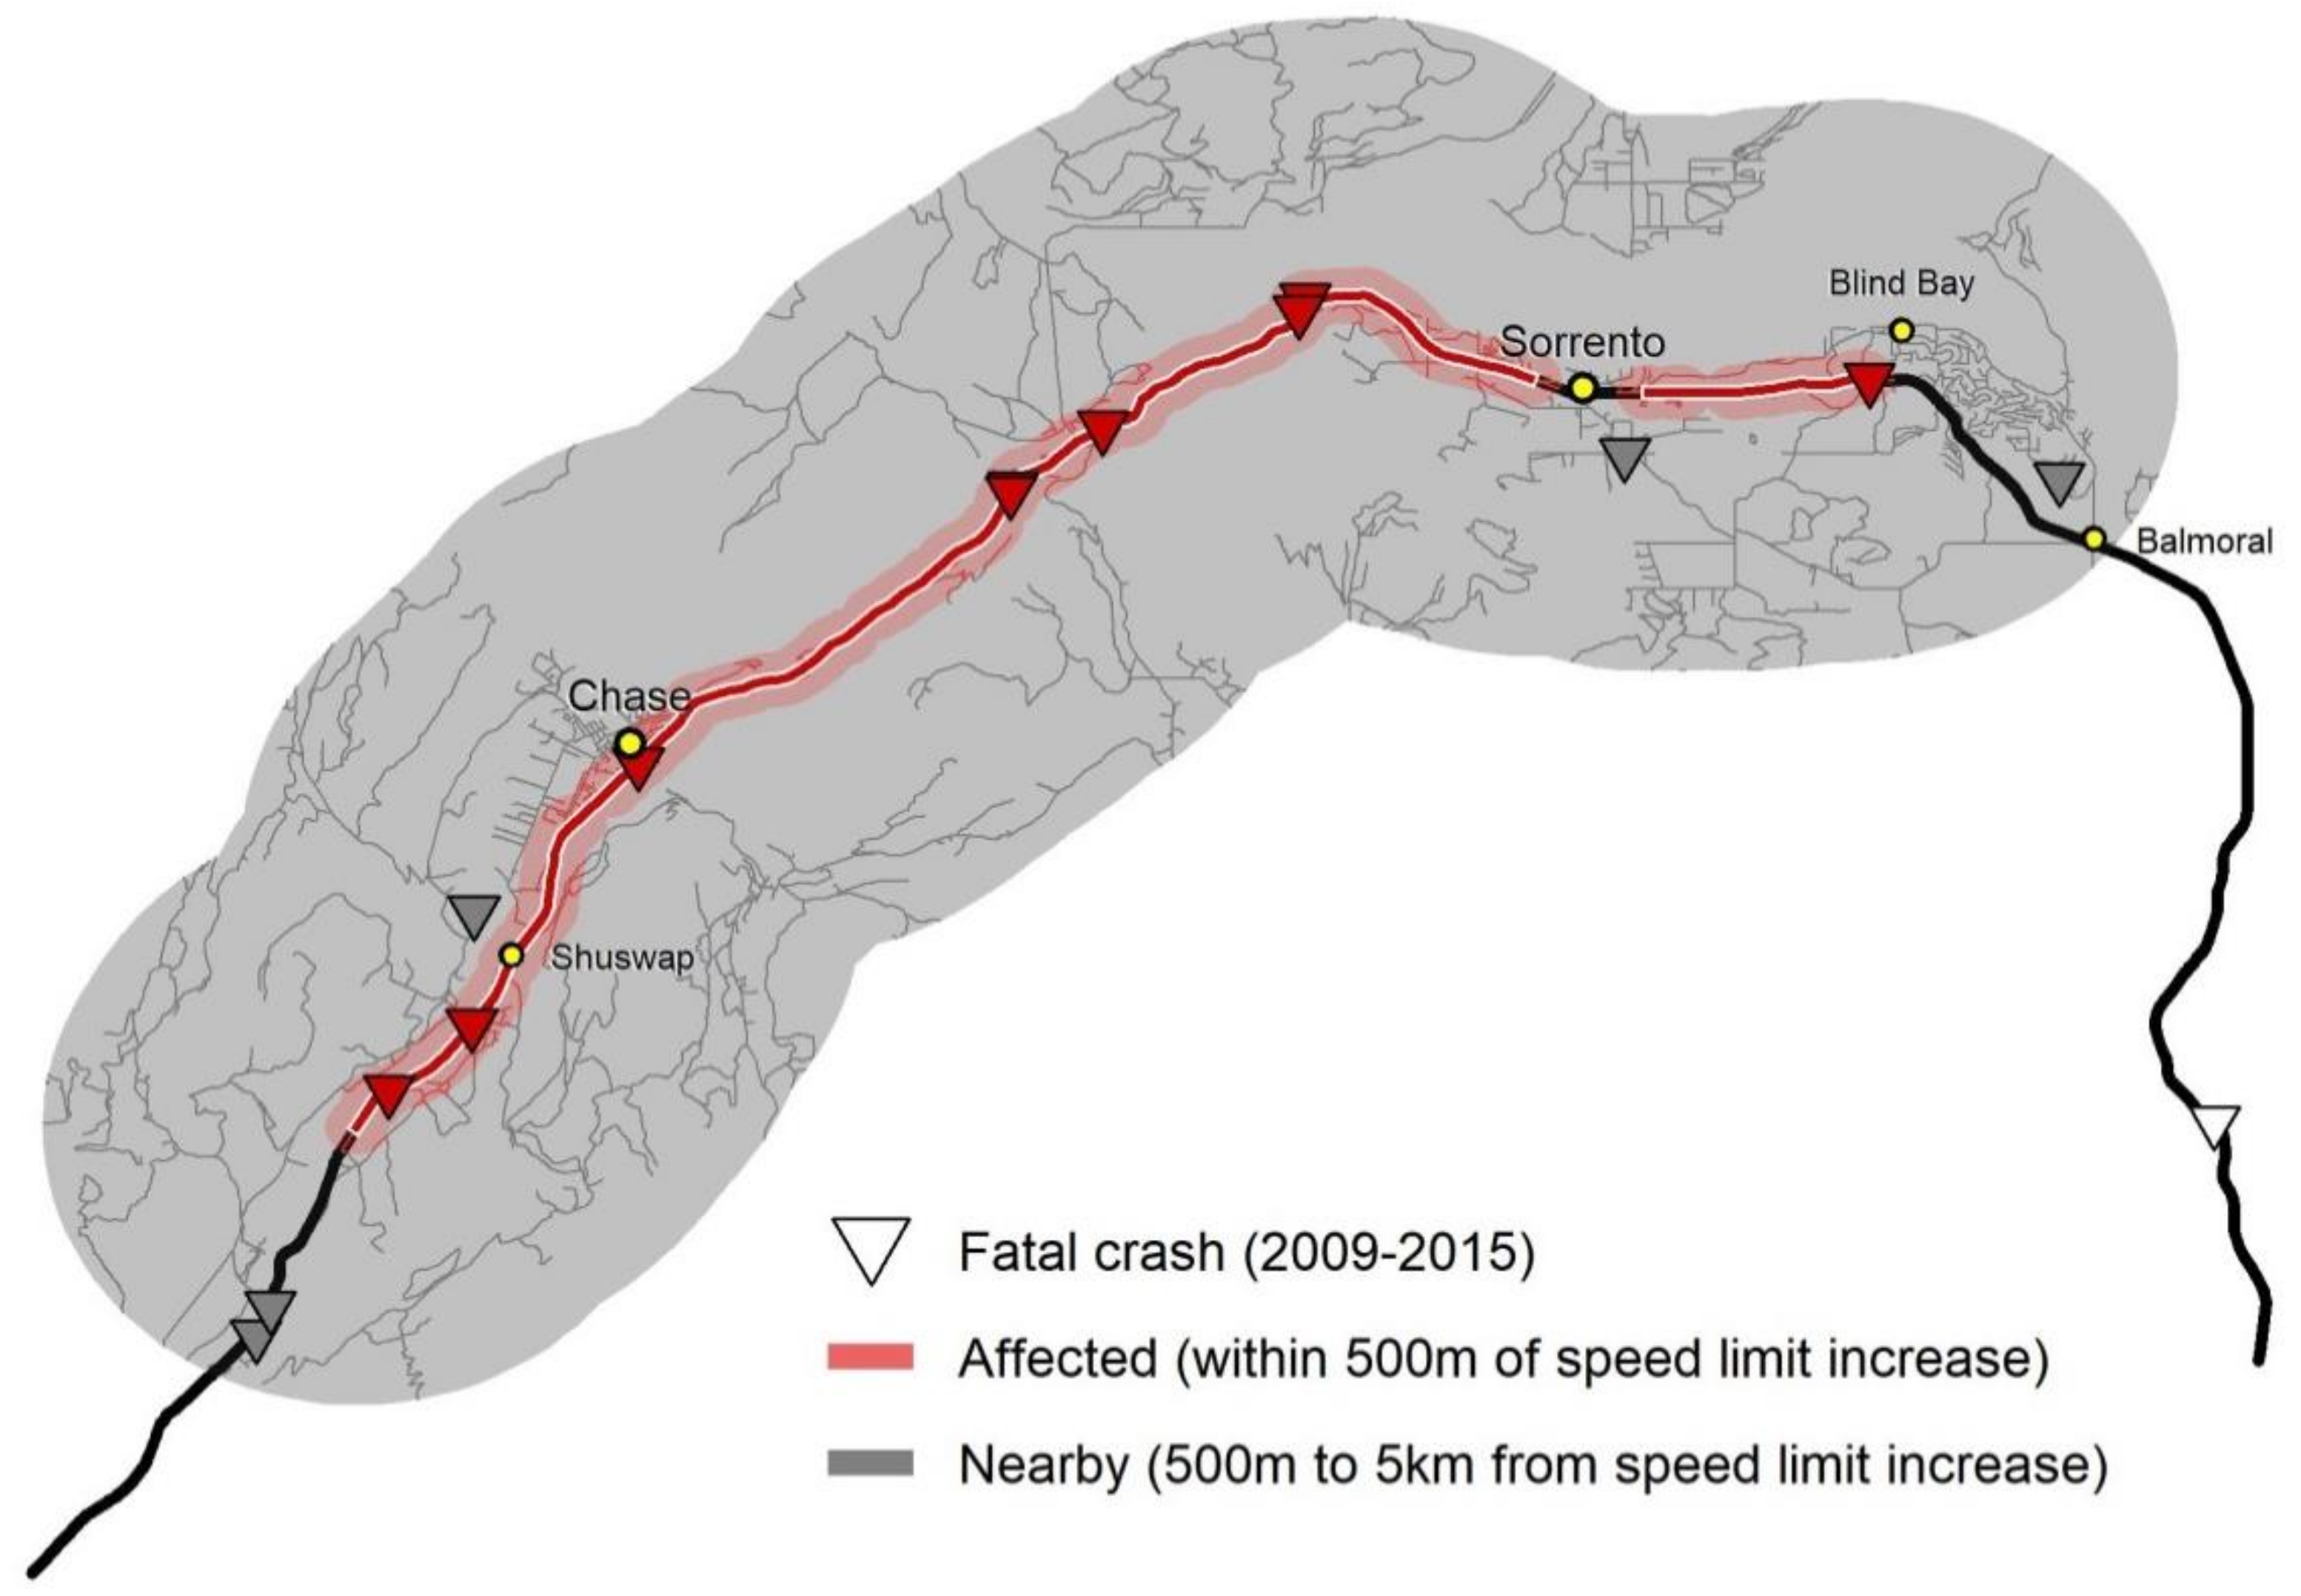
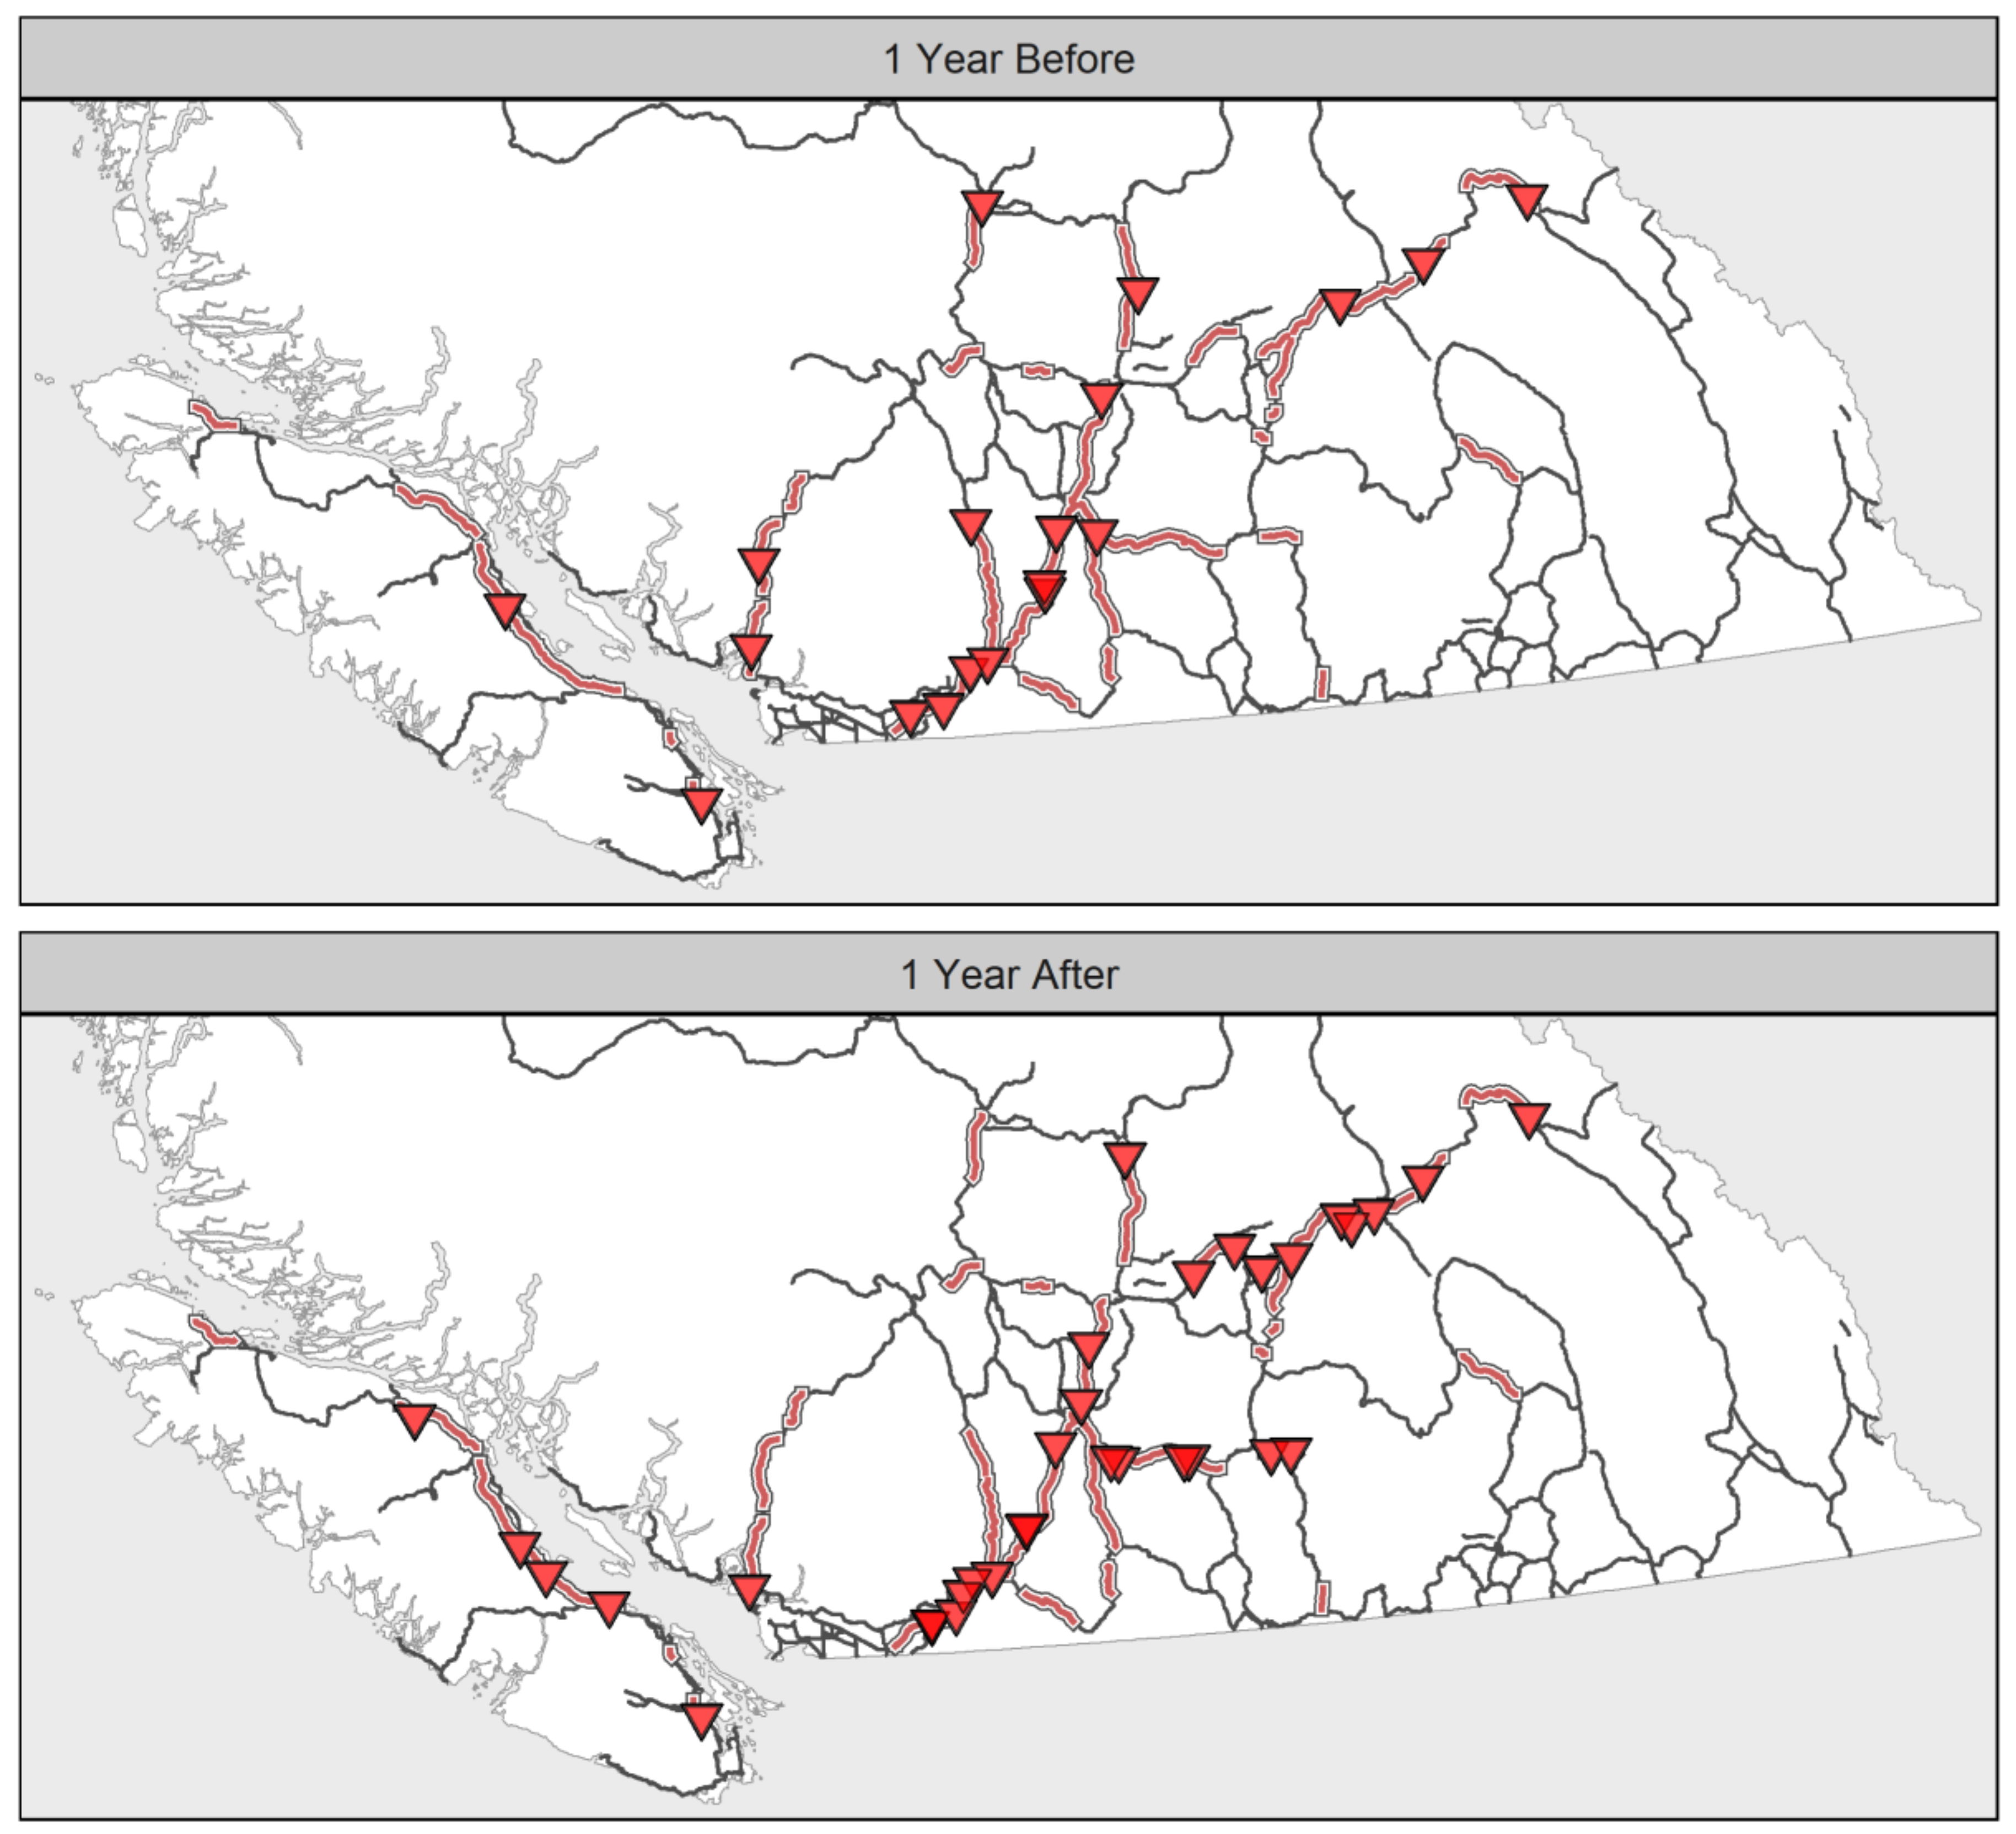
2.3. Mapping
2.4. Analysis
Analysis of Speed Data
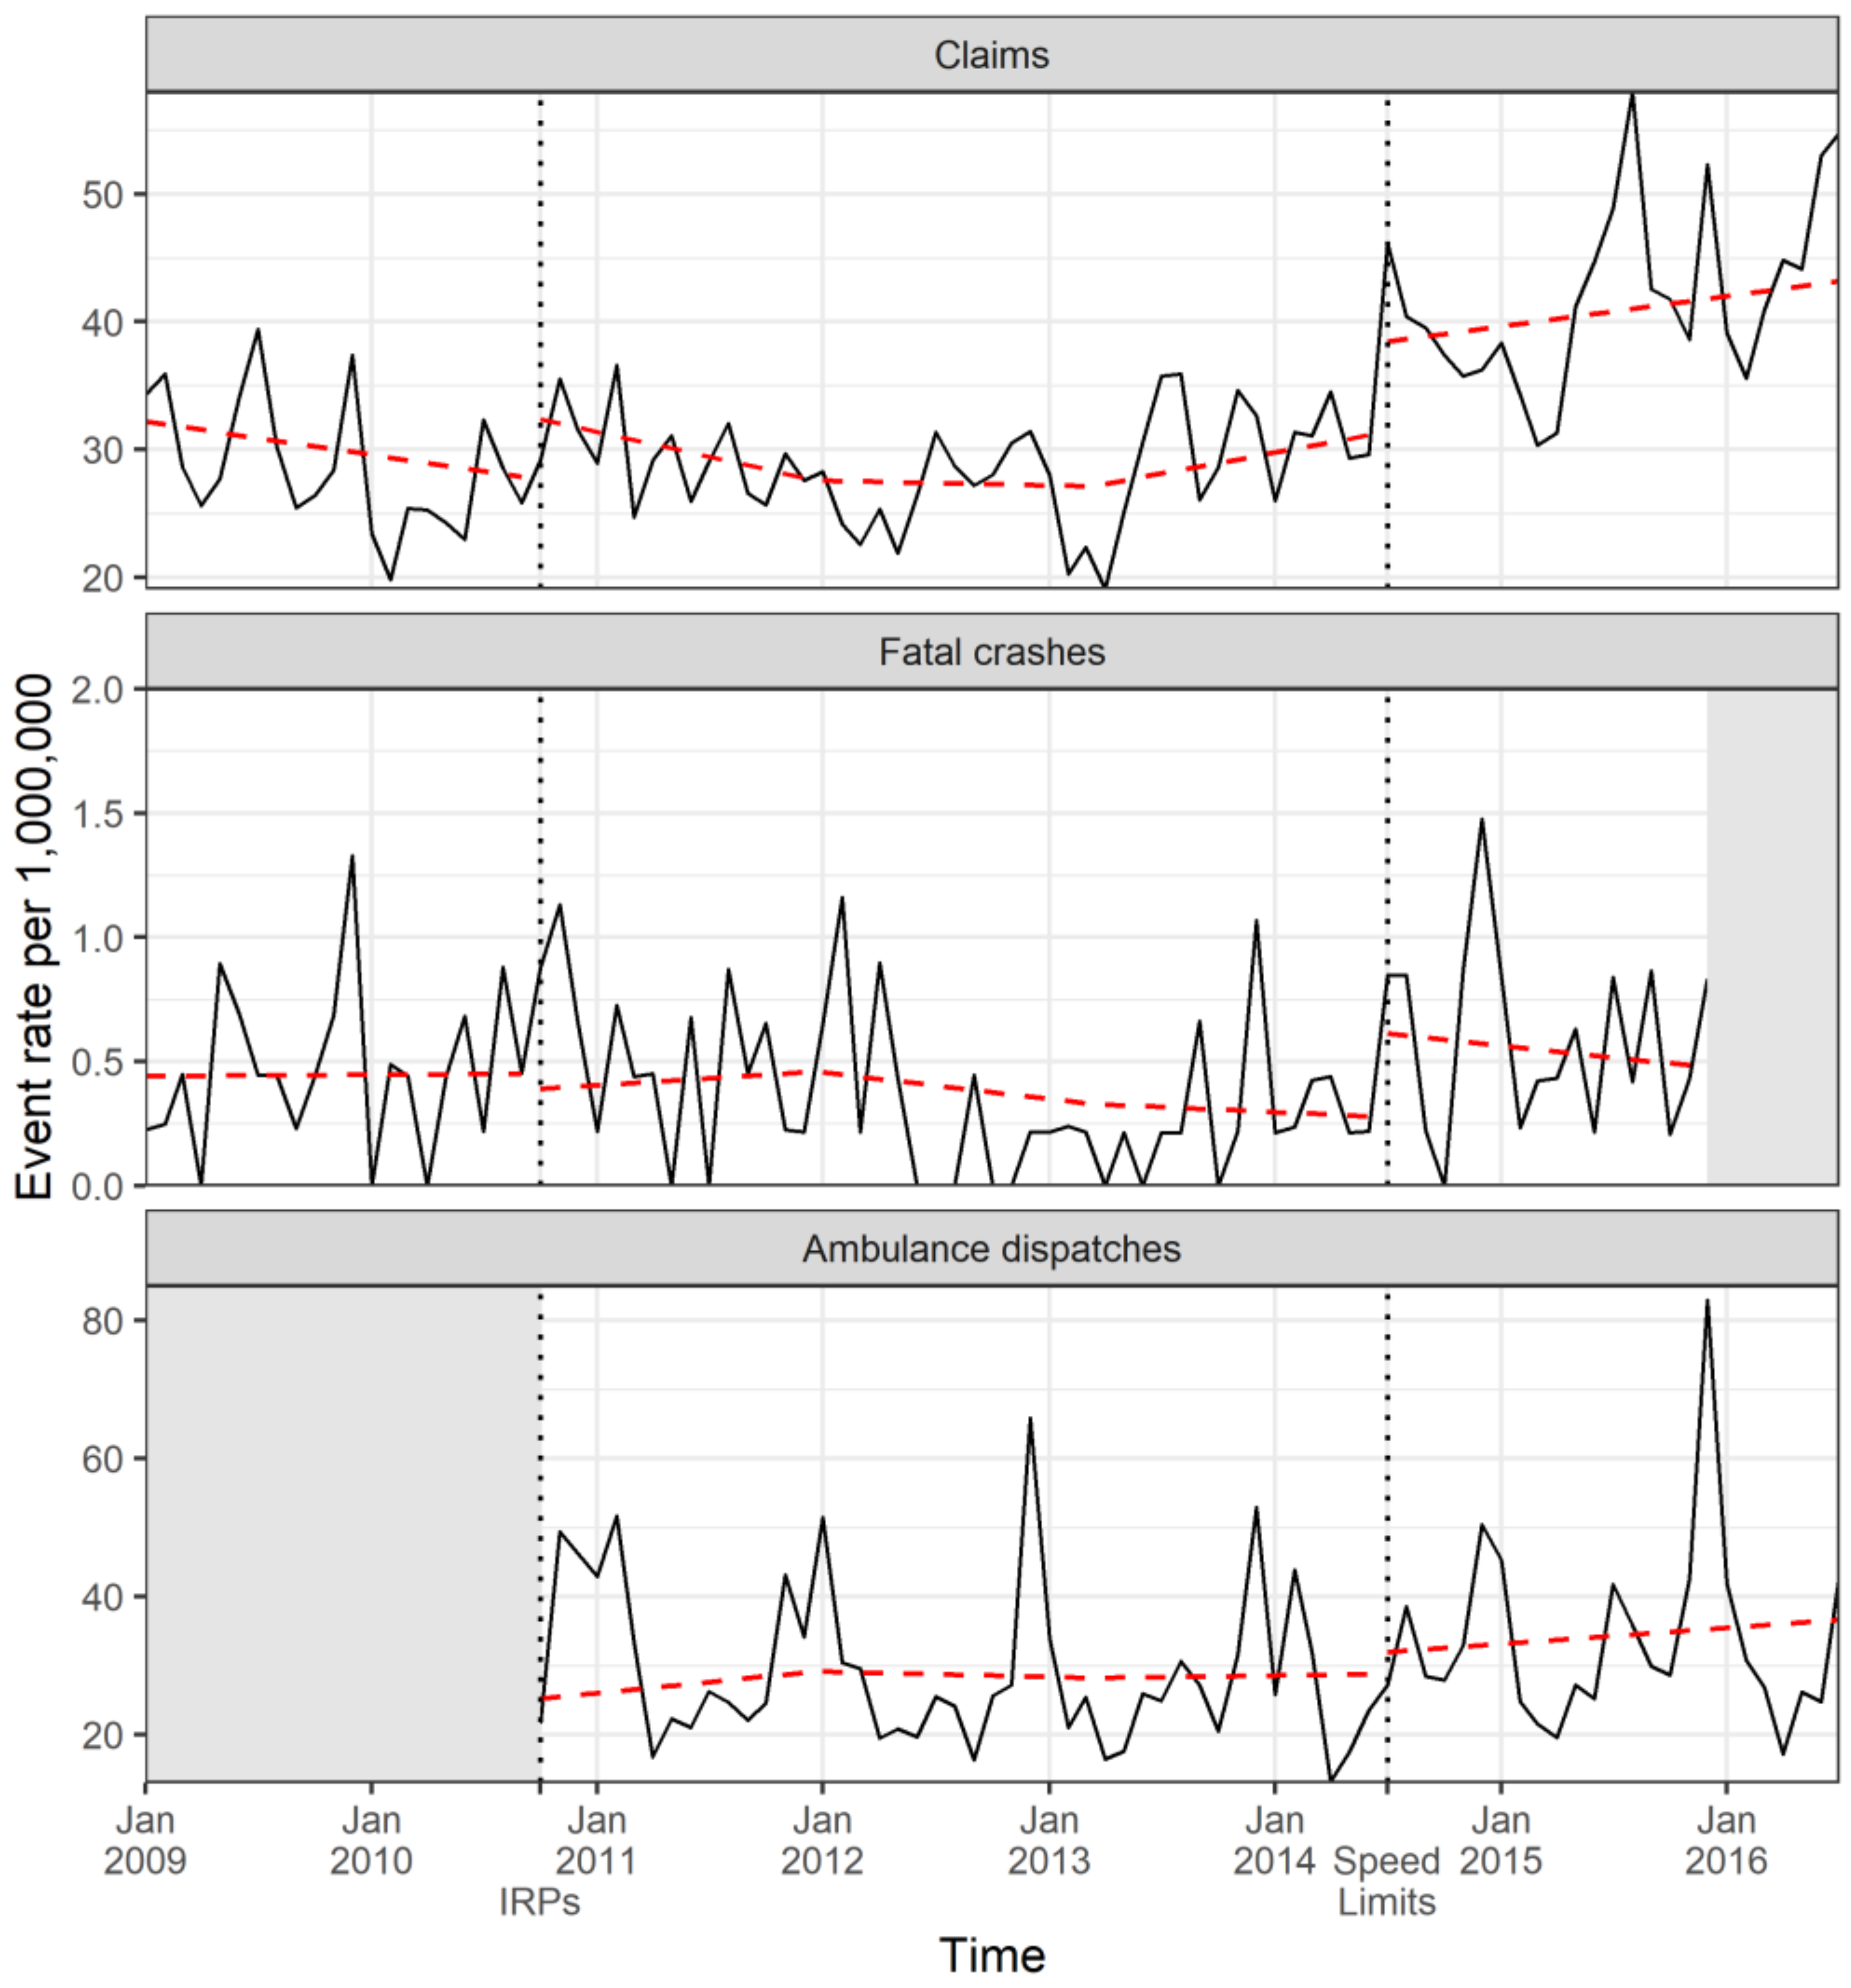
3. Results
4. Discussion
4.1. Previous Evaluations of Speed Limit Changes
4.2. There Were More Crashes Following the Speed Limit Increases in British Columbia
4.3. Spillover
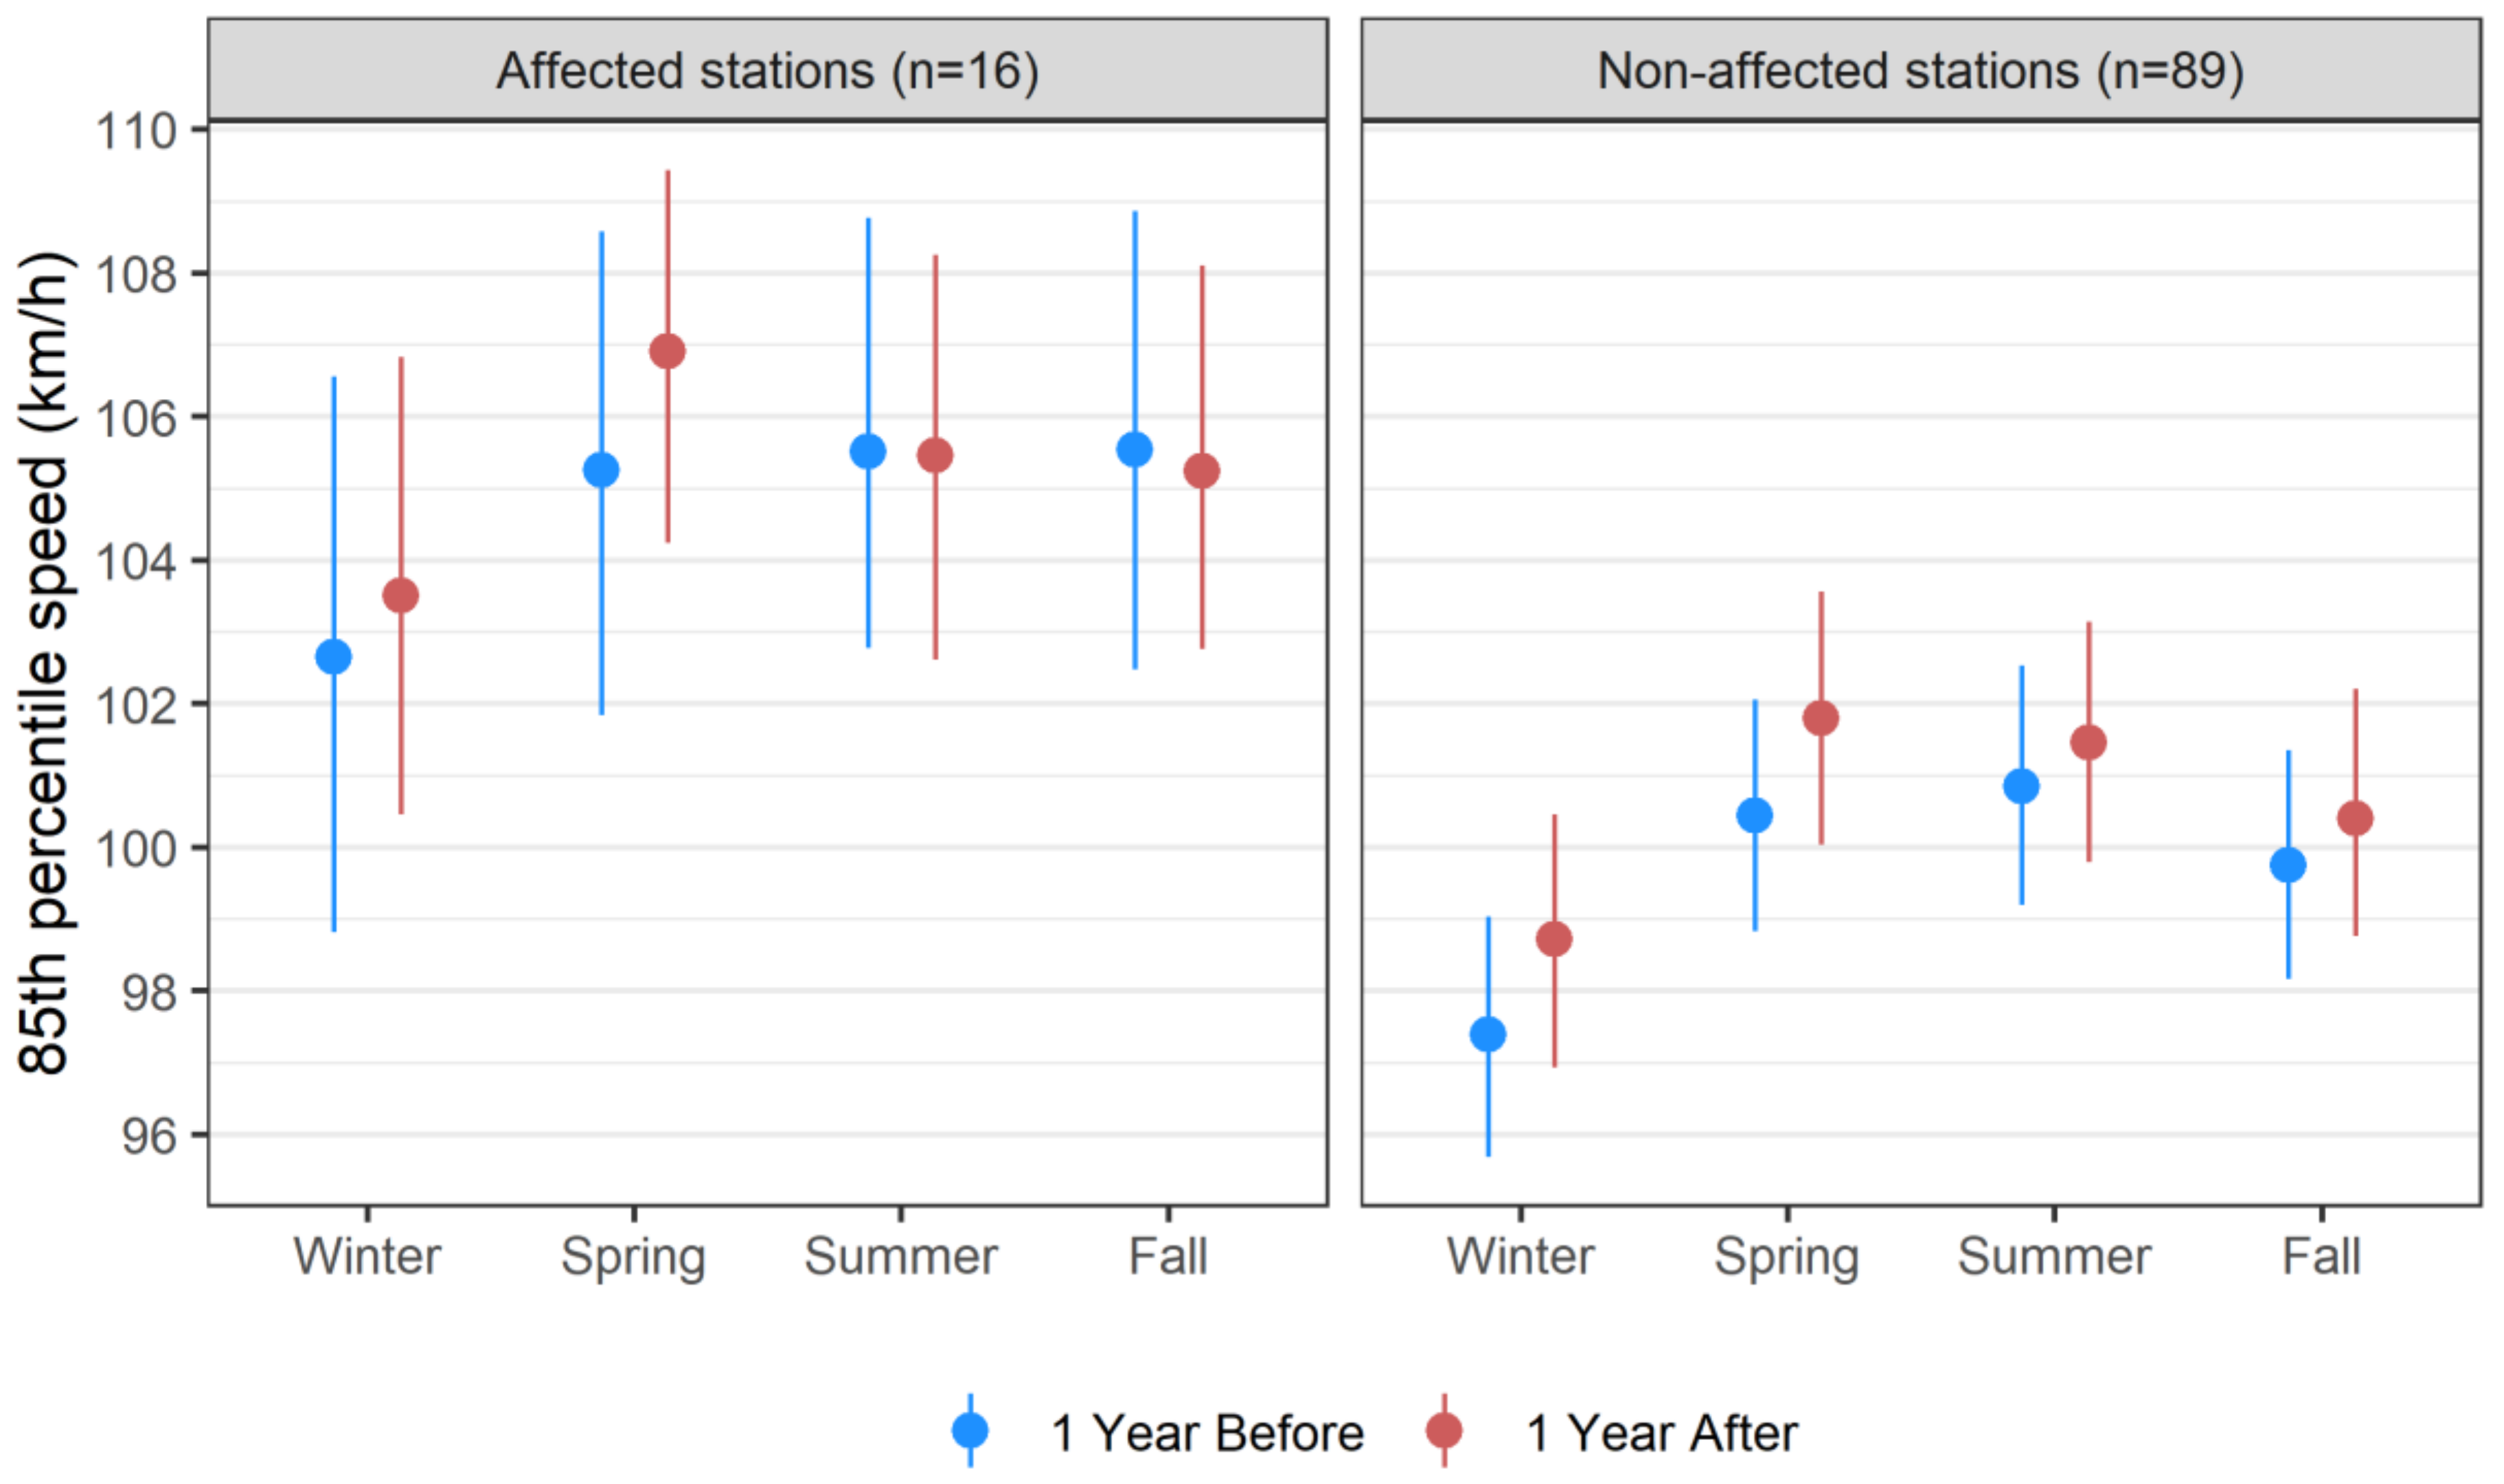
4.4. Travel Speed
5. Limitations
6. Conclusions
Author Contributions
Funding
Conflicts of Interest
References
- World Health Organization. Global Status Report on Road Safety 2013: Supporting a Decade of Action; World Health Organization: Geneva, Switzerland, 2013. [Google Scholar]
- Shinar, D. Speed and safety. In Traffic Safety and Human Behaviour; Shinar, D., Ed.; Emerald Group Publishing Limited: Bingley, UK, 2007; pp. 273–322. [Google Scholar]
- Wu, C.; Liu, Y. Queuing network modelling of driver workload and performance. IEEE Trans. Intell. Transp. Syst. 2007, 8, 528–537. [Google Scholar]
- Engström, J.; Johansson, E.; Östlund, J. Effects of visual and cognitive load in real and simulated motorway driving. Transp. Res. Part F Traffic Psychol. Behav. 2005, 8, 97–120. [Google Scholar] [CrossRef]
- Navon, D. The paradox of driving speed: Two adverse effects on highway accident rate. Accid. Anal. Prev. 2003, 35, 361–367. [Google Scholar] [CrossRef]
- United Nations Road Safety Collaboration. Speed Management: A Road Safety Manual for Decision-Makers and Practitioners; Global Road Safety Partnership; United Nations Road Safety Collaboration: Geneva, Switzerland, 2008. [Google Scholar]
- Nilsson, G., Ed.; The effects of speed limits on traffic crashes in Sweden. In Proceedings of the International Symposium on the Effects of Speed Limits on Traffic Crashes and Fuel Consumption; Organisation for Economy, Co-Operation, and Development (OECD): Paris, France; Dublin, Ireland, 1982. [Google Scholar]
- Nilsson, G. Traffic Safety Dimensions and the Power Model to Describe the Effect of Speed on Safety; Bulletin 221; Lund Institute of Technology: Lund, Sweden, 2004. [Google Scholar]
- Elvik, R. Speed Limits, Enforcement, and Health Consequences. Annu. Rev. Public Health 2012, 33, 225–238. [Google Scholar] [CrossRef] [PubMed]
- Finch, D.J.; Kompfner, P.; Lockwood, C.R.; Maycock, G. Speed, Speed Limits and Accidents; Project Report No.: 58; Transport Research Laboratory: Crowthorne, Berkshire, 1994. [Google Scholar]
- Shinar, D. Speed and Crashes: A Controversial Topic and an Elusive Relationship. In Managing Speed: Review of Current Practice for Setting and Enforcing Speed Limits; Appendix, B; Special Report, 254; Transportation Research Board TRB, Committee for Guidance on Setting and Enforcing Speed Limits; National Academy Press: Washington, DC, USA, 1998. [Google Scholar]
- Labi, S. Effects of Geometric Characteristics of Rural Two Lane Roads on Safety; School of Civil Engineering and Center for the Advancement of Transportation Safety (CATS), Purdue University: West Lafayette, IN, USA, 2006. [Google Scholar]
- Bunn, F.; Collier, T.; Frost, C.; Ker, K.; Roberts, I.; Wentz, R. Area-wide traffic calming for preventing traffic related injuries. Cochrane Database Syst. Rev. 2003, 1, CD003110. [Google Scholar] [CrossRef] [PubMed]
- Jaarsma, R.; Louwerse, R.; Dijkstra, A.; de Vries, J.; Spaas, J.-P. Making minor rural road networks safer: The effects of 60 km/h-zones. Accid. Anal. Prev. 2011, 43, 1508–1515. [Google Scholar] [CrossRef] [PubMed]
- Public Works and Water Management. Sustainable Safe road Design: A Practal Manual; World Bank and the Dutch Ministry of Transport; Public Works and Water Management: Hague, The Netherlands, 2005. [Google Scholar]
- Baruya, A. Speed-accident relationships on European roads. In Proceedings of the 9th International Conference Road Safety in Europe, Bergisch Gladbach, Germany, 21–23 September 1998; Part 10: Speed Management and Road Safety. Swedish National Road and Transport Research Institute: Linköping, Sweden, 1998. [Google Scholar]
- Martin, J.L.; Lenguerrand, E. A population based estimation of the driver protection provided by passenger cars: France 1996–2005. Accid. Anal. Prev. 2008, 40, 1811–1821. [Google Scholar] [CrossRef] [PubMed]
- Johnston, I. Reducing injury from speed related road crashes. Inj. Prev. 2004, 10, 257–259. [Google Scholar] [CrossRef] [PubMed]
- Aarts, L.; van Schagen, I. Driving speed and the risk of road crashes: A review. Accid. Anal. Prev. 2006, 38, 215–224. [Google Scholar] [CrossRef] [PubMed]
- Richards, D.; Cuerden, R. The Relationship between Speed and Car Driver Injury Severity; Department for transport: London, UK, 2009. [Google Scholar]
- Howard, E.; Cameron, I.; Langford, J.; Small, M.; Jonah, B.; Stipdonk, H.; McMahon, K.; McMurray, R.; Bliss, A.; Breen, J. Towards Zero: Ambitious Road Safety Targets and the Safe System Approach; Organization for Economic Co-Operation and Development, International Transportat Forum: Paris, France, 2008. [Google Scholar]
- Institute of Transportation Engineers. Speed Zone Guidelines: A Proposed Recommended Practice; Institute of Transportation Engineers: Washington, DC, USA, 1993. [Google Scholar]
- Elvik, R. Optimal speed limits : Limits of optimality models. Transp. Res. Rec. 2003, 1818, 32–38. [Google Scholar] [CrossRef]
- Forbes, G.J.; Gardner, T.; McGee, H.; Srinivasan, R. Methods and Practices for Setting Speed Limits: An Informational Report; Report No. FHWA-SA-12-004; U.S. Department of Transportation, Federal Highway Administration: Washington, DC, USA, 2011. [Google Scholar]
- Tingval, C.; Haworth, C. Vision Zero—An ethical approach to safety and mobility. In Proceedings of the 6th ITE International Conference Road Safety & Traffic Enforcement: Beyond 2000, Melbourne, Australia, 6–7 September 1999. [Google Scholar]
- Richter, E.D.; Berman, T.; Friedman, L.; Ben-David, G. Speed, road injury, and public health. Annu. Rev. Public Health 2006, 27, 125–152. [Google Scholar] [CrossRef] [PubMed]
- Sense BC. Safety by Education Not Speed Enforcement. Available online: http://www.sense.bc.ca/ (accessed on 5 August 2014).
- Stop100.ca. 2014. Available online: http://www.stop100.ca/ (accessed on 5 August 2014).
- Canadian Council of Motor Transport Administrators. Canadian Motor Vehicle Traffic Collision Statistics (2011); Canadian Council of Motor Transport Administrators: Ottawa, ON, Canada, 2013. [Google Scholar]
- World Health Organization. Global Status Report on Road Safety: Time for Action; World Health Organization: Geneva, Switzerland, 2009. [Google Scholar]
- Richter, E.D.; Friedman, L.S.; Berman, T.; Rivkind, A. Death and injury from motor vehicle crashes: A tale of two countries. Am. J. Prev. Med. 2005, 29, 440–449. [Google Scholar] [CrossRef] [PubMed]
- Lave, C.; Elias, P. Did the 65 mph speed limit save lives? Accid. Anal. Prev. 1994, 26, 49–62. [Google Scholar] [CrossRef]
- Lave, C.A. Speeding, Coordination, and the 55 MPH Limit. Am. Econ. Rev. 1985, 75, 1159–1164. [Google Scholar]
- Taylor, M.C.; Lynam, D.A.; Baruya, A. The Effects of Drivers’ Speed on the Frequency of Road Accidents; TRL Report 421; Transport Research Laboratory: Crowthorne, UK, 2000. [Google Scholar]
- Garber, N.J.; Gadiraju, R. Factors Affecting Speed Variance and Its Influence on Accidents; Transportation Research Record No. 1213; Human Performance and Highway Visibility: Design, Safety, and Methods, Transportation Research Board: Washington, DC, USA, 1989. [Google Scholar]
- McCarthy, P. Effect of Speed Limits on Speed Distributions and Highway Safety: A Survey of the Literature. In Special Report 254: Managing Speed: Review of Current Practice for Setting and Enforcing Speed Limits; Committee for Guidance on Setting and Enforcing Speed Limits; Transportation Research Board, National Research Council; National Academy Press: Washington, DC, USA, 1998; pp. 277–390. [Google Scholar]
- Freedman, M.; Williams, A.F. Speed associated with 55-mph and 65-mph speed limits in northeastern states. ITE J. 1992, 17–21. [Google Scholar]
- McCarthy, P.S. Highway safety and the 65-mph speed limit. Contemp. Econ. Policy 1991, 9, 82–92. [Google Scholar] [CrossRef]
- Brown, D.B.; Maghsoodloo, S.; McArdle, M.E. The safety impact of the 65 mph speed limit: A case study using Alabama accident records. J. Saf. Res. 1990, 21, 125–139. [Google Scholar] [CrossRef]
- Ossiander, E.M.; Cummings, P. Freeway speed limits and traffic fatalities in Washington State. Accid. Anal. Prev. 2002, 34, 13–18. [Google Scholar] [CrossRef]
- Retting, R.A.; Greene, M.A. Traffic speeds following repeal of the National maximum speed limit. Inst. Transp. Eng. J. 1997, 67, 42–46. [Google Scholar]
- Grabowski, D.C.; Morrisey, M.A. Systemwide implications of the repeal of the national maximum speed limit. Accid. Anal. Prev. 2007, 39, 180–189. [Google Scholar] [CrossRef] [PubMed]
- Shaw, R. B.C. Raises Speed Limits on a Number of Provincial Highways; Vancouver Sun; Pacific Newspaper Group: Vancouver, BC, Canada, 2014. [Google Scholar]
- Friedman, L.S.; Barach, P.; Richter, E.D. Raised speed limits, case fatality and road deaths: A six year follow-up using ARIMA models. Inj. Prev. 2007, 13, 156–161. [Google Scholar] [CrossRef] [PubMed]
- Box, G.E.P.; Jenkins, G.M. Time-Series Analysis: Forecasting and Control, 2nd ed.; Holden-Day: San Francisco, CA, USA, 1976. [Google Scholar]
- Brubacher, J.R.; Chan, H.; Brasher, P.; Erdelyi, S.; Desapriya, E.; Asbridge, M.; Purssell, R.; Macdonald, S.; Schuurman, N.; Pike, I. Reduction in Fatalities, Ambulance Calls, and Hospital Admissions for Road Trauma After Implementation of New Traffic Laws. Am. J. Public Health 2014, 104, e89–e97. [Google Scholar] [CrossRef] [PubMed]
- Hyndman, R.; Athanasopoulos, G.; Bergmeir, C.; Caceres, G.; Chhay, L.; O’Hara-Wild, M.; Petropoulos, F.; Razbash, S.; Wang, E.; Yasmeen, F. Forecast: Forecasting functions for Time Series and Linear Models. R Package Version 8.4. 2018. Available online: http://pkg.robjhyndman.com/forecast (accessed on 18 July, 2018).
- Johnson, P.; Klein, T.M.; Levy, P.; Maxwell, D. The Effectiveness of the 55 mph National Maximum Speed Limit as a Life Saving Benefit; U.S. Department of Transportation, National Highway Traffic Safety Administration, Office of State Vehicle Programs: Washington, DC, USA, 1981.
- McKnight, A.J.; Klein, T.M.; Tippetts, A.S. The Effect of the 65 mph Speed Limit through 1988: A Report to Congress; US DOT Report No. DOT HS 807 463; United States Department of Transportation: Washington, DC, USA, 1989.
- Garber, S.; Grahman, J.D. The effects of the new 65 mile-per-hour speed limit on rural highway fatalities: A state-by-state analysis. Accid. Anal. Prev. 1990, 22, 137–149. [Google Scholar] [CrossRef]
- Baum, H.M.; Wells, J.K.; Lund, A.K. The fatality consequences of the 65 mph speed limits, 1989. J. Saf. Res. 1991, 22, 171–177. [Google Scholar] [CrossRef]
- Farmer, C.M.; Retting, R.A.; Lund, A.K. Effect of the 1996 Speed Limit Changes on Motor Vehicle Occupant Fatalities; Insurance Institute for Highway Safety: Arlington, VA, USA, 1997. [Google Scholar]
- Wagenaar, A.C.; Streff, F.M.; Schultz, R.H. Effects of the 65 mph speed limit on injury morbidity and mortality. Accid. Anal. Prev. 1990, 22, 571–585. [Google Scholar] [CrossRef]
- Rock, S.M. Impact of the 65 mph speed limit on accidents, deaths, and injuries in Illinois. Accid. Anal. Prev. 1995, 27, 207–214. [Google Scholar] [CrossRef]
- Gallaher, M.M.; Sewell, C.M.; Flint, S.; Herndon, J.L.; Graff, H.; Fenner, J.; Hull, H.F. Effects of the 65-mph speed limit on rural interstate fatalities in New Mexico. JAMA 1989, 262, 2243–2245. [Google Scholar] [CrossRef] [PubMed]
- Bartle, S.T.; Baldwin, S.T.; Johnston, C.; King, W. 70-mph speed limit and motor vehicular fatalities on interstate highways. Am. J. Emerg. Med. 2003, 21, 429–434. [Google Scholar] [CrossRef]
- Vernon, D.D.; Cook, L.J.; Peterson, K.J.; Michael Dean, J. Effect of repeal of the national maximum speed limit law on occurrence of crashes, injury crashes, and fatal crashes on Utah highways. Accid. Anal. Prev. 2004, 36, 223–229. [Google Scholar] [CrossRef]
- Richter, E.D.; Barach, P.; Friedman, L.; Krikler, S.; Israeli, A. Raised speed limits, speed spillover, case-fatality rates, and road deaths in Israel: A 5-year follow-up. Am. J. Public Health 2004, 94, 568–574. [Google Scholar] [CrossRef] [PubMed]
- Sliogeris, J. 110 Kilometre Per Hour Speed Limit—Evaluation of Road Safety Effects; Report No GR 92-8; VicRoads: Carlton, Victoria, Australia, 1992. [Google Scholar]
- Woolley, J. Recent advantages of lower speed limits in Australia. J. East. Asia Soc. Transp. Stud. 2005, 6, 3562–3573. [Google Scholar]
- Helfenstein, U. When did a reduced speed limit show an effect? Exploratory identification of an intervention time. Accid. Anal. Prev. 1990, 22, 79–87. [Google Scholar] [CrossRef]
- Moore, S. Speed Doesn't Kill: The Repeal of the 55 mph Speed Limit; Policy analysis No. 346; The Cato Institute: Washington, DC, USA, 1999. [Google Scholar]
- Jehle, D.V.K.; Connolly, S.; Godzala, M.; Cole, A. Speed kills? Not always: The New York State thruway experience. J. Trauma-Inj. Infect. Crit. Care 2010, 69, 708–714. [Google Scholar] [CrossRef] [PubMed]
- Greenstone, M. A reexamination of resource allocation responses to the 65-mph speed limit. Econ. Inq. 2002, 40, 271–278. [Google Scholar] [CrossRef]
- Simons, R.; Brasher, P.; Taulu, T.; Lakha, N.; Molnar, N.; Caron, N.; Schuurman, N.; Evans, D.; Hameed, M. A population-based analysis of injury-related deaths and access to trauma care in rural-remote Northwest British Columbia. J. Trauma-Inj. Infect. Crit. Care 2010, 69, 11–19. [Google Scholar] [CrossRef] [PubMed]
- Kines, L. Transportation Minister Went His Own Way on Raising Speed Limits. Times Colonist 2014. [Google Scholar]
- Haglund, M.; Åberg, L. Speed choice in relation to speed limit and influences from other drivers. Transp. Res. Part F Traffic Psychol. Behav. 2000, 3, 39–51. [Google Scholar] [CrossRef]
- Mannering, F. Effects of insterstate speed limits on driving speeds: Some new evidence. In Proceedings of the Transportation Research Board 86th Annual Meeting, Washington, DC, USA, 21–25 January 2007. [Google Scholar]
- Retting, R.; Cheung, I. Traffic speeds associated with implementation of 80 mph speed limits on West Texas rural interstates. J. Saf. Res. 2008, 39, 529–534. [Google Scholar] [CrossRef] [PubMed]


| British Columbia | |||||||||||
|---|---|---|---|---|---|---|---|---|---|---|---|
| All Claims | Casualty Claims | Police Reported | Fatal Crashes | Ambulance Dispatches | Gas Sales (Billion L) | ||||||
| Count (% Missing GIS Coordinates) | |||||||||||
| Total | 4,242,998 | (29%) | 853,429 | (20%) | 625,988 | (21%) | 4,968 | (17%) | 375,163 | (7%) | 34.3 |
| July 2000–June 2001 | 248,465 | (41%) | 53,437 | (28%) | 43,081 | (30%) | 344 | (22%) | |||
| July 2001–June 2002 | 262,618 | (33%) | 53,684 | (23%) | 47,213 | (25%) | 382 | (17%) | |||
| July 2002–June 2003 | 244,508 | (31%) | 52,880 | (22%) | 47,179 | (20%) | 387 | (13%) | |||
| July 2003–June 2004 | 248,595 | (29%) | 52,305 | (21%) | 49,432 | (19%) | 403 | (12%) | |||
| July 2004–June 2005 | 248,982 | (28%) | 52,049 | (19%) | 49,576 | (19%) | 402 | (14%) | 35,712 | (14%) | |
| July 2005–June 2006 | 254,562 | (29%) | 52,589 | (20%) | 50,446 | (19%) | 395 | (14%) | 36,641 | (14%) | |
| July 2006–June 2007 | 274,684 | (30%) | 52,158 | (20%) | 49,367 | (20%) | 343 | (15%) | 36,496 | (14%) | |
| July 2007–June 2008 | 274,093 | (29%) | 52,028 | (20%) | 44,302 | (21%) | 354 | (13%) | 35,526 | (14%) | |
| July 2008–June 2009 | 276,462 | (29%) | 49,729 | (20%) | 36,518 | (20%) | 309 | (14%) | 32,138 | (15%) | |
| July 2009–June 2010 | 256,543 | (29%) | 50,642 | (19%) | 34,402 | (20%) | 345 | (18%) | 30,329 | (10%) | 4.80 |
| July 2010–June 2011 | 259,966 | (30%) | 51,939 | (20%) | 35,229 | (20%) | 277 | (19%) | 27,845 | (0%) | 4.80 |
| July 2011–June 2012 | 257,546 | (30%) | 53,091 | (20%) | 34,531 | (21%) | 269 | (29%) | 27,671 | (0%) | 4.66 |
| July 2012–June 2013 | 260,569 | (29%) | 54,704 | (19%) | 34,880 | (20%) | 242 | (23%) | 27,223 | (0%) | 4.54 |
| July 2013–June 2014 | 266,920 | (29%) | 54,294 | (21%) | 34,442 | (20%) | 245 | (24%) | 26,446 | (0%) | 4.60 |
| Speed Intervention | |||||||||||
| July 2014–June 2015 | 292,568 | (27%) | 57,214 | (21%) | 35,390 | (17%) | 271 | (20%) | 28,647 | (0%) | 5.17 |
| July 2015–June 2016 | 315,917 | (22%) | 60,686 | (15%) | 30,489 | (0%) | 5.77 | ||||
| Average | 265,187 | (30%) | 53,339 | (21%) | 41,733 | (21%) | 331 | (18%) | 31,264 | (7%) | 4.90 |
| Affected 1 | Nearby 2 | |||||||||
|---|---|---|---|---|---|---|---|---|---|---|
| All Claims | Casualty Claims | Police Reported | Fatal Crashes | Ambulance Dispatches | All Claims | Casualty Claims | Police Reported | Fatal Crashes | Ambulance Dispatches | |
| Total | 23,772 | 5518 | 24,678 | 488 | 16,298 | 131,109 | 25,657 | 34,994 | 275 | 22,177 |
| July 2000–June 2001 | 713 | 206 | 1543 | 43 | 4731 | 1251 | 1903 | 20 | ||
| July 2001–June 2002 | 1053 | 253 | 1924 | 40 | 6642 | 1385 | 2367 | 22 | ||
| July 2002–June 2003 | 1100 | 281 | 2001 | 42 | 6423 | 1462 | 2644 | 14 | ||
| July 2003–June 2004 | 1214 | 337 | 2195 | 42 | 6733 | 1547 | 2776 | 14 | ||
| July 2004–June 2005 | 1215 | 292 | 1982 | 39 | 827 | 7157 | 1617 | 2823 | 23 | 1856 |
| July 2005–June 2006 | 1280 | 303 | 2139 | 46 | 940 | 7468 | 1646 | 2965 | 29 | 1943 |
| July 2006–June 2007 | 1438 | 315 | 2176 | 39 | 1075 | 8286 | 1644 | 2902 | 14 | 2039 |
| July 2007–June 2008 | 1696 | 387 | 1843 | 30 | 1164 | 8881 | 1651 | 2531 | 27 | 1981 |
| July 2008–June 2009 | 1676 | 370 | 1527 | 27 | 1054 | 8979 | 1638 | 2224 | 22 | 1812 |
| July 2009–June 2010 | 1460 | 341 | 1278 | 25 | 1089 | 8238 | 1620 | 1966 | 22 | 1859 |
| July 2010–June 2011 | 1607 | 395 | 1401 | 30 | 1770 | 8417 | 1611 | 1985 | 14 | 1857 |
| July 2011–June 2012 | 1445 | 322 | 1267 | 26 | 1568 | 8265 | 1583 | 1899 | 10 | 1700 |
| July 2012–June 2013 | 1473 | 352 | 1136 | 7 | 1486 | 8467 | 1609 | 1930 | 19 | 1619 |
| July 2013–June 2014 | 1728 | 396 | 1050 | 19 | 1575 | 9392 | 1668 | 1921 | 16 | 1654 |
| Speed Intervention | ||||||||||
| July 2014–June 2015 | 2122 | 443 | 1216 | 33 | 1720 | 10,817 | 1728 | 2158 | 9 | 1883 |
| July 2015–June 2016 | 2552 | 525 | 2030 | 12,213 | 1997 | 1974 | ||||
| Average | 1486 | 345 | 1645 | 33 | 1358 | 8194 | 1604 | 2333 | 18 | 1848 |
| Estimate 1 (95% CI), p-Value | ||||||
|---|---|---|---|---|---|---|
| Affected 2 | Nearby 3 | BC | ||||
| All claims 4 | 43.0 (16.0, 76.4), | 0.001 | 25.7 (16.1, 36.1) | <0.001 | 5.1 (−7.4, 19.3) | 0.444 |
| Casualty claims 4 | 30.0 (9.5, 54.2), | 0.003 | 5.9 (−1.6, 14.0) | 0.128 | 4.8 (1.6, 8.1) | 0.003 |
| Fatal crashes 4 | 118.0 (10.9, 225.1) | 0.031 | −46.7 (−115.6, 22.2) | 0.184 | 2.4 (−12.9, 20.3) | 0.774 |
| Ambulance dispatches 5 | 8.8 (−7.0, 27.3) | 0.291 | 5.3 (−3.4, 14.8) | 0.242 | 4.5 (−0.9, 10.6) | 0.105 |
| All Stations (n = 105) | Affected Stations (n = 16) | Non-Affected Stations (n = 89) | ||||
|---|---|---|---|---|---|---|
| Average hourly | Before | After | Before | After | Before | After |
| Mean speed (kph) | 90.0 | 90.7 | 94.0 | 94.3 | 89.2 | 90.0 |
| Median speed (kph) | 90.3 | 91.1 | 94.8 | 95.1 | 89.5 | 90.4 |
| 85th percentile speed (kph) | 100.4 | 101.3 | 104.7 | 105.3 | 99.6 | 100.6 |
| Standard deviation speed (kph) | 11.4 | 11.5 | 11.6 | 11.9 | 11.3 | 11.5 |
| Traffic volume | 397 | 406 | 237 | 250 | 425 | 434 |
| Spring (March, April, May) | ||||||
| Mean speed (kph) | 90.8 | 92.0 | 94.6 | 96.1 | 90.1 | 91.3 |
| Median speed (kph) | 91.2 | 92.4 | 95.4 | 96.9 | 90.4 | 91.6 |
| 85th percentile speed (kph) | 101.2 | 102.6 | 105.3 | 106.9 | 100.4 | 101.8 |
| Standard deviation speed (kph) | 11.3 | 11.5 | 11.5 | 11.8 | 11.2 | 11.4 |
| Traffic volume | 392 | 408 | 227 | 245 | 422 | 437 |
| Summer (June, July, August) | ||||||
| Mean speed (kph) | 91.0 | 91.3 | 94.7 | 94.5 | 90.4 | 90.8 |
| Median speed (kph) | 91.4 | 91.7 | 95.4 | 95.3 | 90.7 | 91.1 |
| 85th percentile speed (kph) | 101.6 | 102.1 | 105.5 | 105.5 | 100.8 | 101.5 |
| Standard deviation speed (kph) | 11.3 | 11.5 | 11.5 | 11.9 | 11.3 | 11.4 |
| Traffic volume | 444 | 450 | 300 | 315 | 470 | 474 |
| Fall (September, October, November) | ||||||
| Mean speed (kph) | 90.1 | 90.4 | 94.8 | 94.2 | 89.3 | 89.8 |
| Median speed (kph) | 90.5 | 90.9 | 95.7 | 95.0 | 89.6 | 90.1 |
| 85th percentile speed (kph) | 100.6 | 101.1 | 105.5 | 105.2 | 99.7 | 100.4 |
| Standard deviation speed (kph) | 11.4 | 11.6 | 11.6 | 12.0 | 11.4 | 11.5 |
| Traffic volume | 400 | 399 | 226 | 234 | 431 | 429 |
| Winter (December, January, February) | ||||||
| Mean speed (kph) | 87.8 | 88.9 | 91.7 | 92.5 | 87.1 | 88.3 |
| Median speed (kph) | 88.2 | 89.3 | 92.6 | 93.3 | 87.4 | 88.6 |
| 85th percentile speed (kph) | 98.2 | 99.5 | 102.7 | 103.5 | 97.4 | 98.7 |
| Standard deviation speed (kph) | 11.5 | 11.6 | 11.9 | 12.0 | 11.4 | 11.5 |
| Traffic volume | 351 | 367 | 196 | 206 | 379 | 395 |
© 2018 by the authors. Licensee MDPI, Basel, Switzerland. This article is an open access article distributed under the terms and conditions of the Creative Commons Attribution (CC BY) license (http://creativecommons.org/licenses/by/4.0/).
Share and Cite
Brubacher, J.R.; Chan, H.; Erdelyi, S.; Lovegrove, G.; Faghihi, F. Road Safety Impact of Increased Rural Highway Speed Limits in British Columbia, Canada. Sustainability 2018, 10, 3555. https://doi.org/10.3390/su10103555
Brubacher JR, Chan H, Erdelyi S, Lovegrove G, Faghihi F. Road Safety Impact of Increased Rural Highway Speed Limits in British Columbia, Canada. Sustainability. 2018; 10(10):3555. https://doi.org/10.3390/su10103555
Chicago/Turabian StyleBrubacher, Jeffrey R, Herbert Chan, Shannon Erdelyi, Gordon Lovegrove, and Farhad Faghihi. 2018. "Road Safety Impact of Increased Rural Highway Speed Limits in British Columbia, Canada" Sustainability 10, no. 10: 3555. https://doi.org/10.3390/su10103555
APA StyleBrubacher, J. R., Chan, H., Erdelyi, S., Lovegrove, G., & Faghihi, F. (2018). Road Safety Impact of Increased Rural Highway Speed Limits in British Columbia, Canada. Sustainability, 10(10), 3555. https://doi.org/10.3390/su10103555