Article

Complex Systems, Agroecological Matrices, and Management of Forest Resources: An Example of an Application in Los Tuxtlas, Veracruz, Mexico

by
Carlos H. Ávila-Bello
1,*,
Ángel Héctor Hernández-Romero
1,
Martín Alfonso Mendoza-Briseño
2 and
Dinora Vázquez-Luna
1
1
Facultad de Ingeniería en Sistemas de Producción Agropecuaria, Universidad Veracruzana, Veracruz 96000, Mexico
2
Colegio de Postgraduados, Campus Veracruz, Veracruz 91700, Mexico
*
Author to whom correspondence should be addressed.
Sustainability 2018, 10(10), 3496; https://doi.org/10.3390/su10103496
Submission received: 9 May 2018 / Revised: 20 August 2018 / Accepted: 27 August 2018 / Published: 29 September 2018

Abstract

:
Today humanity faces several complex problems, two of which are global warming and the loss of biological diversity. An agroecological matrix approach, conceives the territory as patches of natural and cultivated vegetation, interconnected to maintain watershed integrity. Many ethnic groups maintain a high biological heterogeneity as in the case of the agrological matrix. This study analyzed features and trends in a specific agroecological matrix, integrating local and scientific knowledge with environmental and social information, as a complex system. For the last 15 years we studied agroecological spaces used by the Ntaj’uy (Zoque-Popoluca) people in Los Tuxtlas, Veracruz, Mexico. Participatory methods were used to understand social interactions and land management decisions. Ecology field methods allowed us to assess soil loss, litter production, water quality, and vegetation structure. Soil erosion, vegetation fragmentation and social marginalization are the most important problems in the region; the tropical sub-evergreen forest has decreased by about 60%, the deciduous forest is down by 80%, and cultivated pastures have increased over 400%. Coffee and milpa agroecosystems could be improved, through product diversification, along with interconnectivity among vegetation patches, to prevent environmental degradation, and improve conditions to reach food sovereignty and income diversification, in a context of Ntaj’uy self-determination in their territories.

1. Introduction

Humanity faces crucial challenges for the preservation of our environment. Societies have changed, although that transformation has carried out phenomena such as global warming and the loss of biological diversity, in the context of globalization. One essential challenge is the sustainable conservation and management of forest ecosystems, based in the biological diversity they contain [1], but also keeping in mind that, in a country such as Mexico, the existence, evolution, and transformation of many of these ecosystems is linked to the way in which human communities with cultural diversity manage ecological resources. This makes the studying, planning, and management of forest ecosystems a complex task. In this sense, the application of the paradigms of complex systems and agroecological matrices can guide the future management of the country’s forest resources. In the case of the first paradigm, a complex system needs to be understood as a whole, as a network of interactions and boundaries; hence, living systems can only be studied as a whole; their elements and interactions cannot be separated [2,3,4]. The second paradigm, the agroecological-matrix, is supported by the theory of island biogeography, as well as by alpha, beta, and gamma diversities, which allow for gene flow between populations. [5]. Richness and equitability are essential elements of the agroecological matrix, which can be understood as the set of spaces covered by connected patches of vegetation, natural or cultivated, facilitating gene flow between populations, the preservation of diverse groups of species, different trophic chains, and biogeochemical cycles that allow for a dynamic equilibrium in the ecosystem [5]. The four main elements that an agroecological matrix must have are 1. being a habitat for different species; 2. regulating the movement of species; 3. being a buffer for sensitive areas and 4. maintaining the integrity of basins in relation to soil, water and other resources [1]. According to the theory of island biogeography, the biodiversity on an island will depend on its size and distance from other islands. A large island may be a source of seeds and propagules for smaller islands, although this will also depend on the distance between them, as well on their rates of migration and extinction; a small, isolated island may have a large amount of endemism, yet many of its populations will become extinct if they are small (as an effect of endogamy) and form metapopulations (a population derived from another, larger one, in which each local population occupies different patches) [6]. In many cases, this leads to studies on the particular conditions of each population, but also constitutes, particularly in areas dedicated to agriculture and forestry production, an important effort to communicate each space or island. Recently, the application of the theory of biogeography of islands to agroecosystems has been questioned [7], since patches of vegetation will always be surrounded by more or less complex structures that may allow other species to establish in the patches of the matrix. These species could play different roles and eventually settle in the most complex patches of the matrix.
The study of forest resources, as part of an agroecological matrix, could find better explanations and solutions using the complex systems approach, forming interdisciplinary and transdisciplinary teams, allowing for the participation of native or local people that manage resources on a daily basis that know, in detail, the intimate phenomena of each ecological niche, that is, the biological diversity and the agroecological matrix [3].
In Latin America, particularly in Mexico, different environmental conditions exist that allow the establishment of highly developed cultures before the Spanish conquest; many of them still exist today. These cultures have a different conception of nature from that of the West, the territories in which these people are located must be understood as culturally modeled, since they were built by societies that structure complex agroecosystems depending on their available technology and their needs, as well as on adapting and adopting elements from other cultures; an example of this are traditional coffee agroecosystems [8]. The tradition, still kept by many peasants and indigenous communities, is to handle a large number of species and communities; this practice aims to towards the conservation of biodiversity, and the maintenance of dynamic stability. These practices constitute the application of modern agroecological matrices at present [5]. The mosaics that have been created help to prevent climate risks such as floods or landslides and achieve ecological balance and food security in sustainable conditions through self-supply, exchange, or the sale of products to local or regional markets. Although ecological reserves play a very important role in safeguarding the wide range of species, the role played by different patches, interconnected by agroecological matrices of different qualities is crucial [1,9]. In the case of coffee-producing agroecosystems, the indigenous people produce intermediate levels of disruption, in which up to 50 or 60 species of trees are associated with coffee [10,11], contributing to other functions, ranging from the conservation of rare or endangered predatory insects, to storing carbon, filtering water and increasing levels of biological diversity. In addition, the matrix allows connectivity between patches, favoring gene flow and the health of local, regional, and global environments.
The objective of this work is to analyze the conditions and perspectives of change in an agroecological matrix, integrating local knowledge about soils and vegetation, soil and water properties, soil erosion, vegetation quality, and social marginalization as a complex system.

2. Materials and Methods
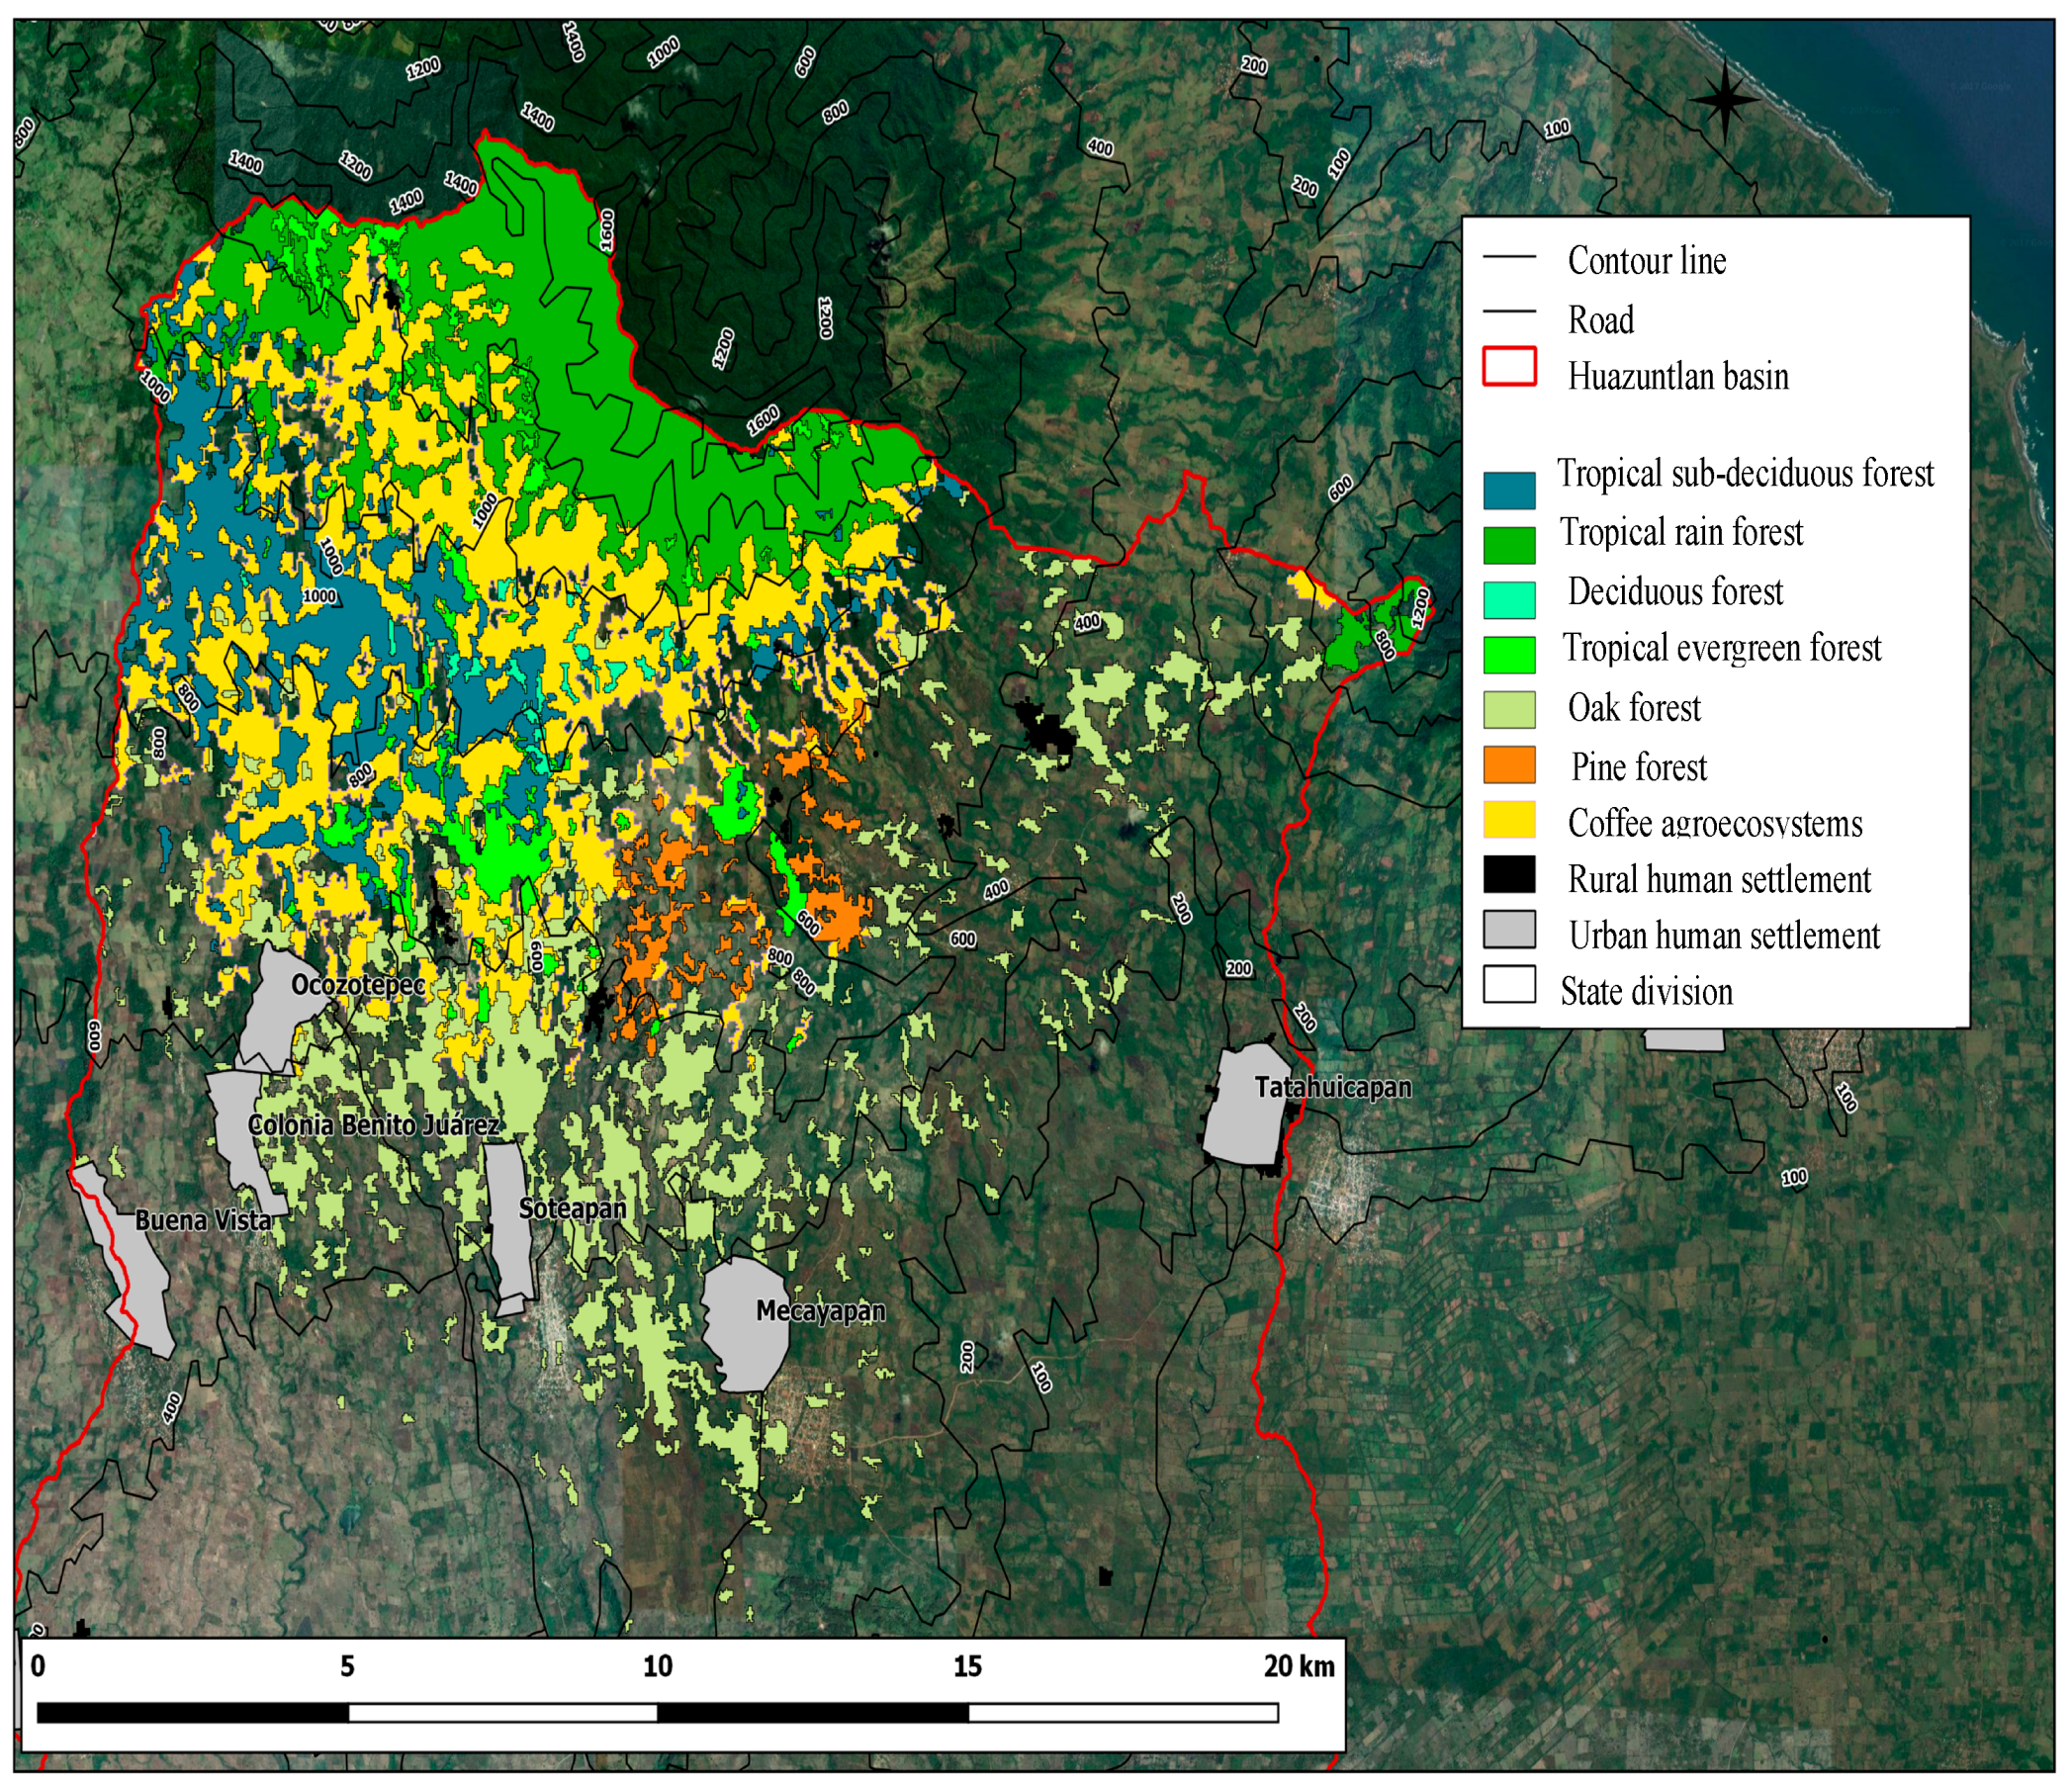
2.1. Location

Los Tuxtlas region, which includes the Biosphere Reserve of the same name, is a complex formed by very diverse natural and cultural components, located at Southern coast of the Gulf of Mexico (18°20′42″ N, 94°51′26″ W), between the cities of Veracruz to the northwest and Coatzacoalcos-Minatitlan to the southwest [12]. The region is in the Plain Morphotectonic Province of the Gulf of Mexico, formed by andesitic lava from the late Cenozoic period [13]. The physiography presents an altitudinal gradient that ranges between 132 and 1600 meters above sea level (m.a.s.l) with medium and high hillsides and slopes between 15% and 35% [12]. Its rugged topography has allowed some ecosystems to remain practically unaltered. Santa Marta Sierra, at 1600 masl, in the center of Los Tuxtlas Biosphere Reserve, is the source of the Huazuntlan River, whose basin covers an area of 135,600 ha, with an average flow of 7 m3/s and its net runoff of 363.2 Mm3/year (million m3 per year); it exports 31.5 Mm3/year of surface water and contributes to the recharge of two aquifers: Soteapan-Hueyapan, with a recharge volume of 145.6 Mm3/year, and Coatzacoalcos coastal aquifer, with 172.2 Mm3, which presents saline intrusion [14,15,16]. This source provides 80% of the water used by the urban populations of main cities of the region: Coatzacoalcos, Minatitlan, Acayucan and others (over 600,000 people), through the Yuribia dam and the Platanillo river [17]. Region studied, Huazuntlan River Basin, comprises three main micro-basins (Ozuluapan, Huazuntlán, and Texizapan), which cover ejidos and localities of eight municipalities. The predominant climate in the area is warm, very humid (Afm) between 700 and 1000 masl, with an annual rainfall of 2500 to 4000 mm; annual temperature ranges between 22 and 24 °C; the coldest month is over 18 °C; semi-warm, very humid (A)C(fm), with an average annual temperature above 18 °C and annual rainfall over 4000 mm, is found starting at 900 masl; the driest month presents at least 40 mm of rain. The mountain range produces a sort of rain shade towards the flatlands to the west, since it catches the humidity coming from the Gulf of Mexico, and there are, therefore, more rains than in leeward [18,19]. Dominant soils are Luvisols, Acrisols, Lithosols and Andosols [20]. The main types of vegetation are the tropical rainforest, tropical evergreen forest, tropical sub-deciduous forest, deciduous forests, tropical pine forests, tropical oak forests, and induced savannas; at the lower basin, are mangroves, coastal vegetation and different successional stages. Surface covered by forests and rainforests is less than 10% of the total area; land cover is generally much disrupted with vegetation, such as the tropical oaks and the deciduous forests, which have nearly disappeared, although remains of all types of vegetation have been modified to establish shaded coffee plantations. Pine stands are the least disrupted type of vegetation, due perhaps to the limiting conditions of soils for crop development [18,21]. Fauna is represented by over 400 species of birds (40% of all the species recorded in the country); 102 species of mammals; 108 species of reptiles and amphibians; and 89 species of fishes. Out of the 1149 species recorded in the region, 21 are native, and at least 102 are legally considered to be in danger of extinction, including the tapir (Tapirus barderii), jaguar (Felis onca), whitetail deer (Odocoileus virginianus), the spider monkey (Ateles geoffroyi), and others [22,23].

2.2. Methods

Social characteristics were studied, which involved mapping and superimposing geographical areas living in poverty and marginalization with geographical areas in which environmental problems were verified, such as deforestation, soil fragility, and access to clean water and health services [24]. For Mexico, CONAPO [25] has developed a marginalization index, which is used in this study, which integrates nine indicators related to the percentage of people that has access to education, housing, services, and income. Then, principal components analysis is performed with indicators that were previously standardized. Results are grouped into five categories or degrees of marginalization: very low [−2.37, −1.22], low [−1.22, −0.65], medium [−0.65, −0.08], high [−0.08, 1.07] and very high [1.07, 4.50]. This, marginalization index synthesizes the lack of access to education, the number of people living in inadequate housing, and the lack of public goods [25], and was reviewed for the municipal areas that compose the Huazuntlan Basin River to identify connections between poverty, conditions that characterize the population, and the environment. It is important to note that there are really no spaces in the territory that are not being used, except in the core area of Los Tuxtlas Biosphere Reserve, at the highest part of the mountain. Land property distribution responds to cultural patterns and different public policies, so every peasant has a set of little plots dispersed in the ejido, some with different land use (milpa, coffee, and cattle) and others in distinct stages of secondary succession. For water, soil, and vegetation studies, representative sites were chosen, according to the distribution in the basin but also soil uses and the presence of human populations (for water samples), for sampling between 2007 and 2009. Twelve sampling sites (triplicated samples) were chosen on the main micro-basins of the Huazuntlan river, three points for every micro-basin and three points in the lower basin (past the joining of the three flows); variables evaluated included total coliforms (TC), fecal coliforms (FC), hardness (H), chlorides (Cl−1), temperature (T), pH, oxygen dissolved (OD), chemical and biochemical oxygen demand (DQO and DBO5), specific conductivity (SC), salinity (Sal), nitrates (NO3−1), total phosphorous (TP), turbidity (Tb), total solids dissolved (TSD), and greases and oils (OG). Parameters were determined in the lab using standard methods [26], as well as those established in the official Mexican norms for analytical result quality control [27]. Soil characterization was carried out based on 12 soil profiles, along with the study area, as well as 28 surface samples (60 cm in depth) [28]. Between 2007 and 2009, erosion was measured, directly (erosion pins or nail and washer method) and indirectly (Universal Soil Loss Equation (USLE), in 28 places in 12 locations (15 replicates at each site) along the Huazuntlán river sub-basin, corresponding to six different soil uses. In the first case, the amount of soil lost (cm) was considered, along with the apparent soil density, while USLE-estimations were made considering parameters such as average annual rainfall (Pm), the content of organic matter (OM) and soil texture, slope grade and length (S), plant coverage (C) and conservation practices carried out in each place [29,30]. To evaluate the state of the vegetation, we used area methods (30 plots, 20 × 20 m). Diameter at breast height (DBH) of all trees was measured 1.30 m above ground level, as well as their total height and tree bole height, using a Haga altimeter. Using data from Castillo-Capitan et al. [11], species richness and diversity were estimated with Shannon-Wiener and inverse Simpson diversity indexes using the Software Estimates 8.2.0 [31].
Finally, to structure higher quality agroecological matrices, native forest species (Table 1) were collected and spread, several of which are in a risk category, according to the Mexican norm NOM-059-ECOL-2001 [32], thereby contributing to the preservation of species with a high ecological value. Particularly, trees have been established in the remains of tropical sub-evergreen forest (TSEF) used for the production of coffee, maize, and cattle. The plots for reforestation were selected according to farmer’s availability; farmer’s interest in productive diversification; the sustainable use of nature and non-economic payments, such as their plots being in TSEF and strategic areas, that is, the banks of rivers or streams, but near to means of communication, so they can serve as places for dialogue and the exchange of experiences. For the development of the soil use potential map, we used the raster’s reclassification according to the limiting factors measured (slope, soil use, erosion, and soil texture). They were multiplied by their corresponding weight and added depending on the referred value. Each cell of the raster was then calculated according to Marinoni [33].

3. Results and Discussion

3.1. Social Characteristics

Social marginalization is a structural phenomenon that is expressed in the exclusion or relegation of social groups from the set of opportunities and benefits of the development process, and exposes them to social deprivations, risks and vulnerabilities [25], a process that has become aggravated in recent years, along with problems related to environmental deterioration. Within the debate on the connection between poverty and environment, two theories exist: The predominant theory argues that poverty is one of the greatest causes of environmental deterioration, and therefore, policies that wish to solve environmental problems must first tackle the problem of poverty, many times through care assistance programs; the opposing theory argues that the direct connection between poverty and environmental deterioration is too simplistic, since it depends on a whole series of economic, political, social, anthropological, psychological, educational and environmental factors [34,35]. Marginalization index for the municipalities of the studied region, and individual indicators used to build that index, are presented in Table 2.
Average value of the index of marginalization of these populations is high or very high and without evidence of improvements. Moreover, populations of the municipal areas analyzed have grown in the last 40 years at an annual rate of 3%. Also, population density in the four most important municipal areas is 67.9 (Soteapan), 58.5 (Mecayapan), 48.5 (Tatahuicapan), and 51 pop./km2 (Pajapan) (average for Mexico, at a national level, is 57). This exerts greater pressure on nature in terms of direct use, whether it is via personal or family consumption, or productive use. In the latter, there is also less legal certainty due to reforms in Mexican laws concerning land ownership [36].

3.2. Deforestation and Land Use

In the social marginalization context described above, land use changes, such as agriculture and cattle farming are driving losses in forest area and biodiversity with resulting environmental and social problems. Between 1986 and 2010 tropical sub-evergreen forest area decreased by 61%; deciduous forests, 81%; and oak forests, 51%. Planted grasslands have increased by 604%, and induced grasslands, 400%. Tropical rainforest has increased in area, since it is more or less protected inside the Los Tuxtlas Biosphere Reserve (Table 3). This has had strong repercussions on water retention and quality, as well as in the sequestration of CO2. In the case of the deciduous forests, it is important to remember that these are perhaps the most biologically diverse type of vegetation and endemic species in the country. Given their extension, fragmented nature, and occurrence in variable altitudes and under different weather regimes, these characteristics ensure an important supply of water, both locally and regionally, even in the dry season [37].

3.3. Soil Erosion

Soils in the area are young; pH varies between 4.4 and 6.6; 67% present clay-like textures, whereas 33% have a silt texture (clay, sand and sandy clay). The areas used for agriculture and cattle farming presented low or extremely low percentages of organic matter (0.1 to 5.3%, respectively). This could be due to the lack of trees (the main source of organic matter) in these agricultural soils but is probably due to management practices that involved slash and burn, overgrazing, and conditions that promoted soil erosion [22,23]. In this region, average production of leaf litter in coffee plantations for different vegetation cover has been measured: 1341.84 kg ha−1 year−1 under tropical sub-evergreen forests (TSF), 1437.6 kg ha−1 year−1 under tropical rain forests (TRF), and 2626.5 kg ha−1 year-1 in deciduous forests (DF) [38]. However, leaf litter accumulation and consequent mulch and soil organic matter is affected by slopes, causing litter accumulation downslope but also carrying out of the system before incorporating soil, due to water erosion [39]. Along the basin, the percentage of slope varies between 0 and 60%, although 35% to 55% is predominant. These characteristics exert an influence on activities such as cattle production (especially in the physical quality of animals and forage), as well as in agriculture. The greatest soil losses occur in productive systems such as grasslands or maize (monoculture), and the lowest take place in advanced secondary succession, traditional coffee agroecosystems, citrus plantations, and palm oil. It is important to point out that the first two are located in places with highest slopes (Table 4). Management practices in agricultural and livestock soils could include some trees of from original vegetation, including related soil conservation practices, to avoid soil, nutrients, and organic matter losses.

3.4. Water

Water quality is a fundamental aspect for all living forms, and in the context of the Huazuntlan River basin, for human consumption. Values reported for the variables measured are within the limits established by the Water Quality Criteria [40]. However, two parameters are notable: turbidity and fecal coliforms (FC), since their presence indicates contamination related to suspended matter (organic or inorganic), and fecal pollution [26,41,42]. The group named FC or thermotolerant is the most important indicator of fecal pollution; FCs for the Ozuluapan river present values of over 1000 NMP/100 mL, higher than the highest admissible level, considering that this water is for use in public services with direct or occasional contact or as a source of drinking water, as per the ecological water quality criteria [40]. This fact is particular important, since it is related to discharges of wastewater from communities into the rivers. Relatively high turbidity levels were found in the Ozuluapan river basin, mainly in the middle and lower sections, in places located in the municipal areas of Soteapan and Soconusco, and even above admissible levels (10 NTU); turbidity is related to particles suspended in the middle and high basin (related to soil erosion), whereas in the lower basin, in parts of the municipal areas of Acayucan, Soconusco, and Chinameca, the contribution of gravel extractors may be a relevant factor, since water they use for washing is discharged into the river. According to national water quality index (WQI) [43], the bodies of water range from acceptable (>70) (in areas located in the higher parts of the basin), to regular. Places such as Ocozotepec and others in the lower part of the basin (Cerritos, La Estribera, La Virgen) present quality indices between 55 and 60, due to the high impact of some parameters, such as turbidity, DBO, and CF. High CF values in bodies of water are a risk for communities that are highly marginalized, without water treatment services and that are exposed to contaminated water for long periods of time, particularly when rainfalls become more intense, as well as for other physical and chemical parameters such as herbicides and pesticides [44].

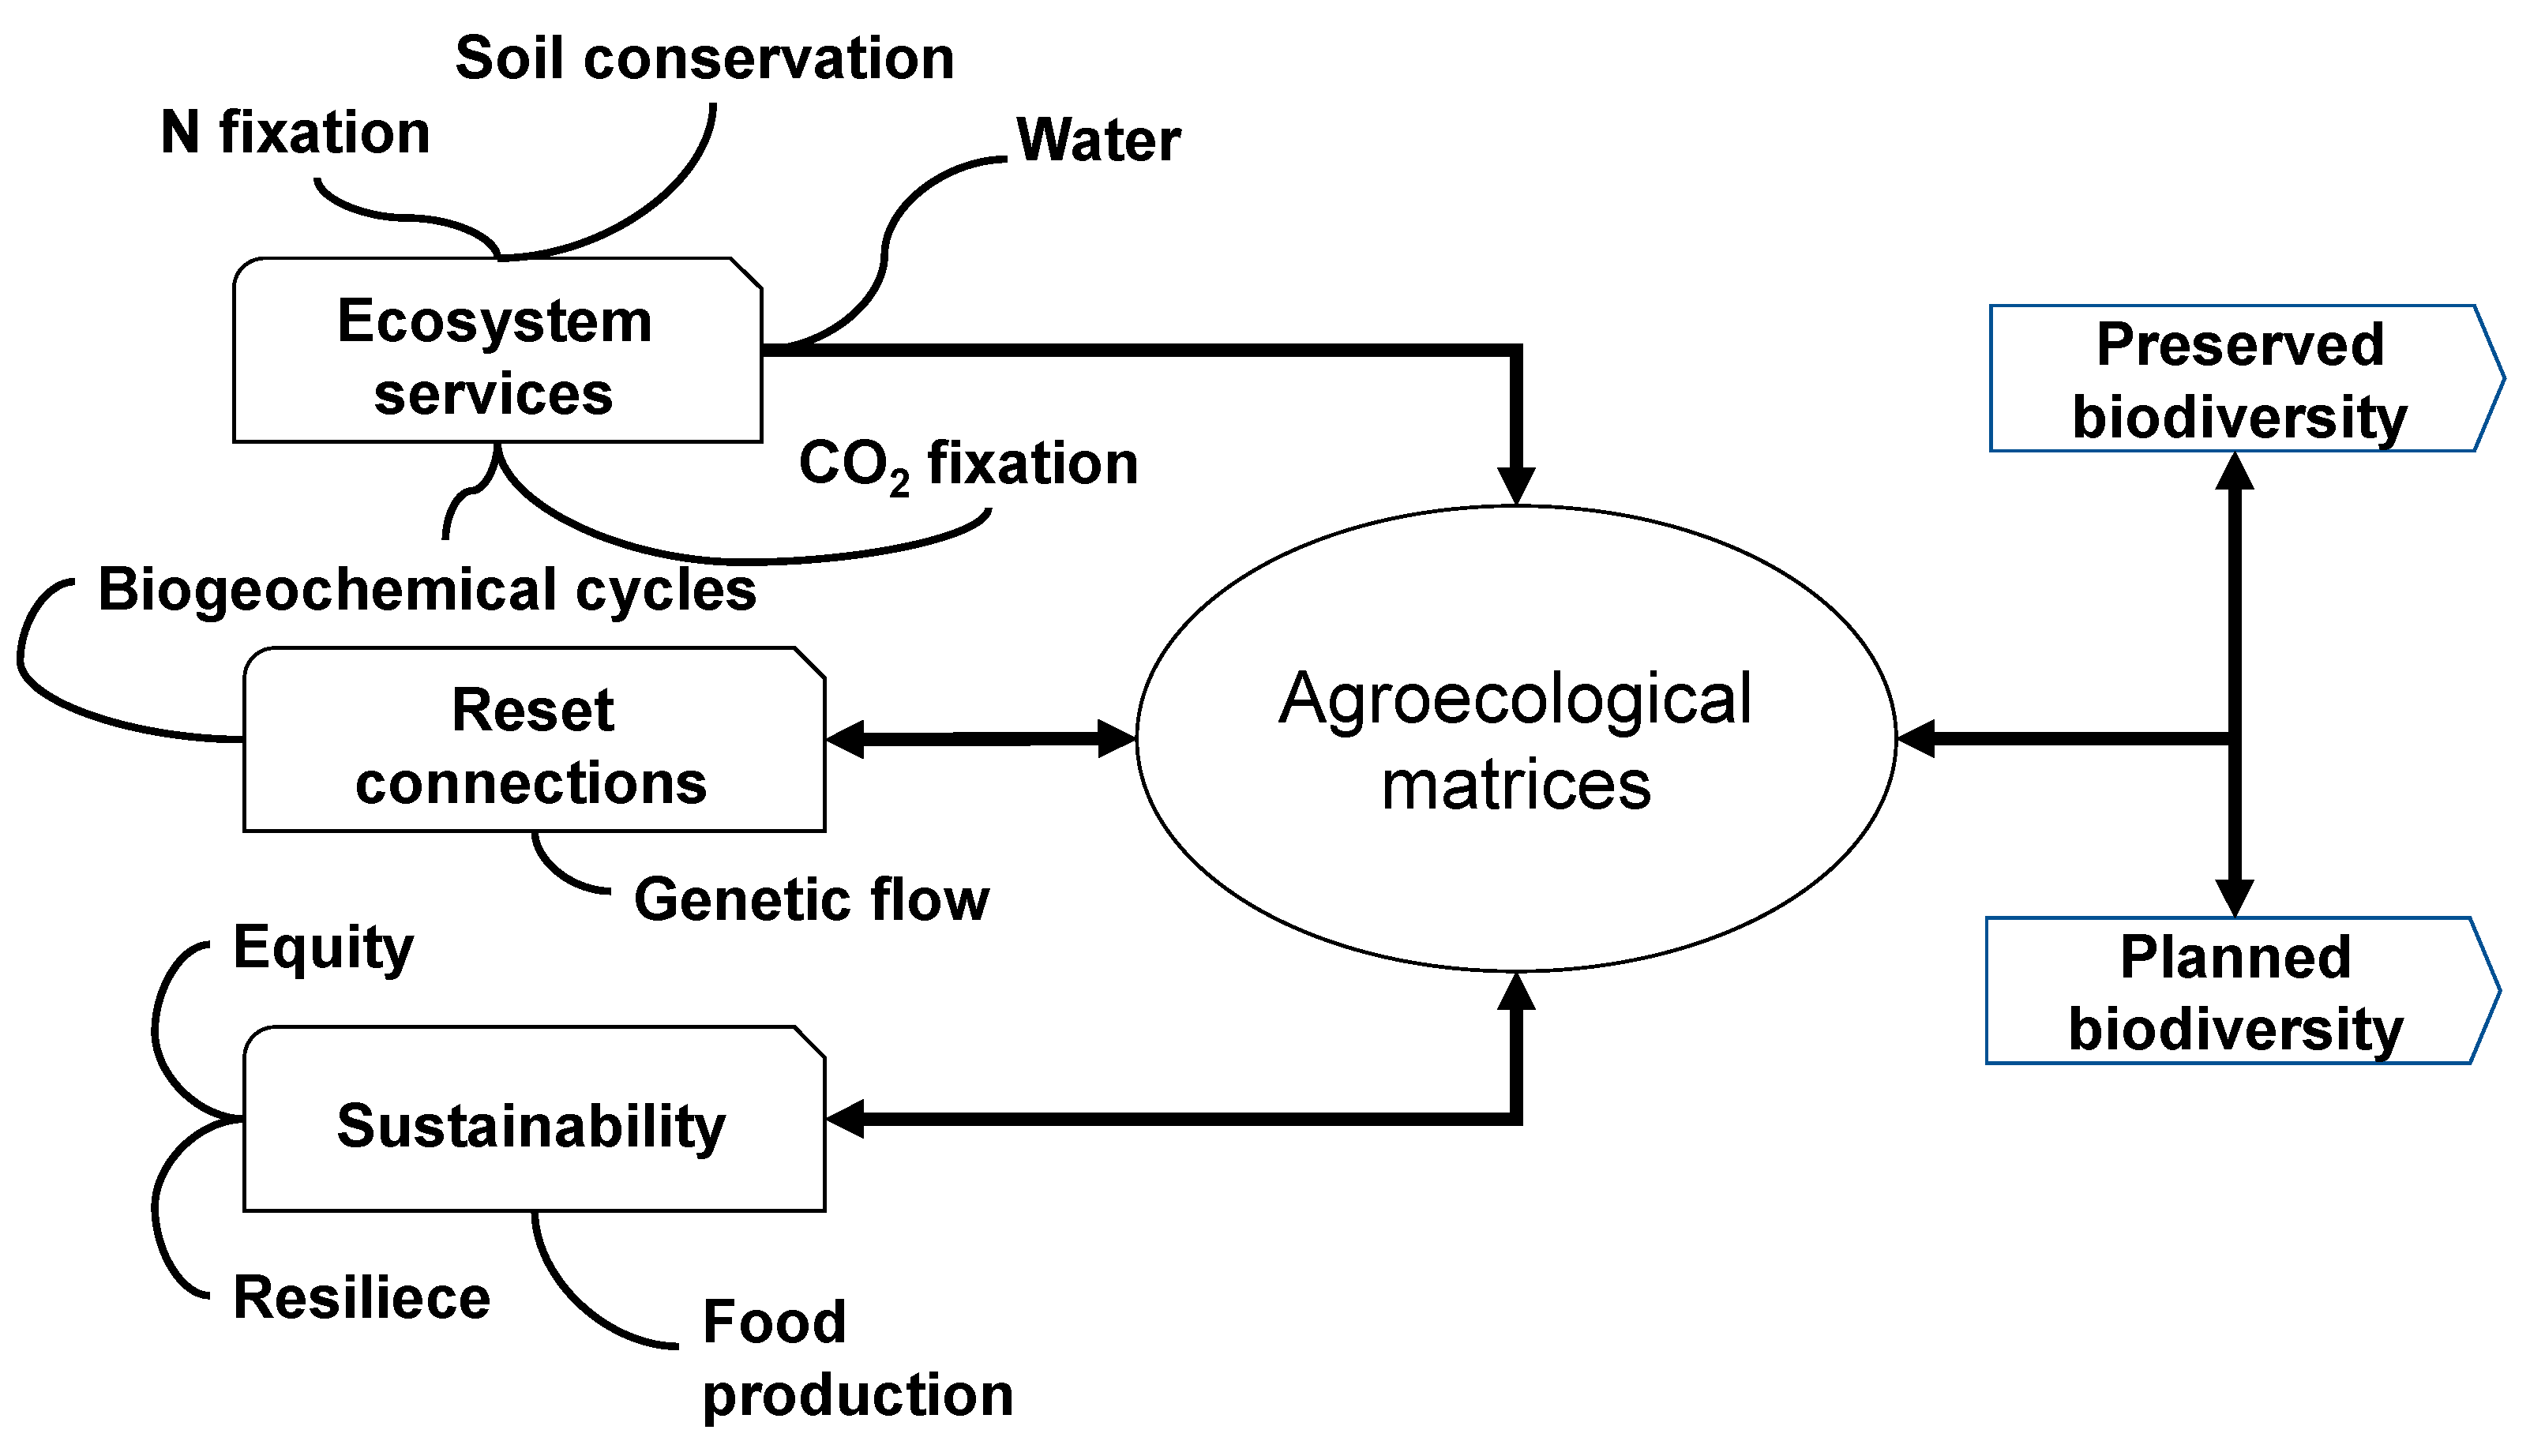
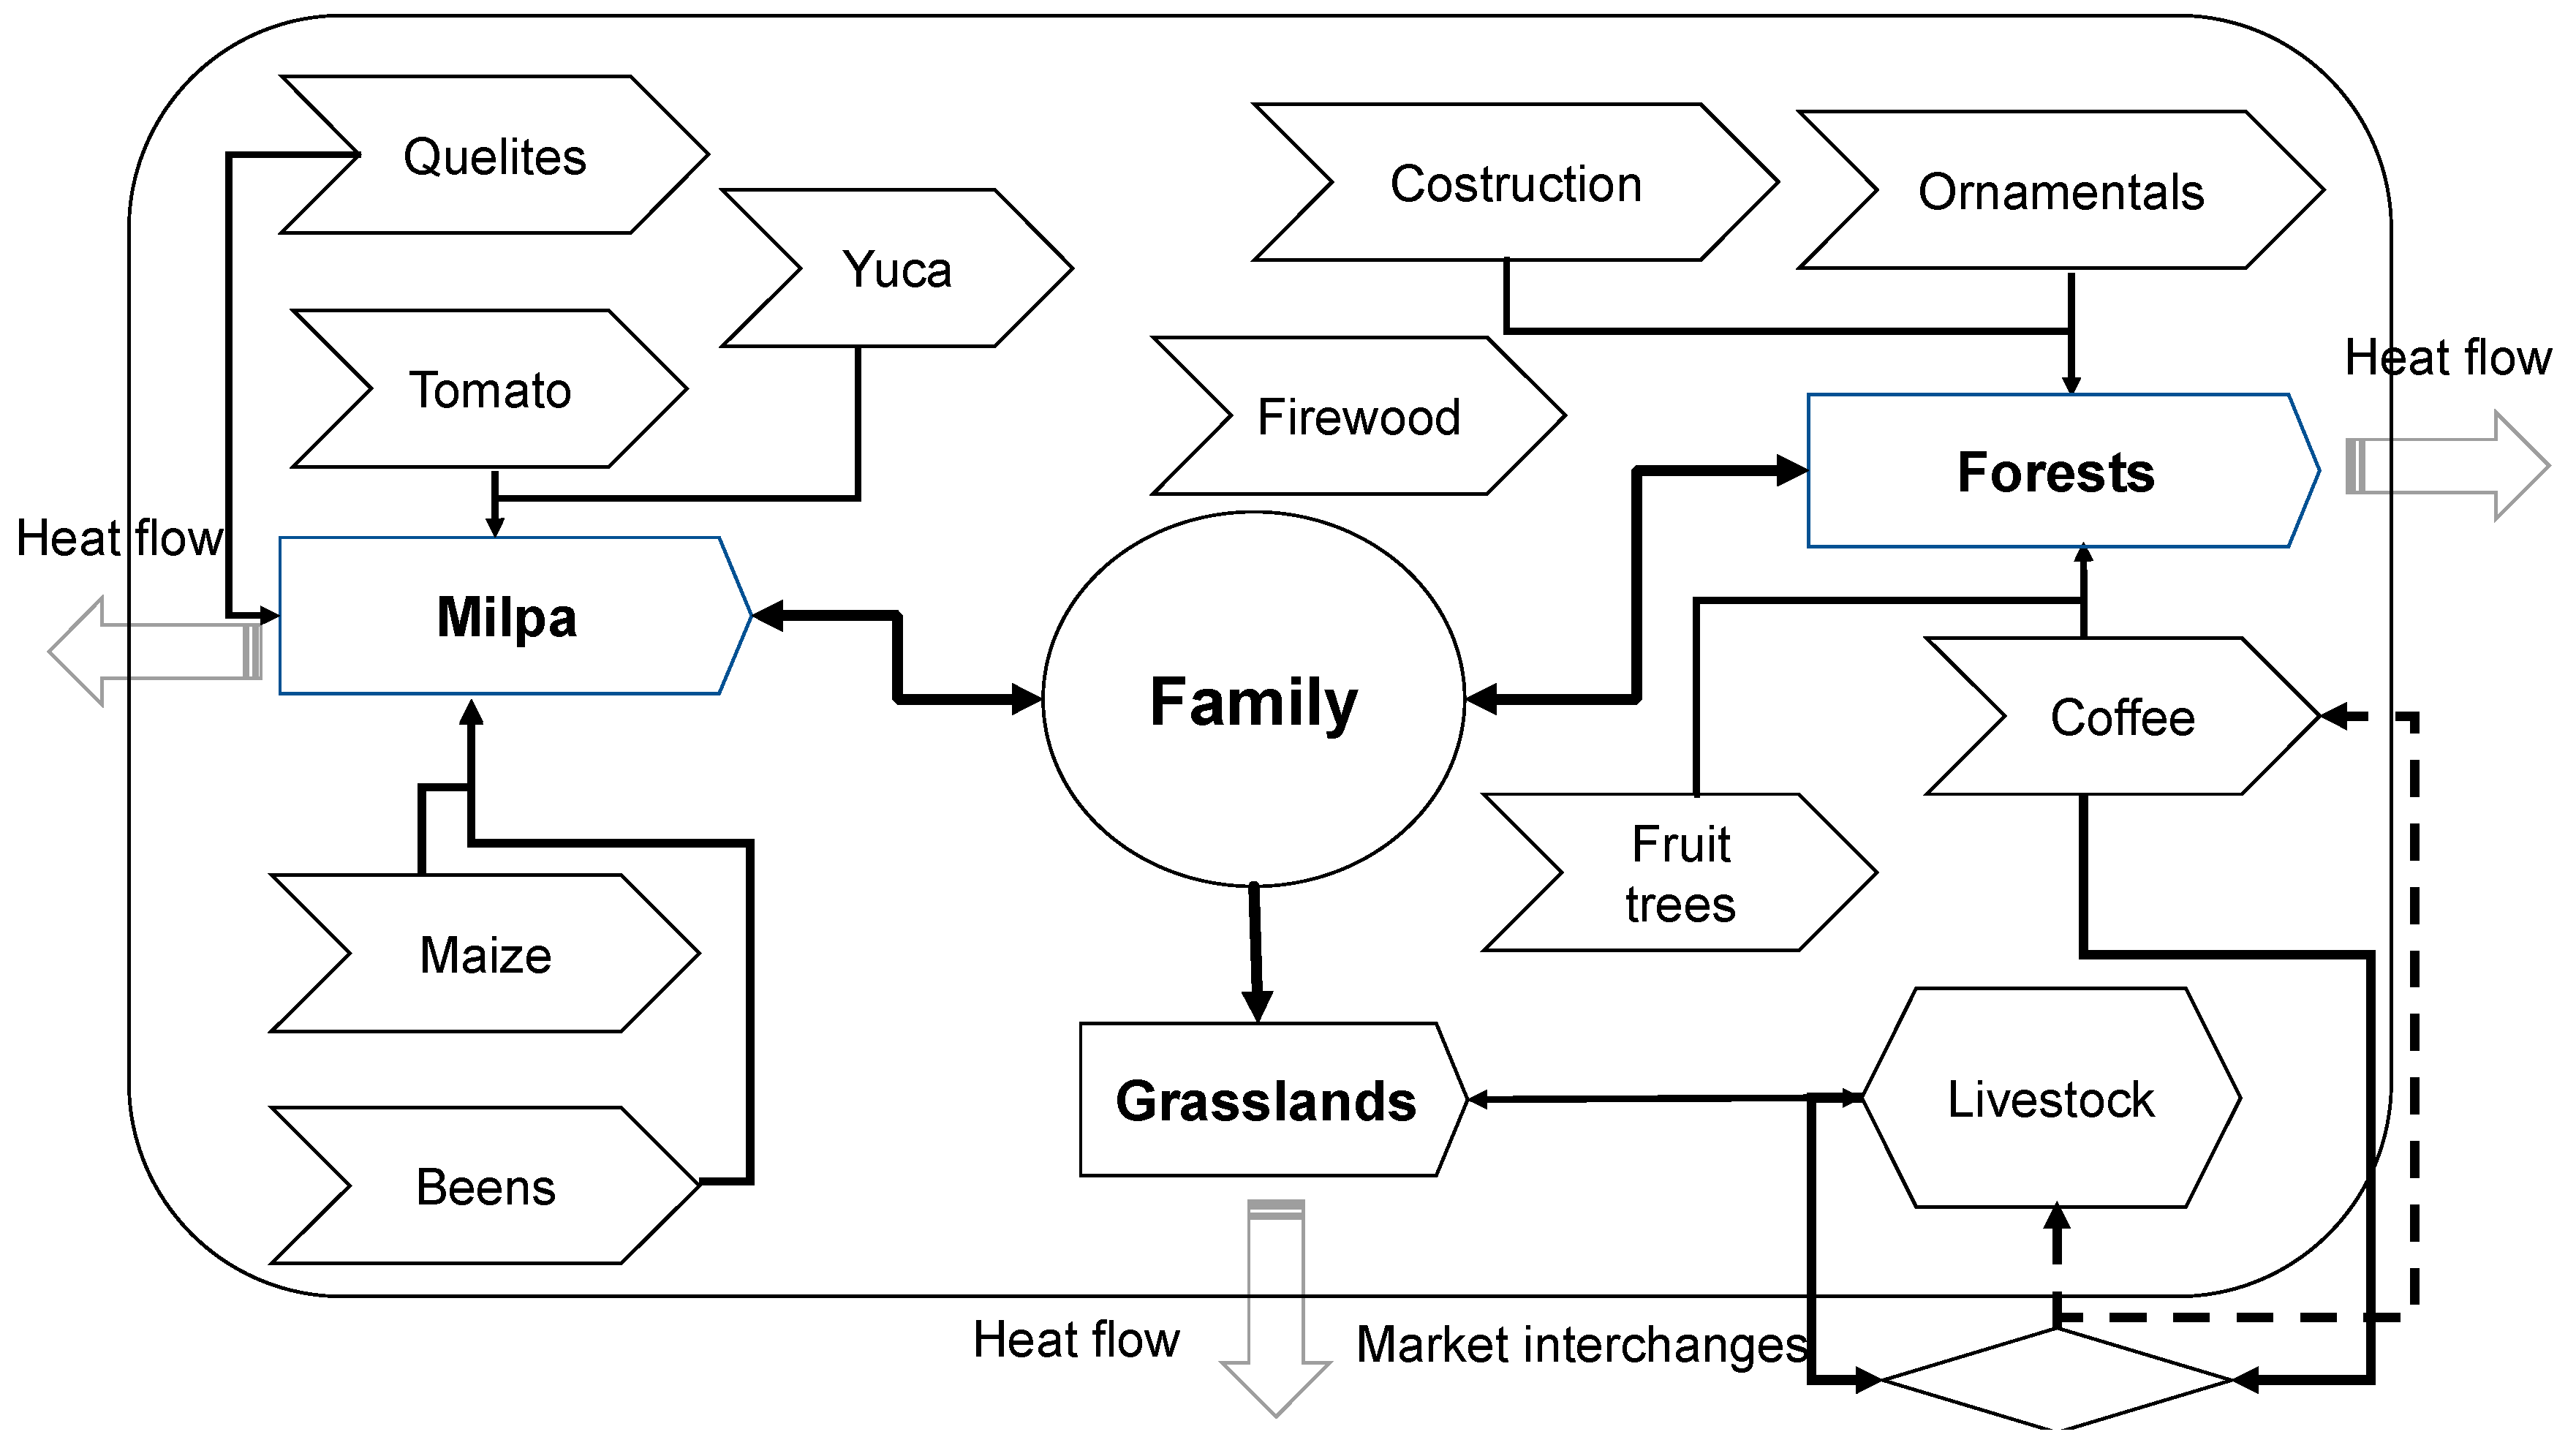
3.5. Agroecosystems, a Possible Explanatory Model

One of the goals of complex systems is to propose explanatory models to help visualize the elements that make up the system, as well as their relationships and critical points, in order to improve their operations. We work especially with Zoque-Popoluca peasants from Santa Marta Sierra; they have established three subsystems in the territory: coffee agroecosystems (adopted since beginnings of 18th century), milpa (maize associated with other plants as beans and quelites, cultivated since pre-Columbian times), and cattle production (adopted also after the arrival of the Spaniards; pigs and chickens were introduced first; afterward, cattle were introduced, promoted by government programs since the middle of the 20th century).
A schematic model of the traditional agroecosystems in the Sierra de Santa Marta (Figure 1) was used to plan the participative use of the land with the aim of achieving, at least, the following:
  • Food self-sufficiency.
  • Structuring high-quality agroecological matrices.
  • The genetic flow between matrices (patches of vegetation).
  • Conservation of basic genetic resources for the human communities that depend on them.
  • Reduction of global warming and the preservation of biogeochemical cycles.
  • Improvement of water quality and collection.
  • Proposal of public policies aimed at improving the equity, productive organization and the creation of short market chains that satisfy local or regional needs first.
The agroecosystem is family-based, and has many farming activities, from crops (coffee, maize), livestock, and forest (Figure 1). The milpa includes other components, and could be composed of up to ten useful plants (beans, tomato, yucca, quelite, chili, pumpkin, among others), and shaded coffee offers wood and firewood, medicinal plants, fruits, and ornaments, and is inclusive of the base for beekeeping. In the Sierra de Santa Marta, both coffee and government programs provide incomes. However, the latter account for 49% of farmer’s incomes, while coffee accounts of only 20% [45]. The production system plays a crucial role in the conservation of species such as oak and orchids; it contains ornamental and medicinal plants, food crops, and spices, and is a place for the production of small livestock, especially chickens and turkeys. In the case of rangelands, cattle are a form of family savings, but the physical quality of the animals is poor, and it is crucial to evaluate the environmental impact of practices such as livestock, and to answer whether or not the quality of animals, their feed, and the economic value they produce compensate for the loss of tropical forests and water quality, soil erosion, and genetics, as well as the simplification of biogeochemical cycles. In all cases, products for self-sufficiency are considered savings for the family unit.
In coffee agroecosystems, 67% of the labor used comes from the family; the remaining 33% is hired, as in other farms with similar management systems [46]. In this sense, family labor is perceived as beneficial for the profitability of the system, since it is not paid, although it should be accounted for in terms of investment. The coffee agroecosystem presents critical points, both positive and negative, such as the notorious absence of pest control and renewal of coffee plantations. In addition, the lack of a solid organization is noticeable in the scarce participation of the farmers, despite the price of processed coffee being higher. Land ownership is smallholding, and, in general terms, lands can extend between only a few tareas (a tarea = 625 m2) and 5 ha, which is reflected in the atomization of production [45,46,47]. However, a large variety of trees, shrubs, and herbs are conserved, mostly in hillsides, which contributes to the production of the soil, and to the production of biogeochemical cycles, including water. They also provide different products and are a support for epiphytic species, Perfecto and Vandermeer [9] among others, which emphasize that rustic coffee agroecosystems in Mexico contains as many birds and ant species as native forests in the same region. For them the message is clear; the type of agriculture matters for biodiversity.

3.6. Some Land Management Proposals

Based on the method proposed by Duch et al. [48] and Data Dictionary for Agricultural, Livestock and Forest Potential Use [49], a territorial potential use proposal was created (Table 5, Figure 2). It takes into consideration soil characteristics, slope, and the history of use the territory has undergone. In the same way, some simulations carried out using the USLE infer that changing management practices can result in the reduction of erosion and surface runoff. Simulations were done as follows. USLE involves five factors: rainfall erosivity (R), soil erosivity (K), topographic factor (LS), cover-management factor (C) and support practice factor (P) [30,50,51]. For each site and its characteristics water erosion was calculated (Table 4); in a specific site, some changes were proposed. For example, the use of cover crops could increase organic matter and plant coverage, so the values of K-factor and C-factor in USLE changed; while the use of contour lines changed the value of P-factor (Table 6). Factors related to rainfall (rain erosivity) and slopes are not presented, because they are independent variables. Increasing the amount of organic matter could reduce erodibility, but texture can hardly be modified.
A model based upon results is shown in Figure 2; the first three columns (type of soil, land use, species of interest) are based on the farmers’ knowledge of the lands. The fourth column was created based on the estimations of erosion, using the USLE for different land uses [52]. The fifth column is for water quality index values, from excellent to unacceptable [43], and the last column is for marginalization index classification (CONAPO). Using USLE, scenarios can be simulated as previously described, with some changes in the forms of management that farmers have over their plots, which involve reductions in soil loss due to water erosion. According to the Nuntajiyi` or Zoque-Popoluca soil classification [53], twelve different types of soil can be identified in the region (Column 1). For each type of soil, farmers recognize different uses (Column 2): those that perform better (green lines between columns 1 and 2) or those that perform worst (chestnut-colored lines). Likewise, peasant’s knowledge helps them to recognize the appropriate species (Column 3) for each type of soil, and with participative activities, the species were selected that could perform in each productive system, and that could be grouped according to their use (fruit, medicinal, forage, etc.). For example, the continuous green lines between Column 2 and Column 3 represent species that can be used for animal feed, posts, melliferous, or in live barriers for grasslands.
The green dotted lines connect the species that can be used on the maize field as fertilizer or coverage, as timber, or as living barriers or which have melliferous potential. In the different production systems, the maximum erosion potential has been identified (>500-ton ha−1 year−1 for maize, 200-ton ha−1 año−1 for coffee, for example), and scenarios have also been built with different practices implemented (green barriers, mulches, cover crops, and multiple cropping), in which the reduction of erosion rates has been estimated (lines between Column 3 and Column 4). Thick dotted line that join the maize field and the maximum erosion potential refer to the conventional management of maize production under the slash and burn system, which promotes conditions for high rates of soil loss from water erosion, and that, following Column 5, contributes to the reduction of water quality (ICA < 70), which can contribute to conditions of social marginalization, due to the low yields of the productive systems and the consumption of lower-quality water. If practices are implemented with species used as live barriers, or with a melliferous potential or a potential for timber, soil loss can be reduced to 80%, but if practices include coverage of shrub species in live barriers, soil loss can be reduced up to 20% or 40%. These practices can reduce the contribution of solids, organic matter and nutrients to bodies of water and improve the quality of dissolved solids and turbidity, as well as nitrates and phosphates, increasing the ICA of bodies with values of 50–70 to acceptable levels (70–90), which is represented by the lines between Column 4 and Column 5. The connection between these last columns with Column 6 (marginalization index, sensu CONAPO [25]) refers to desirable conditions, although its estimation is not easy, since other factors intervene, such as decisions made between land owners, at the community or municipal level. However, a lower rate of soil loss (and improvement in water quality) in systems that not only include conservation practices but also product diversification (with fruit species or those with melliferous potential), is expected to help increase income and improve living conditions for the population of the area.
The diversification of all production systems is crucial, either with the introduction of native trees that can help improve the quality of connections (flow of genes and the presence of useful species such as predators), with citrus trees or other fruit-bearing species related to beans, peanuts or other legumes that helps obtain foods, products for sale, and N fixation; or soil conservation practices, such as contour lines or the incorporation of organic matter (Figure 2).

3.7. Structuring Agroecological Matrices

The different types of vegetation in the Sierra de Santa Marta have been transformed by local inhabitants, based on what could be called unconsciously planned biodiversity, forming “islands” (agroecosystems) of different dimensions and quality. Particularly in coffee agroecosystems, Castillo-Capitán et al. [11], found that even slight disruptions result in high biological diversity indices (Table 7). In this sense, high-quality agroecological matrices can play an important part in the establishment of more sustainable forest management models. However, several species are currently difficult to find in the region (Ceiba pentandra, Hymenea courbaril, Swietenia macrophylla, Tabebuia crisantha, Trichilia havanensis, Virola guatemalensis, Calophyllum brasiliense, and Calicophyllum candidisimum, among others), so individuals of these species may have to be introduced from tropical rainforests from states like Chiapas, Oaxaca, or Veracruz itself.
One of the basic objectives pursued in this investigation has been to know the characteristics of the territories along with farmers, and to plan agroecosystems to achieve agroecological matrices with the size and quality required to allow for connections between them, as well as the genetic flow needed to maintain the quality of the populations, communities and environmental processes of the region. In fact, traditional coffee plantations are an excellent source of connection between different patches of original vegetation, the yellow region involved patches of vegetation in Figure 3, which can be a basis, not only for programs to maintain the connection between agroecological matrices but also for reforestation and productive diversification, placing special emphasis on the use of native evergreen species, mainly in places with steep slopes.
Finally, when structuring high-quality ecological matrices, it is crucial to achieve, at least, the collection of greater amounts of water, the improvement of its quality, the reduction of global warming, the preservation of the integrity of biogeochemical cycles, and the conservation of forest resources, as well as food self-sufficiency, and the preservation of culture and the rights of native peoples, who have worked the land for centuries (Figure 4).

4. Conclusions

The creation of interdisciplinary teams is fundamental to studying and understanding the complexity of the territory. Marginalization of people is a driving force that exerts land use changes and strong repercussions on water retention and quality, as well as in carbon sequestration. In this sense, improving the quality of agro-ecological matrices can contribute to reducing poverty and marginalization rates. The highest soil loss occurs in grasslands, so it is therefore important to study the environmental impact of livestock on soils, and its effects on biogeochemical cycles and biodiversity. Both conditions (social marginalization and soil erosion), contributes to the deterioration of water quality in the region, which is mainly reflected in turbidity and coliform bacteria. The potential use of land must change to preserve soil and water; for example, it is important to use contour lines; multiple crops with high density (maize + beans), and conservation tillage. Also, the areas occupied by tropical rainforest, tropical sub-ever green forest, and deciduous forest must restrict their use to traditional coffee agroecosystems with diversified shadows, agroecotourism or ecotourism. Oak forests must restrict their use only to self-supply of firewood; however, it is important to study in detail the availability and use of oaks in the area. Livestock must be restricted to the areas with slight slopes using silvopastoral systems. Diversification of all production systems is critical, especially with the introduction of native trees that can help improve the quality of connections between patches. Structuring high-quality ecological matrices by increasing biodiversity is crucial to achieving the collection of water and improvement of its quality, reduction of global warming, the preservation of the integrity of biogeochemical cycles, and the conservation of forest resources, as well as food self-sufficiency, the preservation of culture, and the rights of indigenous people.
Coffee agroecological matrices are a good example of spaces in which all of the functions of the ecosystems can be conserved while recovering forest species, and ecological and productive relations. In the near future, when facing the challenge of global warming, it is very important to register changes in temperature and rainfall in all the studied areas, along with their relationship with crop production and natural resources conservation. Also, the role played by indigenous inhabitants is very important for the conservation of natural resources. Accordingly, it is essential to carry out more quantitative studies of the agroecosystems to know their environmental, social, economic, and cultural critical points, as well as the perception of the inhabitants about those problems and the possible solutions they could propose.

Author Contributions

C.H.Á.-B. and Á.H.H.-R. designed and conducted the different stages of the study, including formal analysis, investigation, and funding acquisition. Conceptualization and original draft: C.H.Á.-B. and M.A.M.-B. Methodology: C.H.Á.-B. and Á.H.H.-R. Validation, visualization, and writing: all authors.

Funding

This research was funded in different stages by different donors: 2007–2009: Universidad Veracruzana-Research Office [DGI-A0005]; 2009–2010: Ministry for Social Development, SEDESOL [PDMS-Soteapan]; 2013–2015: Braskem-IDESA S. A. P. I. [BI-EXXI-0019-00].

Acknowledgments

The authors would like to specially thank the peasants, the students, and colleagues that participated in the different stages of this research, and the funding agencies and the people who gave administrative support to the projects. Also, would like to thank the anonymous reviewers and Olga Ricalde-Moreno for their suggestions regarding the improvement of this paper, and finally Josefa Lagunas-Lagunas for her help in improving the English in this paper.

Conflicts of Interest

The authors declare no conflict of interest. The founding sponsors had no role in the design of the study; in the collection, analyses, or interpretation of data; in the writing of the manuscript, and in the decision to publish the results.

References

  1. Lindenmayer, D.B.; Franklin, F.F. Conserving Forest Biodiversity. A Comprehensive Multiscaled Approach; Island Press: Washington, DC, USA, 2002; pp. 5–9, 95–98. ISBN 1-55963-935-0. [Google Scholar]
  2. Spedding, C.R.W. An Introduction to Agricultural Systems; Applied Science Publishers Essex: Barking, UK, 1979; pp. 15–40. ISBN 0-85334-823-5. [Google Scholar]
  3. García, R. Sistemas Complejos. Conceptos, Métodos y Fundamentación Epistemológica de la Investigación Interdisciplinaria; Gedisa: Barcelona, Spain, 2006; pp. 81–95. ISBN 978-84-9784-164-1. [Google Scholar]
  4. Capra, F. La Trama de la Vida; Anagrama: Barcelona, Spain, 2010; pp. 56–63. ISBN 978-84-339-7343-6. [Google Scholar]
  5. Vandermeer, J.; Perfecto, I. The Agricultural matrix and future paradigm for conservation. Conserv. Biol. 2007, 21, 274–277. [Google Scholar] [CrossRef] [PubMed]
  6. MacArthur, R.H.; Wilson, E.O. The Theory of Island Biogeography; Princeton University Press: Princeton, NJ, USA, 1967; pp. 3–7, 19–32. ISBN 0-691-088365. [Google Scholar]
  7. Mendenhall, C.; Karp, D.S.; Meyer, C.F.J.; Hadly, E.A.; Daily, G.C. Predicting biodiversity change and averting collapse in agricultural landscape. Nature 2014, 509, 213–217. [Google Scholar] [CrossRef] [PubMed]
  8. Restrepo, G. Aproximación Cultural al Concepto de Territorio. 2012. Available online: http://datateca.unad.edu.co/contenidos/401412/Unidad_I/ (accessed on 15 May 2017).
  9. Perfecto, I.; Vandermeer, J. Coffee Agroecology. A New Approach to Understanding Agricultural Biodiversity, Ecosystem Services and Sustainable Development; Earthscan: Nueva York, NY, USA, 2015; pp. 21, 54–58. ISBN 978-0-415-82680-8. [Google Scholar]
  10. Bandeira, F.P.; Martorell, C.; Meave, J.A.; Caballero, J. The role of rustic coffee agroecosystems in the conservation of wild tree diversity in the Chinantec region of Mexico. Biodivers. Conserv. 2005, 14, 1225–1240. [Google Scholar] [CrossRef]
  11. Castillo-Capitan, G.; Ávila-Bello, C.H.; López-Mata, L.; de León-González, F. Structure and tree diversity in traditional popoluca coffee agroecosystems in the Los Tuxtlas Biosphere Reserve, Mexico. Interciencia 2014, 39, 608–619. [Google Scholar]
  12. Geissert, K.D. La Geomorfología. In Los Tuxtlas. El paisaje de la Sierra; Guevara, S., Lavorde, J., Sánchez-Ríos, G., Eds.; Instituto de Ecología A. C. y Unión Europea: Xalapa, Mexico, 2004; pp. 159–179. ISBN 970-709-043-X. [Google Scholar]
  13. Ferrusquía, V.I. Geología de México: Una Sinopsis. In Diversidad Biológica de México. Orígenes y Distribución; Ramamoorthy, T.P., Bye, R., Lot, A., Fa, J., Eds.; Instituto de Biología. UNAM: Coyoacán, Mexico, 1998; pp. 3–108. ISBN 968-36-6588-8. [Google Scholar]
  14. Council for Water System of Veracruz (CSVA). Análisis Integral de los Recursos Hidráulicos. Uso Público en Comunidades Urbanas y Rurales Dentro de la Cuenca del Río Coatzacoalcos; Consejo del Sistema Veracruzano del Agua-Gobierno del estado de Veracruz: Veracruz, Mexico, 2003. [Google Scholar]
  15. National Water Comission (CONAGUA). Actualización de la Disponibilidad Media Anual de Agua en el Acuífero Costera de Coatzacoalcos (3012); CONAGUA: Veracruz, México, 2015; pp. 18–22. [Google Scholar]
  16. National Water Comission (CONAGUA). Actualización de la Disponibilidad Media Anual de Agua en el Acuífero Soteapan- Hueyapan (3011); CONAGUA: Veracruz, México, 2015; pp. 18–28. [Google Scholar]
  17. Paré, L.; Robles, C. El manejo de la cuenca como estrategia de sobrevivencia común: Reciprocidad y transparencia para una nueva relación entre ciudades industriales y áreas rurales. Revista Electrónica De La REDLACH 2005, 1, 41–48. [Google Scholar]
  18. Alatorre, E. Etnomicología de la Sierra de Santa Marta; National Commission for the Study and Conservation of Biodiversity (CONABIO): México, D.F., Mexico, 1996; pp. 19–45. [Google Scholar]
  19. Soto, M. El Clima. In Los Tuxtlas. El Paisaje de la Sierra; Guevara, S., Laborde, J., Sánchez-Ríos, G., Eds.; Instituto de Ecología A. C. y Unión Europea: Xalapa, Mexico, 2004; pp. 195–198. ISBN 970-709-043-X. [Google Scholar]
  20. Campos, A.C. El Suelo. In Los Tuxtlas. El Paisaje de la Sierra; Guevara, S., Laborde, J., Sánchez-Ríos, G., Eds.; Instituto de Ecología A. C. y Unión Europea: Xalapa, Mexico, 2004; pp. 181–192. ISBN 970-709-043-X. [Google Scholar]
  21. Dirzo, R.; Soriano, E.; Vogt, R.C. Historia Natural de Los Tuxtlas. In troducción General; UNAM: México, D.F., Mexico, 1997; pp. 3–23. ISBN 968-36-5646-3. [Google Scholar]
  22. Ramírez, R.F. Plan Conceptual Para el Manejo y Desarrollo de la Sierra de Santa Marta, Veracruz Como Reserva de la Biosfera; INIREB: Xalapa, Mexico, 1984. [Google Scholar]
  23. Paré, L.; Velázquez, H.E.; Gutiérrez, M.R.; Ramírez, R.F.; Hernández, D.A.; Lozada, R.M.P.; Perales, H.R.; Blanco, R.J.L. La Reserva Especial de la Biosfera Sierra de Santa Marta, Veracruz: Diagnóstico y Perspectiva; SEMARNAP-UNAM: México, D.F., Mexico, 1997; pp. 17–20. ISBN 968-838-326-9. [Google Scholar]
  24. Dasgupta, S.; Uwe, D.; Craig, M.; Wheeler, D. Where is the Poverty–Environment Nexus? Evidence from Cambodia, Laos PDR and Vietnam. World Dev. 2005, 33, 617–638. [Google Scholar] [CrossRef]
  25. National Population Council (CONAPO). Índice de Marginación 2005; CONAPO: México, D.F., Mexico, 2006; pp. 11–15, 33–43. [Google Scholar]
  26. APHA-AWWA-WPCF. Standard Methods for the Examination of Water and Wastewater, 17th ed.; American Public Health Association: Washington, DC, USA, 1989; pp. 2–11. ISBN 978-0875531618. [Google Scholar]
  27. NMX-AA-115-SCFI-2001 (Norma Mexicana). Análisis de Agua—Criterios Generales Para el Control de Calidad de Resultados Analíticos; Secretaría de Economía: México, D.F., Mexico, 2001; 90p. [Google Scholar]
  28. León de, G.F.; Pérez, J.G. El Perfil Cultural del Suelo. Manual Para Estudiar la Estructura de la Capa Arable; Universidad Autónoma Metropolitana Xochimilco: México, D.F., Mexico, 1995; pp. 12–21. ISBN 970-620-704-X. [Google Scholar]
  29. Colegio de Posgraduados (COLPOS). Manual de Conservación del Suelo y el Agua; Universidad Autónoma de Chapingo-Colegio de Posgraduados: Chapingo, México, 1991; pp. 115–134. ISBN 968-839-127-1. [Google Scholar]
  30. Loredo-Osti, C.; Beltrán, S.L.; Moreno, F.S.; Casiano, M.D. Predicción de Riesgo a la Erosión Hídrica a Nivel Microcuenca; Folleto Técnico No. 29; INIFAP-CIRNE-Campo Experimental San Luis: San Luis Potosí S.L.P. México, 2009; pp. 8–33. [Google Scholar]
  31. Colwell, K. Estimates 8.2.0. Statistical Estimation of Species Richness and Shared Species from Samples. 2009. Available online: http://viceroy.eeb.uco-nn.edu/estimates (accessed on 27 August 2018).
  32. NOM-059-ECOL-2001 (Norma Mexicana). Protección Ambiental-Especies nativas de México de Flora y Fauna Silvestres-Categorías de Riesgo y Especificaciones Para su Inclusión, Exclusión o Cambio-Lista de Especies en Riesgo; Secretaría de Medio Ambiente y Recursos Naturales: CDMX, México, 2001; 85p. [Google Scholar]
  33. Marinoni, O. Implementation of the analytical hierarchy process with VBA in ArcGIS. Comput. Geosci. 2004, 30, 637–646. [Google Scholar] [CrossRef]
  34. Duraiappah, A.K. Poverty and environmental degradation: A Review and Analysis of the Nexus. World Dev. 1998, 26, 2169–2179. [Google Scholar] [CrossRef]
  35. Durand, L.; Lazos, E. The local perception of tropical deforestation and its relation to conservation policies in Los Tuxtlas Biosphere Reserve, Mexico. Hum. Ecol. 2008, 36, 383–394. [Google Scholar] [CrossRef]
  36. Léonard, E.; Velázquez, E. El reparto agrario y el fraccionamiento de los territorios comunitarios en el Sotavento veracruzano: Construcción local del Estado e impugnación del proyecto comunal. In El Istmo Mexicano: Una Región Inasequible; Velázquez, E., Léonard, E., Hoffmann, O., Prévót-Schapira, M., Eds.; Estado, Poderes Locales y Dinámicas Espaciales (Siglos XVI-XXI); IRD-CIESAS. Publicaciones de la Casa Chata: México, D.F., México, 2009; pp. 399–449. ISBN 978-607-486-004-7. [Google Scholar]
  37. Williams, L.G. El bosque de Niebla del Centro de Veracruz: Ecología, Historia y Destino en Tiempos de Cambio Climático; Instituto de Ecología, CONABIO: Xalapa, México, 2007; pp. 17–22. ISBN 970-709-101-0. [Google Scholar]
  38. Ávila, B.C.H.; Zamora, M.P. Producción de hojarasca y materia orgánica en agroecosistemas cafetaleros marginales de Ocotal Chico, Veracruz, México. Polibotánica 2010, 30, 69–87. [Google Scholar]
  39. Vázquez, L.D.; Cuevas, D.M.C.; Perera, E.T.J.; Hernández, R.A.H.; Retureta, A.A. Secuestro de carbono en suelo cafetalero con alta pendiente en la Sierra de Santa Marta. Rev. Cient. Biol. Agropecu. Tuxpan 2014, 2, 798–806. [Google Scholar]
  40. Federation Oficial Journal (DOF). Criterios Ecológicos de Calidad del Agua CE-CCA-001/89 Secretaría de Desarrollo Urbano y Ecología. Diario Oficial de la Federación, 13 December 1989; 7–22. [Google Scholar]
  41. Ozcoz, J.; Campos, F.; Escala, M.C. Calidad biológica de las aguas del río Larraun (Navarra) (1996–1997). Ecología 2004, 18, 11–20. [Google Scholar]
  42. Wyer, M.D.; Fleisher, J.M.; Gough, J.; Kay, D.; Merret, H. An investigation into parametric relationships between enterovirus and fecal indicator organisms in the coastal waters of England and Wales. Water Res. 1995, 29, 1863–1868. [Google Scholar] [CrossRef]
  43. National Water Comission (CONAGUA); Índice de Calidad del Agua (ICA). INEGI-SEMARNAT; Estadísticas del Medio Ambiente en México: CDMX, Mexico, 1997; pp. 137–139. [Google Scholar]
  44. Surey, J.S.; Fredrickson, H.; Foote, C.; Richmond, M. Post-Katrina fecal contamination in Violet Marsh near New Orleans. Int. J. Environ. Res. Public Health 2007, 4, 84–92. [Google Scholar]
  45. Franco, D.S. Los Agroecosistemas Cafetaleros de Ocotal Chico, Municipio de Soteapan, Veracruz. Bachelor’s Thesis, Agricultural Systems Engineering, Universidad Veracruzana, Acayucan, Mexico, July 2007. [Google Scholar]
  46. Pérez-Grovas, G.V. Evaluación de la Sustentabilidad del Sistema de Manejo de Café Orgánico en la Unión de Ejidos Majomut, Región de los Altos de Chiapas. In Sustentabilidad y Sistemas Campesinos. Cinco Experiencias de Evaluación en el México Rural; Masera, O., López-Ridaura, S., Eds.; Ediciones Mundi-Prensa; Instituto de Ecología. GIRA. PUMA: CDMX, México, 2000; pp. 45–81. ISBN 968-7462-24-8. [Google Scholar]
  47. González, M.F.; Graciano, P.O.; Lozada, R.M.P.; Ramírez, R.; Villegas, T.N.; Tehuitzil, V.L. Ejido Ocotal Chico: Memoria del Taller de Planeación Comunitaria y de Manejo de Recursos Naturales; Unpublished Report; Proyecto Sierra de Santa Marta, A.C. UNDP: Xalapa, Mexico, 2004; pp. 13–82. [Google Scholar]
  48. Duch, G.J.; Bayona, C.A.; Labra, L.C.; Gama, V.A. Sistema de evaluación de tierras para la determinación del uso potencial agropecuario y forestal en México. Rev. Geogr. Agríc. 1981, 1, 21–46. [Google Scholar]
  49. INEGI. Diccionario de Datos de Uso Potencial Agrícola, Pecuario y Forestal. 1:250 000 (Vectorial); Instituto Nacional de Estadística Geografía e Informática: Guanajuato, Mexico; pp. 1–36. ISBN 970-13-3428-0. Available online: https://www.google.com.tw/url?sa=t&rct=j&q=&esrc=s&source=web&cd=2&ved=2ahUKEwjajdu9sN_dAhUWUt4KHWWJDtwQFjABegQICRAC&url=https%3A%2F%2Fchapingo.mx%2Frevistas%2Fphpscript%2Fdownload.php%3Ffile%3Dcompleto%26id%3DMjkyMQ%3D%3D&usg=AOvVaw2YK5YprUzIkxLuDMvoCN42 (accessed on 29 September 2018).
  50. Wischmeier, W.C.; Smith, D.D. Predicting Rainfall Erosion Losses from Cropland. In Agricultural Handbook; USDA: Washington, DC, USA, 2000; Volume 282, pp. 3–40. [Google Scholar]
  51. Blanco, H.; Lal, R. Principles of Soil Conservation and Management; Springer: Berlin, Germany, 2010; pp. 82–88. [Google Scholar]
  52. Cruz, M.V.M. Comparación de Métodos Para la Medición de la Erosión en la Subcuenca de Huazuntlán, Veracruz. Bachelor’s Thesis, Universidad Veracruzana, Veracruz, México, 2010; pp. 54–92. [Google Scholar]
  53. Ramírez, F.; Hernández, R.A.H.; Ávila, B.C.H.; Retureta, A.A. Clasificación de suelos en el sistema Zoque-Popoluca en Soteapan, Veracruz, México. Sociedades Rurales Producción y Medio Ambiente 2008, 8, 51–76. [Google Scholar]
Figure 1. Schematic model of the production system in the Sierra de Santa Marta, Veracruz. Continuous lines indicate the exchange of materials and work; dotted lines indicate the flow of materials.
Sustainability 10 03496 g001
Figure 2. Potential matrices for soil use.
Sustainability 10 03496 g002
Figure 3. The role played by coffee agroecosystems in connecting vegetation matrices that peasants have formed in the Sierra de Santa Marta is clear.
Sustainability 10 03496 g003
Figure 4. Construction of agroecological matrices and possible positive effects on the local, regional and global environment, modified from Perfecto and Vandermeer [9] (2015).
Sustainability 10 03496 g004
Table 1. Native species considered for spreading in a common greenhouse in Soteapan, Veracruz (English name is annotated, if it is known).
Scientific NameCommon NameRisk Category
Acosmium panamenseGuayacánEndangered
Andira galeottianaMacayoVulnerable
Annona diversifoliaAnona, ilama
Astrocarium mexicanumChocho
Calophyllum brasilienseBariEndangered
Cojoba arboreaFrijolillo (black tamarind)
Cordia alliodoraSolerillo
Dialium guianensePaque
Enterolobium cyclocarpumNacaxtle (ear-pod tree)
Hymenaea courbarilGuapinol (rode locus)
Inga veraChalahuite
Luehea speciosaTepecacao
Manilkara zapotaChicozapote
Nectandra ambigensLaurel
Swietenia macrophyllaMahoganyVulnerable
Tabebuia chrysanthaPrimavera (gold tree)Endangered
Tabebuia roseaRoble
Terminalia amazoniaSuchil amarillo (bullywood)
Table 2. Socioeconomic indicators of the municipal areas in the Santa Marta Sierra [25].
IndicatorSoteapanMecayapanTatahuicapanPajapan
Total population32,59317,33414,31815,909
Illiteracy ages 15 and higher (%)45.532.03335
Incomplete elementary school (ages 15 and higher) (%)65.456.05561.3
Living in homes without drainage or sanitary service (%)32.536.324.1717.17
Overcrowded homes (%)68.162.064.661.6
Living in homes with dirt floors (%)66.558.250.031.8
Population in locations with less than five thousand inhabitants (%)10010047.441.2
Population living with up to two minimum wages (%)77.372.570.378.3
Index of marginalization1.651.210.750.85
Degree of marginalizationVery highVery highHighHigh
Place statewide (total: 212) *13295447
Place nationwide (total: 2454) *141303558494
* Number of municipalities in Veracruz and México, 2005.
Table 3. Changes in the use of lands between 1986 and the year 2000 in the Santa Marta Sierra area.
Vegetation/Use of LandsSurface, ha (1986)Surface, ha (2000)Change (%)
Rainfed agriculture19,88119,370−3%
Tropical evergreen forest19,4787623−61%
Oak forests15,9247770−51%
Deciduous forest12,9902416−81%
Tropical rain forest560958825%
Induced grasslands314916,093411%
Cultivated grasslands308521,733604%
Table 4. Soil loss in the different productive systems established in the Santa Marta Sierra (estimated erosion = f (rainfall erosivity; soil erodibility; topography; land use).
Land Use (Number of Sites *)Erosion Measured (Erosion Pins)Erosion Estimated (USLE)
Mean, cmStd. devMax–MinTon ha−1 yr−1Ton−1 ha yr−1cm
Grasslands (9)1.020.590.30–1.4883.370.49–41.590.01–1.39
Maize (10)0.930.590.27–0.9946.434.16–282.890.04–3.14
Advanced secondary vegetation (3)0.790.260.49–0.77117.170.20–19.180.0–0.23
Citrus plantations (1)1.130.591.1387.4067.500.65
Palm oil (2)0.90.470.9080.7236.460.41
Traditional coffee agroecosystems (3)0.590.280.50–0.67108.5140.57–97.180.67–1.04
* In every site, soil erosion was measured in 15 sites—five in every position according to hillslope (top, medium, and base).
Table 5. Comparison between the current and potential use of lands in locations of the Sierra de Santa Marta.
LocationProposal-Primary UseProposal-Secondary UseAltitude (masl)Slope (%)RestrictionsCurrent Use/Soil Type
La Virgen12403UnrestrictedCitrus
Acrisols
El Naranjo12430UnrestrictedLivestock
Vertisols
Cerritos23814Light restrictionsAquatic vegetation
Vertisols
Comejen458135Light (slope)Maize
Leptosoles
Ocozotepec2512020Light (slope)Shaded coffee
Vertisols
Ocotal Chico5721022Unrestricted/Strong (slope)Oak
Andosols
Mirador Saltillo2624722Light (slope)Maize
Phaeozem
Yuribia6725332Strong (slope, stoniness, pH)Livestock
Leptosols
San Fernando I8963855Strong (slope, stoniness, pH)Tropical sub-evergreen forest
Vertisols
Plan Agrario81071140Strong (slope, stoniness)Pines
Acrisols
San Fernando II1110120446Strong (slope, stoniness)Tropical rainforest
Vertisols
Santa Marta1210122052Strong (slope, stoniness)Deciduous forest
Acrisols
1 = Unrestricted mechanized agriculture; 2 = Cattle with planted grasslands; 3 = Agriculture with animal traction; 4 = Cattle with natural grasslands; 5 = Commercial forest; 6 = Forest with some limitations; 7 = Diversified manual agriculture; 8 = Agroecotourism with diversified coffee plantations/Forest use of self-supply; 9 = Not appropriate for agriculture or cattle; 10 = Seasonal manual agriculture; 11 = Ecotourism or Agroecotourism with diversified coffee plantations; 12 = Ecotourism/Restricted forest use.
Table 6. Simulations for water erosion, using USLE (A = R × K × LS × C × P) [30,51]. Example for a milpa cropping system in a clayed soil. Plan Agrario, Mecayapan, Veracruz. Annual rainfall, 4000 mm. Slope, 25%; slope length: 140 m. Four crop management strategies, designed for peasants, are shown.
ManagementOrganic Matter, %RKLSCPA
Conventional tilling (slash and burn), without conservation practices0.5%682.920.02912.530.801.0198.5
Contour lines0.5%682.920.02912.530.800.9178.7
Contour lines; increase crop density; mulch tillage. Increasing organic matter.0.5–2.0%682.920.02112.530.620.9100.3
Contour lines; multiple crops with high density (maize + beans); conservation tillage.>2.0%682.920.01312.530.200.817.8
Table 7. Biological diversity indices in three different types of coffee agroecosystems derived from tropical evergreen forest (TEF), tropical rain forest (TRF) and deciduous forest (DF) (modified from Castillo-Capitán et al., [11]).
Type of Coffee AgroecosystemShannon-Wiener IndexSimpson Index (Reciprocal)
TEF agroecosystem1.89–3.6430.3–62.0
TRF agroecosystem3.44–3.6430.3–31.14
DF agroecosystem3.65–3.7330.21–30.38

