1. Introduction
In recent years, traffic congestion in large and medium-sized cities of China has intensified, and the continuous increase in vehicle ownership has greatly reduced the capacity of urban roads, resulting in huge social costs and the restriction of sustainable development in cities. In most cities in China, 7:00 a.m. to 9:00 a.m. and 17:00 p.m. to 19:00 p.m. are the peak traffic periods, which are mainly formed by commuter passenger flow. Therefore, studying the travel mode choice of commuters in cities, and studying how people make decisions between cars and public transport, can help in the effort to grasp the travel behaviors of commuters. This provides a theoretical basis for alleviating urban congestion and guiding people to transfer from cars to public transport, eventually achieving low-carbon transportation and sustainable urban development.
Due to the uncertainty and complexity of the transportation system, the choice of travel mode is affected by many factors. This uncertainty contains two aspects: one aspect is that the traffic system contains a lot of uncertain factors, such as the weather, and the interference of human factors can cause delays in travel. The uncertainty of the transportation system itself is called objective uncertainty. The second aspect is the different degree of understanding of travelers of relevant travel information. Everybody has cognitive deviations due to individual differences. That is, travelers make decisions according to their own cognition, in which subjective uncertainty exists. In general, decision makers make decisions based on factors such as technical and economic characteristics of travel modes, travel attributes and individual attributes. Technical and economic characteristics of travel modes refer to price, rapidity, reliability, convenience, comfort and safety of the travel modes. For example, taking public transport is cheaper than driving cars, or the reliability of railway is better than bus. Gebeyehu, Takano (2007) found that the cost, convenience, and frequency of departure influenced the travel choice of bus greatly [
1]. Through a questionnaire survey, Weng Jingcheng (2018) found that commuters are much more concerned about the cost of a trip compared with travelers with other trip purposes, which means that they are more sensitive to a change in trip cost [
2]. Travel attributes include the purpose of travel and the constraint of the travel time. Individual attributes include gender, age, income, education level, personal preference, risk attitude, behavioral habit, etc. The decision-making criterion of travel behavior has always been a hot issue in travel behavior research. At present, there are two mainstream decision-making criteria. One criterion is the utility theory based on the assumption of “rational people”, including the expected utility theory and random utility theory. The other criterion is bounded rationality, such as prospect theory, regret theory, and so on.
Many scholars have compared expected utility theory with the prospect theory. Bian Shen (2005) proposed that under the axiom of the algebra of combination, the conclusion based on the prospect theory and the conclusion based on the expected utility theory are consistent [
3]. Giselle de Moraes Ramos et al. (2011) compared the predictions of route choice behavior based on expected utility theory, prospect theory and regret theory. They concluded that although prospect theory remains controversial, the results show that it is suitable for the prediction of travel route choice behavior, especially when the uncertainty in the trip turns into a certain probability. This study indicates that prospect theory can replace expected utility theory to capture travel behaviors better [
4]. Mi Jun (2015) studied travel mode choice behavior based on prospect theory, comparing the results of travel mode choice based on expected utility theory and prospect theory. It was found that prospect theory is more in line with the psychological characteristics of the decision-making of travelers [
5].
As the pace of urban life accelerates, people often arrange multiple activities during a trip. For commuters, it is more common to arrange activities on the way to or from work. Hence, many studies on travel behavior based on multi-destination travel have gradually appeared. Miller (2005) established a model of travel mode choice based on the travel chain, taking into account the combination of various travel modes [
6]. Ye X (2007) studied the relationship between mode choice and the complexity of trip-chaining patterns [
7]. Luan Kun (2010) studied the choice behavior of commuters on travel mode and the travel chain. These results revealed that commuters initially plan the travel chain, and subsequently choose the travel mode based on the travel chain [
8]. Islam (2012) used structural equation modeling to analyze the hierarchical choice behavior of the travel chain and travel mode [
9]. Based on the travel chain, travel behavior can more truly reflect the travel behavior of people in real life, and researchers have gradually focused on this area in recent years. From the perspective of the travel chain, study of travel issues reflects research into time geography, which was proposed by Torsten Hägerstrand, Tommy Carlstein et al. Time geography is one of the earliest perspectives to analyze the movement patterns of human activities in time and space. Time geography aims to study the laws of human behavior in time-space and explore how to organize people’s activities in a space-time environment, in order to improve the quality of people’s lives [
10]. Individual activities are restricted by time and space constraints in three aspects: ability, combination and authority [
11,
12]. Hence, the extent of space to which an individual can exist at a certain time is limited. Time geography not only emphasizes the importance of space for understanding people’s daily lives, but also enables scholars to explore the complex interactions between time and space, and their combined effects on human activity patterns in specific locations [
13]. In summary, studying travel mode choice from the perspective of the travel chain can more realistically reflect the people’s behavioral decisions.
With the congestion during rush hour and difficulty in parking, it was found that some people who usually drive to work may change their travel mode if their return trip containing activities. It is common to add activities in the departure trip, such as sending children to school or sending family members to work. These activities usually do not require people to find a parking space, and the frequency is in line with commuting, which is a daily travel behavior. Once formed, it is not easy to change. In general, these departure trips containing activities will not change the way people go to work. Hence, focus was not given on departure trips containing activities. Participating in activities after work always has a time constraint and people have to find a parking space. Traffic congestion and difficulty of parking are serious during the rush hour. Therefore, people are more likely to give up driving. In order to explore how people make decisions between driving a car and taking public transport according to their return trip containing activities, taking urban commuters with cars as the research objects, we established models of travel mode choice based on the prospect theory and expected utility theory. An example is used to illustrate the results of the research.
2. Travel Chain and Complex Travel Chain
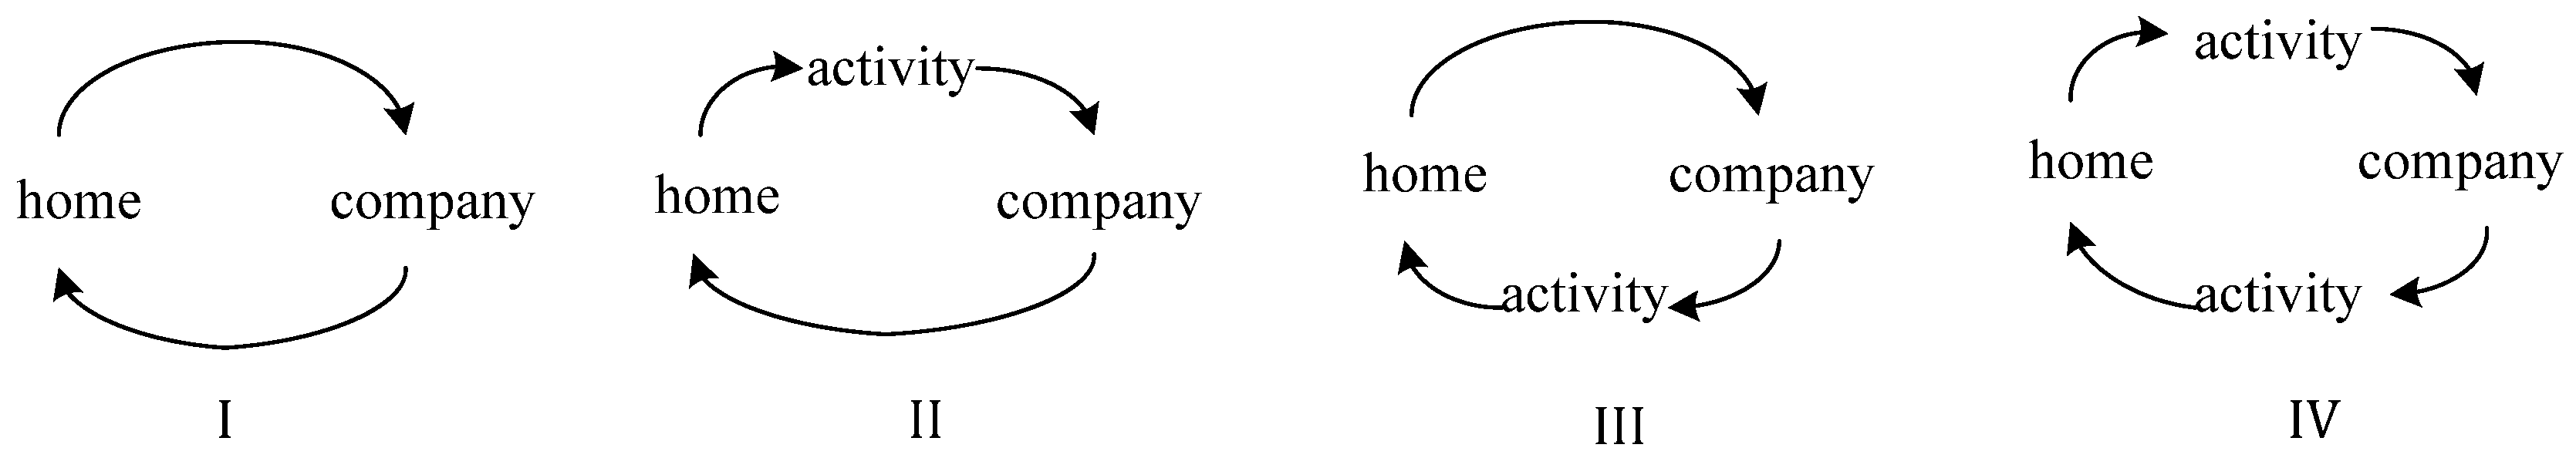
The travel chain is a closed chain formed by a series of travel activities which start from home and end at home, including a long duration of time, a large number of locations and so on [
10]. The travel chain of commuters was divided into categories, as shown in
Figure 1. The chain that contains two places (home and company) is called a simple chain, as shown in I in
Figure 1. The chain that contains destinations other than home and company is called a complex chain, as shown in II, III and IV in
Figure 1.
A complex chain of type III was mainly analyzed in this paper, in which the departure trip is home to company, and there is no intermediate activity, while the return trip contains activities, such as pick-up, shopping, dining and entertainment. Taking commuters who have cars as the research objects, and based on utility theory and prospect theory, the present study investigates how the travel mode is chosen after adding activities on the return trip, with the assumption that there are two types of travel modes: public transport and car.
3. Model Construction
3.1. Model Assumption
(1) In the present study, time is the only decision element taken into account. In the simple chain that only involves two destinations of home and company, travelers choose car as the travel mode. After adding activities on the return trip, when the travelers turn from car to public transport, the main influencing factor should be the time factor, not the travel cost. Hence, the present study only considered the time variable, regardless of the impact of travel cost.
(2) When people participate in activities on the return trip, it was considered that they would immediately leave the company after work. It means they are likely to encounter traffic congestion and parking difficulties.
(3) According to the questionnaire survey on the actual arrival time of commuters conducted by Xia Jinjiao and Juan Zhicai (2012), and to ensure the continuity of the value function, we assumed that the expected arrival time of commuters was 7.82 min before the start of work. The earliest acceptable arrival time was 17.82 min before the start of work, and the latest acceptable arrival time was 2.18 min after the start of work [
14]. In utility theory, it was considered that the closer the arrival time of commuters to 7.82 min before the start of work, the greater the utility. The utility was positive between the earliest and latest acceptable arrival time. However, the utility was negative for travelers arriving at other time points. When applying prospect theory, the earliest and latest acceptable arrival times were set as the two reference points, namely,
and
The expected arrival time
was set as a pseudo-reference point. When the arrival time
was located between
and
, commuters would gain profit. The closer
was to
, the larger the profit. When
was located before
or after
, they would face losses.
(4) China has a large population density and a large number of motor vehicles. People in many cities have difficulties parking. Therefore, in order to avoid the long-term occupation of parking spaces, many enterprises stipulate that private cars can only be parked during working hours, and it is strictly forbidden to park overnight. Therefore, it was assumed that when people drive to work, they must drive their cars on the return trip.
(5) If people usually drive to work, they may look for parking spaces in certain locations, and walk to their offices. Because driving to work is a regular behavior, it was assumed that people were familiar with the parking environment, and these parking spaces could usually be found. This means there is no parking uncertainty in the departure trip.
3.2. Model Construction
3.2.1. Overview of Theories
Prospect Theory
Prospect theory was first proposed by Kahneman and Tversky in 1979 [
15]. The central idea is that decision-makers in reality are not completely rational. They make decisions under bounded rationality. Furthermore, the theory considers the different attitudes of people to gains and losses. When people face gains, they are risk averse, while on the contrary, they are risk preference. This theory divides the decision-making process into two stages: editing stage and evaluation stage. In the editing stage, the decision-maker sets up a reference point, and the decision-maker compares the results of each alternative with the reference point to determine the gains and losses. In the evaluation stage, the decision-maker evaluates each scheme, and uses the probability weight function to make an objective probability subjectivization. The whole process involves the value function
and the probability weight function
. The diagram of the value function is shown in
Figure 2.
Expected Utility Theory
Expected utility theory was originally proposed by Bernoulli in 1738. Then, it was redefined by Von Neumann and Morgenstern in 1947. It is a kind of normative decision theory under the condition of risk decision, in which the results of various alternatives are uncertain, but the subjective probability can be estimated through past information or experiences. The theory is not to describe the actual behavior of people, but to reveal how people make decisions under completely rational conditions.
Expected utility theory is based on utility maximization. Generally, it has two assumptions, which are as follows: one assumption is that the preference can be expressed using the utility function, while the other assumption is that the attitude to risk can be calculated using the expected utility function. If the value of a random variable
is
with a probability of
, and the utility of someone determined to obtain
is
. Hence, the utility of this random variable is:
Comparison of Prospect Theory and Expected Utility Theory
At present, the research on traffic behavior can be divided into two schools. One is the normative decision theory based on a completely rational assumption derived from economics. That is, how should people make decisions? The other one is the descriptive decision theory based on bounded rationality. That is, how do people actually make decisions? The normative decision theory regards travel choice behavior as a kind of economic behavior, which can understand transportation decision-making behavior more generally based on the assumption of perfectly rational economics. The expected utility theory belongs to normative decision theories. Descriptive decision theories consider the uncertainty of the transportation system. In their opinion, people cannot be perfectly rational in the real world. Hence, they do not make decisions based on the maximum utility. Risk attitude, personal preference and attitude affect the decision-making of people. Prospect theory belongs to descriptive theories.
3.2.2. Determination of the Value Function in Prospect Theory
is the loss avoidance coefficient. , which refers to the aversion degree of decision-makers to loss. The larger the , the more sensitive the decision-maker is to the loss. and are the risk attitude coefficients, , . A larger value means that the decision-maker tends more to the risk, and when the values are equal to 1, the risk of the decision-maker is neutral.
The established value function diagram of the model is presented in
Figure 3. The original point is the time of starting working.
Ta is calculated according to the arriving time and the start time of work.
3.2.3. Determination of Probability Weight Function in Prospect Theory
is the probability that the arrival time falls into the interval of different value functions. In the departure trip, the value of is affected by departure time and travel mode punctuality. In return trip containing activities, the value of is influenced by departure time, travel mode punctuality and parking uncertainty (if a car was selected as the travel mode).
is the probability weight function in the face of profit, while
is the probability weight function in the face of losses. According to the calibration of Kahneman and Tversky,
[
16].
3.2.4. Determination of Prospect Value
is the prospect value of the profit part; is the prospect value of the loss part; is the probability weight of the profit part ; is the value function of part ; is the probability weight of the loss part .
3.2.5. Calculation of the Total Prospect Value of the Travel Chain
The departure trip is set to A. The return trip is divided into several parts according to different activities. The first part of the return trip is . The second part of the return trip is …. Then, part of the return trip is . The prospect value of each part is , , , …, . represents the total prospect value of the travel chain, which is the sum of the prospect value of each part.
3.2.6. Determination of Utility Value in Expected Utility Theory
The value of the expected utility is represented as , and the utility of each type of scheme with a certain probability is expressed as .
is the probability of the arrival time falling into a certain area, and is the utility value of the arrival time falling into a certain area.
4. Example Analysis
4.1. Purpose of the Example and the Initial Travel Chain Setting
(1) Does the commuter change from driving to public transport when the return trip includes activities?
(2) The influence of arrival time uncertainties of cars on the return trip on the choice of travel modes.
(3) The influence of parking time uncertainties of cars on the return trip on the choice of travel modes.
(4) Whether there are differences in the conclusions obtained from expected utility theory and prospect theory.
Based on the above research objectives, the scenarios for the departure trip and return trip through the two travel modes set by the investigators should accord with the following terms:
(1) Since the assumption is that commuters drive to work in the simple chain, and the choice of travel mode is influenced by the departure trip (it was decided that there is no time constraint on the return trip of the simple chain). The scenario setting in the departure trip should make the expected utility value (EU) and prospect value (PV) of driving greater than the expected utility value and the prospect value of public transport, respectively.
(2) In view of the simplicity of the analysis, for building the initial complex travel chain, the arrival time and the probability to participate in an activity on the return trip was set to be the same with the two modes in the departure trip. Hence, the optimal choice of the initial complex travel chain was driving without considering the parking time on the return trip.
(3) Since the purpose of the present study was to determine the influences of uncertainty of arrival time and parking time of cars on the return trip that contains activities, it was assumed that the data of public transport in the travel chain remain unchanged.
Based on the above, the scenario of the initial complex travel chain is presented in the
Table 1.
In order to verify the rationality of the data in
Table 1, the expected utility value and prospect value of the departure trip and travel chain were calculated. The data are presented in
Table 2. The optimal choice of the departure trip and travel chain is selecting the car, which conform to the assumption.
4.2. Scenarios Setting on the Return Trip and Decision Results
Different parking time and arriving time of cars on the return trip were respectively added based on the initial travel chain, in order to observe whether the optimal choice changed.
(1) The addition of different parking time of cars on the return trip based on the initial travel chain and the arriving time of cars on the return trip remained unchanged.
The data are presented in
Table 3. Compared with the expected utility value and prospect value of public transport in the travel chain in
Table 2, the optimal choice is presented in
Table 4. When the parking time is 5 min and 10 min, driving a car is the best choice. However, when the parking time is 15 min, public transport is the best choice.
(2) Changing the arrival time of cars on the return trip based on the initial travel chain, ignoring the parking time of cars
The scenario setting for the return trip is presented in
Table 5. The average late time can be calculated according to the given arrival time and its probability. The average late time describes the uncertainty of the arrival time. The longer the average late time, the greater the uncertainty of risk becomes. The average late time on the return trip of the initial travel chain is −6 min.
(1) The EU and PV of cars in the travel chain include scenario 1. The optimal choice is presented in
Table 6.
(2) The EU and PV of cars in the travel chain including scenario 2. The optimal choice is presented in
Table 7.
(3) The EU and PV of cars in the travel chain including scenario 3. The optimal choice is presented in the
Table 8.
4.3. Results Analysis
In the travel chain of cars, and considering the different parking times on the return trip, the expected value is
and the prospect value is
. In the travel chain of public transport, the expected value is
and the prospect value is
. The curves for the expected utility value and prospect value of cars and public transport in the travel chain were drawn while considering the changes in parking time of cars. The curves are presented in
Figure 4. It can be observed that when parking time is gradually increased, the expected value and prospect value of cars continuously decrease until these are smaller than the expected value and prospect value of public transport, respectively. At this time, public transport is better than driving a car.
According to
Figure 4, the demarcation points of the conversion from driving a car to public transport based on these two theories are between 10 min and 15 min. In order to find the nearest demarcation points, it was assumed that the parking time is 11 min. The EU and PV of the travel chain are presented in
Table 9. At this time, public transport is the best choice. Compared with
Table 4, the demarcation points of parking time are between 10 and 11 min, which are transitions from driving a car to public transport.
In the travel chain of cars, and considering the different arrival times on the return trip, the expected value is
and the prospect value is
. In the travel chain of public transport, the expected value is
and the prospect value is
. The curves for the expected utility value and prospect value of cars and public transport in the travel chain were drawn while considering changes in the arrival time of cars. These curves are presented in
Figure 5. It can be observed that when the average late time gradually increases, the expected utility value and prospect value of cars continuously decrease until these are smaller than the expected value and prospect value of public transport, respectively. At this time, public transport is better than driving a car.
Two functions fitting to the EU curve and PV curve of cars were obtained:
The intersection of the car’s EU curve and public transport’s EU curve is the demarcation point of the travel mode conversion, according to the expected utility theory. When the average late time is smaller than 2.98 min, driving a car is better than public transport. When the average late time is more than 2.98 min, it is better to choose public transport for the trip.
The intersection of the car’s PV curve and public transport’s PV curve is the demarcation point of the travel mode conversion, according to prospect theory. When the average late time is smaller than 3.09 min, driving a car is better than public transport. When the average late time is more than 3.09 min, it is better to choose public transport for the trip.
5. Research Conclusions
The present study applies prospect theory and expected utility theory to study the travel mode choice of commuters who have cars in complex travel chains. The main results and conclusions of the research are as follows:
(1) The established models introduced time as the decision variable, and the acceptable earliest arrival time and the acceptable latest arrival time were set as two reference points, which divided two loss zones and one profit zone. Depending on the relationship between the arrival time and the reference points, decision-makers will gain profit or face losses. After the division of profit or losses, the expected utility values and prospect values of the travel chain can be calculated. By comparing the expected utility values or prospect values of different travel modes, the optimal choice of travel mode can be determined.
(2) The example shows that return trips that contain activities may affect the travel mode choice of commuters who usually drive to work. Due to time constraints, they may give up driving to work and switch to public transport. This indicates that from the perspective of travel chains, studying the issues of travel behavior can reflect the decision-making behavior of travelers in real life more truly. This is conducive to better understanding of the passengers’ travel behavior.
(3) When the return trip contains activities, the main factors influencing commuters’ travel mode choice between cars and public transport are the uncertainty of arrival time and parking time. Activities on the return trip occur during rush hour, causing the uncertainty of arrival time and parking time to be greater. Hence, these factors may make commuters give up driving to work on the departure trip.
(4) The method and the example proposed in the present provide an idea for solving this kind of problem. According to the probability of parking time or the arrival time of cars, people can make a comparison between driving a car and taking public transport in order to make a prediction for selecting which one is better.
(5) The demarcation points based on these two theories are very close, which verify the consistency of expected utility theory and prospect theory. Although expected utility theory is based on perfect rationality, and prospect theory is based on bounded rationality, under the axiom of the algebra of combination, the conclusions based on prospect theory and expected utility theory remain consistent.
(6) With the promotion of low-carbon transportation, determining how to attract people driving in daily life to transfer to public transport is an important way to realize energy saving and emission reduction. According to the results of the present study, it can be found that improving the reliability of public transport is a good way to reduce car use.
(7) In the analysis of the example, the present study only considers the case that the return trip contains one activity. In real life, the return trip usually contains more complex activities and there are more influencing factors to consider. The paper provides an approach for the study of travel behavior with two uncertain factors in the travel chain. Further research can be launched from the complexity of uncertain factors and activities by applying the knowledge of time geography.


