Article

Land Use Types and Geomorphic Settings Reflected in Soil Organic Carbon Distribution at the Scale of Watershed

1
School of Land Science and Technology, China University of Geosciences, Beijing 100083, China
2
School of Public Administration, Shanxi University of Finance & Economics, Taiyuan 030006, China
3
Key Laboratory of Land Consolidation and Rehabilitation, the Ministry of Land and Resources, Beijing 100035, China
*
Author to whom correspondence should be addressed.
Sustainability 2018, 10(10), 3490; https://doi.org/10.3390/su10103490
Submission received: 24 August 2018 / Revised: 13 September 2018 / Accepted: 19 September 2018 / Published: 29 September 2018

Abstract

:
Soil organic carbon (SOC) is vital to soil ecosystem function and it plays a key role in carbon cycling in the terrestrial ecosystem. The spatial pattern of SOC stock (SOCs) is affected by specific geomorphic settings and land-use types at the scale of watershed. Nevertheless, the distribution of SOCs with fluvial landform regimes and land use types was not sufficiently elucidated in the semi-humid riparian ecosystem in north China. In this study, 103 soil plots were sampled and spatial auto-correlation method was adopted to detect the spatial pattern of SOCs in the Changhe watershed that was located at the boundary of the Loess Plateau and the Taihang Mountains. The results showed that SOCs in the Changhe watershed varied from 18.03 Mg ha−1 to 21.51 Mg ha−1 and it was in the order: grassland > forestland > cropland > construction land. SOCs varied with geomorphic settings, among which, the altitude exerted more influence on the distribution of SOCs than the aspect and the slope. In terms of the spatial pattern of SOCs, 17 plots with higher SOCs collectively distributed in the west of the watershed and that with lower SOCs (19 plots) concentrated in the midlands. This indicated that the upland had higher SOCs while the lowland had lower values. Overall, land use type and geomorphic settings (especially the altitude) should be considered when estimating the SOC sequestration in warmer and wetter watershed in north China. With regard to the implications for land use management, reforestation could elevate the SOCs. Moreover, no-tillage and returning crop straw to cultivated soils could be efficient approaches to elevate soil carbon sequestration and soil productivity.

1. Introduction

The dividing crest separates most of biotic and abiotic ecosystem elements from both sides of the watershed. Thus, watershed is characterized as an independent ecological system [1]. From this point of view, watershed is regarded as an optimal geographic unit to observe ecological processes [2,3]. Generally, watershed landscape consists largely of the riparian scenery which exerts substantial influence on geomorphic, hydrologic and ecological processes of the watershed [4,5]. Moreover, the hydro-geomorphic regime of the riparian ecosystem underpin the spatial distribution of the material and energy throughout the watershed [6]. For example, the morphology and runoff characteristics of the watershed not only dictate alluvial aquifer recharge and subsurface hydrology regime [7,8], but determine the allocation of aboveground soil properties [9,10]. It is more challenging to simulate the distribution of soil properties in the watershed than in flat areas because water and heat condition vary dramatically over a short distance within the watershed due to the complex geomorphic regime [5]. Quesada et al. found that the ranges in available P, Ca, Mg and K content were 5%, 2%, 8% and 24%, respectively across hillslopes [11]. Actually, existing knowledge of riparian ecosystems had focused on the effect of runoff on soil erosion [12], the evaluation of soil quality [13], the spatial patterns of soil properties (e.g., soil water, salinity) and plant community with hydro-geomorphic gradients [5,14,15,16,17,18,19].
Soil organic carbon (SOC), one of the most important materials in nature, supports the service of culture, provisioning, regulating and supporting in the terrestrial ecosystem [20,21]. Decline in SOC storage gives rise to the accelerated erosion and reduced porosity, water retention, microbial biomass and N, P, S stocks [22]. Moreover, SOC plays a key role in global carbon cycling [23]. It was estimated that SOC accounts for approximately two-thirds of the terrestrial carbon pool [24]. Consequently, even small change in SOC pool can significantly affect the concentration of CO2 in the atmosphere, which results in global climate change [16].
SOC is mainly from litter, plant roots, microbial residues, soil animals and their excreta, as well as the application of organic fertilizers [25,26,27]. Thus, SOC is sensitive to the environmental regimes [24,28]. Authors found that grassland had higher SOC stock (SOCs) than cropland in the Loess Plateau, because more organic matter was input into grass soil and the organic carbon was well-protected by soil aggregate in grassland [29]. Furthermore, geographic factors such as altitude, slope and aspect affect the distribution of SOCs due to the re-distribution of water and heat along the terrain settings [30]. At the scale of watershed, researches on SOCs in semi-arid areas, China have yielded plentiful findings. Zhao et al. found that the grassland had the highest SOCs followed by forestland, terrace, sloped cropland, and the dammed field in Wangmaogou Watershed, Shaanxi Province [31]. Xin et al., however, suggested that the SOCs in 10-year-old forests is 17.91% higher than that in terraced cropland, but 32.25% lower than that in 30-year-old forests in Luoyugou watershed, Gansu Province [32]. Moreover, authors also paid attention to the effect of land use type changing on SOCs in the semi-arid area, for example, Wang et al., proposed that cropland transforming to grassland or shrubland significantly increased SOCs in Yangjuangou watershed, Shaanxi Province [33]. Similarly, Zhang suggested that the conversion of sloped croplands into forestlands and grasslands improves the SOCs in Zhifanggou watershed, Shaanxi Province [34]. Considering SOCs differed with climate conditions, it is suggested that SOCs had distinguished spatial patterns in wetter and warmer watershed the riparian ecosystem compared to the semi-arid areas. Unfortunately, such documents are lacking.
The Loess Plateau and Taihang Mountains are famous geographic areas in China. The transition zone between them is a typical area with rugged terrain and semi-humid climate. Compared to the Loess Plateau that is dominant in semi-arid climate, the transition zone has better water and heat conditions. However, just as the Loess Plateau, the transition area has a long history of cultivation and ecology restoration engineering (such as reforestation) was implemented for decades to protect the environment. In terms of SOC, the spatial distribution of SOC storage remained unclear in the transition area watershed. In this study, we hypothesized that the distribution of SOCs was determined by land use types and geomorphic settings in such an area. Thus, Changhe watershed, located at the boundary of the Loess Plateau and Taihang Mountains, was selected and soil sampling was carried out to (1) detect the effect of geomorphic factors (elevation, slope and aspect) on SOCs; (2) reveal the spatial pattern of SOCs at the watershed scale; and (3) find implications for the improvement of land use management in such area.

2. Materials and Methods
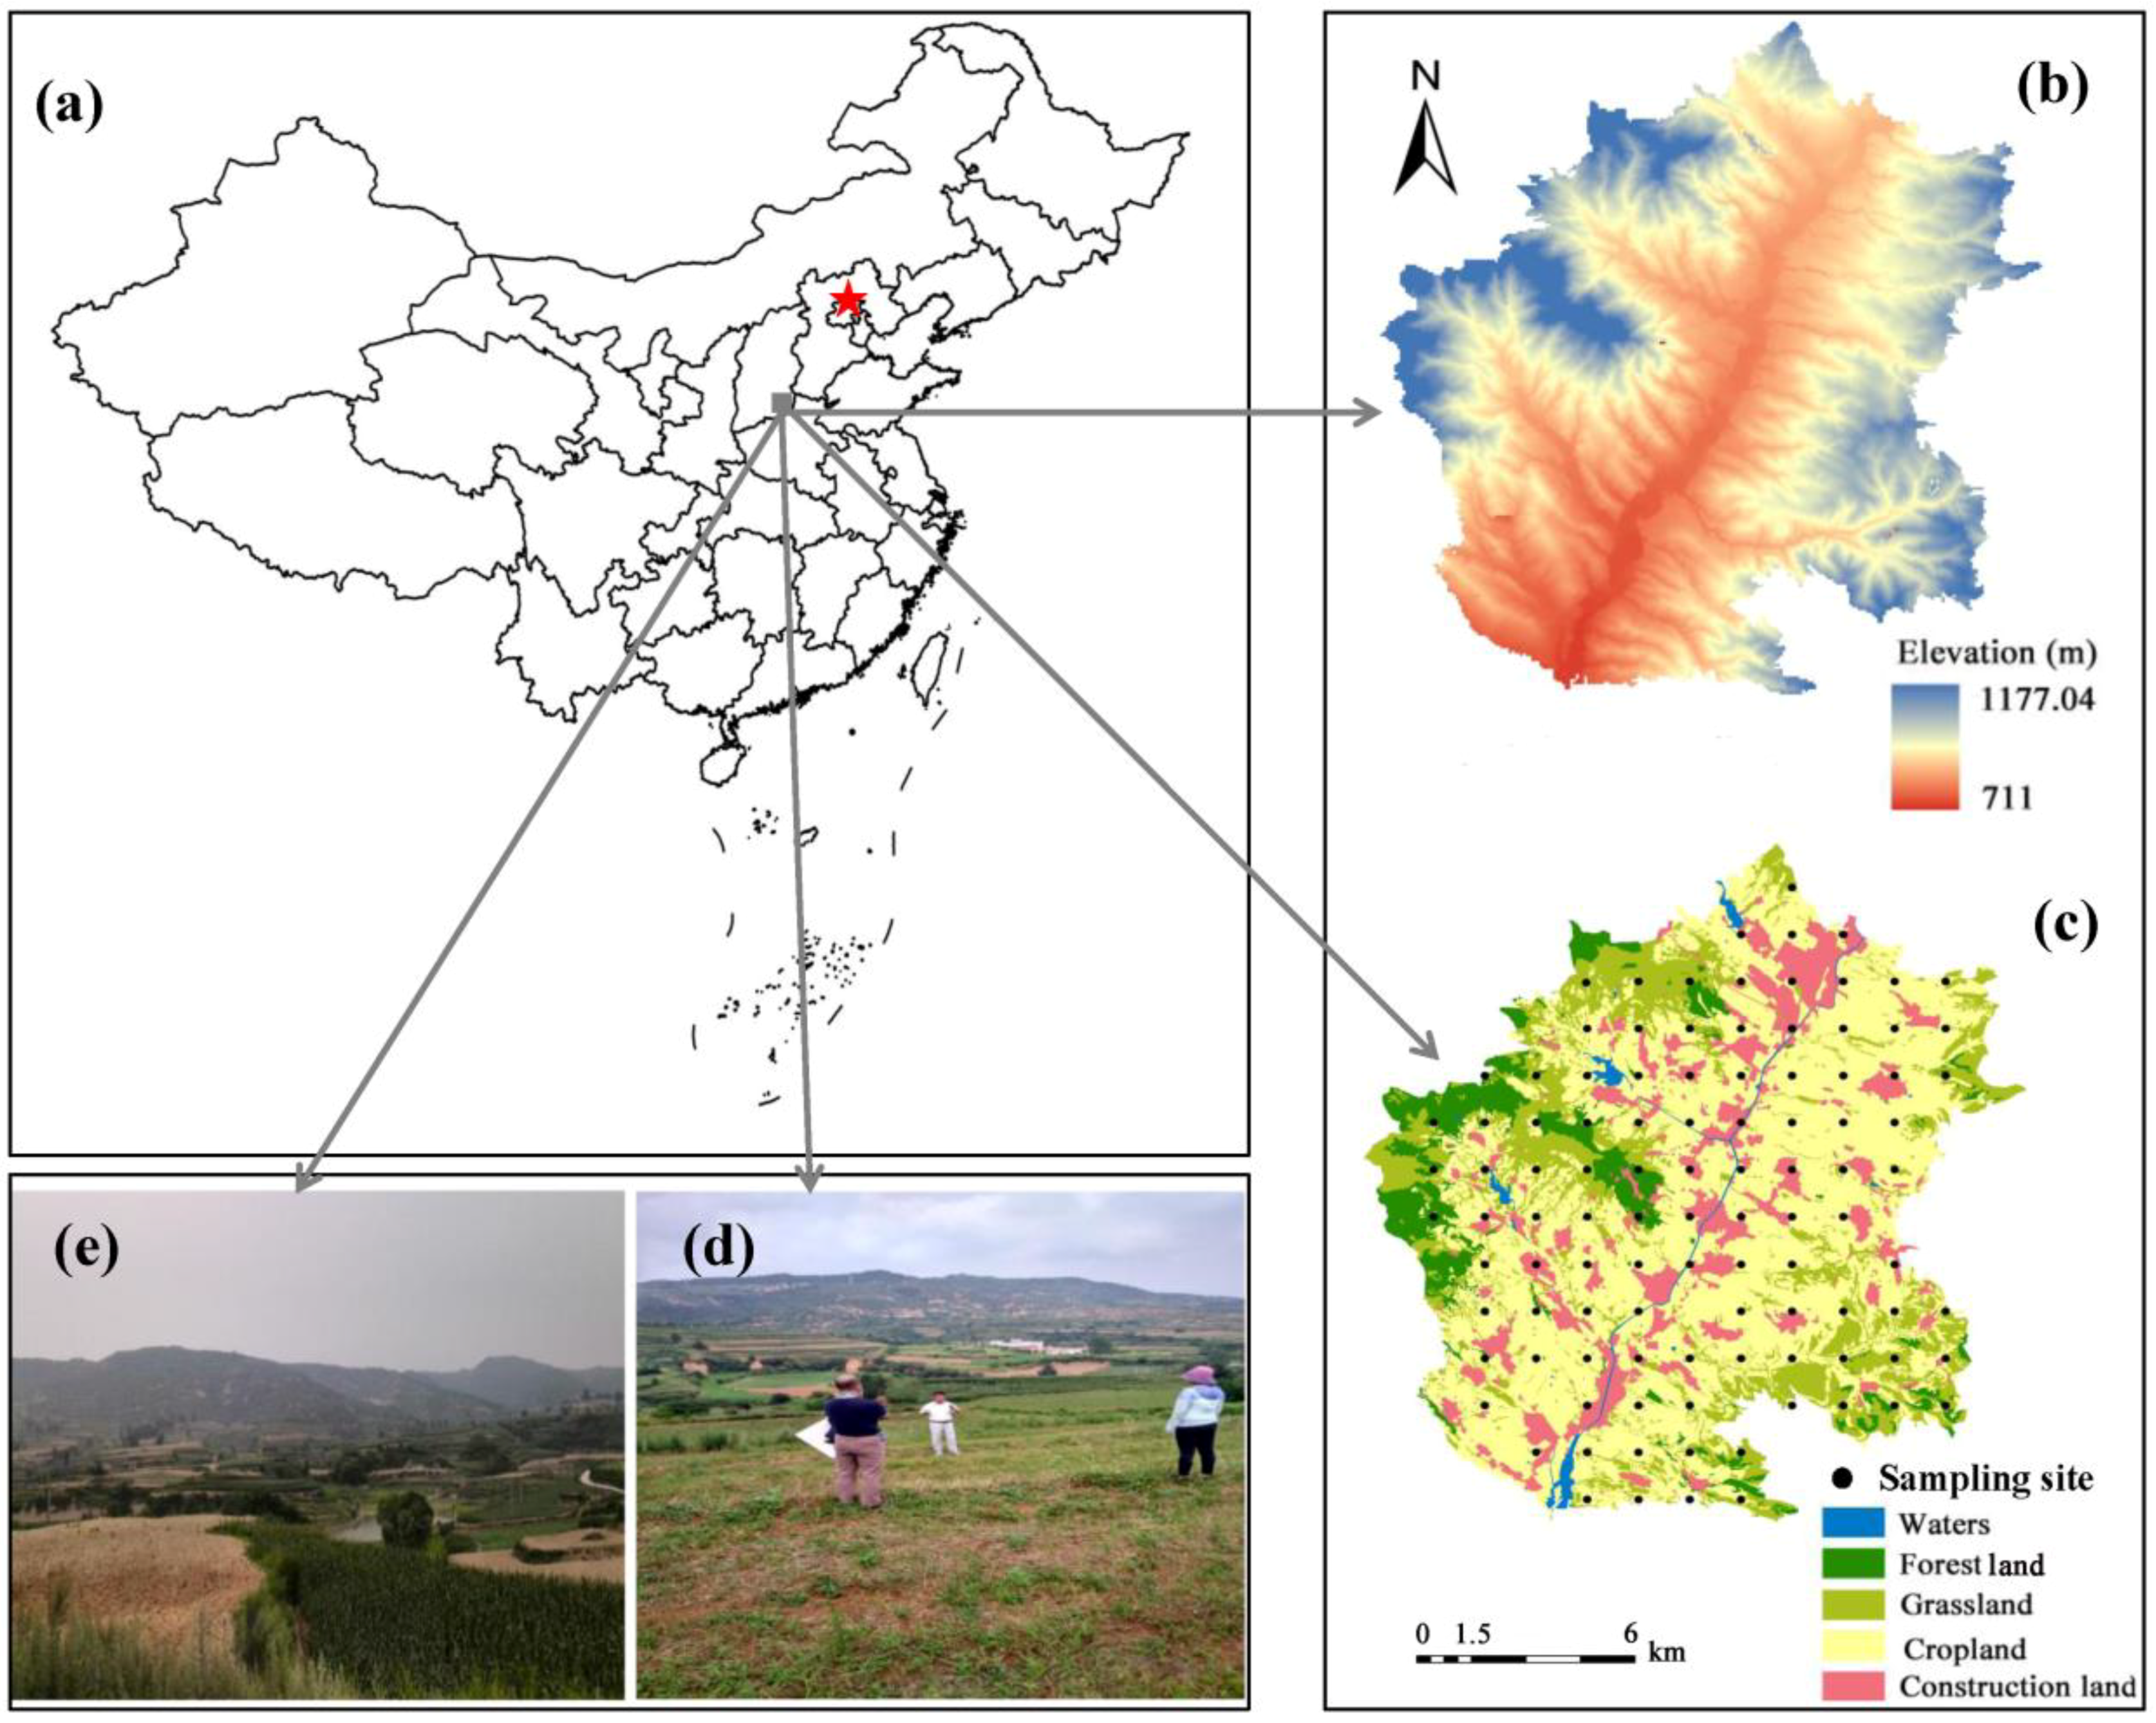
2.1. Study Area

Geographically, Changhe watershed is located in the Jincheng City, Shanxi Province and it is located at the southeast edge of the Loess Plateau (the boundary of the Loess Plateau and Taihang Mountains, 112°37′40″–112°46′04″ E, 35°30′10″–35°38′06″ N) (Figure 1a). Changhe River is a perennial river and the channel length is 14.5 km. Changhe watershed has an area of 113.19 ha. The dominant topography is mountain and hill with an average elevation of 880 m. It has a temperate, continental monsoon climate with an average annual precipitation of 628 mm and an annual evaporation of 1700 mm. The temperature averages 11 °C. The soil type is characterized by cinnamon soil. Moreover, the land use types are dominated by cropland (6863.99 ha; 60.62% of the total area), grassland (2133.7 ha; 18.84%), construction land (1320.89 ha; 11.67%) and forest land (893.25 ha; 7.89%) (Figure 1c). In addition, the construction land was used for rural building.
Changhe watershed has a higher cultivated rate due to the excellent water and heat regimes. To date, more than 60 percent of the land is cultivated for agricultural purposes. The cropland is predominantly terrace, which protects the soil from water erosion. Nevertheless, areas with rugged terrain were implemented with the reforestation engineering for decades. The cropping system is “three crops, 2 years” with the rotation of Zea mays and Triticum aestivum. The tree species are Populus Linnaeus, Robinia pseudoacacia Linnaeus and Pinus tabulaeformis Carrière. and herbaceous community mainly consists of Setaria viridis Beauv, Artemisia annua Linnaeus and Artemisia gmelinii.

2.2. Soil Sampling

The soil samples were collected in July 2016. One-hundred-and-three soil sampling sites were distributed as a grid with a distance of 1 km between the two adjacent sites (Figure 1c). The coordinate, altitude, slope, and aspect of each soil sampling sites were recorded when sampling. Five random sampling locations were identified within each sample site and soil samples were collected at 0–20 cm depths of each location after litter and fermentation being removed. All of the soil from each plot was mixed to make the composite sample. After removing all visible roots and fresh litter material, soil samples were air-dried and sieved through a 100-mesh for the analysis of SOC, nitrogen (N), phosphorus (P), potassium (K) and pH. In addition, soil samples for bulk density (BD) were obtained using stainless steel cylinders (5.0 cm diameter and 5.0 cm high).

2.3. Analyses of Soil Properties

The method of dry combustion was applied to determine the SOC [35]. pH was determined in H2O suspension (soil: water ratio of 1:2.5) with a pH Meter (FE20K, Mettler Toledo, Zurich, Switzerland). BD and field water capacity were calculated by the oven-dried method [36]. Available nitrogen (AN) was determined using the zinc-cadmium reduction method [37] and available phosphorus (AP) was determined using the Olsen method [38]. Moreover, available potassium (AK) was measured using a flame photometric method [37]. Finally, soil coarse fragments were analyzed using Longbench Mastersizer 2000 laser particle-size analyzer (Malvern Instruments, Malvern, England).

2.4. Calculation of SOCs

SOCs was calculated using Equation (1)
S d = C c B D D ( 1 a ) 10 1
where Sd was the SOCs (Mg ha−1); Cc was the content of SOC (g kg−1); BD represented the soil bulk density (g cm−3); D was the soil layer thickness (cm); and α was the proportion of coarse fragments > 2 mm in soils.

2.5. Spatial Auto-Correlation Method

Spatial auto-correlation method was utilized to detect whether the distribution of SOCs was clustered or random via ArcGis (Ver9.3, ESRI, Redlands, CA, USA). The global spatial auto-correlation reflected the spatial correlation among soil carbon stocks at the scale of the watershed, while local spatial auto-correlation further revealed the relationship of SOCs among geographic units. Global spatial auto-correlation was expressed by the global Moran′s I index and local spatial auto-correlation by local Moran′s I index. Moran′s I index ranged from −1 to 1. If Moran′s I = 0, it indicates a randomness spatial pattern. If Moran′s I > 0, it denotes a positive spatial correlation, while Moran′s I < 0 means a negative correlation. In addition, the significance of spatial relationship was detected by Z(I). Z(I) > 1.96, indicating a significant auto-correlation among SOCs [39].
The local spatial auto-correlation could be represented by the local indicators of spatial association (LISA) map. In the map, sites marked with High-High (HH) and Low-Low (LL) indicated it was where the higher or lower SOCs values were clustered, respectively. Whereas the High-Low (HL) and Low-High (LH) types indicated negative spatial auto-correlations.
The calculation of global Moran′s I index was:
I = N i = 1 N j = 1 N W ( i , j ) i = 1 N j = 1 N W ( i , j ) ( X i X ¯ ) ( X j X ¯ ) i = 1 N ( X i X ¯ ) 2
The local Moran′s I index was:
I i = X i X ¯ i = 1 n ( X i X ¯ ) / ( n 1 ) j = 1 N W ( i , j ) ( X j X ¯ )
where N was the amount of the objects, Xi denotes the observed value, X ¯ indicates the mean value of Xi and W(i,j) was the spatial connection matrix between i and j.

2.6. Data Analysis

To reveal the relationship between SOCs and the geomorphic settings, the elevation of Changhe watershed was classified into four groups: 740–800 m, 800–860 m, 860–920 m, >920 m and the slope was classified into 0–5°, 5–10°,10–15°, >15°. The aspect was divided into eight gradients as well: N (337.5–22.5°), NE (22.5–67.5°), E (67.5–112.5°), SE (112.5–157.5°), S (157.5–202.5°), SW (202.5–247.5°), W (247.5–292.5°), NW (292.5–337.5°).
One-way ANOVA was adopted to compare the mean values of soil physicochemical properties among land-use types in SPSS 16.0 (SPSS Inc., Chicago, IL, USA). The relationship between SOC stock and terrain factors (elevation, aspect and slope) were detected by boosted regression trees (BRT) analysis using modified “GBM” packages [40] in R 3.3.2. All statistical significance was determined at p < 0.05.

3. Results

3.1. Physicochemical Properties of Changhe Soils

Generally, the cropland had highers amount of AK, AP and AN than other land use types (Table 1), among which AK varied from 37.84 to 44.99 mg kg−1, AP from 27.12 to 35.91 mg kg−1 and AN from 0.72 to 0.78 g kg−1. Changhe soils were characterized as alkaline with pH fluctuating around 8. No significant differences were observed in BD and field water capacity among land use types (p > 0.05): BD had a range of 1.27 to 1.35 Mg m−3 and field water capacity ranged from 16.02 to 16.59%. Nevertheless, significant difference (p < 0.05) was obtained in clay content among soils: Construction land had the highest fraction (31.45%), whilst forestland had the lowest (23.15%).

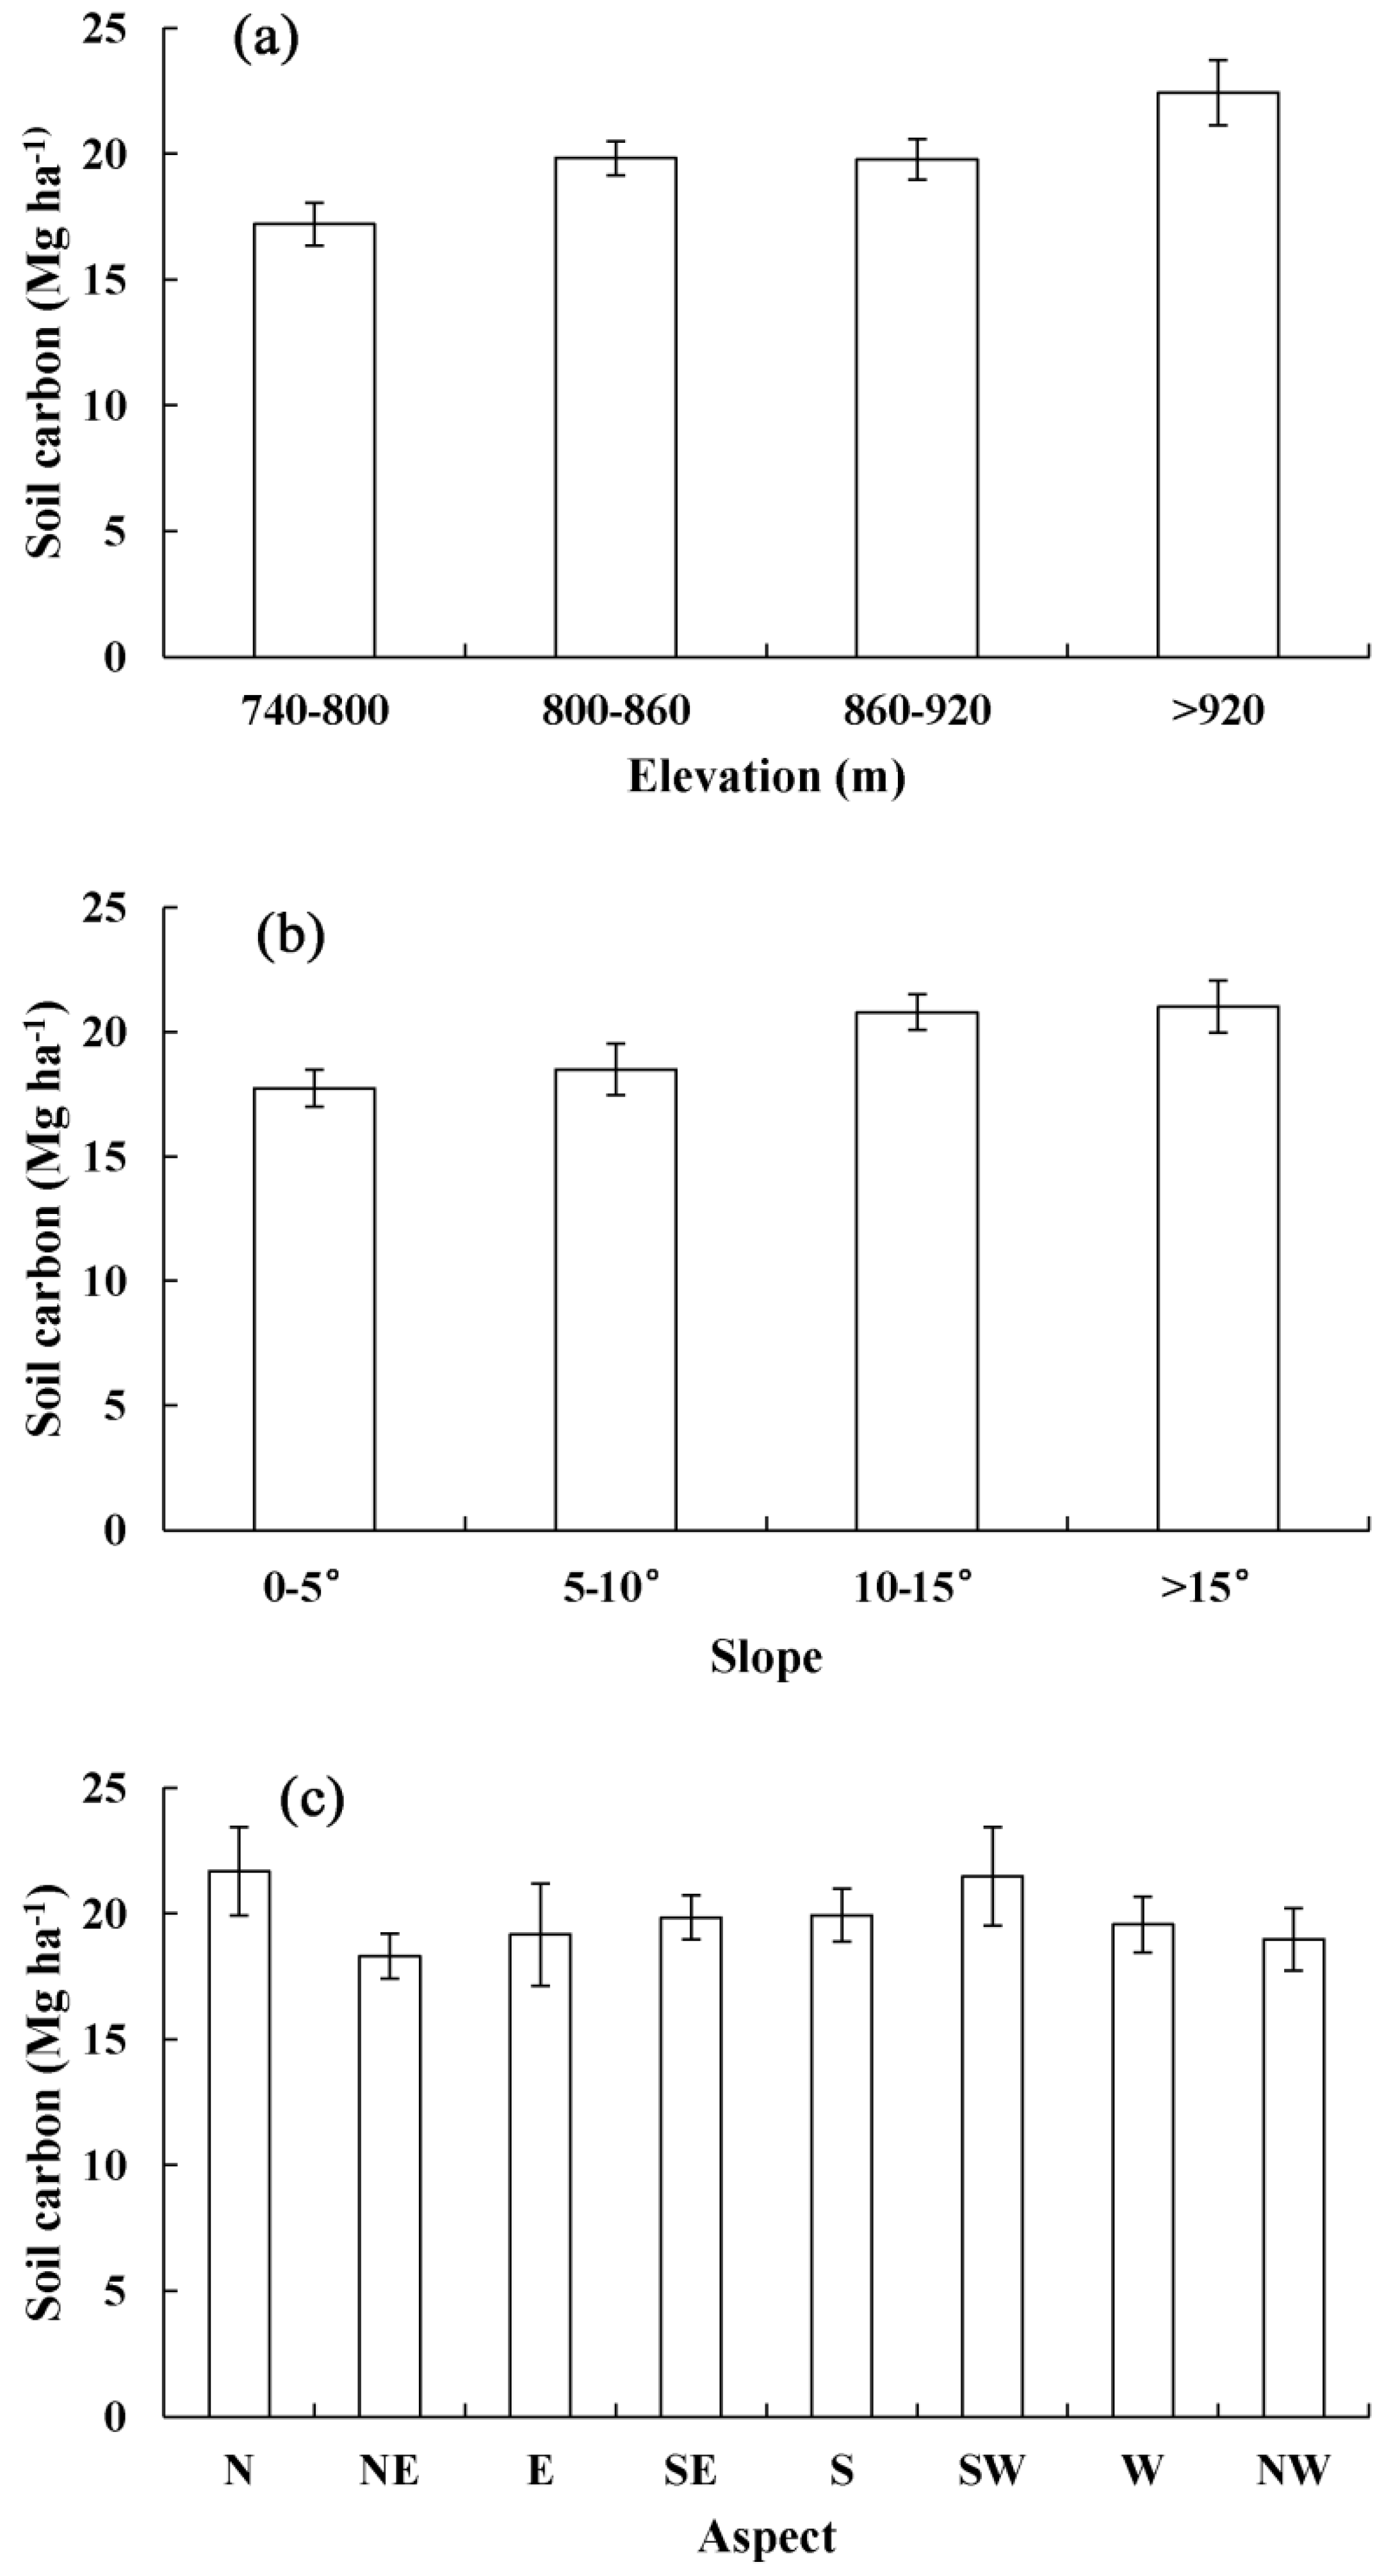
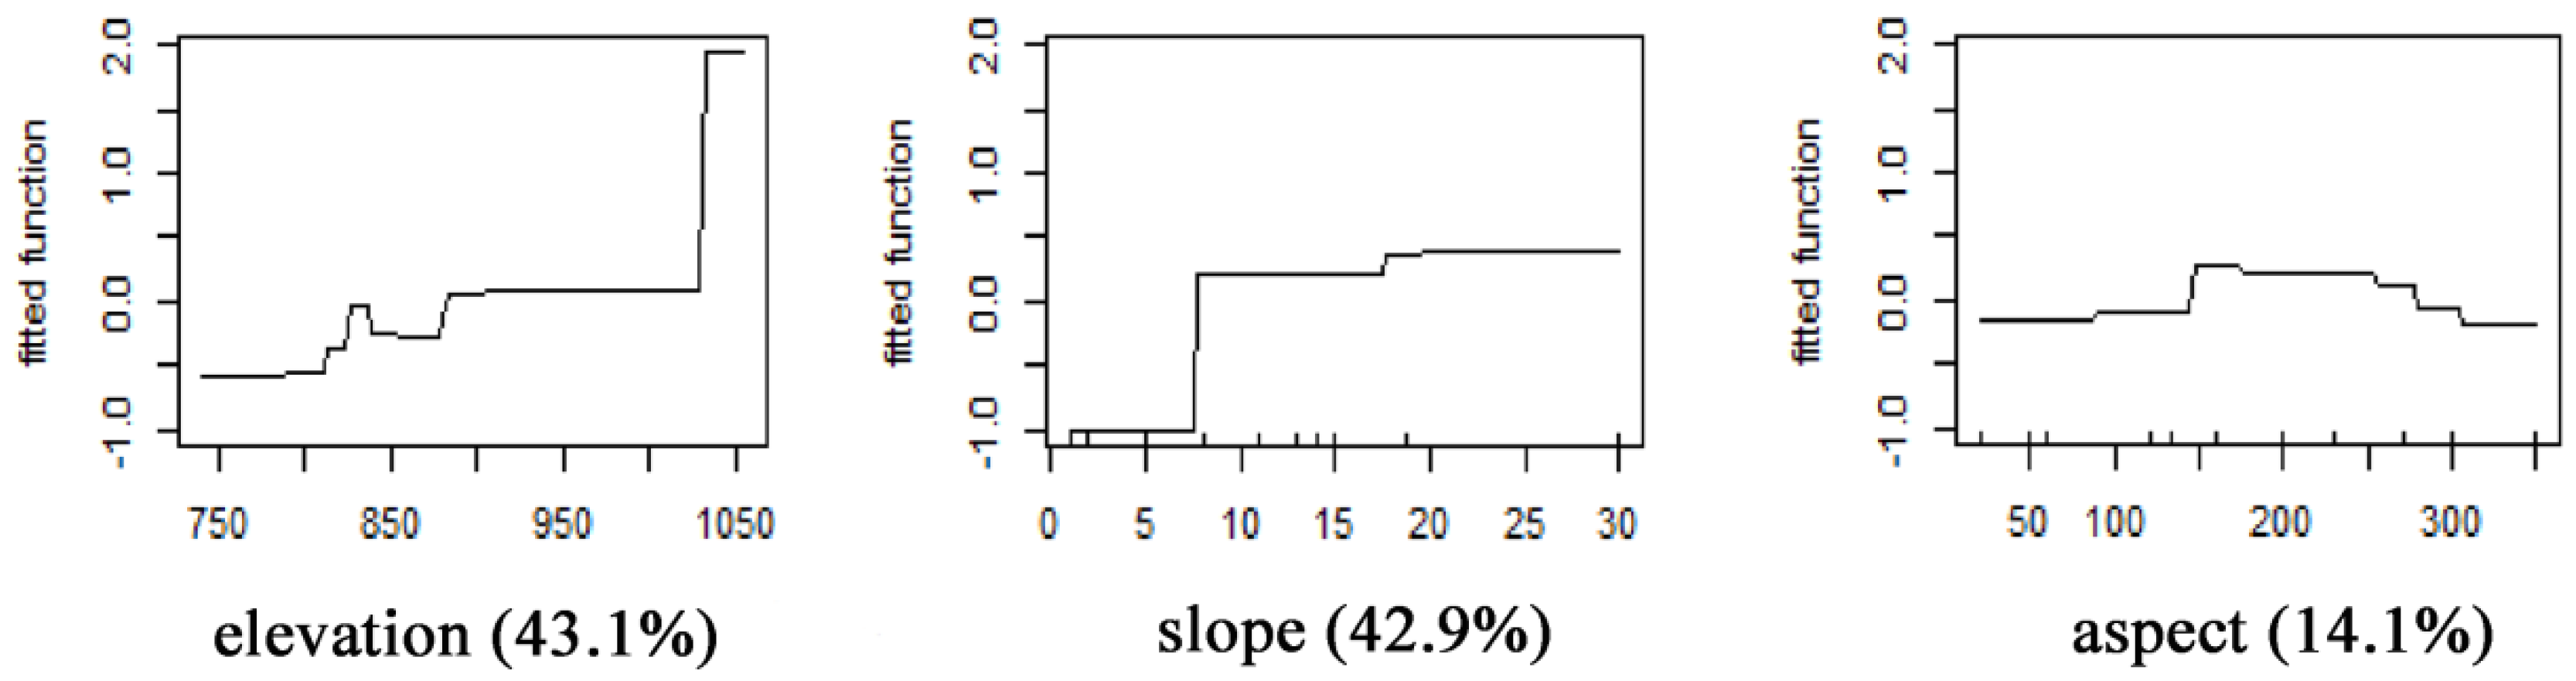
3.2. The Distribution of SOCs with Land Use Types and Geomorphic Settings

SOCs varied with land-use types and geomorphic settings. Grassland (21.51 Mg ha−1) had the highest SOCs, followed by forest land (20.88 Mg ha−1) and cropland (19.27 Mg ha−1). Construction land (18.03 Mg ha−1), however, had the least amount of SOCs (p < 0.05) (Table 2). In terms of the relationship between SOCs and geomorphic settings, an increasing trend of SOCs with altitude was observed: Areas with elevation >920 m stored more SOCs than that with 740–800 m and 800–860 m. Moreover, higher SOCs sequestrated where the slope was 11–15° and >15° whereas the lower fractions stored where the slope was 0–5° and 5–10°. In addition, the north and southwest aspect of the watershed had higher fraction of SOCs than other aspects (Figure 2). In terms of the influence exerted by geomorphic factors to SOCs, the elevation explained 43.1% of the SOCs variance, followed by the slope (42.9%) and the aspect (14.1%) according to BRT (Figure 3).

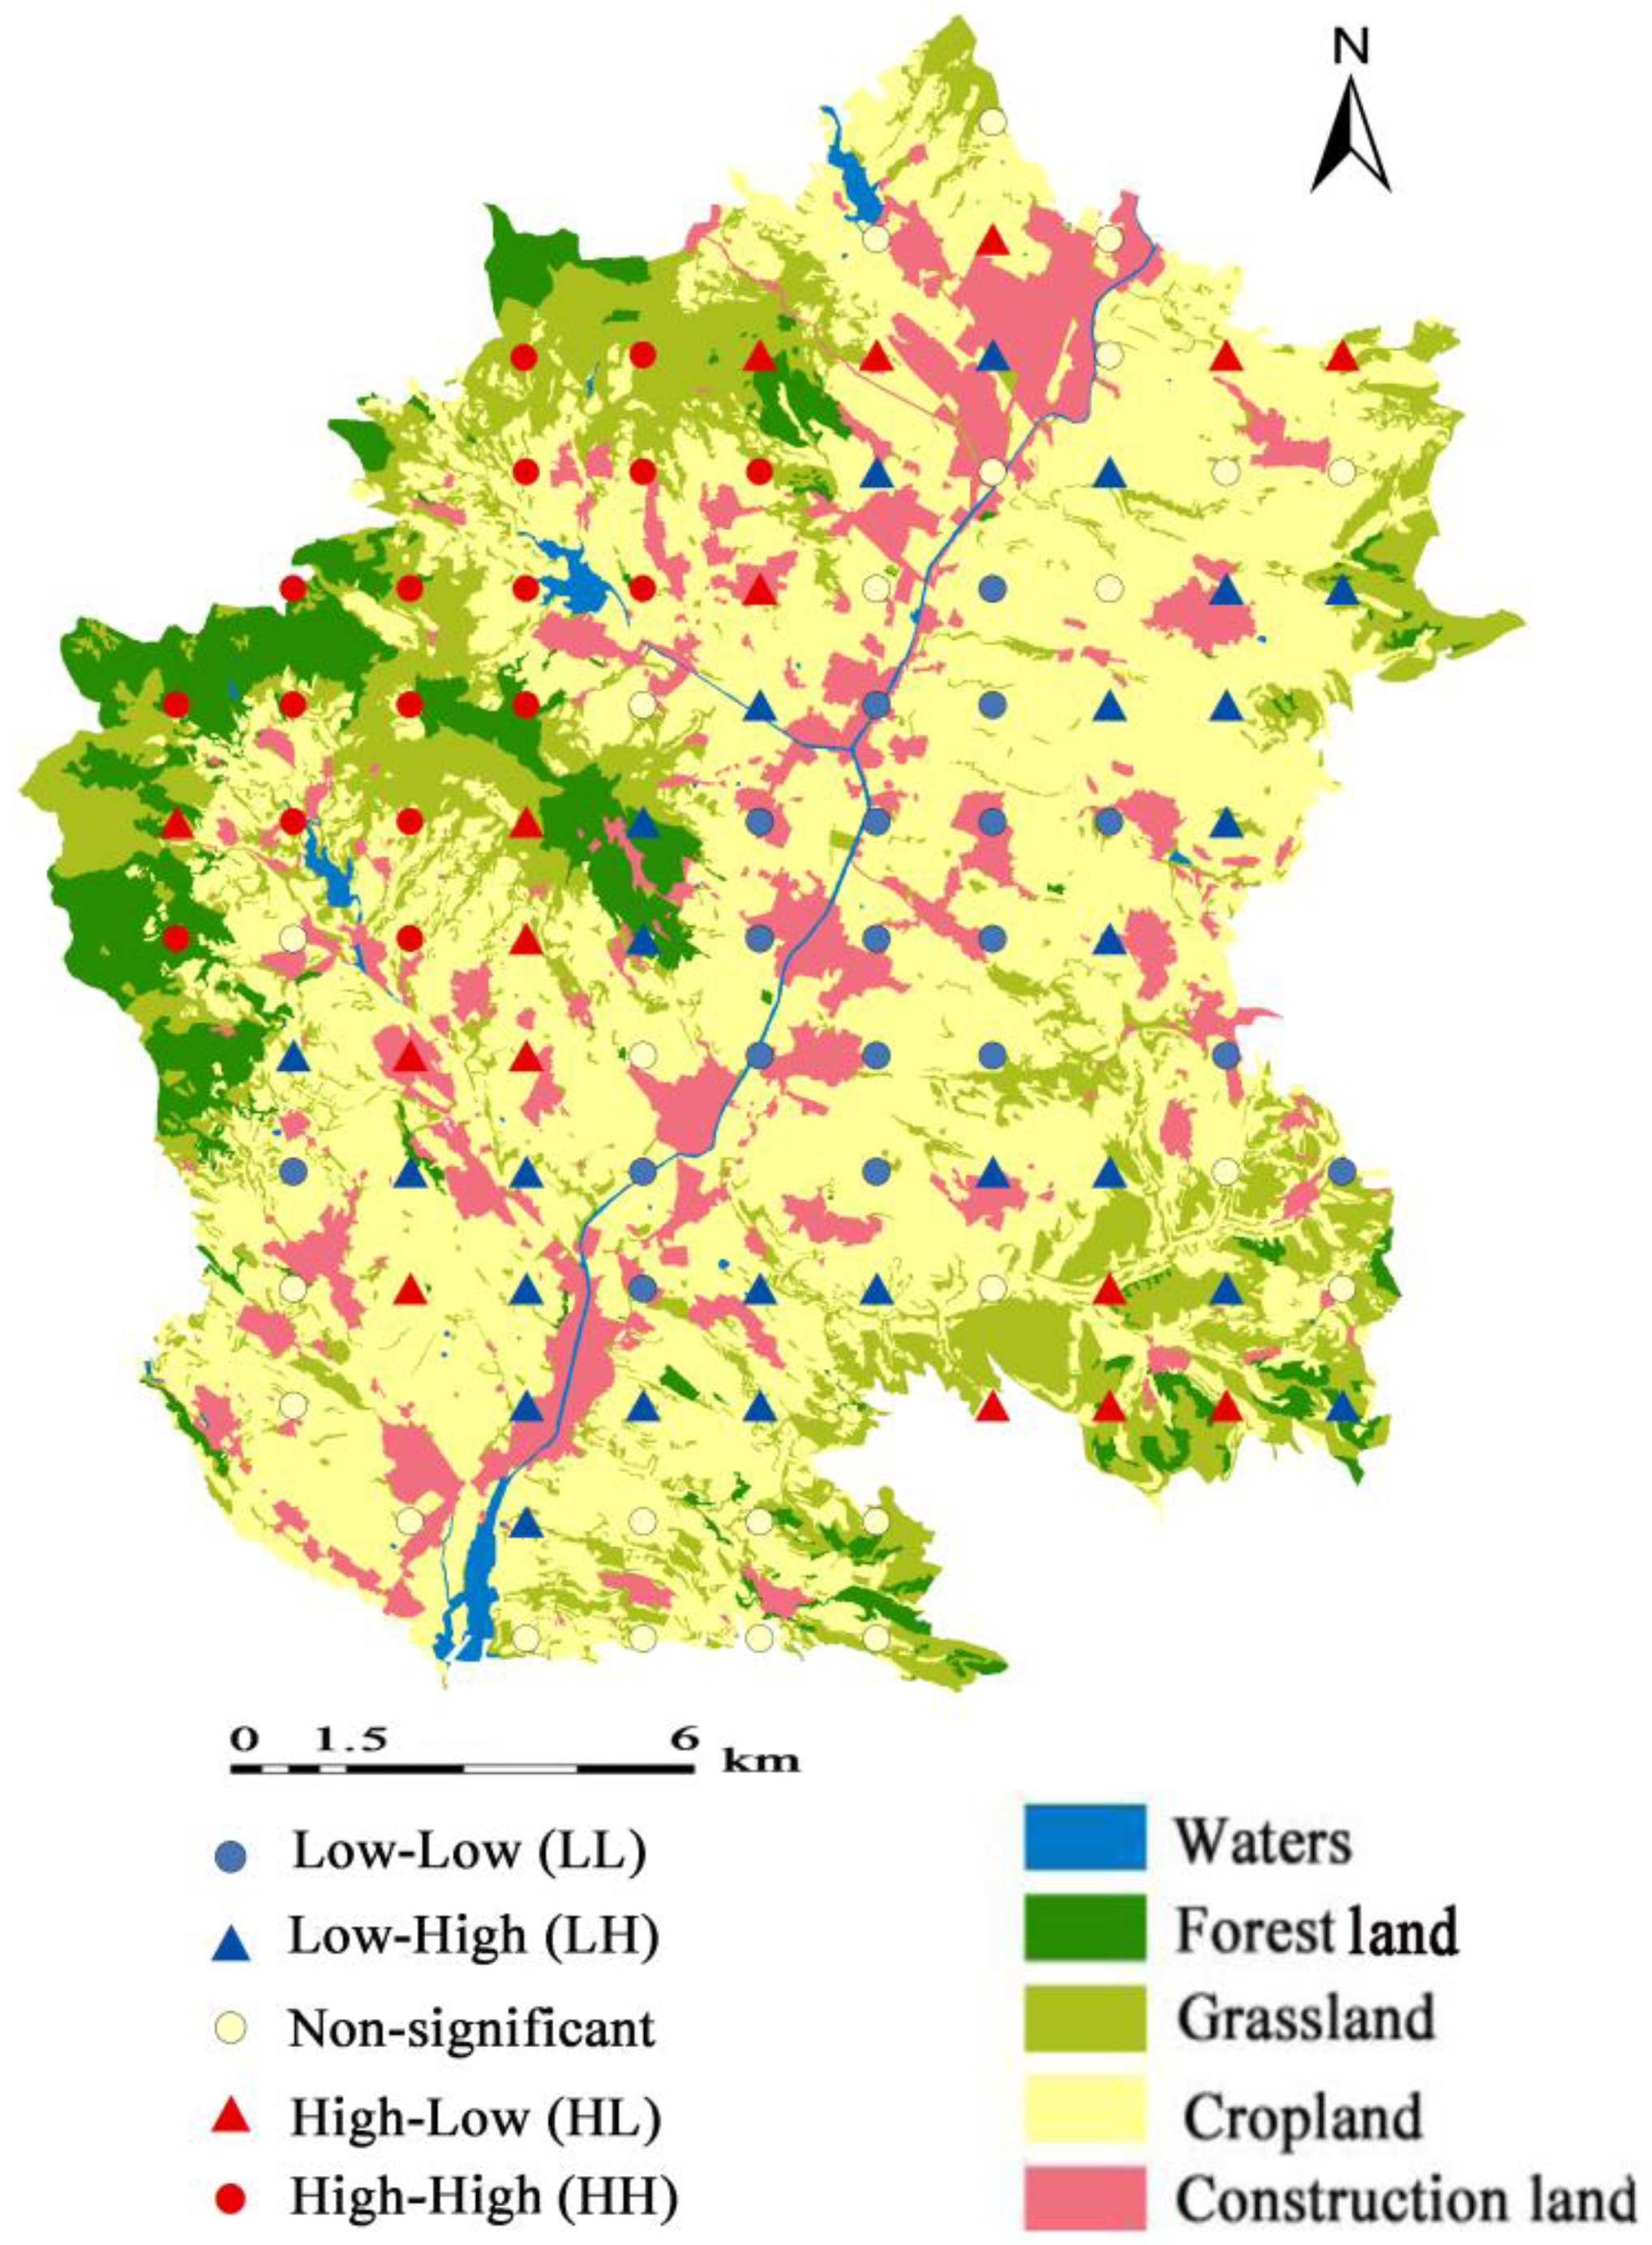
3.3. The Distribution of SOCs in the Changhe Riparian Ecosystem

The global Moran′s I indexes of SOCs was 0.26 and Z(I) was 3.55, indicating that the SOCs had significant auto-correlation in spatial and the SOCs had a clustered distribution in the Changhe watershed (Table 3).
Generally, spatial patterns of SOCs were associated with geomorphic settings (Figure 4). There were 17 High-High (HH) plots that collectively distributed on the west of the watershed, while 19 Low-Low (LL) plots were on the midland (along the Changhe channel). These indicated that plots with higher SOCs intensively distributed in the west of the watershed while that with lower values concentrated in the midland. From the point of altitude-related gradients, the upland had a higher stock of soil carbon while the lowland had lower values.

4. Discussion

The SOC is not only vital to the carbon cycling in the terrestrial ecosystem [23,41] but is a key element for improving the process of soil formation (supporting service) [42] and for the rejuvenation of chemical and physical soil properties at watershed [20]. Nevertheless, SOC is sensitive to the environment because it is mainly from litter, plant roots, microbial residues, soil animals and their excreta [24,43,44]. Authors paid attention to detecting the mechanism of SOC accumulation [45]. Some documented that nitrogen enrichment resulted in SOC sequestration [46]. Others argued that SOC rejuvenation could be due to soil acidification [47].
Despite the mechanism of SOC sequestration remaining to be explored, the authors agreed that land-use types dictated the sequestration of SOC [48]. This was confirmed by our findings: Grassland (21.51 Mg ha−1) and forestland (20.88 Mg ha−1) had a higher amount of soil carbon than construction (18.03 Mg ha−1) and cropland (19.27 Mg ha−1) in the Changhe Watershed. This indicated that grassland and forestland had a stronger carbon sequestration ability than other land-use types. The discrepancy of SOCs among land-use types was coupled with previous results [31] and it could be associated with several factors. Generally, much of the SOC was derived from plants and particularly their roots [49]. Grass and forest ecosystems had more net primary production (NPP) and more organic material input into soils and less human-derived disturbance, which resulted in the enrichment of SOCs [41,50]. According to Bojko and Kabala [51], the mountain pine soils had 7% of total organic carbon and grass soils had 3%. Both of them were higher than the 1.6% of SOC in arable soils. Just in contrast, active human-induced disturbance to soil layer gave rise to the mineralization of organic carbon in cropland and construction land [52,53]. It had a long history of cultivation and high cultivation rate in Changhe watershed and the “three crops, 2 years” land management also exerted high stress to soils, which resulted in the loss of SOCs. To rejuvenate soil carbon in cropland, conservation cropping management, such as no-tillage could be expected. In addition, straw was used to be burnt in the farmland after crops were harvested in the Changhe region. Thus, returning crop straw to cultivated soils could be an effective approach to elevate soil carbon sequestration and soil productivity.
Geomorphic settings directly affect biogeochemical cycles and other biological processes in the riparian ecosystem [5,51]. Authors found that soil salinity migrated from upstream to downstream within the period of 1982–2015 in Sangong River watershed [18]. Others found that greater abundance of obligate riparian taxa and increasing structural importance of shrub and tree species appeared in the downstream direction where increased moisture availability was observed [5]. In terms of the SOCs, spatial heterogeneity with the higher altitude (>920 m a.s.l.) had higher values while the areas with altitude of 740–800 m had lower values in the Changhe watershed riparian ecosystem. It was confirmed by the result of the BRT: The upland had higher stock of soil carbon while the lowland had lower values. These observations could be coupled with the previous conclusion as well: The SOCs increased with altitude gradients. Zhao et al. found that SOCs was significantly correlated with altitude at the level of p < 0.05 [31]. Similarly, Leifeld et al. suggested that SOC increased from 0.75 to 2.10 mg/g as altitude increased by 100 m [54]. Some suggested that higher elevation gave rise to lower temperature, which restrained the deformation of SOC [51,55,56]. For example, in Karkonosze Mountains, Czech Republic, the mean temperature was 7.0–8.0 °C at 400–500 m a.s.l., while it decreased to 1.3–2.0 °C at 1250–1450 m a.s.l., and the precipitation increased from 650–700 to 1400–1500 mm, accordingly. Consequently, the total organic carbon increased from 1.8% (<500 m a.s.l.) to 5.4% (>1250 m a.s.l.) [51]. Generally, geographic settings affected the distribution of SOCs in two ways: (1) Through the effect of temperature and (2) through the land-use types. Actually, land-use types were determined by geomorphic setting to some extent. As mentioned above, the forestland and grassland were the dominant land-use types at rugged terrains with higher elevation, while the cropland and construction land distributed in lowland with flat terrain.
The geomorphic characteristic in Changhe watershed resulted in another intriguing observation: SOCs increased with slope gradients [51,57]. Actually, areas with higher slope were covered with wood and grass due to the reforestation engineering that was implemented several years ago, which resulted in the observation mentioned above. In terms of the relationship between SOC and aspect, no significant difference was observed. Comparably, authors found that the aspect had different effects on the distribution of SOCs, for example, Zhao et al. found that sunny aspect stored more SOC in sloped cropland while the shady aspect had more SOCs in grassland [31]. Compared to watershed in semi-arid Loess Plateau areas that had sparse vegetation and fragmented geomorphic settings, Changhe riparian ecosystem had higher vegetation canopy (it had ~30% forest and grass land) and less soil erosion. Consequently, SOC sequestration and spatial distribution were different. For example, the SOCs of 18.03 Mg ha−1 to 21.51 Mg ha−1 in Changhe watershed was higher than that in the semi-arid Loess Plateau [58]. Specifically, just as mentioned above, watershed was an independent ecological system and it was an optimal geographic unit to observe ecological processes such as carbon cycling. To date, the spatial pattern of soil carbon in watershed was accessible. However, the detection of the transported carbon in the process of carbon cycling genuinely frustrated the authors. E et al. suggested that rainfall events played an important role in carbon cycling and 2.7 kg ha−1 year−1 carbon was observed lost from soils in Yangjuangou watershed [59]. Nevertheless, advance experiments were expected to develop to detect the process of carbon cycling in detail in watershed. Overall, altitude had a bigger influence on the distribution of SOCs than slope and aspect, which was confirmed by other studies [31]. This indicated that altitude could be a fundamental factor to estimation the spatial pattern of SOCs in the present study area.

5. Conclusions

Soil organic carbon was important to soil ecosystem function and it was affected by land use types and geographic settings in Changhe watershed riparian ecosystem. SOCs varied from 18.03 Mg ha−1 to 21.51 Mg ha−1 in Changhe watershed, among which, the grassland and forestland had higher SOCs than cropland and construction land. Spatially, SOCs differed with slope, aspect and especially the altitude. From the point of altitude-related gradients, the upland had higher values of SOC than the lowland. Overall, land-use type and terrain factors should be considered when estimating the storage of soil carbon in warm and wetter watershed. With regards to the implications for land use management, reforestation could elevate the SOC storage. No-tillage and returning crop straw to cultivated soils could be effective approaches to elevate soil carbon sequestration and soil productivity. More specifically, more advanced experiments were expected to make the carbon cycling understood at the scale of the watershed.

Author Contributions

Conceptualization, Y.Y. and X.S.; Methodology, Z.Z.; Software, Y.Y.; Validation, Y.Y., X.S. and Z.Z.; Formal Analysis, Y.Y.; Investigation, Y.Y., X.S. and Z.Z.; Writing-Original Draft Preparation, Y.Y.; Writing-Review & Editing, Y.Y., X.S. and Z.Z.; Funding Acquisition, X.S.

Acknowledgments

This study was supported by the Foundation for Public Welfare of the Ministry of Land and Resources of China (No. 20141107).

Conflicts of Interest

The authors declare no conflict of interest.

References

  1. Wang, S.D.; Chen, H.W.; Zhang, X.W.; Wang, Y.J.; Wang, L.; Zhao, J.; Mao, W.Y. Effect of climate change and human activities on hydrological factors in the Tarim River Basin. Arid Zone Res. 2006, 23, 195–202. [Google Scholar]
  2. Johnson, G.D.; Myers, W.L.; Patil, G.P.; Taillie, C. Characterizing watershed-delineated landscapes in Pennsylvania using conditional entropy profiles. Lands. Ecol. 2001, 16, 597–610. [Google Scholar] [CrossRef]
  3. Whigham, D.F.; Walker, C.M.; Maurer, J.; King, R.S.; Hauser, W.; Baird, S.; Keuskamp, J.A.; Neale, P.J. Watershed influences on the structure and function of riparian wetlands associated with headwater streams-Kenai Peninsula, Alaska. Sci. Total Environ. 2017, 599–600, 124–134. [Google Scholar] [CrossRef] [PubMed]
  4. Tabacchi, E.; Lambs, L.; Guilloy, H.; Planty-Tabacchi, A.; Muller, E.; Decamps, H. Impacts of riparian vegetation on hydrological processes. Hydrol. Process. 2000, 14, 2959–2976. [Google Scholar] [CrossRef]
  5. Shaw, J.R.; Cooper, D.J. Linkages among watersheds, stream reaches, and riparian vegetation in dryland ephemeral stream networks. Hydrol. Process. 2008, 350, 68–82. [Google Scholar] [CrossRef]
  6. Worqlul, A.W.; Ayana, E.K.; Yen, H.; Jeong, J.; MacAlister, C.; Taylor, R.; Gerik, T.J.; Steenhuis, T.S. Evaluating hydrologic responses to soil characteristics using SWAT model in a paired-watersheds in the Upper Blue Nile Basin. Catena 2018, 163, 332–341. [Google Scholar] [CrossRef]
  7. Walter, M.O. Transmission losses in arid region. J. Hydraul. Eng. 1990, 116, 129–138. [Google Scholar] [CrossRef]
  8. Sorman, A.U.; Abdulrazzak, M.J.; Morel-Seytoux, H.J. Groundwater recharge estimation from ephemeral streams. Case study: Wadi Tabalah, Saudi Arabia. Hydrol. Process. 1997, 11, 1607–1619. [Google Scholar] [CrossRef]
  9. Omdi, F.E.; Daoudi, L.; Fagel, N. Origin and distribution of clay minerals of soils in semi-arid zones: Example of Ksob watershed (Western High Atlas, Morocco). Appl. Clay Sci. 2018, 163, 81–91. [Google Scholar] [CrossRef]
  10. Zawadzki, J.; Kędzior, M. Soil moisture variability over Odra watershed: Comparison between SMOS and GLDAS data. Int. J. Appl. Earth OBS 2016, 45, 110–124. [Google Scholar] [CrossRef]
  11. Quesada, C.A.; Lloyd, J.; Schwarz, M.; Patino, S.; Baker, T.R.; Czimczik, C.; Fyllas, N.M.; Martinelli, L.; Nardoto, G.B.; Schmerler, J.; et al. Variations in chemical and physical properties of Amazon forest soils in relation to their genesis. Biogeosciences 2010, 7, 1515–1541. [Google Scholar] [CrossRef] [Green Version]
  12. Zhang, S.H.; Fan, W.W.; Li, Y.Q.; Li, Y.J. The influence of changes in land use and landscape patterns on soil erosion in a watershed. Sci. Total Environ. 2017, 574, 34–45. [Google Scholar] [CrossRef] [PubMed]
  13. Cambardella, C.A.; Moorman, T.B.; Andrews, S.S.; Karlen, D.L. Watershed-scale assessment of soil quality in the loess hills of southwest Iowa. Soil Till. Res. 2004, 78, 237–247. [Google Scholar] [CrossRef]
  14. Abiy, A.Z.; Melesse, A.M. Evaluation of watershed scale changes in groundwater and soil moisture storage with the application of GRACE satellite imagery data. Catena 2017, 153, 50–60. [Google Scholar] [CrossRef]
  15. Becker, R.; Gebremichael, M.; Märker, M. Impact of soil surface and subsurface properties on soil saturated hydraulic conductivity in the semi-arid Walnut Gulch Experimental Watershed, Arizona, USA. Geoderma 2018, 322, 112–120. [Google Scholar] [CrossRef]
  16. Chen, L.F.; He, Z.B.; Du, J.; Yang, J.J.; Zhu, X. Patterns and environmental controls of soil organic carbon and total nitrogen in alpine ecosystems of northwestern China. Catena 2016, 137, 37–43. [Google Scholar] [CrossRef]
  17. Hu, W.; Chau, H.W.; Qiu, W.; Si, B. Environmental controls on the spatial variability of soil water dynamics in a small watershed. J. Hydrol. 2017, 551, 47–55. [Google Scholar] [CrossRef]
  18. Wang, Y.G.; Deng, C.Y.; Liu, Y.; Niu, Z.R.; Li, Y. Identifying change in spatial accumulation of soil salinity in an inland river watershed, China. Sci. Total Environ. 2018, 621, 177–185. [Google Scholar] [CrossRef] [PubMed]
  19. Wei, L.; Zhou, H.; Link, T.E.; Kavanagh, K.L.; Hubbart, J.A.; Du, E.; Hudak, A.T.; Marshall, J.D. Forest productivity varies with soil moisture more than temperature in a small montane watershed. Agr. For. Meteorol. 2018, 259, 211–221. [Google Scholar] [CrossRef]
  20. Franzluebbers, A.J. Will we allow soil carbon to feed our needs? Carbon Manag. 2010, 1, 237–251. [Google Scholar] [CrossRef]
  21. Lorenz, K.; Lal, R. Biogeochemical C and N cycles in urban soils. Environ. Int. 2009, 35, 1–8. [Google Scholar] [CrossRef] [PubMed]
  22. Bellamy, P.H.; Loveland, P.J.; Bradley, R.I.; Lark, R.M.; Kirk, G.J.D. Carbon losses from all soils across England and Wales. Nature 2005, 437, 245–248. [Google Scholar] [CrossRef] [PubMed] [Green Version]
  23. Beer, C.; Reichstein, M.; Tomelleri, E.; Ciais, P.; Jung, M.; Carvalhais, N.; Rodenbeck, C.; Arain, M.A.; Baldocchi, D.; Bonan, G.B.; et al. Terrestrial gross carbon dioxide uptake: global distribution and covariation with climate. Science 2010, 329, 834–838. [Google Scholar] [CrossRef] [PubMed]
  24. Stockmann, U.; Adams, M.A.; Crawford, J.W.; Field, D.J.; Henakaarchchi, N.; Jenkins, M.; Minasny, B.; McBratney, A.B.; de Courcelles, V.R.; Singh, K.; et al. The knowns, known unknowns and unknowns of sequestration of soil organic carbon. Agric. Ecosyst. Environ. 2013, 164, 80–99. [Google Scholar] [CrossRef]
  25. Bhattacharyya, R.; Kundu, S.; Srivastva, A.K.; Gupta, H.S.; Prakash, V.; Bhatt, J.C. Long term fertilization effects on soil organic carbon pools in a sandy loam soil of the Indian sub-Himalayas. Plant Soil 2011, 341, 109–124. [Google Scholar] [CrossRef]
  26. Frouz, J.; Pizl, V.; Cienciala, E.; Kalcik, J. Carbon storage in post-mining forest soil, the role of tree biomass and soil bioturbation. Biogeochemistry 2009, 94, 111–121. [Google Scholar] [CrossRef]
  27. Frouz., J.; Spaldonova, A.; Fricova, K.; Bartuska, M. The effect of earthworms (Lumbricus rubellus) and simulated tillage on soil organic carbon in a long-term microcosm experiment. Soil Biol. Biochem. 2014, 78, 58–64. [Google Scholar] [CrossRef]
  28. Conforti, M.; Lucà, F.; Scarciglia, F.; Matteucci, G.; Buttafuoco, G. Soil carbon stock in relation to soil properties and landscape position in a forest ecosystem of southern Italy (Calabria region). Catena 2016, 144, 23–33. [Google Scholar] [CrossRef]
  29. Deng, L.; Wang, G.L.; Liu, G.B.; Shangguan, Z.P. Effects of age and land-use changes on soil carbon and nitrogen sequestrations following cropland abandonment on the Loess Plateau, China. Ecol. Eng. 2016, 90, 105–112. [Google Scholar] [CrossRef]
  30. Paustian, K.; Six, J.; Elliott, E.T.; Hunt, H.W. Management options for reducing CO2 emissions from agricultural soils. Biogeochemistry 2000, 48, 147–163. [Google Scholar] [CrossRef]
  31. Zhao, B.H.; Li, Z.B.; Li, P.; Xu, G.C.; Gao, H.D.; Cheng, Y.T.; Chang, E.H.; Yuan, S.L.; Zhang, Y.; Feng, Z.H. Spatial distribution of soil organic carbon and its influencing factors under the condition of ecological construction in a hilly-gully watershed of the Loess Plateau, China. Geoderma 2017, 296, 10–17. [Google Scholar] [CrossRef]
  32. Xin, Z.B.; Qin, Y.B.; Yu, X.X. Spatial variability in soil organic carbon and its influencing factors in a hilly watershed of the Loess Plateau, China. Catena 2016, 137, 660–669. [Google Scholar] [CrossRef]
  33. Wang, Y.F.; Fu, B.J.; Lü, Y.H.; Chen, L.D. Effects of vegetation restoration on soil organic carbon sequestration at multiple scales in semi-arid Loess Plateau, China. Catena 2011, 85, 58–66. [Google Scholar] [CrossRef] [Green Version]
  34. Zhang, C.; Liu, G.B.; Xue, S.; Sun, C.L. Soil organic carbon and total nitrogen storage as affected by land use in a small watershed of the Loess Plateau, China. Eur. J. Soil Biol. 2013, 54, 16–24. [Google Scholar] [CrossRef]
  35. Nelson, D.W.; Sommers, L.E. Methods of Soil Analysis, 2nd ed.; American Society of Agronomy: Madison, WI, USA, 1982; pp. 539–577. [Google Scholar]
  36. Chinese Academy of Sciences. Determination of Soil Physical Properties; Science Press: Beijing, China, 1978. (In Chinese) [Google Scholar]
  37. Liu, G.S. Soil Physical and Chemical Analysis and Description of Soil Profiles; Chinese Standard Press: Beijing, China, 1996. [Google Scholar]
  38. Olsen, S.R.; Sommers, L.E. Methods of Soil Analysis. American Society of Agronomy Madison, 2nd ed.; American Society of Agronomy: Madison, WI, USA, 1982; pp. 403–427. [Google Scholar]
  39. Li, X.Z.; Zhao, Z.Q.; Yuan, Y.; Wang, X.; Li, X.Y. Heavy metal accumulation and its spatial distribution in agricultural soils: Evidence from Hunan province, China. RSC Adv. 2018, 8, 10665–10672. [Google Scholar] [CrossRef]
  40. Elith, J.; Leathwick, J.R.; Hastie, T. A working guide to boosted regression trees. J. Anim. Ecol. 2008, 77, 802–813. [Google Scholar] [CrossRef] [PubMed] [Green Version]
  41. Ma, J.; Bu, R.C.; Liu, M.; Chang, Y.; Qin, Q.; Hu, Y.M. Ecosystem carbon storage distribution between plant and soil in different forest types in Northeastern China. Ecol. Eng. 2015, 81, 353–362. [Google Scholar] [CrossRef]
  42. Gregory, A.S.; Ritz, K.; McGrath, S.P.; Quinton, J.N.; Goulding, K.W.T.; Jones, R.J.A.; Harris, J.A.; Bol, R.; Wallace, P.; Pilgrim, E.S.; et al. A review of the impacts of degradation threats on soil properties in the UK. Soil Use Manag. 2015, 31, 1–15. [Google Scholar] [CrossRef] [PubMed] [Green Version]
  43. Gutiérrez-Girón, A.; Díaz-Pinés, E.; Rubio, A.; Gavilán, R.G. Both altitude and vegetation affect temperature sensitivity of soil organic matter decomposition in Mediterranean high mountain soils. Geoderma 2015, 237–238, 1–8. [Google Scholar] [CrossRef]
  44. Sartori, F.; Lal, R.; Ebinger, M.H.; Eaton, J.A. Changes in soil carbon and nutrient pools along a chronosequence of poplar plantations in the Columbia Plateau, Oregon, USA. Agric. Ecosyst. Environ. 2007, 122, 325–339. [Google Scholar] [CrossRef]
  45. Wang, Y.; Wang, H.; He, J.S.; Feng, X.J. Iron-mediated soil carbon response to water-table decline in an alpine wetland. Nat. Commun. 2017, 8, 15972. [Google Scholar] [CrossRef] [PubMed] [Green Version]
  46. Ye, C.L.; Chen, D.; Hall, S.J.; Pan, S.; Yan, X.B.; Bai, T.S.; Guo, H.; Zhang, Y.; Bai, Y.F.; Hu, S.J. Reconciling multiple impacts of nitrogen enrichment on soil carbon: plant, microbial and geochemical controls. Ecol. Lett. 2018, 21, 1162–1173. [Google Scholar] [CrossRef] [PubMed]
  47. Huang, W.J.; Liu, J.X.; Zhou, G.Y.; Zhang, D.; Deng, Q. Effects of precipitation on soil acid phosphatase activity in three successional forests in Southern China. Biogeosciences 2011, 8, 1901–1910. [Google Scholar] [CrossRef]
  48. Shimoda, S.; Koyanagi, T.F. Land Use Alters the Plant-Derived Carbon and Nitrogen Pools in Terraced Rice Paddies in a Mountain Village. Sustainability 2017, 9. [Google Scholar] [CrossRef]
  49. Shukla, M.K.; Lal, R. Temporal changes in soil organic carbon concentration and stocks in reclaimed minesoils of southeastern Ohio. Soil Sci. 2005, 170, 1013–1021. [Google Scholar] [CrossRef]
  50. Asner, G.P.; Archer, S.; Hughes, R.F.; Ansley, R.J.; Wessman, C.A. Net changes in regional woody vegetation cover and carbon storage in Texas Drylands, 1937–1999. Glob. Chang. Biol. 2003, 9, 316–335. [Google Scholar] [CrossRef]
  51. Bojko, O.; Kabala, C. Transformation of physicochemical soil properties along a mountain slope due to land management and climate changes—A case study from the Karkonosze Mountains, SW Poland. Catena 2016, 140, 43–54. [Google Scholar] [CrossRef]
  52. Bayer, C.; Gomes, J.; Vieira, F.C.B.; Zanatta, J.A.; Piccolo, M.D.; Dieckow, J. Methane emission from soil under long-term no-till cropping systems. Soil Till. Res. 2012, 124, 1–7. [Google Scholar] [CrossRef]
  53. Tian, K.; Zhao, Y.C.; Xu, X.H.; Hai, N.; Huang, B.A.; Deng, W.J. Effects of long-term fertilization and residue management on soil organic carbon changes in paddy soils of China: A meta-analysis. Agric. Ecosyst. Environ. 2015, 204, 40–50. [Google Scholar] [CrossRef]
  54. Leifeld, J.; Bassin, S.; Fuhrer, J. Carbon stocks in Swiss agricultural soils predicted by land-use, soil characteristics, and altitude. Agric. Ecosyst. Environ. 2005, 105, 255–266. [Google Scholar] [CrossRef]
  55. Johnson, K.D.; Harden, J.; McGuire, A.D.; Bliss, N.B.; Bockheim, J.G.; Clark, M.; Nettleton-Hollingsworth, T.; Jorgenson, M.T.; Kane, E.S.; Mack, M.; et al. Soil carbon distribution in Alaska in relation to soil-forming factors. Geoderma 2011, 167–168, 71–84. [Google Scholar] [CrossRef]
  56. Lesovaya, S.N.; Goryachkin, S.V.; Polekhovskii, Y.S. Soil formation and weathering on ultramafic rocks in the mountainous tundra of the Rai-Iz massif, Polar Urals. Eurasian Soil Sci. 2012, 45, 33–44. [Google Scholar] [CrossRef]
  57. Dahlgren, R.A.; Boettinger, J.L.; Huntington, G.L.; Amundson, R.G. Soil development along an elevational transect in the western Sierra Nevada, California. Geoderma 1997, 78, 207–236. [Google Scholar] [CrossRef]
  58. Chang, R.T.; Fu, B.J.; Liu, G.H.; Liu, S.G. Soil Carbon Sequestration Potential for “Grain for Green” Project in Loess Plateau, China. Environ. Manag. 2011, 48, 1158–1172. [Google Scholar] [CrossRef] [PubMed]
  59. Wang, Y.F.; Gao, Y.; Chen, L.D.; Chen, S.B.; Chen, W.L. Characteristics of carbon transportation under rainfall events and associated carbon loss evaluation in Loess Plateau, China: A case study of Yangjuangou Dam Watershed. Environ. Sci. 2017, 38, 3264–3272. [Google Scholar] [CrossRef]
Figure 1. Location and landscape of the Changhe Watershed. (a) Geographic location of Changhe watershed; (b) elevation of the study area; (c) land-use types and soil sampling sites in Changhe Watershed; (d,e) landscape of the study area.
Sustainability 10 03490 g001
Figure 2. SOCs varied with (a) elevation, (b) slope and (c) aspect gradients in the Changhe riparian ecosystem.
Sustainability 10 03490 g002
Figure 3. Influence of the elevation, slope and aspect to SOCs via BRT in the Changhe riparian ecosystem.
Sustainability 10 03490 g003
Figure 4. The distribution of SOCs in the Changhe watershed. In the map, plots marked with High-High (HH) and Low-Low (LL) indicates the plots were where higher or lower SOCs was clustered.
Sustainability 10 03490 g004
Table 1. Summary statistics for soil physicochemical in the Changhe Watershed.
Land Use TypeAK
(mg kg−1)
AP
(mg kg−1)
AN
(g kg−1)
PHBD
(Mg m−3)
Field Water Capacity (%)Clay (%)
Cropland44.99 ± 1.15a35.91 ± 2.23a0.78 ± 0.04a8.00 ± 0.03a1.30 ± 0.01a16.15 ± 0.00a28.75 ± 0.01a
Forest land40.92 ± 5.05a33.71 ± 4.66a0.72 ± 0.11a8.00 ± 0.19a1.27 ± 0.04a16.02 ± 0.02a23.15 ± 0.05b
Grassland37.84 ± 2.04b29.01 ± 4.11a0.78 ± 0.06a8.02 ± 0.08a1.35 ± 0.03a16.59 ± 0.01a27.46 ± 0.02a
Construction land44.23 ± 2.31a27.12 ± 2.22a0.72 ± 0.04a8.06 ± 0.04a1.31 ± 0.02a16.15 ± 0.00a31.45 ± 0.03a
Values are in the form of: Means ± Standard Errors (SE). Values with significant differences (ANOVA, LSD post-hoc test, p < 0.05) are distinguished by the different letters.
Table 2. Summary statistics of SOCs in the Changhe riparian ecosystem. Values with significant differences (ANOVA, LSD post-hoc test, p < 0.05) are distinguished by different letters.
Land Use TypeMean (Mg ha−1)Standard ErrorMin
(Mg ha−1)
Max
(Mg ha−1)
SkewnessKurtosisk—s
(p)
CV
(%)
Cropland19.27b0.498.6729.83−0.200.590.84721.43
Grassland21.51a0.9715.1328.360.23−0.560.95617.48
Forestland20.88ab1.8617.0725.580.54−1.120.93717.86
Construction land18.03b1.1513.3527.020.76−0.400.99624.84
Table 3. Moran′s I Index of soil carbon in the Changhe watershed.
CountMoran’s IZ (I)pSpatial Pattern
1030.263.55<0.01clustered

