1. Introduction
Currently, green rating systems are widely accepted measures of building sustainability [
1,
2,
3,
4]. In this respect, the most well-known rating systems are the following: the Green Star in Australia [
5], the Assessment System for Built Environment Efficiency (CASBEE) in Japan [
6], the Building Research Establishment Environmental Assessment Method [BREEAM] in the United Kingdom [
7], the Deutsche Gesellschaft für Nachhaltiges Bauen DGNB sustainable building certification system in Germany [
8], and Leadership in Energy and Environmental Design (LEED) in the United States [
9], in addition to others. The systems are constantly going through further improvement toward better approaching the triple bottom line of sustainability, which includes environmental sustainability, social sustainability, and economic sustainability [
1,
4,
10].
Castellano et al. [
1] analyzed the applied triple bottom line of sustainability in the Sustainable Building Tool (SBTool), BREEAM, LEED, and BREEAM ESpaña (ES). The authors reported that LEED and BREEAM primarily evaluated environmental sustainability (83% and 86%, respectively), thereby ignoring economic sustainability (1% and 0%, respectively) and social sustainability (16% and 14%, respectively). Better results were reported for SBTool, in which 40%, 30%, and 30% of credits are allocated to environmental sustainability, social sustainability, and economic sustainability, respectively [
1]. As a result, Castellano et al. [
1] suggested a new tool for home owners that gives equal attention (33.3%) to each issue of sustainability; environmental sustainability, social sustainability, and economic sustainability. Illankoon et al. [
10] analyzed the applied triple bottom line of sustainability in eight international green building rating tools (LEED, BREEAM, BEAM Plus, Green Mark, CASBEE, Green Building Index (GBI), Indian Green Building Council Rating (IGBC), and Green Star) and reported that 25–79%, 15–30%, and 0–2% of credits are devoted to environmental sustainability, social sustainability, and economic sustainability, respectively. Diaz-Sarachaga et al. [
4] evaluated urban rating schemes, both LEED for Neighborhood Development (LEED ND) and Envision, and concluded that each scheme emphasizes environmental sustainability and ignores social sustainability and economic sustainability considerations.
The other researchers [
2,
3,
11] also performed comparative analyses of the green rating systems and suggested different improvements to the green systems toward further development of building sustainability. In particular, Pushkar and Shaviv [
11] analyzed the Israeli Sustainable Standard (SI5281), BREEAM, LEED, and SBTool and concluded that SI5281 focuses on the building design (over the extended lifetime), while BREEAM, LEED, and Green Star focus on the system design (over a shorter lifetime), whereas SBTool devotes the same importance to both the building and system designs. Bernardi et al. [
2] analyzed six rating systems (BREEAM, CASBEE, DGNB, HQETM, LEED, and SBTool) and reported that resistance against natural disasters, earthquake prevention, and olfactory comfort are the categories that should be improved in the future versions of the schemes. Mattoni et al. [
3] analyzed CASBEE, Green Star, BREEAM, LEED, and Istituto per l’innovazione e Trasparenza degli Appalti e la Compatibilità Ambientale (ITACA) and suggested to introduce several new topics in these green schemes, such as the effect of a building on outdoor comfort and the effects of other surrounding buildings on the energy performance of an analyzed building.
Despite the aforementioned green rating system analyses, which are important for further systems’ improvements, empirical studies of projects that were certified under green rating schemes present significant interest [
12,
13,
14,
15,
16,
17]. These studies aimed to analyze in situ certified projects reveal on-practice trends (practitioner preferences) in achieving schemes’. In this way, high-performance and low-performance categories are disclosed, allowing for schemes’ developments to correct low-performance issues in schemes’ further versions [
15]. Therefore, this study is an empirical evaluation of green certified projects.
The use of a green building rating system assumes an adaptation towards the local climate and geography, resource availability/scarcity, technology developments, and cultural and demographic issues [
18,
19,
20,
21]. As a result, the green rating systems were initially devoted to certain countries, they have also been applied internationally. On the other hand, several countries use both local and international green building rating systems in parallel. For example, Awadh [
22] compared the two internationally used LEED and BREEAM systems with two local systems, the Estidama Pearl Rating System (established by Abu Dhabi Urban Planning Council) and the Global Sustainability Assessment System (GSAS) (established by the Gulf Organization of Research and Development in Qatar) for the Gulf region. It was concluded that “BREEAM, GSAS, and Estidama systems give the highest weighting to the Energy category, while LEED prioritizes the Indoor Environmental Quality category … On the other hand, Estidama is the easiest to earn high number of points for water reduction, while LEED and BREEAM follow. Estidama and LEED interior water minimum reduction requirement is more stringent than BREEAM’s”. However, Komurlu et al. [
23] revealed that India primarily uses the U.S. standards, Abu Dhabi mostly uses local standards, and Turkey uses LEED and local standards.
BREEAM and LEED are the most well-known rating schemes in Europe [
24]. According to Gluszak [
24], BREEAM was recognized to have a dominant position in Europe (especially in the United Kingdom, Spain, Lithuania, Slovenia, France, Belgium, Netherlands, and Poland). However, LEED also has a strong position in Europe (especially in Turkey, Spain, Italy, Finland, and Sweden). To study LEED certified green buildings in Europe, the analyzed European countries should be from the same regions [
25]. Consequently, Turkey, Spain, and Italy are the focus of this study because these countries are related to the same region (i.e., the Mediterranean basin). Based on available statistical data as of July 2018, the number of LEED certified projects in Turkey was 426, while it was 245 in Spain and 219 in Italy [
26], whereas the number of BREEAM certified projects in Turkey was 41, while it was 468 in Spain and 100 in Italy [
27]. Therefore, the analysis of LEED certificated projects was preferred in this study because of the approximately equal and large amount of the projects certified under the LEED system in the three countries.
LEED was established by the U.S. Green Building Council (USGBC) in 1998. LEED certification is available under several subsystems, such as LEED for New Construction and Major Renovations (LEED—NC), Existing Buildings: Operations & Maintenance (LEED—EB), Commercial Interiors (LEED—CI), Core and Shell Development (LEED— C&S), Schools, Retail, Homes, Neighborhood Development, and Healthcare. Four levels of LEED certification can be achieved: Certified (40–49 points), Silver (50–59 points), Gold (60–79 points), and Platinum (80 points and above). These points can be achieved under five basic categories: Sustainable Sites (SS), Water Efficiency (WE), Energy and Atmosphere (EA), Materials and Resources (MR), and Indoor Environmental Quality (EQ). In addition, LEED has an Innovation and Design Process (ID) category to encourage any green building innovation issue that is not mentioned under the five basic categories. Moreover, to allow LEED some adaptability for different geographic locations, a Regional Priority (RP) category was introduced in LEED 2009 [
28,
29].
These RP points are supposed to take country-specific climate conditions and natural resource availability into account [
21]. Thus, the four RP bonus points are aimed at encouraging design teams to give more attention to local regional priority energy and environmental problems. However, the issue of LEED application along with the correctness of RP points suggested by the USGBC in foreign countries has continued to provoke many discussions in the literature.
Suzer [
20] performed a qualitative analysis of RP credits that were suggested by the USGBC for Canada, Turkey, China, and Egypt, which revealed that although Turkey, for example, is a country with high water stress, no water-related RP credits were suggested in the LEED—NC 2009. For China, a country with a high population density, only one city-relevant RP credit was suggested in LEED—NC 2009. In addition, other inconsistencies in RP credits were noted by the author for Canada and Egypt. Based on those four countries, Suzer [
20] concluded that the current RP credits do not reflect the actual environmental problems of the international projects.
Wu et al. [
21] analyzed LEED—NC 2009 applications alongside the correctness of RP points suggested by USGBC for projects in China, Turkey, and Brazil. Frequency analyses of the achievements of RP points (e.g., percentage of achieved RP credits per all studied projects) in those three countries were reported by the authors. According to those analyses, strictly unbalanced achievements in RP credits were confirmed for China and Brazil. For example [
21], the most accepted RP credits (91.8% and 72.4%, respectively) are China Water Efficient Landscaping (WEc1) and Optimize Energy Performance (EAc1), whereas Quantity Control in Stormwater Design (SSc6.1) is the most unpopular RP credit (only 6.5%). The other RP credits were found to be credits of moderate popularity (Innovative Wastewater Technologies (WEc2)—55.9%, Measurement and Verification (EAc5)—41.8%, and Enhanced Commissioning (EAc3)—29.4%). This RP point problem was the worst for Turkey because any of its RP credits could be determined as being the most accepted [
21]. In particular, Heat Island Effect—Roof (SSc7.2), Thermal Comfort—Verification (EQc7.2), Stormwater Design—Quantity Control (SSc6.1), and On-site Renewable Energy (EAc2) were defined as credits with moderate popularity (41.9%, 29.1%, 22.1, and 18.6%, respectively), whereas Construction Waste Management (MRc2) and Building Reuse—Maintain Interior Nonstructural Elements (MRc1.2) were the most unpopular RP credits (1.2% and 0%, respectively) [
21]. Based on those findings, Wu et al. [
21] concluded that the RP credits in LEED-NCv3 do not exactly reflect the regional green building priorities.
However, the findings of Wu et al. [
21] were based on only LEED—NC 2009 certified projects in three countries that were under completely different environmental conditions. To perform a further verification of international LEED applications, an additional analysis that analyzes several countries within the same environmental conditions certified under different LEED systems is required. Thus, as mentioned earlier, in this study, we focus on the issue of LEED applications in Turkey, Spain, and Italy. In particular, projects certified under two completely different systems, LEED—CI 2009 and LEED—C&S 2009, in the Mediterranean basin of Turkey, Spain, and Italy, were considered (the reasons for the consideration of LEED 2009 (version 3), one version before the most recent LEED version 4, are explained below in
Section 2.2).
The question guiding this study is the following: how similarly or differently do certified projects handle international LEED system applications in the Mediterranean basin? This study can aid in understanding the current Turkey, Spain, and Italy certification strategies and the appropriateness of their RP credits (suggested by USGBC). This may help LEED experts engage in further developing improvements to subsequent versions of LEED schemes by suggesting (i) more applicable basic LEED categories and (ii) corrected RP credits for Turkey, Spain, and Italy.
We focused only on the LEED Gold certified projects in this study. It should be noted that studying LEED against other rating systems is non-applicable for empirical studies that observe certified projects with a sufficient number of LEED certified projects, which is impractical because certifying the same project under several certification systems costs additional money.
The rest of the paper is structured as follows:
Section 2 contains materials and methods,
Section 3 contains the results,
Section 4 contains the discussion,
Section 5 contains the conclusions,
Section 6 contains the limitations, and
Section 7 contains the future research.
2. Materials and Methods
2.1. Methodology Flowchart of the Present Study
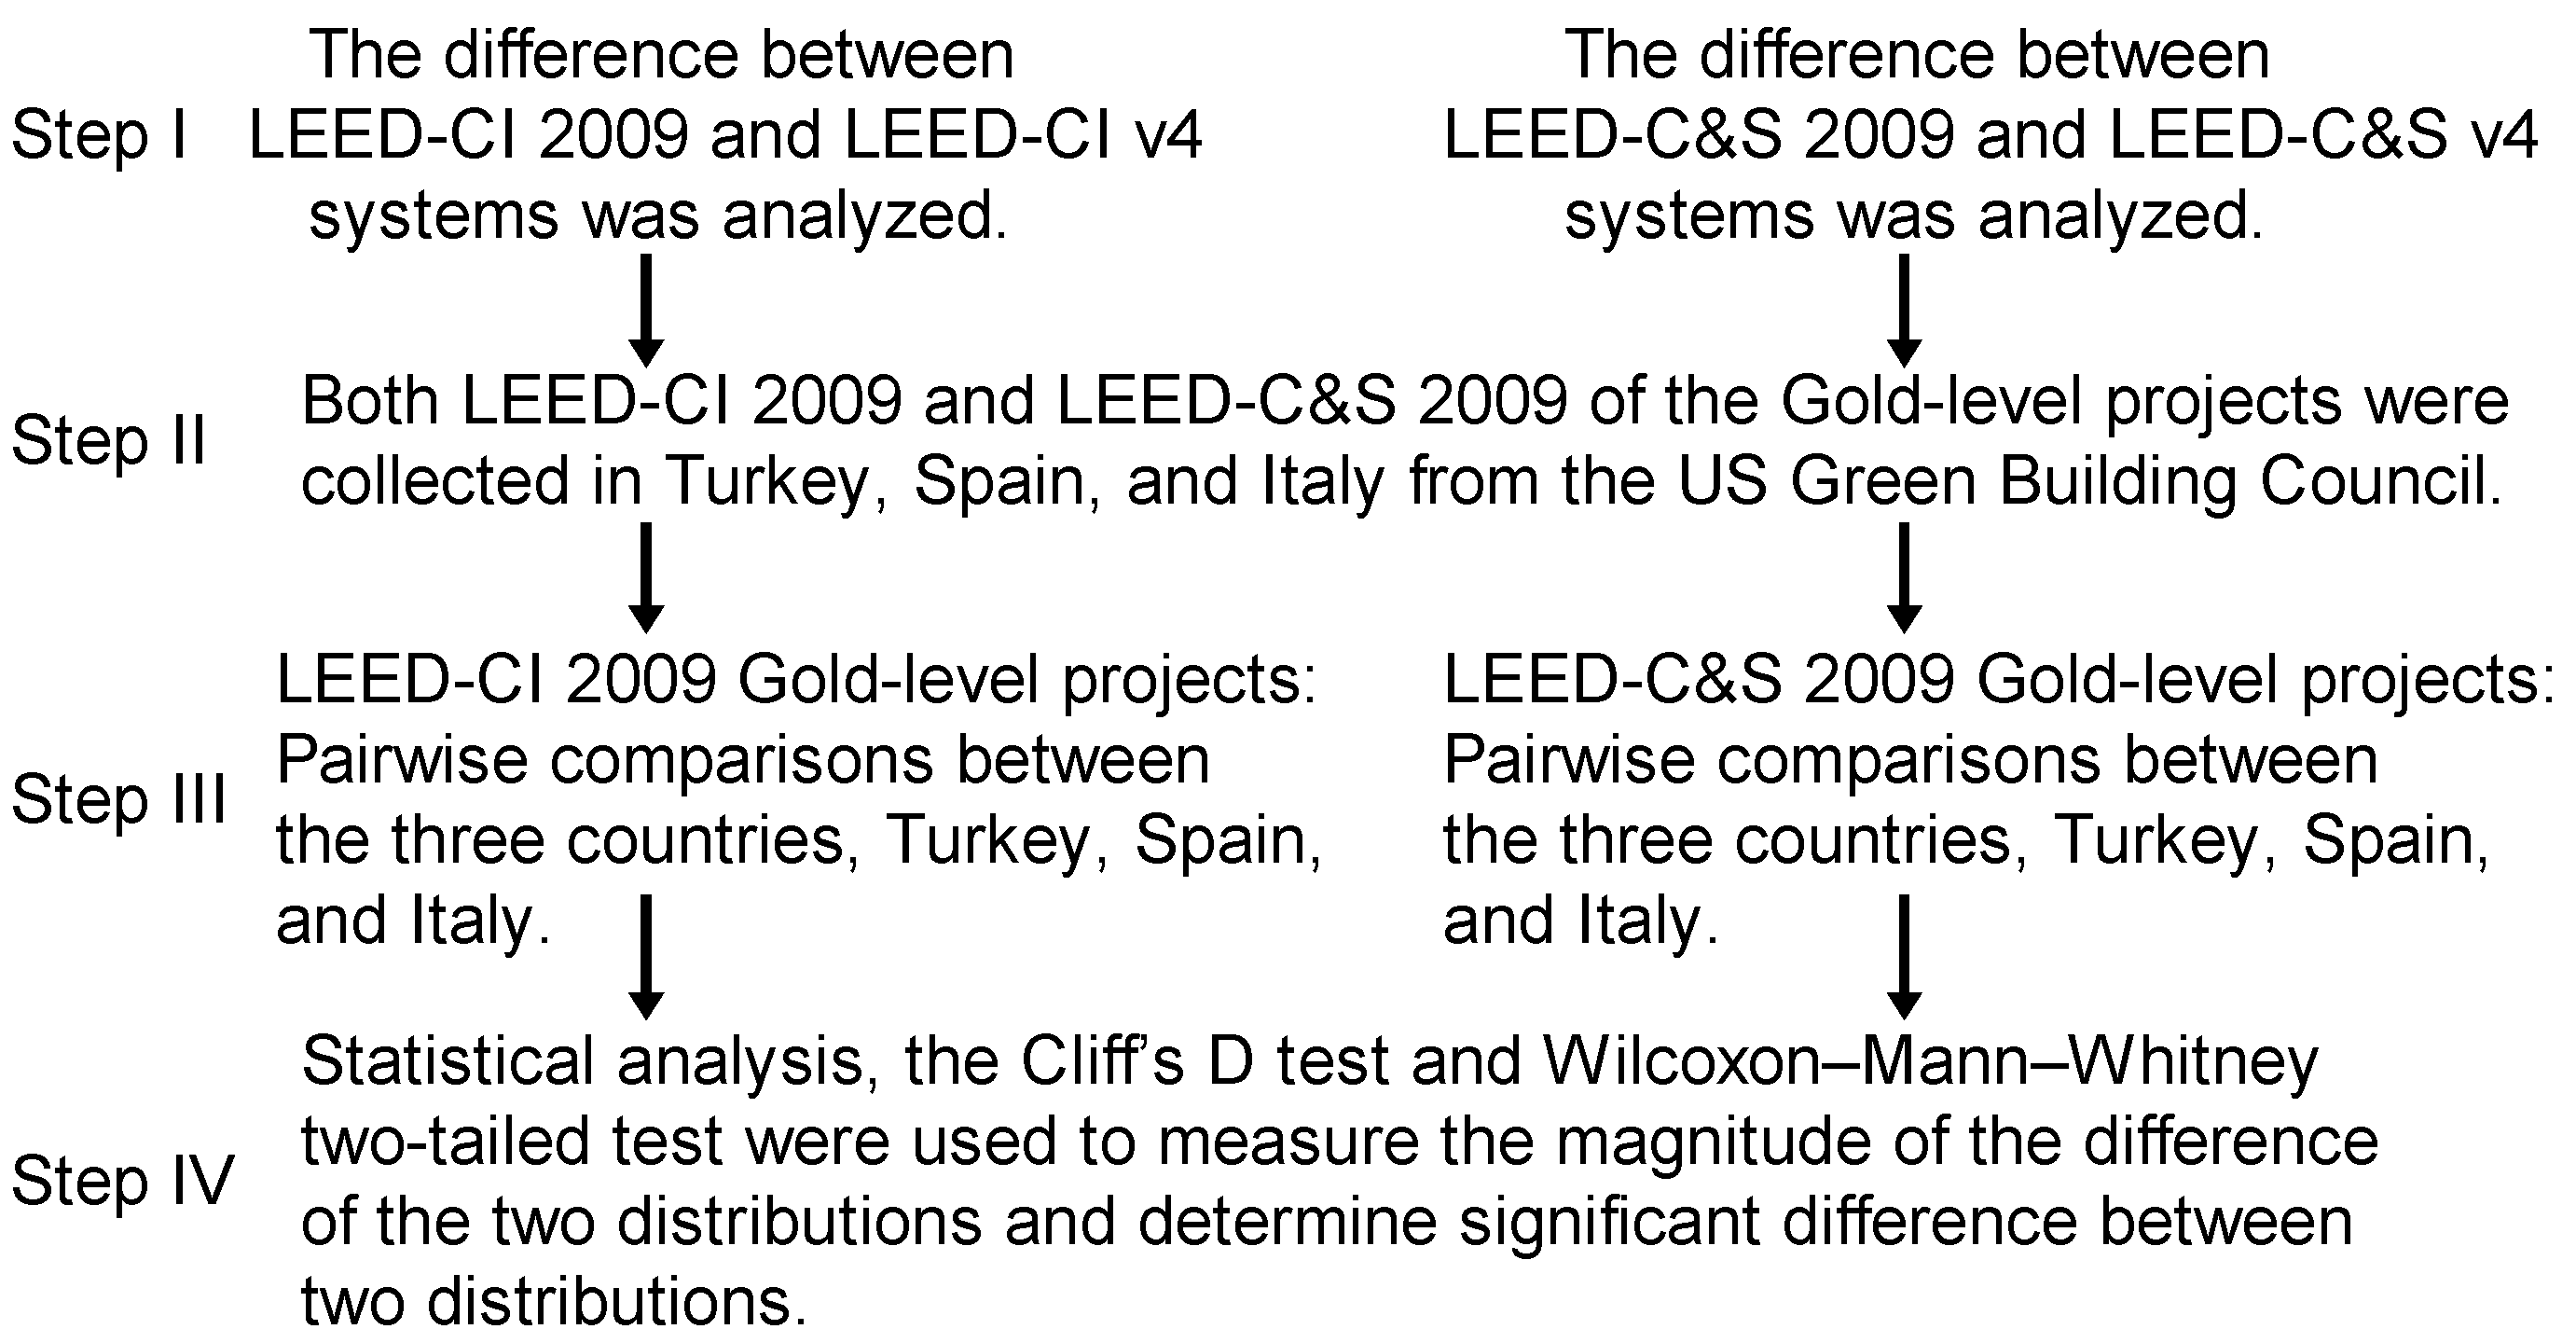
Figure 1 depicts four top-down steps of the applied methodology. The first step is a comparative analysis between version 2009 and version 4 for two different LEED schemes, LEED—CI, and LEED—C&S. The second step is the collection of Gold-level certificated projects for the two LEED schemes and for each of three countries (Turkey, Spain, and Italy), which are located in the Mediterranean basin. The third step has a nonparametric statistical analysis of pairwise comparisons between the three countries for each of the two LEED schemes. Because the LEED project data are related to an ordinal scale. The fourth step contains two nonparametric statistical tests, from which the magnitude and significant difference between the two distributions can be determined.
Based on Hurlbert’s terminology [
30] (p. 652), the consistent implementation of these four steps can be defined as a single-unit design structure [
30], in which all LEED Gold certified projects belong to the same Mediterranean basin. In this context, if two unpaired groups containing the LEED Gold certified projects should be statistically compared, then the nonparametric Cliff’s δ test and the Wilcoxon–Mann–Whitney (WMW) test should be used.
2.2. The LEED—CI 2009 vs. LEED—CIv4 and the LEED—C&S 2009 vs. LEED—C&Sv4: Certified Projects and Rating Schemes
In this empirical research, the focus was on LEED 2009 (version 3), one version before the most recent LEED version 4. This focus was chosen because (i) an insufficient sample size of LEEDv4 projects certified in Turkey, Spain, and Italy for both CI and C&S systems was revealed in the USGBC project site; and (ii) the two LEED versions, 3 and 4, in the CI and C&S schemes, still have more similarities than differences.
- (i).
LEED—CI 2009 vs. LEED—CIv4 and the LEED—C&S 2009 vs. LEED—C&Sv4: certified projects. As of August 2018, for LEED—CIv4 certification, Turkey has one Gold certified project and two projects with a “Certification in progress” status; Spain and Italy have zero certified projects in any status. Considering LEED—C&Sv4 certification, Turkey has three certified projects with a “Certification in progress” status; Spain has one Gold certified project, one Silver certified project, and one certified project with a “Certification in progress” status; and Italy has zero certified projects. Consequently, a statistical analysis using significance tests cannot be conducted because of the extremely (i.e., sample sizes,
n < 4) low number of projects in the two rating systems (CI and C&S). In contrast, a sufficient sample size of LEED 2009 projects certified in Turkey, Spain, and Italy for both CI and C&S systems does exist according to the USGBC project site (the exact numbers of the projects are described in
Section 2.3).
- (ii).
The LEED—CI 2009 vs. LEED—CIv4 and the LEED—C&S 2009 vs. LEED—C&Sv4: rating schemes. The LEED—CI 2009 versus LEED—CIv4 rating schemes are shown in
Table 1. The total number of points is the same (110 pts) and the number of points in each category is very similar. The SS category (in the LEED—CI 2009) in the LEED—CIv4 was relocated under the Location and Transportation (LT) category. In the LEED—CI 2009, the SS category includes site selection; developing density and community connectivity; and alternative transportation with public access, bicycle storage, and parking. In the LEED—CIv4, the LT category includes LEED neighborhood development location; surrounding density and diverse uses; and alternative transportation with access to quality transit, bicycle facilities, and reduced parking footprint. In fact, the evaluation of SS issues (LEED—CI 2009) is very similar to the evaluation of LT issues (LEED—CIv4).
In the WE category, both the LEED—CI 2009 and LEED—CIv4 require indoor water reduction, concerning the use of high-efficiency water closets and urinals, using alternative rainwater, stormwater sources of water, and the installation of a water consumption metering system.
In the EA category, the issues of the LEED—CI 2009, such as energy optimization, enhanced commissioning, and green energy production, are still relevant in the LEED—CIv4. The most important energy optimization credit has almost the same weight in both versions: 22 pts of the total 37 pts in the LEED—CI 2009 and 25 pts of the total 38 pts in the LEED—CIv4. The green power credit (5 pts in LEED—CI 2009) in the LEED—CIv4 was split into renewable energy production (3 pts) and green power and carbon offset (2 pts) credits.
The MR category in the LEED—CIv4 has newly introduced a life cycle impact reduction credit for interiors (4 pts in the total 13 pts). Additionally, the issues concerning material reuse and recycling in the LEED—CI 2009 were reformatted into the issues concerning manufacturers’ declarations regarding the sourcing of raw materials and material ingredients in the LEED—CIv4. However, the essence of the MR category (material reuse and recycling and construction waste management) is still the same in each version.
In the EQ category, the LEED—CIv4 presents the same issues that were presented in the LEED—CI 2009: indoor air quality, low-emitting materials, thermal comfort, interior lighting, daylight, and quality views. The only difference is the addition of an acoustic performance credit, which was first introduced in the LEED—CIv4.
The LEED—C&S 2009 versus LEED—C&Sv4 rating schemes are shown in
Table 2. The total number of points is the same (110 pts) and the number of points in each category is very similar. In the SS category, the LEED—C&Sv4 was split into LT and SS categories. In the LEED—C&S 2009, the SS category includes land usage (site selection, development density, and brownfield redevelopment), transportation (alternative green transportation and parking), and site usage (site development and stormwater design, heat island, and light pollution reductions). In the LEED—C&Sv4, the LT category includes land usage (LEED for neighborhood, land protection, high priority site, and surrounding density) and transportation (access to quality transit, bicycle, parking, and green vehicles), while the SS category includes site usage (site development, open space, rainwater, heat island, and light pollution reductions). Thus, the SS issues are very similar to the LT+SS issues.
The WE category in the LEED—C&Sv4 includes, in addition to indoor and outdoor water reduction (also relevant in LEED—C&S 2009), issues related to cooling tower water use and water metering. However, in both versions, the indoor and outdoor water issues have similarly high weights: 8 pts from the total 10 pts in the LEED—C&S 2009 and 8 pts of the total 11 pts in the LEED—C&Sv4.
In the EA category, similar credits are included in the LEED—C&S 2009 and LEED—C&Sv4 for energy optimization and metering, enhanced commissioning, refrigerant management, and renewable and green energy production issues. The most important energy optimization credit has almost the same weight in both versions: 21 pts of the total 37 pts in the LEED—C&S 2009 and 18 pts of the total 33 pts in the LEED—C&Sv4. Only the enhanced commissioning credit was weighed more heavily in LEED—C&Sv4: 6 pts versus 2 pts in LEED—C&S 2009.
The MR category, the LEED—C&Sv4 introduced a life cycle impact reduction credit for building material optimization and reuse (6 pts of the total 14 pts). In addition, building reuse and material recycling (the LEED—C&S 2009) were represented in the LEED—C&Sv4 as issues concerning manufacturers’ declarations regarding the raw material source and material ingredient optimization. Nevertheless, the same issues of building material reuse and recycling and construction waste management are still relevant in both versions.
In the EQ category, the LEED—C&Sv4 suggests the same issues that were relevant in the LEED—C&S 2009: air quality, low-emitting materials, construction indoor air quality management plan, daylight, and quality views.
The analysis of LEED—CI 2009 vs. LEED—CIv4 and of LEED—C&S 2009 vs. LEED—C&Sv4 shows more similarities than differences between the code pairs. Therefore, empirical evidence of the LEED—CI 2009 and LEED—C&S 2009 certified projects can be useful in identifying improvements to upcoming versions of LEED—CI and LEED—C&S schemes, respectively.
2.3. Study Design
Table 3 shows the sample sizes for each country and the CI and C&S LEED rating systems. In the three countries of Turkey, Spain, and Italy, the evaluated projects were selected at sites located in the Mediterranean basin.
The problem of a small sample size and an appropriate significance test. Because the LEED project data are related to an ordinal scale (i.e., a normal distribution was not met), nonparametric tests should be used. In this context, if two unpaired groups containing the smallest sample sizes n
1 = 10 and n
2 = 8 (Turkey vs. Italy for LEED—CI, respectively;
Table 3) should be statistically compared, then an exact WMW two-tailed test should be used. In addition, Mann and Whitney (1947, p. 50) noted that at this point, the distribution is almost normal when the sample size is n
1 = n
2 = 8 (Mann and Whitney [
31]. Bergmann et al. (2000, p. 73) strongly recommended using an exact rather than an asymptotic approximation WMW test, especially in cases where the experimental groups exceed 10 [
32].
If the sample size was to be set as n
1 = n
2 = 8 and a normal distribution was not met, the type I error probabilities for the exact Wilcoxon rank sum test (equivalent to the exact WMW test) were found to be 5% [
33]. Therefore, the exact WMW test can be used as the appropriate significance test in the present study. Lately, the LEED certified levels projects, that is, two unpaired groups, were statistically treated through the use of the WMW test [
14,
15,
17]. In the present study, a small sample variance in the groups was achieved because we used the same LEED version (i.e., LEED 2009), the same rating system (i.e., C&S or CI), the same certification level (i.e., Gold), and the same region (the Mediterranean basin). In addition, it was reported that, “Despite the advantages of big studies, large sample size can magnify the bias associated with error resulting from sampling or study design.” [
34]. Recently, Pushkar [
25] showed that if LEED certified projects were divided into several groups (U.S. states) with small sample sizes, then the statistical conclusions were more realistic than when all LEED projects were pooled into one group.
2.4. Data Collection
The USGBC scorecards of LEED certified projects are available for public access. In this study, we downloaded the USGBC scorecards of the LEED 2009 certified projects (as of April 2018) certified in Turkey, Spain, and Italy. LEED—CI 2009 certified projects were retrieved from the commercial interiors directory of the USGBC website [
35] and the LEED—C&S 2009 certified projects were retrieved from the core and shell development directory of the USGBC website [
36]. Then, information on the retrieved projects regarding the points for credits awarded in the five main categories—SS, WE, EA, MR, and EQ—were accumulated in an Excel sheet. Eventually, the RP points were also accumulated and redistributed among the five relevant main categories. In this way, we collected points for five basic categories, SS, WE, EA, MR, and EQ, with embedded RP points in the relevant main category. These data were statistically evaluated as described below.
2.5. Statistical Analysis
Descriptive statistics. The data are presented as the median ± interquartile range (IQR, 25th–75th percentiles). All statistical analyses were performed using MATLAB R2013a.
Inferential statistics. The exact WMW two-tailed test was used to determine significant difference (
p-value) between two distributions [
32]. Nonparametric Cliff’s δ was applied to measure the magnitude of the difference of the two distributions (i.e., effect size) [
37].
Cliff’s δ [
37], p. 495 is expressed as follows:
where
x1 and
x2 are scores within group 1 and group 2, respectively; n
1 and n
2 are the sizes of the sample groups, group 1 and group 2, respectively; and # indicates the number of times.
Cliff’s δ ranges between −1 and +1; positive (+) values indicate that group 1 is larger than group 2, 0 indicates an equality or overlap, and negative (−) values indicate that group 2 is larger than group 1 [
37].
The effect size is considered (i) negligible if |δ| < 0.147, (ii) small if 0.147 ≤ |δ| < 0.33, (iii) medium if 0.33 ≤ |δ| < 0.474, or (iv) large if |δ| ≥ 0.474 [
38]. According to Cohen [
39], (p. 156), “A medium effect is visible to the naked eye of a careful observer. A small effect is noticeably smaller than medium but not so small as to be trivial. A large effect is the same distance above the medium as small is below it.” It should be noted that the effect size does not constitute “iron-clad criteria” [
40], but is only a general rule of thumb that might be followed in the absence of knowledge of the area [
41].
Neo-Fisherian significance assessments. In the current study, the hybrid of the Paleo–Fisherian and Neyman–Pearsonian paradigms (i.e., null hypothesis significance tests (NHST)) are replaced by a neo-Fisherian assessment (NFSA), as recommended by Hurlbert and Lombardi [
42]. An NFSA (1) does not fix α, that is, the level of significance; (2) does not describe
p-values as ‘significant’ or ‘nonsignificant’, that is, dichotomizing the scale of p-values, that is,
p ≤ α or
p > α, determined, “as a sort of mechanical Occam’s razor” [
43]; (3) does not accept a null hypotheses based on high
p-values but only suspends judgment; (4) interprets significance tests according to “three-valued logic”; and (5) presents the effect size information in conjunction with the significance tests. NFSAs are used to interpret the signs and magnitudes of the statistical effects [
44]. Precise
p-values were evaluated and shown according to a three-valued logic as follows: “it seems to be positive” (i.e., there seems to be a difference between group 1 and group 2), “it seems to be negative” (i.e., there does not seem to be a difference between group 1 and group 2), and “judgment is suspended” regarding the difference between group 1 and group 2 [
42,
44]. Hurlbert and Lombardi [
44] cited the suggestion of Gotelli and Ellison [
45], noting that “in many cases, it may be more important to report the exact
p-value and let the readers decide for themselves how important the results are”.
3. Results
Descriptive statistics (median ± interquartile range (IQR, 25th–75th percentiles)) for the projects certified in Turkey, Spain, and Italy, as well as inferential statistical analysis (Cliff’s, δ, and
p-value) for comparing the countries’ performances, that is, Turkey versus Spain, Turkey versus Italy, and Spain versus Italy, are presented in
Appendix A,
Table A1,
Table A2,
Table A3,
Table A4 and
Table A5 for the SS, WE, EA, MR, and EQ categories, respectively. Thus, the results of the SS, WE, EA, MR, and EQ performances (“similar high performances”, “similar low performances”, and “different performances”) in Turkey, Spain, and Italy that were evaluated via the statistical analyses (
Appendix A,
Table A1,
Table A2,
Table A3,
Table A4 and
Table A5), and are presented below in
Table 4,
Table 5,
Table 6,
Table 7 and
Table 8.
3.1. SS Category
More similarities than differences in the performances in Turkey, Spain, and Italy were noted in the SS category (
Table 4). For example, Development Density and Community Connectivity (SSc2 in both the CI and C&S systems) and Alternative Transportation (Public Transportation Access, Low-Emitting and Fuel-Effective Vehicles, and Parking Capacity) (SSc3.1 and SSc3.3 in the CI system and SSc4.1, SSc4.3, and SSc4.4 in the C&S system) were considered important issues, and similar high performances in these credits were revealed in all three countries. This is because densely built urban environments that provide clean and alternative transportation are extremely important in high urbanized countries [
20].
However, similar low performances were revealed in Alternative Transportation—Bicycle Storage and Changing Rooms (SSc3.2 in CI system and SSc4.2 in C&S system) in all three countries. It can be suggested that such low performances are the result of the Mediterranean climate that prevails at the sites where the projects are located (Turkey: Istanbul, Ümraniye, Ataşehir, Ankara, Çanakkale, Antakya, and Esenyurt; Spain: Madrid, Barcelona, La Roca Del Valles, and Caceres; and Italy: Grassobbio, Milan, Arese, Villanterio, Corsico, Segrate, and Rome) [
28,
29]. Thus, the long, hot summers that represent the Mediterranean climate are not as appropriate for transportation means, such as bicycling.
Some of the revealed differences in performances of SS credits in CI and C&S projects were the result of different requirements in the two systems for the same credit. For example, consider SSc1, Site Selection. In that credit, in CI certified projects, different performances in Turkey, Spain, and Italy were revealed, whereas in C&S certified projects, similar high performances in the three countries were revealed. This is because in C&S, designers are only required to build their projects at environmentally appropriate sites [
29], whereas in CI, there is an option for the possibility of awarding points for this credit depending on the previous building environmental history [
28]. This means that when a project should be certified under CI, to obtain five points in this subcategory, simply selecting a building that previously employed other somewhat green practices (for example, selecting a LEED—NC certified building) should be undertaken. In this respect, it can be suggested that Turkey has an advantage over Spain and Italy. For example, LEED is a more widely accepted certification system in Turkey than in Spain and Italy. In this respect, as of July 2018, 426 projects in Turkey had received LEED certification, whereas there were 245 and 219 LEED certified projects in Spain and Italy, respectively [
26]. It can be suggested that this is why Turkey’s performance is better than those of Spain and Italy for SSc1 in the CI system (
Appendix A,
Table A1).
3.2. WE Category
In general, it can be suggested that in both the CI and C&S certified projects, the best WE performance was associated with the possibility of obtaining RP points in this category; a country that has RP points for WE credit(s) performed better and vice versa (
Table 5). In the CI system, only Turkey and Spain have RP points for WEc1 Water Use Reduction; therefore, these countries performed better than Italy for this credit (
Appendix A,
Table A2). In the C&S system, only Spain has RP points for WEc1 Water Efficient Landscaping, and both Spain and Italy have RP points for WEc3 Water Use Reduction. Thus, in these credits, Spain’s and Italy’s performances were better than Turkey’s performances (
Appendix A,
Table A2). However, similar high performances were revealed in WEc2 Innovative Wastewater Technologies in all three countries, although only Spain and Italy have RP points for that credit.
In this respect, it should be noted that Turkey, Spain, and Italy are countries with current/potential high water stress [
47,
48,
49], which could increase in future decades. This is because of the possibility of climate change effects on water resource potential in countries located in the Mediterranean basin. It has been predicted by hydrological models that as a result of climate change, annual temperature will increase and cumulative annual precipitation will decrease in the Mediterranean region [
47,
48,
49]. In Turkey, high water stress is not exactly being experienced currently, but climate change in the western and southern parts of Turkey, which is part of the Mediterranean basin, may cause water stress in that country in the near future [
47]. In Spain, unequal distributions of water and its scarcity have been reported throughout the country, but especially problematic water scarcity is predicted in its Mediterranean area [
48]. In Italy, it was reported that the last 30-year period was the warmest of the last 800 years, thereby creating climate changes that led to changes in water availability due to the hydrological cycle [
49]. Thus, in the WE category for both the CI and C&S systems, RP points should eventually be redesigned and redistributed to allow all three countries to obtain RP bonus points towards a better performance for water consumption.
3.3. EA Category
For Turkey, Spain, and Italy, in both the CI and C&S systems, the EA category contains the most RP points (
Table 6). This emphasis on EA was expected because decreasing energy is a global warming concern [
20]. However, the stated RP points were not the same in Turkey, Spain, and Italy. Some credits have RP points for all three countries, and some are only for two of the three countries. However, both of these cases have resulted in similarities and differences in the countries’ performances.
For example, in the CI system, EAc1.1 Optimize Energy Performance—Lighting Power and EAc2 Enhanced Commissioning are credits with RP points in all three countries with similar performances. In particular, similar high performances were revealed for EAc1.1, whereas similar low performances were found for EAc2 (
Appendix A,
Table A3). Regarding the similar low performances for EAc2, it should be noted that this credit requires an independent commissioning authority to be hired for enhanced commissioning of building energy systems [
15]. Thus, EAc2 performance highly depends on involved additional finances.
However, in the case of the EAc1 Optimize Energy Performance credit, in the C&S system, although RP points were allowed for all three countries, the performances in Turkey, Spain, and Italy differed. This is because in the C&S system, EAc1 contains all of the energy optimization issues (Lighting Power, Lighting Controls, Heating, Ventilation, and Air Conditioning (HVAC), and Equipment and Appliances) all together in one credit and, therefore, it provides high numbers of points (up to 21 points). This means that in this case, one bonus point does not greatly change the total resulting number of awarded points, and Italy’s performance was, in essence, the best without the influence of one RP point.
An additional example is provided by the CI system EAc1.3 Optimize Energy Performance—HVAC credit, in which RP points are allowed only for Spain and Italy and not for Turkey. As a result, the EAc1.3 performances in Spain and Italy were significantly higher than those in Turkey (
Appendix A,
Table A3). However, in the case of EAc5.2 Measurement and Verification—Tenant Submetering, in the C&S system, despite the fact that bonus RP points were only given to Spain and Italy, the three countries still had similar high performances.
It should be noted that in the On-site Renewable Energy (EAc2 in the C&S system) credit, as well as in the Green Power (EAc4 in the CI system and EAc6 in the C&S system) credit, all three countries performed in a similarly poor way (
Appendix A,
Table A3). However, green power energy and renewable energy can be successfully applied in all three countries. In Turkey, the share of renewable energy in the total electricity production is approximately 20% and is represented mainly by hydropower (16.1%), wind (3.3%), and other sources (biomass, solar, and geothermal) (1.4%) [
50]. In Spain, the share of renewable energy in the total electricity production is approximately 35% and is represented mainly by variable renewable energy sources, such as wind (19%), solar (5%), and other sources (biomass, cogeneration, and the remaining) (11%) [
51]. In Italy, wind and solar are also the most popular renewable energy sources, with 8% of the country’s electricity production provided by photovoltaic (PV) panels [
52]. Thus, to encourage using these renewables in Turkey, Spain, and Italy, in the EA category for both CI and C&S systems, RP points should be given for On-site Renewable Energy and Green Power credits.
3.4. MR Category
In general, the present study revealed a low performance in the MR category for some credits (
Table 7), such as MRc1.2 Building Reuse—Maintain Existing Interior Nonstructural Elements, MRc6 Rapidly Renewable Materials, and MRc7 Certified Wood (CI system), as well as MRc3 Materials Reuse and MRc6 Certified Wood (C&S system) (
Appendix A,
Table A4). However, similar high performances were revealed for the MRc2 Construction Waste Management (C&S system) and for the MRc5 Regional Materials (CI and C&S systems).
3.5. EQ Category
In particular, for almost all the EQ credits, the performances in the three countries were similar (
Table 8), with half of the EQ credits having a high performance, and half having a low performance (
Appendix A,
Table A5). For example, similar high performances were revealed in EQc2 Increased Ventilation, and EQc3.1 Construction Indoor Air Quality Management plan—During Construction, whereas similar low performances were found in EQc1 Outdoor Air Delivery Monitoring, and EQc8.2 Daylight and Views—Views (in both CI and C&S systems).
Thus, there were cases in which half of the credits had a high performance and half had a low performance. For example, in CI projects, the Construction Indoor Air Quality Management plan during construction (EQc3.1) performed well, whereas that plan had low performances before occupancy (EQc3.2) in all three countries. An additional example is Low-Emitting Materials in both CI and C&S projects, in which Adhesives and Sealants and Paints and Coatings (EQc4.1 and EQc4.2) had similar high performances, whereas Flooring Systems and Composite Wood and Agrifiber Products (EQc4.3 and EQc4.4) had similar low performances in all three countries. In this case, it can be suggested that installation of new filtration media prior to occupancy (EQc3.2), as well as carpet and composite wood installations (EQc4.3 and EQc4.4, respectively), are not popular measures in these three countries.
4. Discussion
The problem of pooling procedure. In empirical studies of LEED certified projects, pooling of large sample sizes are practiced [
15]. Considering LEED—NC 2009 certification, Wu et al. [
15] evaluated pooled sampling of 3416 certified projects around the world. The authors [
15] reported the highest performance in the ID category; intermediate performance in the SS, WE, and EQ categories; and the lowest performance in the EA and MR categories.
In this study, each of the three countries (Turkey, Spain, and Italy) was considered separately, thereby avoiding the problems associated with pooling procedure. The following results were obtained: SS and WE category performances were high, the EA and EQ category performances were intermediate, and the MR category performance was low. As noted, these results are different from the aforementioned results reported by Wu et al. [
15] for all world-certified projects.
The problem of design structure. Recently, Wu et al. [
21] (p. 9,
Table 6) evaluated the LEED—NC 2009 categories achievement among four countries, the United States, China, Turkey, and Brazil, which are located in the different regions. It was reported that across the four countries, the SS, WE, EA, EQ, and ID category performances were significantly different, whereas no significant differences were revealed in MR category performance.
The evaluated certified projects in these counties were under the influence of several factors including different space type of the LEED certified projects [
21] (p. 8,
Figure 1), different number of certified projects, different levels of LEED certifications [
21] (p. 9,
Table 6), different climate, and so on. Consequently, the interpretation of the results that were obtained in the Wu et al. [
21] study (p. 9,
Table 6) may be incorrect because of a large number of influencing factors.
In the current study, to evaluate the effect of regional RPs on the performance of LEED 2009 certified buildings, only the Gold level of LEED certification was chosen, only two separate rating schemes, LEED—CI and LEED—C&S, were selected, and three countries, Turkey, Spain, and Italy, from the same region (the Mediterranean basin) were selected for analysis. As a result, in the SS, MR, and EQ categories, Turkey, Spain, and Italy performed in a similar way, which confirms the correct application of the LEED—CI and C&S systems in those three countries located in the Mediterranean basin. However, in the WE and EA categories, Turkey, Spain, and Italy performed in a different way. As shown, these differences were mainly the result of RP points suggested by the USGBC in those countries.
This design structure can be defined as a single-unit design structure, in which the Mediterranean basin was defined at only one scale [
30]. Recently, when LEED 2009 Silver–Gold transition was evaluated, a single-unit design was applied, either the entire United States or individual U.S. state [
25]. It was clearly shown that corrected statistical conclusion occurred when the single-input design structure was applied to an individual U.S. state. In the present study, the single-input design structure was applied to the Mediterranean basin. Consequently, to evaluate the effect of RP on LEED certified projects performance, at least similar geographic regions and similar levels of certification should be used.
Based on the study [
25], in the evaluation of LEED Gold-certified projects, the Mediterranean basin was defined as “a sampling frame” (i.e., the sampling frame is a collection of primary sampling units “accessible for sampling in the population of interest” [
53]). While the LEED Gold-certified projects within each country (Turkey, Spain, and Italy) were defined as “primary sampling units” (i.e., the primary sampling unit is statistically independent of other primary sampling units within the same sampling frame [
53]).


