Abstract
Changes in the way people use information come from the concept of the most primitive human migration rule. Scholars hold that migration can be considered as a switching of people’s place of residence, but the migration of people is not limited to the migration of residence. The marketing field also borrows the population migration theory to further explore the switching behavior of customers; educationalists also discuss migration of learning through migration theory. In this regard, the migration of human beings is a process of historical evolution, though it takes several decades to understand history from the perspective of such evolution. Hence, if there is a decision-making system that simulates evolution and estimation through 3D graphics, then players may better understand the impact of environmental migration and changes on humanity. This study adopts Push-Pull-Mooring (PPM) theory to explain the migration of human beings. Push is generated from people’s dissatisfaction with their place of residence, Pull is from attractions of the new environment, and personal mooring produces the intention of switching. A set of Gamification Environmental Education Applications (GEEA) and a migration scale for such apps are developed herein to explain the state where computer gamers switch to mobile app games. The results show that all four hypotheses are supported, and the path coefficient of each hypothesis is highly significant. The R2 values of five intrinsic constructs are Push (R2 = 0.321), Mooring (R2 = 0.574), Pull (R2 = 0.413), Switching intention (SI) (R2 = 0.552), and SB (R2 = 0.626), where the R2 value of SB is quite high, indicating that the relationship between the switching behavior (SB) and the four precursors exhibits great explanatory power. Hence, the explanatory power of this model is convincing, and the teaching materials designed through gamification education deliver better learning outcomes.
1. Introduction
Environmental education emphasizes knowledge, attitudes, and skills about the environment and education conducted based on a sustainable environment [1,2,3]. Sustainable environmental education is a vital issue in our time. It is a mutual equilibrium, trade-off, and integration of environmental sustainability, social sustainability, happiness sustainability, and economic sustainability [4,5]. Changes in the way people use information comes from the concept of the most primitive human migration rule. Scholars hold that migration can be considered as a switching of people’s place of residence, but the migration of people is not limited to the migration of residence [6]. The marketing field also borrows the population migration theory to further explore the switching behavior (SB) of customers; educationalists also discuss the migration of learning through the migration theory [7]. In this regard, the migration of human beings is a process of historical evolution, while it takes several decades to understand history from the perspective of such evolution. Hence, if there is a decision-making system that simulates evolution and estimation through 3D graphics, players may better understand the impact of environmental migration and change on humanity. Moon (1995) proposed the Push-Pull-Mooring Theory (PPM) to explain the migration of human beings [8]. Push is generated from people’s dissatisfaction with the place of residence, Pull is from attractions of the new environment, and personal mooring promotes migration activities that target for a better and more beautiful life.
The combination of sustainable development education and information education will be the future trend of development and a vital task. With the development of the new model of “computing (ubiquitous computing) anytime and anywhere”, new mobility benefits include learning with tablet PCs, as well as more effective teaching and significant learning outcomes. In such framework, it is of great importance to create new value-added tools and teaching procedures. Teaching strategies such as internship, field visit, games, discussion, raising questions, and role play are frequently used in sustainable development education [9]. Game simulation strategies offer multiple advantages such as delightful learning, while reducing stress and anxiety among learners and teachers, improving memory, stimulating student participation, and enhancing overall learning [10]. Gamification learning has become an important topic in economics, society, and research. Many scholars believed that posing challenges remains a vital source of intrinsic motivation in players’ environment [11]. In learning materials, gamification plays an important role, not only in driving everyone’s intrinsic motivation, but also in learning.
The previous research literature has plenty of areas that use simulation methods to conduct gamification education or solve relevant difficulties, mainly because simulation games have the following features. (1) Realistic effects can be achieved through design of and overall context, and because of this complete context, learners can recall the learning process and content more easily. (2) When designing a simulation environment or a game script, the complex context will be divided and restructured according to the teaching objectives. (3) In the face of uncertain contexts, learners will increase their thinking in the decision-making process. (4) Through instant feedback, learners believe that they have the ability to create a happy, relaxed, novel, and inspiring atmosphere in which they will have courage to do the best [9,12,13]; however, in previous literature, simulation games were seldom used in the field of human social sciences. Therefore, this study fills this gap by extending the theory of migration for developing and designing apps (applications) in gamification environmental education to enhance students’ learning outcomes. In this study, a sustainable environmental stimulation city is used to construct a better life indicator of population, economy, electricity, environment and happiness, gradually setting up a stimulation evaluation game featuring sustainable environment education changes. Based on the above motivations, the main purposes of this study are as follows.
- (1)
- Develop and design gamification environmental education simulation apps.
- (2)
- Construct a switching intent scale for gamification environmental education simulation apps.
- (3)
- Verify analysis of complementary learning outcomes of gamification environmental education simulation apps.
2. Literature Review and Research Hypotheses
2.1. Simulation Education Serious Game
The “simulation game” of environmental education simplifies the real situation and copies situational patterns based on the purposes of the game so that players may acquire new knowledge under continuous interaction within this context. “Simulation game teaching” also defines a set of rules to be followed to provide different levels of sophisticated challenges, to guide players in the pursuit of victory, to help them challenge opponents, and to break environmental restrictions in the process of reaching the game goals; the combination of the two is “simulation game law”, including both the game design and the simulation scenarios. The famous Beer Game among all simulation education games was a chain strategy game of simulation supply developed by Sloan School of Management at MIT in the 1960s. In the Beer Game, consumers’ demand change was small, but through amplification of the entire system, it would generate a great crisis. Hence, simulation education games arouse competitive/cooperative spirit among players, promote playfulness, achievements and keep challenges, and provide players with rewards through learning and confrontation [14,15]. DeVries and Edwards (1973) pointed out that learning through simulation education games offers easier methods to understand something than through other learning methods [16]. Keller (1987) indicated that games have multiple functions such as teaching, entertainment, and helping to explore new skills, improve self-esteem, practice skills, and change attitudes. When applied in education, it exudes considerable value [17]. Bonk and King (1995) held that playing video games offers real-time brainstorming and inspiration [18]. Based on the above scholars’ points of view, games, when applied in learning, can arouse competitive/cooperative spirit among learners, enhance memory, stimulate inspiration, and boost learning willingness [18].
2.2. Migration Theory
Ravenstein proposed “the laws of migration” in 1885 based on the migration situations in the Census of England and Wales and with reference to data from several countries. His view focused on illustrating the phenomenon of migration from rural to urban areas and held that the labor population of migration was mainly limited by both the push and pull effects [19]. A region’s push being greater than its pull will lead to migration of residents; conversely, a region’s pull being greater than its push will attract more residents (Figure 1). The push-pull theory indicates that the reason for population migration is the push of the origin place of residence, the pull of the migrated place, and the interaction of interferences and obstacles during the process. Migration behavior is caused due to the understanding of migrants towards an objective environment, coupled with the decision-making behavior formed through subjective feelings and judgments. Factors such as fertile land, pleasant climate, better living environment, adequate employment opportunities, better public facilities, education opportunities for children, social stability, and political stability may be incentives to attract more people to migrate. In addition, factors that hinder or interfere with the occurrence of migration or reduce the migration behavior are known as intermediate obstacles, including distance, immigration regulations, and personal factors.
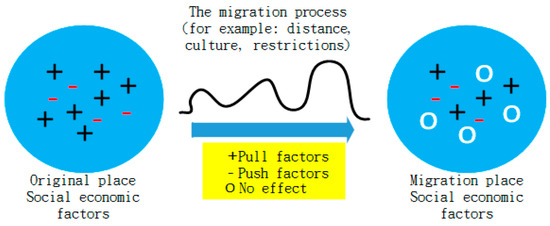
Figure 1.
Diagram of factors affecting migration.
2.3. Research Hypotheses
2.3.1. Relation between Push and Intention of Switching
Davis (1989) modified the theory of reasoned action (TRA) and extended the technology acceptance model (TAM) to include two factors: perceptual usefulness refers to the degree to which users subjectively perceive that using a technology can improve work performance; while perceptual easiness refers to the degree of ease-of-use of technology in users’ eyes. In his opinion, individual behavior was determined by behavioral intention, and behavioral intention may be affected by Attitude and Subjection Norm. Users’ attitude towards the system may be affected by perceptual easiness and perceptual usefulness, users’ behavioral intentions are affected by attitude and perceptual usefulness, and perceptual usefulness is also affected by perceptual easiness [20]. This model has been widely used in a variety of science and technology accepted behavior research, and hypotheses in the model have also been repeatedly verified [21,22,23]. Multiple previous studies also pointed out that TAM has certain explanatory power for the integration of computer assistance instruction (CAI) and information communicational technology (ICT) in teaching [24,25,26,27,28,29]. The research results of TAM indicated that users’ attitudes towards the usefulness and easiness of technology products have a positive impact on the acceptance attitude and intention of products and proved that perceptual usefulness and easiness have a positive impact on intentions [30,31,32]. Relevant studies by Fornell (1996) proved that service quality has a positive impact on customer satisfaction, as users may switch behavior when they are dissatisfied [33]. Moon (1995) deemed that once people felt poor quality of life or poor life experience, they would generate a push for migration. Following the correlations among the above literature, this study showed that push is an unsatisfactory effect and mainly composed of four elements: service quality, perceptual usefulness, perceptual easiness, and perceived satisfaction. Hence, this study proposes the following hypothesis.
Hypothesis 1.
The less useful, the more difficult to operate, and the more dissatisfaction towards service quality that gamification environmental education apps exhibit, the stronger the intention of switching will be.
2.3.2. Relation between Mooring and Intention of Switching
Moon (1995) proposed that in migration theory, mooring refers to the personal and social factors that promote migrants to leave or to stay in their original places of residence. Ajzen (1985) put forward the Theory of Planned Behavior (TPB) [34], which evolved from the TRA. Ajzen (1989) deemed that subjective norms refer to the social pressure felt when an individual takes on a particular act [35]; i.e., the pressure put forth by other important persons or groups that prompt him/her to carry out or not carry out a particular act. The stronger the positive subjective norms are, the easier they stimulate the intention of carrying out such an act. Fishbein & Ajzen (1975) argued that attitude and subjective norms are two of the most important determinants of behavioral intentions. According to the previous literature, TPB can be applied to explain different types of behavior, with all having good explanatory power [36]. Entertainment is often accompanied by elements of fantasy, feeling, fun, and symbolic meaning [37] or festive and ludic feelings [38]. The characteristics of entertainment facets are also commonly used in behavioral studies [38,39] and are thought to be subjective and personal [40]. In terms of system usage, the higher the “entertainment” is felt by users towards the decision-making system, the higher the intention of adoption is [41]. Ajzen (1985) also argued that subjective norms have an impact on consumers’ purchasing intentions, while Ajzen (1989) considered that behavioral attitudes and subjective norms directly affect behavioral intentions [35]. Hence, to enhance one’s behavior or intention, one must either feel positive about one’s behavior or feel more normative pressure around him, and the more control he knows about the behavior, the more positive his behavioral intention is. According to the above literature, the study proposes the following hypothesis.
Hypothesis 2.
The higher the players’ subjective norms are and the stronger the attitude of transformation is, the stronger the intention of switching will be.
2.3.3. Relation between Pull and Switching Intention
Media Richness Theory, also known as Information Richness Theory [42], defines the richness of information as the potential information load of media. In terms of consumption decision, it has been pointed out that whether to obtain rich information is an important factor that influences the intention of consumer behavior [43]. If consumers are equipped with enough useful information during the consumer decision-making process, then their purchase attitude will be more positive. Rice (1993) argued that different media have different characteristics and different media have different communication effects [44]. Dennis and Kinney (1998) used computers as a medium of communication, as they can immediately provide feedback, transmit multiple clues, and use multi-lingual communication and individual focus [45]. When users perceive the richness of the medium of an information system, their perceptual entertainment will be positively affected [46]. Dialogues between information systems and users, in addition to interaction between both sides, can respond to information and content provided by information systems [47]. Interactivity has a positive impact on the practicality of information systems and helps create better consistency between attitudes and usage behavior [48]. Ennew, Banerjee, & Li (2000) pointed out that a company’s reputation has a greater impact on consumer behavior than advertising and personal marketing and even plays an important role in the diffusion of new products. Hence, reputation also has a direct impact on consumers’ willingness to switch or buy. Lee (1966) even found that migration pull would be produced if there was better quality of life in the process of migration [49]. As a result, service providers and consumers with higher subjective norms, higher information richness, and good reputation feel stronger intention about switching. From the above literature, the effects of pull as a substitute include information richness, reputation and trust, perceptual risk, switching intention (SI), and SB. Therefore, this study proposes the following hypothesis.
Hypothesis 3.
The richer the information is and the lower the risks are regarding, the stronger the SI of the player will be.
2.3.4. Relation between SI and SB
The TPB proposed by Ajzen and Fishbein (1980) consists of three factors: behavioral attitudes, subjective norms, and perceived behavioral control. Thus, to enhance one’s behavior or intentions [50], one must either feel positive about one’s behavior or perceive more normative pressure around oneself. The more the perceived control is, the more positive the behavioral intention is. Ajzen (1989) showed that intentions have a direct positive correlation with behavior. Davis (1986) also pointed out in a TAM study that attitude, intention, and behavior have a positive relationship. TAM also illustrates the direct impacts of perceptual usefulness and perceptual easiness on intentions and the employed impacts on attitudes and behavioral intentions for generating actual system behavior. Behavioral intention is a tendency and refers to positive or negative views or feelings that users have towards on a new technology. Many previous studies [35,51] obtained empirical results showing that behavioral intentions play an important role in the actual use of behavior. Therefore, according to the above literature, the study proposes the following hypothesis.
Hypothesis 4.
The SI of gamification environmental education Apps has a significant positive impact on SB.
3. Research Method
3.1. Design and Indices of Environmental Education Teaching Materials
Environmental education is a process of conceptual cognition and value clarification to develop the skills and attitudes necessary to understand and appreciate the interrelationships among human beings, cultures, and other biological and physical environments. Environmental education arouses students’ awareness and sensitivity to the environment through various teaching activities. It can enrich students’ knowledge of sustainable environment, enabling them to cultivate correct values on the interaction between people and environment and to address regional or global environmental issues. Based on the learning indices of environmental education (e.g., Table 1), this study designs an interactive 3D action environmental education simulation teaching material. Through the design of gamification digital media teaching materials, students can achieve the understanding and skills to improve or solve environmental problems, to establish learners’ experience of environmental actions, and cultivate them into citizens of environmental literacy. The following five aspects are listed to specifically describe environmental education curriculum objectives: (1) environmental awareness and environmental sensitivity; (2) environmental concept knowledge; (3) environmental ethical values; (4) environmental action skills; and (5) environmental action experience.

Table 1.
Environmental education curriculum learning indices.
3.2. Use Context and Interface Design
This study applies PPM theory to implement and evaluate the gamification environmental education apps system. The design adopts a simulation game (simulation) as a reference. Through computer simulation of the real-world environment and events, players are provided with a game similar to real-life situations. The game uses everyday life as a backdrop, allowing players to manipulate simulated characters in everyday life, community exchange, and building houses. In such a simulated world, the real-life situations are simulated, and physical and mental needs are controlled, and they are coupled with multiple creative ideas to increase the attractiveness of the game and the style of its design, as shown in Figure 2, Figure 3, Figure 4 and Figure 5.

Figure 2.
Interface of environmental education policy.
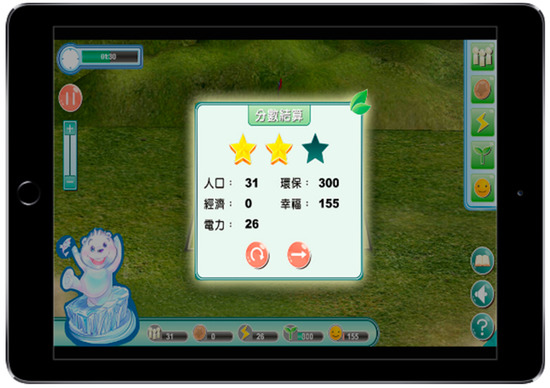
Figure 3.
Achievement environmental education policy.

Figure 4.
Interface of problem-solving strategy game.
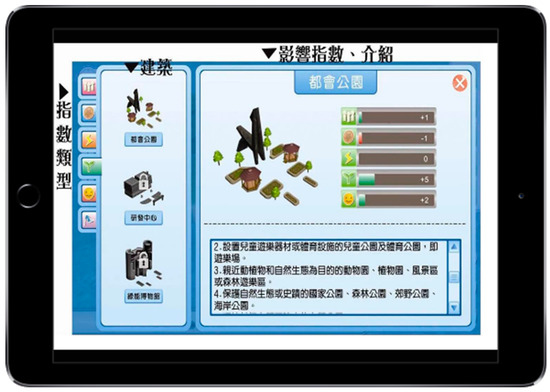
Figure 5.
Environmental education policy game assistant tool.
The contents of this game are mainly for the construction of buildings to maintain the balance between urban development and construction and environment. Each building, as illustrated in Table 2, enables learners to understand the environmental impact of each construction and the principle of renewable energy. The main content of the teaching activities centers on destruction to the environment that arises from over-exploitation as well as the importance of advocating environmental protection. Learners will play the role of builders in the game. In the process of construction and development, the environment will drop in value. In this regard, green buildings must be constructed to improve the environment. The construction of green buildings will also cause economic decline, and learners need to maintain a balance between the two. In terms of the main playing of the game, construction may be divided into five categories: population, economy, electricity, environment, and happiness (Table 2). In the process of construction of the population, economy, and electricity, the quality of environment will be affected, representing destruction of the environment. Hence, efforts should be made to build environmental buildings or build buildings with renewable energy to improve the environment. However, environment-based construction will affect economic development. Players must find ways to strike a balance between economy and environment to learn the impact of technological development and environment.
Table 2.
Index description of gamification environmental education performance.
3.3. Environmental Simulation Real-Time Strategy Game Process
The operation procedure of the environmental education simulation real-time strategy game is shown in Figure 6 and Figure 7. Since this game is based on real-time decision-making under the development of sustainable environmental education based on the five dimensions of population, economy, electricity, environment, and happiness, any event will happen immediately and players must decide to handle which incident immediately to response and solve the problem. For example, in terms of environmental problems, if there is a lack of power infrastructure in urban development, then there are five sources of electricity (nuclear, wind, waterpower, thermal, and solar power) available to players. However, the source of nuclear energy selected by players will lead to a negative impact on the environment and gradually reduce the environmental health index. Players need to instantly determine whether to develop an economy or create a happy city. If players choose wind power, though this can avoid a decline in the environmental health index, the cost at the same time will result in a decrease in the economic index. If the economic indicators continue to decline to a certain level, then this will lead to social happiness and public order problems and even to social theft events. The social stability index will at the same time also gradually decline. At this moment, players should immediately send the police to maintain social order, thus raising the social stability index. Players need to invest in green alternative energy after achieving an economic balance. Though the economy index will decline, and the social stability index will also drop due to investment in alternative energy sources, the environmental index will go up. The five indices of population, economy, electricity, environment, and happiness will also change. After the game is over, for a limited time, the system will calculate the balance value of players in population, economy, electricity, environment, and happiness, as their results. Figure 2, Figure 3, Figure 4 and Figure 5 illustrate the operation chart of a sustainable environmental education strategy game.
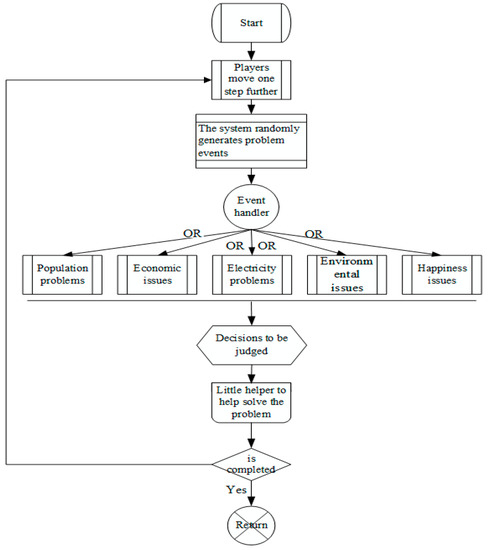
Figure 6.
Parallel event strategy simulation flowchart.
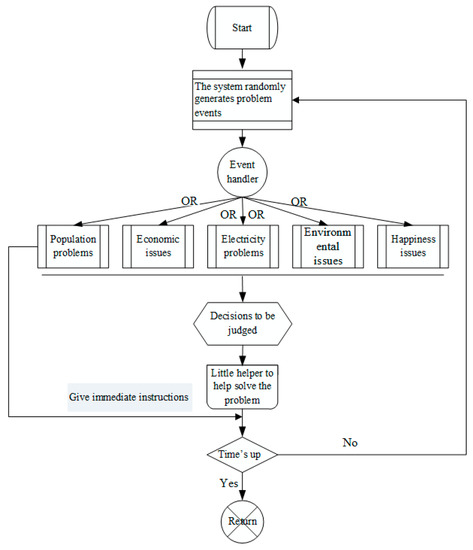
Figure 7.
Real-time strategy simulation flowchart.
3.4. Research Structure
Based on the PPM, TAM, and TPM, and the Media Richness Theory proposed by Moon (1995), this study proposes the integration of PPM theory in gamification environmental education design and learning outcome evaluation. Figure 8 shows the research model and operational definition (Table 3), including the dissatisfaction effect of the second-order facets of Push—that is, service quality, perceptual usefulness, perceptual easiness, and perceived satisfaction; Mooring facet contains subjective norms and attitudes of transformation; while the effect facets of the alternatives of Pull include information richness, reputation, trust and perceptual risk, SI, and SB.
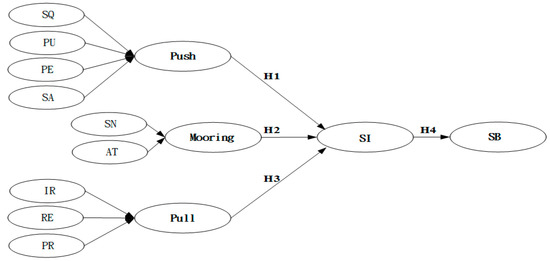
Figure 8.
Gamification environmental education Apps’ switching model architecture.
Table 3.
Operational definition of the constructs and questions of the questionnaire.
3.5. Operational Definition of Constructs
For the development of scale, the complete questionnaire is divided into 11 sections and 39 questions (Table 3). In the Push section, the service quality was modified from the findings of Ho & Lee (2007), and perceptual usefulness (PU) and perceptual easiness were modified from the research items of perceptual satisfaction [52]. In the Mooring section, subjective norms and switching attitudes were modified from the research items of Taylor & Todd (1995). In the Pull section, information richness is measured by questions from Chen & Tan (2004), while reputation and trust are modified from Bansal et al. (2005), and perceptual risk uses the questions items of Kim et al. (2008). The question items about SI and behavior also come from Bansal et al. (2005). In terms of the complete questionnaire, except for the basic information of the respondents, the rest of the scale is a Likert seven-point scale.
3.6. Subjects and Testing of the Samples
The research subjects are divided into two stages: the first stage is the using intention model verification, and the second stage is the learning outcome verification of gamification environmental education. Users who have used the gamified environmental education apps before will be the main survey subjects, and the questionnaire and data analysis will be employed to verify the hypotheses and path relationship of this study. For verification of using the intention model, the study employs questionnaires on the Internet. The questionnaire contains 2 parts: the first part is basic information, and the second part is the using scale of gamification environmental education apps; we collected a total of 156 valid questionnaires. The results showed that all variables are not significantly different between respondents in stage 1 and stage 2, indicating that the non-response bias in this study is not severe. The common method variance (CMV) test uses an unrotated factor to analyze the variables of a single factor, and if one accounts for more than 50% of variability, then there is severe common method variance. The research results showed that factor analysis extracts a total of eight factors with eigenvalues greater than 1. The first factor’s explanatory variance is 28.33% (maximum), which is less than 50%, and the cumulative variance of the eight factors is 85.26%. Therefore, there is no obvious common source bias in this study.
3.7. Learning Outcome Experimental Design
The second stage is the learning outcome verification of the gamification environmental education. To understand the outcome of environmental education in the experimental group and control group, in addition to the mean, standard deviation, and post-test covariance analyses of pre-test and post-test unit test of environmental education in the two groups, average and standard deviation statistical analyses are also conducted for the environmental education App learning system satisfaction questionnaire of the experimental group. The experimental group used the gamification environmental education App learning system, and the control group adopted the general learning course for 10 weeks’ teaching experiment. A total of 78 students in the experimental group (boys = 40, girls = 38) received a gamification environmental education App learning system. The quasi-experimental design steps are shown in Table 4.
Table 4.
Quasi-experiment design.
- Independent variables: Before the experiment, the experimental group and control group: (1) adopted traditional classroom teaching and learning; (2) used environmental education textbooks and handouts teaching for self-study; and (3) took an environmental education learning outcome test.
- Control variables: (1) For the same auxiliary learning resources, in the elective courses the two groups of students were already familiar with the environmental textbooks and handouts and interacted with teachers, teaching assistants, and students in the classroom; and (2) each of the two groups had one assistant to assist with problem-solving and consultation; (3) for the environmental education study, the experimental group adopted the gamification environmental education apps learning system to conduct interactive demonstration teaching and learning, while the control group was led by teachers to carry out textbooks, handouts, and teaching materials learning; and (4) for the same learning outcome assessment tool, the groups used the same environmental education learning outcome before and after the test.
- Dependent variables: The college students of the experimental group and control group took an environmental education learning outcome post-test, and the college students of the experimental group filled in the “gamification environmental education apps learning system satisfaction questionnaire”.
3.8. Quasi-Experimental Design and Research Tools
(1) Environmental education learning outcome test
In this study, the “environmental education learning outcome test” is a set of questions prepared independently with a total grade of 100 points. The quiz exam consists of the following five modules:
- (a)
- Environmental awareness and understanding of the environment—10 questions;
- (b)
- Environmental concept knowledge—10 questions;
- (c)
- Environmental values and attitudes—10 questions;
- (d)
- Environmental action skills—10 questions;
- (e)
- Environmental action experience—10 questions; for a total of 50 questions.
(2) Satisfaction questionnaire on system application
The satisfaction questionnaire of the gamification environmental education apps learning system was prepared independently based on the teaching objectives, learning materials, objectives of environmental learning activities, and characteristics of the learning system during activities. The questionnaire includes 5 parts:
- (a)
- Use interface design—5 questions;
- (b)
- Use stability—5 questions;
- (c)
- Human-computer interaction—5 questions;
- (d)
- System teaching potential—5 questions;
- (e)
- System entertainment—10 questions; for a total of 30 questions.
Two questionnaires used expert validity in terms of validity, including: 3 game learning design experts, 3 environmental education experts, 1 mobile App design expert; and revisions were made according to their suggestions. After factor analysis and project analysis of the pre-test questionnaire, the “Environmental Education Learning Outcome Test” was reduced from 55 questions to 50 questions. The reliability coefficient Cronbach’s α of the total scale was 0.912; questions in the “gamification environmental education App learning system satisfaction questionnaire” were reduced from 35 to 30, and the reliability coefficient Cronbach’s alpha value of the scale was 0.935. Cronbach’s α is a tool for assessing the reliability of scales [57].
4. Empirical Analysis and Results
The analysis and estimation steps of PLS-SEM in this study are carried out using four-stage analysis steps. The first stage is the reliability and validity analysis of the measurement model. The second stage is the analysis of the path coefficient of the structural model and the ability of model prediction. The third stage is to check the good of fitness and indices of structural models. The fourth stage adopts a quasi-experimental design for the learning outcome analysis and the detailed step descriptions, such as detailed descriptions in each subsection [58,59,60,61,62,63,64].
4.1. Sample Descriptive Statistics
Of 156 valid questionnaires in this study, 86 were males (55.1%) and 70 (44.9%) were females. In terms of age distribution, users under 24 years old accounted for 43.8% of the valid samples, users aged 25–34 accounted for 27.2%, users aged 35–45 accounted for 16.8%, and users aged 46–55 accounted for 12.2%. Hence, it can be found that users of the gamification environmental education apps are dominated by younger age groups. In terms of educational attainment, universities and colleges accounted for 53.6% of the total, followed by high school students accounting for 40.5% of the valid samples. In terms of users’ occupations, a large majority of users were students, accounting for 58.1% of the valid samples. For weekly frequency of use, 2–3 times a week is the most frequent, accounting for 56.8% of the valid samples. For each use of time, less than 30 points take the most, accounting for 54.8% of the valid samples.
4.2. Measurement Model Analysis
According to the three principles of convergent validity proposed by Fornell & Larcker (1981), the testing of convergent validity of the proposed constructs should satisfy three conditions: (1) Factor loading (λ) should be significant and above 0.5 [58]; (2) The value of component reliability (CR) should be greater than 0.6; (3) Discriminant validity—The average variation extract (AVE) value should be greater than 0.5 [58] and cross-loading [58]. The reliability analysis of all aspects of the study is shown in Table 5, in which the level of factor loading is all significant at p = 0.001, all items are higher than 0.5, and the CR is between 0.82 and 0.95—both of which are greater than 0.8. The AVE ranges from 0.71 to 0.86, all of which exceeds 0.5. Hence, the study meets the above three conditions. The factor loading of all items in the model is between 0.71 and 0.93 and reaches a significant level of p-value 0.05, and so it has convergent validity [58]. The estimation of discriminant validity was mainly tested in two aspects [65]. One examines the cross-loadings. For each of the variables in this study, the load of individual questions is higher than that of other variables [66]. The other one employs the Fornell-Larcker criterion—that is, the AVE value of each variable must be greater than the square of the correlation coefficient between pairs of variables to show the discriminant validity of each research variable [66,67]. Table 6 shows that the square roots of the average variation extractions of all variables are larger than the conditional value among variables. Table 5 shows that the load of an individual question in the variables is higher than that of other variables. Therefore, the study’s variables have acceptable reliability and validity.
Table 5.
Analysis of factor loadings of variables.
Table 6.
Reliability and validity analysis.
4.3. Structural Model Analysis
Step 1—Evaluate problems of structural pattern multicollinearity (VIF). Step 2—Criteria for significance of path coefficients. Step 3— value and path factor tests [58,59,60,61,62,63,64]. First, variance inflation factor (VIF) was used to evaluate multicollinearity to understand whether there is any problem of multicollinearity. The results showed that the maximum VIF is 2.21 (Table 5), which is between the recommended value of 0.2 < VIF < 5 [68], indicating that there is no problem of multicollinearity. The analysis results of the structural model variable effect are shown in Figure 7. This study conducts complete model analysis. The path coefficient of Push and SI is 0.231 (t = 1.78), showing a significant level, and so H1 holds true. The poorer the usefulness of the gamification environmental education apps is, the harder they are to operate; the more dissatisfactory the service quality of the game is, the stronger the intention of switching environmental education simulation games is. The path coefficient of Mooring and SI is 0.262 (t = 2.93), showing a high level of significance, and so H2 is supported. The higher the players’ subjective norms are, the stronger the switching attitude is and the stronger the switching intention is. The path coefficient between Pull and SI is 0.283 (t = 2.124), showing a significant level, and so H3 holds true. If players get more information, and the reputation and trust and PR are lower, then players’ intention to switch gamification environmental education apps is stronger. The path coefficient of switching intention (SI) and switching behavior (SB) is 0.365 (t = 2.82), showing a significant level, and so H4 is established. The higher the switching intention of the gamification environmental education apps is, the stronger the switching behavior is. Generally speaking, PLS refers to the value in the intrinsic construct of the evaluation model for overall valuation model fitness [61]. From Figure 9, the R2 values of the five endogenous constructs are: Push ( = 0.321), Mooring ( = 0.574), Pull ( = 0.413), SI ( = 0.552), and SB ( = 0.626); where the R2 value of SB is quite high, representing the relation of the explanatory power between SB and the four antecedent factors is good and the unexplained residuals are small, indicating that the SB and its antecedent factors fit quite well. Therefore, the explanatory power of these five endogenous conceptions is good, denoting that the explanatory power of the research model is quite good, which is in line with the proposed criteria of Cohen (1988).
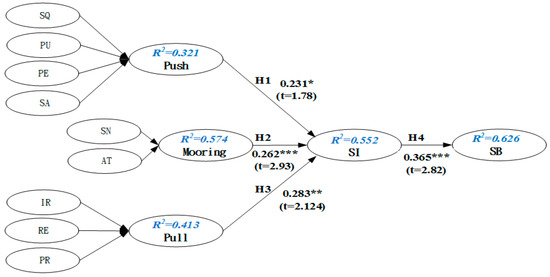
Figure 9.
Gamification environmental education Apps’ usage intention path factor results.
4.4. Goodness of Fit and Indices of Structural Model
The path coefficient measures the direct impact of potential independent variables on potential dependent variables, and the potential independent variables may have an indirect effect on potential dependent variables via other variables. Among them, the direct influence is also called the direct effect, and the indirect influence is also called the indirect effect, both of which can be calculated through path coefficients. The sum of direct and indirect effects is called Total Effects, as shown in Table 7. The explanatory power of the potential variables of Push, Mooring, and Pull is 55.2% for SI, and the explanatory power of the SI potential variables is 62.6% for SI, indicating that the model has a high degree of potential variability and that the model has predictive capacity.
Table 7.
Analysis results of the structural model variable effect.
The index and fitness of the structural model are based on the five steps proposed by the relevant scholars. Step 1—Criteria for the significance of path coefficients. Step 2— value and path coefficient verification. Step 3—effect value evaluation. Step 4—prediction of relevance () evaluation. Step 5—goodness-of-fit (GoF) model fitness index [29,65,68,69,70]. In addition to evaluating the model predictive power, the effect value of structural models is also an important measure of performance. In addition to the evaluation of all intrinsic constructs of the value, the evaluation method of effect value is to delete a particular external derivative in the model to arise a change in the value, which can be used to evaluate whether the person being removed has a significant effect on the internal variables. The general rule of evaluating is that the three values of 0.02, 0.15, and 0.35 respectively represent small, medium, and large effects of the external potential variables [71].
Table 7 shows the effect size of , with the average being greater than 0.15, indicating a medium effect. In terms of the prediction of the relevance of to evaluate the prediction’s accuracy, in addition to the value, researchers should also check the value from Stone-Geisser [72,73], which is an indicator of predictive relevance. As shown in Table 7 of the structural pattern, the value of the intrinsic latent construct is greater than 0, which means that the patterns of the path and the construct have predictive correlations. Tenenhaus et al. [70,74] put forward an overall GoF of PLS as a “program to verify PLS overall model”. Wetzels, Odekerken-Schröder, & Van Oppen (2009) proposed to adopt a communality 0.50 value [66,75] and value [71] as the evaluation for GoFsmall (0.10), GoFmedium (0.25), and GoFlarge (0.36) of the PLS structural model goodness. As shown in Table 7, the GoF of 0.51 for this study is greater than 0.36, indicating that the structural model fits well.
4.5. System Learning Outcome Analysis
From the analysis (Table 8) of the pre-test experimental group and pre-test control group, we find that there is no significant difference (t = 0.018, p > 0.05) between the two groups of college students in terms of prior knowledge in the t test of environmental education learning. The post-tests of environmental education game learning of students from the experimental group and control group are summarized (Table 9), and the results are shown in five course units: (1) environmental awareness (t = −0.247, p < 0.01); (2) environmental conceptual knowledge (t = 0.562, p < 0.01); (3) environmental value and attitudes (t = −6.766, p < 0.001); (4) environmental action skills (t = −6.573, p < 0.001); and (5) environmental action experience (t = −0.251, p < 0.01); and a significant difference is achieved in terms of overall learning outcome (t = −9.121, p < 0.001), indicating that the environmental education learning outcome of students from experimental groups is better than that from the control group. It is conducive to improving students’ environmental education learning outcome. According to results of covariance analysis of the experimental group and control group in this study, we see from Table 10 that the experimental group’s performances of (1) environmental awareness unit (f = 20.197, p < 0.001), (2) environmental conceptual knowledge (f = 28.170, p < 0.001), (3) environmental values and attitudes (f = 17.124, p < 0.001), (4) environmental action skills (f = 28.125, p < 0.001), (5) environmental action experience (f = 27.230, p < 0.001), or overall learning outcome (f = 34.024, p < 0.001) are all better than the control group, indicating that using the gamification environmental education apps for simulation environmental education learning is conducive to improving students’ environmental education learning outcome.
Table 8.
T Test of the pre-test for the learning outcome of environmental education in the control group and experimental group.
Table 9.
T Test of the post-test for the learning outcome of environmental education in the control group and experimental group.
Table 10.
Analysis of covariance of environmental education in the experimental group and control group.
4.6. Analysis of System Satisfaction Questionnaire Results
Figure 10 presents the results according to the satisfaction of the experiment group students’ use of the gamification environmental education apps’ learning system for environmental education and learning activities. The system’s interface design, system stability, system interaction, system teaching potential, and system entertainment may meet the environmental education learning needs and applicability of students from the experimental group. The overall average of the scale is 5.988: in terms of the system interface design (6.23), system stability (5.62), system interaction (5.58), system teaching potential (6.19), and system entertainment (6.32), 78 students from the experimental group are satisfied with the fluency and operation instruction of the environmental learning App system for environmental education learning. To integrate the gamification environmental education apps’ learning system to help students observe the environment, this study focuses on five modules of environmental education: (1) environmental awareness and understanding of the environment; (2) environmental conceptual knowledge; (3) environmental values and attitudes; (4) environmental action skills; and (5) environmental action experience. A design of hands-on simulated learning activities, compared with environmental education learning methods in traditional teaching textbooks, can significantly improve students’ environmental education learning outcome, which is consistent with the results of various studies [76,77,78,79,80].
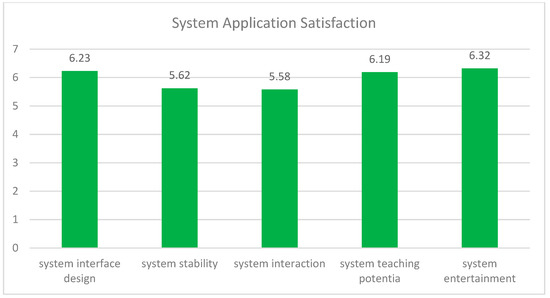
Figure 10.
System application satisfaction.
5. Conclusions and Suggestions
5.1. Discussion
The results of this study show that the proposed four hypotheses are all supported in full and that the path coefficients of each hypothesis are highly significant.
The less useful, the more difficult to operate, and the more dissatisfaction towards service quality that gamification environmental education apps exhibit, the stronger the intention of switching will be.
The research hypotheses hold true and show that the less useful the gamification environmental education apps is, the less reluctant players will operate them. If the service quality cannot meet the needs of players, then it will be hard for them to use and further fire their intention to switch. This study is consistent with the findings of [81] and confirms the positive effect of PU and perceptual easiness on using intention. It also echoes Fornell’s (1996) research, which proved that service quality has a positive impact on customer satisfaction and therefore believed that users would produce SB when they were not satisfied, while gamers would produce Push of migration when they felt that the service quality was inferior, or the system was not good. De Jong and Fawcett (1981) argued that people would migrate due to dissatisfaction [82].
The higher the players’ subjective norms are and the stronger the attitude of transformation is, the stronger the intention of switching will be.
The social pressure felt when a player takes a particular course of action is the pressure imposed by other important persons or groups that push him to carry out that particular course of action. The stronger the players’ subjective norms are, the more likely it is to motivate them to do what they intend to do. The results are consistent with those of Ajzen. Ajzen (1985) put forward the TPB and argued that subjective norms have an impact on consumers’ purchasing intentions, and that behavioral attitudes and subjective norms would directly affect behavioral intentions [35].
The richer the information is and the lower the risks are regarding reputation, trust, and perception that a player obtains, the stronger the SI of the player will be.
In consumption decisions, Engel, Blackwell & Miniard (1993) deemed that getting rich information (or not getting) is one of the important factors that affect the intention of consumer behavior. If customers have prepared abundant useful information during the consumption decision-making process, then their purchase attitudes would be positive [83]. The research results are consistent with those of Ennew et al. (2000). The impact of reputation on consumer behavior is greater than those of advertising and personal promotion and even occupies a vital position in the distribution of new products. Hence, for products with higher subjective norms, a higher IR and trust felt by service providers and customers with good reputation will promote stronger SIs [84].
The SI of gamification environmental education Apps has a significant positive impact on SB.
Behavioral intention is a tendency and refers to the positive or negative views or feelings users have towards new technology. Many previous studies [35,51], including the present one, have obtained empirical results, showing that behavioral intentions play an important role in actual behavior. Therefore, to enhance one’s behavior or intention, one must either feel positive about one’s behavior or perceive more normative pressure around oneself; and the more control one knows about the behavior, the greater is the intention that the behavior will be positive. Findings of Ajzen (1989) showed a direct positive correlation between intention and behavior. Davis (1986) also pointed out in the TAM study that attitudes, intentions, and effects of behaviors have positive relationships.
5.2. Conclusions
This study sets up a gamification environmental education App learning system, which not only helps to enhance students’ learning outcome and interest in environmental education, but also stimulates them to integrate situations to simulate the intension of interactive learning and to promote reflection on contextual issues. The gamification environmental education App learning system can also meet the auxiliary learning needs of students in simulating environmental education. Students were satisfied with the gamification environmental education App system. This helps to satisfy the environmental education context simulation learning needs and applicability of students from the experimental group no matter in terms of system interface design, system stability, system interaction, system teaching potential, system entertainment, learning resources, multimedia teaching materials, and reflection issues. The total effect and explanatory power of model path coefficients (R2 = 0.626) showed that the facets of SI have higher explanatory power of using SB, meaning that the whole model has good evaluation and predict ability. Hence, the behavioral intentions of this research model for gamification environmental education apps are not only predictive, but also provide a good overall model evaluation and research fit. In this regard, all the four hypotheses mentioned herein are significantly supported, meaning that if gamification environmental education apps are designed with PPM, then they will obtain a high degree of SI from users.
5.3. Academic and Practical Implications
5.3.1. Academic Implications
As there is an increasing number of research studies on topics related to gamification-assisted learning, this study proposes innovative predictive models for gamification environmental education apps and provides a reference for subsequent topics related to the design of gamification teaching materials. For migration SIs and behavior views of gamification environmental education apps, this study explores in-depth the design of Push, Pull, and Mooring of gamification environmental education apps as an important reference. The study finds that high SB indicates that players attach great importance to the interactive interface and service quality of gamification environmental education apps. Designers should give priority to improving the design standards of interfaces, such as user interface experience design and game player experience design. Sullivan (1999) pointed out that interactivity—that is, the interaction between information systems and users—also allows users to respond to information and content provided by information systems in the process. From the point of view of a system using satisfaction, the more "satisfied" people are with the information system, the lower their SI will be [41]. Hence, the results of this study can be used as a reference for future gamification environmental education App designing and the behavior theory of SIs.
5.3.2. Implications for Teaching Practice
(1) In the future, the gamification environmental education App learning system may be used to assist experiential learning of various subjects and curricula to explore their impact on the learning outcomes and learning interests of different learning objects. Gamification learning has been experimentally studied in natural sciences, education of historical monuments, arts education in museums, and engineering simulation learning to prove that it can enhance learning outcomes and interest in learning, echoing the findings of past scholars [78,79,80]. In the future, it may be applied in different learning fields and learning subjects to explore its role in promoting learning outcome and performance.
(2) Teachers can plan the learning content and activity design according to the needs of different learning situations to enhance the satisfaction of the gamification environmental education App learning system and to help experience the operational effectiveness of learning. However, the design of digital multimedia teaching materials, the exploration of sustainable development of simulation environment, and the design of teaching activities are the key elements to improve students’ learning satisfaction. Therefore, in the future, efforts should be made to consider the learning connotation and activity design based on different experience learning scenarios to meet the exploration and experience learning needs.
(3) The interdisciplinary integration of the gamification environmental education App learning system’s construction can be executed to enhance the self-learning and awareness consciousness of caring for the sustainable development of the environment. In the future, efforts should be made to integrate related interdisciplinary resources to design environmentally sustainable development learning systems and to promote students’ ability to enact sustainable development of the environment during experience learning.
5.4. Research Limitations and Suggestions for Future Research
As the measurement of this study only uses the scale of literature sources, the PPM theory is adopted as the source of the questionnaire questions, and the quality research of expert interviews is not considered to understand whether there are any deficiencies in the theoretical constructs. The biggest limitation in quantitative surveys lies in the representativeness of the samples. In this regard, the issue of how to promote the factors of SI in gamification environmental education apps should be the top priority. The following is a list of several possible future research directions. (1) Factors affecting behavioral intentions of gamification environmental education apps can be complemented through greater in-depth qualitative interviews with industry experts to explore what are the key factors affecting the SI, thereby enhancing the predictive power of the model. (2) Future studies can conduct qualitative research interviews with experts to make up for the lack of quantitative research. It is further suggested that this model can be extended to include interference factors, such as gender and involvement, to observe whether the level of involvement has any regulated effect on the SI to set up limited resources in the interference variables to achieve maximum benefit. It will take a lot of time and cost to design and develop a serious educational game. Some of the cost must be consider such as teachers’ acceptance and student teamwork, communication and social development.
Acknowledgments
The authors would like to thanks the Ministry of Science and Technology, Taiwan under Contract No. MOST 107-2637-H-366-002-.
Conflicts of Interest
The author declares no conflict of interests.
References
- Ardoin, N.M.; DiGiano, M.; Bundy, J.; Chang, S.; Holthuis, N.; O’Connor, K. Using digital photography and journaling in evaluation of field-based environmental education programs. Stud. Educ. Eval. 2014, 41, 68–76. [Google Scholar] [CrossRef]
- Crohn, K.; Birnbaum, M. Environmental education evaluation: Time to reflect, time for change. Eval. Program Plan. 2010, 33, 155–158. [Google Scholar] [CrossRef] [PubMed]
- Zsóka, Á.; Szerényi, Z.M.; Széchy, A.; Kocsis, T. Greening due to environmental education? Environmental knowledge, attitudes, consumer behavior and everyday pro-environmental activities of Hungarian high school and university students. J. Clean. Prod. 2013, 48, 126–138. [Google Scholar] [CrossRef]
- Kopnina, H. Neoliberalism, pluralism and environmental education: The call for radical re-orientation. Environ. Dev. 2015, 15, 120–130. [Google Scholar] [CrossRef]
- Thomas, R.E.; Teel, T.L.; Bruyere, B.L. Seeking excellence for the land of paradise: Integrating cultural information into an environmental education program in a rural Hawai’ian community. Stud. Educ. Eval. 2014, 41, 58–67. [Google Scholar] [CrossRef]
- Clark, D.E.; Knapp, T.A.; White, N.E. Personal and Location-Specific Characteristics and Elderly Interstate Migration. Growth Chang. 1996, 27, 327–351. [Google Scholar] [CrossRef]
- Bansal, H.S.; Taylor, S.F.; St James, Y. “Migrating” to new service providers: Toward a unifying framework of consumers’ switching behaviors. J. Acad. Mark. Sci. 2005, 33, 96–115. [Google Scholar] [CrossRef]
- Moon, B. Paradigms in migration research: Exploring ‘moorings’ as a schema. Prog. Hum. Geogr. 1995, 19, 504–524. [Google Scholar] [CrossRef] [PubMed]
- Zhang, M.J. Using login data to monitor student involvement in a business simulation game. Int. J. Manag. Educ. 2015, 13, 154–162. [Google Scholar] [CrossRef]
- Anderson, K.S. Let the Games Begin: The Gaming Approach as an Alternative Paradigm in Nursing Education; North Carolina State University: Raleigh, NC, USA, 1998. [Google Scholar]
- Johnson, D.W.; Johnson, R.T. An educational psychology success story: Social interdependence theory and cooperative learning. Educ. Res. 2009, 38, 365–379. [Google Scholar] [CrossRef]
- Darban, M.; Kwak, D.-H.A.; Deng, S.L.; Srite, M.; Lee, S. Antecedents and consequences of perceived knowledge update in the context of an ERP simulation game: A multi-level perspective. Comput. Educ. 2016, 103, 87–98. [Google Scholar] [CrossRef]
- Loon, M.; Evans, J.; Kerridge, C. Learning with a strategic management simulation game: A case study. Int. J. Manag. Educ. 2015, 13, 227–236. [Google Scholar] [CrossRef]
- Hou, H.-T. Integrating cluster and sequential analysis to explore learners’ flow and behavioral patterns in a simulation game with situated-learning context for science courses: A video-based process exploration. Comput. Hum. Behav. 2015, 48, 424–435. [Google Scholar] [CrossRef]
- Prensky, M. Fun, play and games: What makes games engaging. Digit. Game-Based Learn. 2001, 5, 5–31. [Google Scholar]
- DeVries, D.L.; Edwards, K.J. Learning games and student teams: Their effects on classroom process. Am. Educ. Res. J. 1973, 10, 307–318. [Google Scholar] [CrossRef]
- Keller, J.M. Development and use of the ARCS model of instructional design. J. Instr. Dev. 1987, 10, 2–10. [Google Scholar] [CrossRef]
- Bonk, C.J.; King, K.S. Computer conferencing and collaborative writing tools: Starting a dialogue about student dialogue. In Proceedings of the First International Conference on Computer Support for Collaborative Learning, Bloomington, IN, USA, 17–20 October 1995. [Google Scholar]
- Ravenstein, E.G. The laws of migration. J. Stat. Soc. Lond. 1885, 48, 167–235. [Google Scholar] [CrossRef]
- Davis, F.D. Perceived usefulness, perceived ease of use, and user acceptance of information technology. MIS Q. 1989, 13, 319–340. [Google Scholar] [CrossRef]
- Ahn, T.; Ryu, S.; Han, I. The impact of Web quality and playfulness on user acceptance of online retailing. Inf. Manag. 2007, 44, 263–275. [Google Scholar] [CrossRef]
- Moon, J.-W.; Kim, Y.-G. Extending the TAM for a World-Wide-Web context. Inf. Manag. 2001, 38, 217–230. [Google Scholar] [CrossRef]
- Venkatesh, V.; Bala, H. Technology acceptance model 3 and a research agenda on interventions. Decis. Sci. 2008, 39, 273–315. [Google Scholar] [CrossRef]
- Chow, M.; Herold, D.K.; Choo, T.-M.; Chan, K. Extending the technology acceptance model to explore the intention to use Second Life for enhancing healthcare education. Comput. Educ. 2012, 59, 1136–1144. [Google Scholar] [CrossRef]
- Kim, D.J.; Ferrin, D.L.; Rao, H.R. A trust-based consumer decision-making model in electronic commerce: The role of trust, perceived risk, and their antecedents. Decis. Support Syst. 2008, 44, 544–564. [Google Scholar] [CrossRef]
- Lee, M.-C. Explaining and predicting users’ continuance intention toward e-learning: An extension of the expectation–confirmation model. Comput. Educ. 2010, 54, 506–516. [Google Scholar] [CrossRef]
- Nikou, S.A.; Economides, A.A. Mobile-based assessment: Investigating the factors that influence behavioral intention to use. Comput. Educ. 2017, 109, 56–73. [Google Scholar] [CrossRef]
- Teo, T.; Noyes, J. An assessment of the influence of perceived enjoyment and attitude on the intention to use technology among pre-service teachers: A structural equation modeling approach. Comput. Educ. 2011, 57, 1645–1653. [Google Scholar] [CrossRef]
- Yang, H.-H.; Su, C.-H. Learner Behaviour in a MOOC Practice-oriented Course: In Empirical Study Integrating TAM and TPB. Int. Rev. Res. Open Distrib. Learn. 2017. [Google Scholar] [CrossRef]
- Chen, P.-Y.; Hitt, L.M. Measuring switching costs and the determinants of customer retention in Internet-enabled businesses: A study of the online brokerage industry. Inf. Syst. Res. 2002, 13, 255–274. [Google Scholar] [CrossRef]
- Devaraj, S.; Fan, M.; Kohli, R. Antecedents of B2C channel satisfaction and preference: Validating e-commerce metrics. Inf. Syst. Res. 2002, 13, 316–333. [Google Scholar] [CrossRef]
- Wu, L.; Chen, J.-L. An extension of trust and TAM model with TPB in the initial adoption of on-line tax: An empirical study. Int. J. Hum-Comput. Stud. 2005, 62, 784–808. [Google Scholar] [CrossRef]
- Claes, F. A national customer satisfaction barometer: The Swedish experience. J. Mark. 1992, 56, 6–21. [Google Scholar]
- Ajzen, I. From Intentions to Actions: A Theory of Planned Behavior Action Control; Springer: New York, NY, USA, 1985; pp. 11–39. [Google Scholar]
- Ajzen, I. Attitude Structure and Behavior in AR Pratkanis, SJ Breckler, and AG Greenwald. Attitude Structure and Function; Erlbaum: Hillsdale, NJ, USA, 1989; pp. 241–274. [Google Scholar]
- Fishbein, M.; Ajzen, I. Belief, Attitude, Intention and Behavior: An Introduction to Theory and Research; Addison-Wesley: Reading, MA, USA, 1975. [Google Scholar]
- Hirschman, E.C.; Holbrook, M.B. Hedonic consumption: Emerging concepts, methods and propositions. J. Mark. 1982, 46, 92–101. [Google Scholar] [CrossRef]
- Sherry, J.F., Jr. A sociocultural analysis of a Midwestern American flea market. J. Consum. Res. 1990, 17, 13–30. [Google Scholar] [CrossRef]
- Scarpi, D. Hedonic and utilitarian behaviour in specialty shops. Mark. Rev. 2005, 5, 31–44. [Google Scholar] [CrossRef]
- Babin, B.J.; Darden, W.R.; Griffin, M. Work and/or fun: Measuring hedonic and utilitarian shopping value. J. Consum. Res. 1994, 20, 644–656. [Google Scholar] [CrossRef]
- Gopal, A.; Bostrom, R.P.; Chin, W.W. Applying adaptive structuration theory to investigate the process of group support systems use. J. Manag. Inf. Syst. 1992, 9, 45–69. [Google Scholar] [CrossRef]
- Daft, R.; Lengel, R. Information Richness: A New Approach to Managerial Behaviour and Organizational Design. Res. Organ. Behav. 1984, 6, 191–233. [Google Scholar]
- Engel, J.F.; Blackwell, R.D.; Miniard, P.W. Consumer Behavior Orlando: Fort Worth; Dryden Press: New York, NY, USA, 1993. [Google Scholar]
- Rice, R.E. Media appropriateness. Hum. Commun. Res. 1993, 19, 451–484. [Google Scholar] [CrossRef]
- Dennis, A.R.; Kinney, S.T. Testing media richness theory in the new media: The effects of cues, feedback, and task equivocality. Inf. Syst. Res. 1998, 9, 256–274. [Google Scholar] [CrossRef]
- Wang, W.; Hsieh, J.P.-A.; Song, B. Understanding user satisfaction with instant messaging: An empirical survey study. Int. J. Hum-Comput. Interact. 2012, 28, 153–162. [Google Scholar] [CrossRef]
- Sullivan, J. What are the functions of corporate home pages? J. World Bus. 1999, 34, 193–210. [Google Scholar] [CrossRef]
- Coyle, J.R.; Thorson, E. The effects of progressive levels of interactivity and vividness in web marketing sites. J. Advert. 2001, 30, 65–77. [Google Scholar] [CrossRef]
- Lee, E.S. A theory of migration. Demography 1966, 3, 47–57. [Google Scholar] [CrossRef]
- Ajzen, I.; Fishbein, M. Understanding Attitudes and Predicting Social Behaviour; Prentice-Hall: Upper Saddle River, NJ, USA, 1980. [Google Scholar]
- Taylor, S.; Todd, P.A. Understanding information technology usage: A test of competing models. Inf. Syst. Res. 1995, 6, 144–176. [Google Scholar] [CrossRef]
- Davis, F.D.; Bagozzi, R.P.; Warshaw, P.R. User acceptance of computer technology: A comparison of two theoretical models. Manag. Sci. 1989, 35, 982–1003. [Google Scholar] [CrossRef]
- Ho, C.-I.; Lee, Y.-L. The development of an e-travel service quality scale. Tour. Manag. 2007, 28, 1434–1449. [Google Scholar] [CrossRef]
- Parasuraman, A.; Zeithaml, V.A.; Malhotra, A. ES-QUAL: A multiple-item scale for assessing electronic service quality. J. Serv. Res. 2005, 7, 213–233. [Google Scholar] [CrossRef]
- Oliver, R.L.; Swan, J.E. Consumer perceptions of interpersonal equity and satisfaction in transactions: A field survey approach. J. Mark. 1989, 53, 21–35. [Google Scholar] [CrossRef]
- Chen, L.-D.; Tan, J. Technology Adaptation in E-commerce: Key Determinants of Virtual Stores Acceptance. Eur. Manag. J. 2004, 22, 74–86. [Google Scholar] [CrossRef]
- Cronbach, L.J. Coefficient alpha and the internal structure of tests. Psychometrika 1951, 16, 297–334. [Google Scholar] [CrossRef]
- Chin, W.W. The partial least squares approach to structural equation modeling. Mod. Methods bus. Res. 1998, 295, 295–336. [Google Scholar]
- Fornell, C.; Johnson, M.D.; Anderson, E.W.; Cha, J.; Bryant, B.E. The American customer satisfaction index: Nature, purpose, and findings. J. Mark. 1996, 60, 7–18. [Google Scholar] [CrossRef]
- Hock, C.; Ringle, C.M.; Sarstedt, M. Management of multi-purpose stadiums: Importance and performance measurement of service interfaces. Int. J. Serv. Technol. Manag. 2010, 14, 188–207. [Google Scholar] [CrossRef]
- Hulland, J. Use of partial least squares (PLS) in strategic management research: A review of four recent studies. Strateg. Manag. J. 1999, 20, 195–204. [Google Scholar] [CrossRef]
- Kristensen, K.; Martensen, A.; Gronholdt, L. Customer satisfaction measurement at post Denmark: Results of application of the European customer satisfaction index methodology. Total Qual. Manag. 2000, 11, 1007–1015. [Google Scholar] [CrossRef]
- Slack, N. The importance-performance matrix as a determinant of improvement priority. Int. J. Oper. Prod. Manag. 1994, 14, 59–75. [Google Scholar] [CrossRef]
- Völckner, F.; Sattler, H.; Hennig-Thurau, T.; Ringle, C.M. The role of parent brand quality for service brand extension success. J. Serv. Res. 2010, 13, 379–396. [Google Scholar] [CrossRef]
- Reinartz, W.; Haenlein, M.; Henseler, J. An empirical comparison of the efficacy of covariance-based and variance-based SEM. Int. J. Res. Mark. 2009, 26, 332–344. [Google Scholar] [CrossRef]
- Fornell, C.; Larcker, D.F. Structural equation models with unobservable variables and measurement error: Algebra and statistics. J. Mark. Res. 1981, 18, 382–388. [Google Scholar] [CrossRef]
- Segars, A.H.; Grover, V. Strategic information systems planning success: An investigation of the construct and its measurement. MIS Q. 1998, 22, 139–163. [Google Scholar] [CrossRef]
- Hair, J.F.; Ringle, C.M.; Sarstedt, M. PLS-SEM: Indeed a silver bullet. J. Mark. Theory Pract. 2011, 19, 139–152. [Google Scholar] [CrossRef]
- Rigdon, E.E. Rethinking partial least squares path modeling: In praise of simple methods. Long Range Plan. 2012, 45, 341–358. [Google Scholar] [CrossRef]
- Tenenhaus, M.; Amato, S.; Esposito Vinzi, V. A global goodness-of-fit index for PLS structural equation modelling. Proc. XLII SIS Sci. Meet. 2004, 1, 739–742. [Google Scholar]
- Cohen, J. Statistical Power Analysis for the Behavioral Sciences, 2nd ed.; Erlbaum Associates: Hillsdale, MI, USA, 1988. [Google Scholar]
- Geisser, S. A predictive approach to the random effect model. Biometrika 1974, 61, 101–107. [Google Scholar] [CrossRef]
- Stone, M. Cross-validatory choice and assessment of statistical predictions. J. R. Stat. Soc. Ser. B Methodol. 1974, 36, 111–147. [Google Scholar]
- Tenenhaus, M.; Vinzi, V.E.; Chatelin, Y.-M.; Lauro, C. PLS path modeling. Comput. Stat. Data Anal. 2005, 48, 159–205. [Google Scholar] [CrossRef]
- Wetzels, M.; Odekerken-Schröder, G.; Van Oppen, C. Using PLS path modeling for assessing hierarchical construct models: Guidelines and empirical illustration. MIS Q. 2009, 33, 177–195. [Google Scholar] [CrossRef]
- Chang, Y.-L.; Hou, H.-T.; Pan, C.-Y.; Sung, Y.-T.; Chang, K.-E. Apply an augmented reality in a mobile guidance to increase sense of place for heritage places. Educ. Technol. Soc. 2015, 18, 166–178. [Google Scholar]
- Ibáñez, M.-B.; Di-Serio, Á.; Villarán-Molina, D.; Delgado-Kloos, C. Augmented reality-based simulators as discovery learning tools: An empirical study. IEEE Trans. Educ. 2015, 58, 208–213. [Google Scholar] [CrossRef]
- Su, C.-H. The effects of students’ motivation, cognitive load and learning anxiety in gamification software engineering education: A structural equation modeling study. Multimedia Tools Appl. 2016, 75, 10013–10036. [Google Scholar] [CrossRef]
- Su, C. Designing and Developing a Novel Hybrid Adaptive Learning Path Recommendation System (ALPRS) for Gamification Mathematics Geometry Course. Eurasia J. Math. Sci. Technol. Educ. 2017, 13, 2275–2298. [Google Scholar] [CrossRef]
- Su, C.H.; Cheng, C.H. A mobile gamification learning system for improving the learning motivation and achievements. J. Comput. Assist. Learn. 2015, 31, 268–286. [Google Scholar] [CrossRef]
- Aldas-Manzano, J.; Ruiz-Mafe, C.; Sanz-Blas, S.; Lassala-Navarre, C. Internet banking loyalty: Evaluating the role of trust, satisfaction, perceived risk and frequency of use. Serv. Ind. J. 2011, 31, 1165–1190. [Google Scholar] [CrossRef]
- De Jong, G.F.; Fawcett, J.T. Motivations for migration: An assessment and a value-expectancy research model. In Migration Decision Making; Elsevier: London, UK, 1981. [Google Scholar]
- Engel, J.; Blackwell, R.; Miniard, P. Consumer Behavior; Fort Engel, J.F., Kollat, D.T., et Blackwelle, R.D., Eds.; Holt, Rinehart &Winston: New York, NY, USA, 1993. [Google Scholar]
- Ennew, C.T.; Banerjee, A.K.; Li, D. Managing word of mouth communication: Empirical evidence from India. Int. J. Bank Mark. 2000, 18, 75–83. [Google Scholar] [CrossRef]


© 2018 by the author. Licensee MDPI, Basel, Switzerland. This article is an open access article distributed under the terms and conditions of the Creative Commons Attribution (CC BY) license (http://creativecommons.org/licenses/by/4.0/).