Article

Sustainable Living in Finland: Combating Climate Change in Everyday Life

1
R&D Department, Metropolia University of Applied Sciences, 00079 Helsinki, Finland
2
Faculty of Educational Sciences, University of Helsinki, 00014 Helsinki, Finland
3
Faculty of Education, University of Tampere, 33014 Tampere, Finland
*
Author to whom correspondence should be addressed.
Sustainability 2018, 10(1), 104; https://doi.org/10.3390/su10010104
Submission received: 12 December 2017 / Revised: 29 December 2017 / Accepted: 2 January 2018 / Published: 4 January 2018
(This article belongs to the Section Sustainable Urban and Rural Development)

Abstract

:
Finland aims to be a carbon-neutral society by the year 2050. We are interested to know on a general level how sustainable living materializes among Finnish people, what is the structure of a sustainable lifestyle in Finland and how do people reason about their everyday behavior choices in the context of sustainability in order to combat climate change. The data (n = 2052) were collected by questionnaire in April 2017. They were corrected by sex, age and residential area to be representative of the population of Finland (18–79 years old). We applied mixed methods. A principal axis factoring was conducted on the 32 variables with orthogonal rotation (varimax). Six factors explained 65.2% of the variance. The respondents were also able to write why they considered the specific variable to be important for them. We classified 2811 reasonings. According to our results, Finns have become conscious of climate change, but carbon reduction has not become mainstream in their everyday life. Circulation and preventing loss of materials show a promising start to a Finn’s sustainable way of living. Recycling has been automated so that it is part of a Finn’s everyday routine and habits. Finns also favor domestic food and products. They are interested in the origin of materials. Essential reasons for that are supporting the local economy and ensuring a good employment rate for the state. Smart, carbon-free mobility is a challenge. Finns seem to estimate that their personal car use is already at the proper level. On the other hand, even one fifth reported consideration of environmental effects when planning holidays.

1. Introduction

The influences on Earth by mankind have become stronger in the last few centuries. Humans are moving further from sustainability than ever before in history [1,2]. About 74% of the observed global warming is due to human activity [3]. Thus, human-incurred changes occur more quickly than do natural planetary changes. Due to this shift, a new geological era has started [4]. The era of the Anthropocene is based on the effect that is caused together with population growth and mainstreaming mass consumption [5]. Sustainable living is an imperative in the era of the Anthropocene because the power of humans is now stronger than ever.
Every extensive challenge of the future has ecological and social backgrounds. All materials needed by humankind are taken from nature and returned to nature [6]. Your life and mine are fully dependent on the biosphere: clean air, fresh water and food [7]. Hence, there is a hierarchy that states that humans cannot exist without nature, and without a society, there cannot be economy [8,9].
In the era of the Anthropocene, climate change is the greatest threat to mankind [10,11,12,13,14]. Warming continued in 2016, setting a new temperature record approximately 1.1 °C above the pre-industrial period and 0.06 °C above the previous highest value set in 2015. Carbon dioxide (CO2) reached new highs at 400.0 ± 0.1 ppm in the atmosphere at the end of 2015. The extent of global sea-ice dropped more than 4 million km2 below average. Globally-averaged surface mole fractions for CO2, methane (CH4) and nitrous oxide (N2O) reached new highs in 2015, with CO2 at 400.0 ± 0.1 ppm, CH4 at 1 845 ± 2 parts per billion (ppb) and N2O at 328.0 ± 0.1 ppb. These values constitute, respectively, 144%, 256% and 121% of pre-industrial (before 1750) levels [15]. The global land and ocean temperature for September 2017 was 0.78 °C higher than the 20th century average of 15.0 °C. This was the fourth highest September temperature on record for the globe since records began in 1880. The 10 warmest Septembers have occurred during the 21st Century, specifically since 2003 [16].
Fifteen thousand three hundred sixty four scientists from 184 countries argue that the reduction of carbon emissions is needed rapidly to protect young people, future generations and nature [17]. Transforming lifestyles and societies is not easy. However, there are many promising examples of good progress in our history, such as longer life spans and decreasing mortality in under-five-year-old children. It is also evident that basic education is now available in almost every country [18,19]. In 2002, the United Nations summit on sustainable development stated the remarkable ecological and social disadvantages of lead in gasoline in Sub-Saharan Africa. Oil companies took up the gauntlet. In four years, leaded gasoline disappeared from the market [20]. A successful and promising example of human power is also putting an end to ozone depletion. In 1985, the world took the first significant step in Vienna. A common threat to all life on Earth was recognized, and the necessary steps for prevention were taken straight away. Currently, ozone depletion is not a threat to life on Earth [21]. Four decisive steps are typical for systemic changes in societies: (a) scientific consensus of the threat, (b) enlightening people about the threat, (c) developing alternative technological solutions and (d) effective international cooperation [22].
Several studies show that most people respond positively, but passively, to the increasing need of a sustainable way of living in their everyday lives [23,24,25,26]. In Finland, the standard way of life today is far from sustainable. If everyone on Earth consumed like the average Finnish citizen, four Earths would be needed in order to fulfil humans’ material needs. The average carbon footprint in a Finnish household is 10 tonnes of CO2. The sustainable carbon footprint is less than 2.5 tonnes [27,28]. Housing accounts for 30% (three tonnes), consumption and waste for 31% (3.1 tonnes), transportation and mobility for 21% (2.1 tonnes) and food for 17% (1.7 tonnes) [29]. Finland has the highest ecological footprint of the Nordic countries (total global hectares per capita 6.7) [30], and the carbon dioxide emissions of Finnish consumption are the ninth highest in the world [31].
It is promising that the majority of 15–29-year-old Finnish people (78%) express the opinion that they would act pro-environmentally even when others do not [32]. Seventy two percent agrees that striving for continuous economic growth will ultimately lead to the destruction of nature and human life [33]. However, Finns share the worldwide problem of being “unmoved”: the majority acknowledge that climate change is a serious problem caused by humans, but still personally continue to overconsume [34]. Thus, it seems that radical behavioral changes are required.
The purpose of this work is to research sustainable living in a Finn’s everyday life. We analyze sustainable living in the context of minimizing direct and indirect influences on climate change. We are not interested in knowing the attitudes or values of citizens, but the real implementation of sustainability in daily life. What we do is focus on the Finnish population in a holistic way, that is without demographics. Our specific research questions are
(a)
How does sustainable living materialize among Finnish people?
(b)
What is the general structure of a sustainable lifestyle in Finland?
(c)
How do people argue their everyday behavior choices and decisions in the context of sustainability?

2. Categories of Sustainable Living

The features of a sustainable and desirable future can be relatively similar despite people’s age, education, vocation or cultural background. Most people in the world think that, for instance, increasing congestion is not the right course of development, but instead increasing healthy years of life is an example of a desirable future we want to have. Typically, long life expectancy is linked with well-being. A challenge is, however, that people tend to overestimate the life satisfaction they derive from money and material possessions. They also underestimate the benefits from more time spent with family and friends [18]. Thus, a long, healthy and happy life is achievable in societies where the carbon dioxide equivalent is remarkably small compared to the affluent societies [35]. The main challenge is here: achieving any given global temperature stabilization requires even steeper greenhouse gas emission reductions than previously calculated [36].
Typically, four main categories for transitioning to a sustainable society can be identified. The categories are: sustainable food and agriculture, sustainable housing and energy, sustainable consumption and sustainable mobility [37].
Sustainable food and agriculture: Food production and consumption are the most important contributors to global warming in Europe. The share is greater than the climate change effect caused by housing and transport [38,39]. In Finland, food choices constitute one sixth of the average Finnish carbon footprint [29].
Globally, livestock accounts for up to 18% of the global warming effect [40]. Crops are mostly used for animal feed instead of feeding humans [41]. Beef is estimated to be ten-times more carbon intensive than fish and three-times more than pork or chicken [27,42]. A standard meat-based diet in Finland produces 1.5 tonnes of CO2, a vegetarian diet 0.9 tonnes and a vegan diet 0.5 tonnes. A high meat diet is estimated to be four-times more emission intensive than a vegan diet [29].
In Finland, a vegan diet would reduce agricultural emissions by 48% and overall food system emissions by 34% compared to the average Finnish diet [43]. However, meat consumption has increased by 24% between 1966 and 2006 in Finland. At the same time, milk consumption has halved, and carbon-intensive cheese consumption has more than tripled (+348%) [44]. As a result of reducing the fraction of animal-sourced foods in human diets, dual ecological and health benefits can be reached [45]. There are promising signs of a change in ecological consumer behavior. The market in organic agricultural products grew in Finland by around 24% in 2012 [46]. A transition to socially-fairer production and consumption habits is indicated by the fact that in 2012, fair trade grew globally by 21% and in Finland by 48%. In Switzerland, the market share of fair trade bananas has been 55–60% in recent years [47].
Globally, 30–50% of all food produced ends up as food waste [48]. Avoiding food waste has a multiple times more significant effect on emissions than avoiding food packaging [27]. An average Finn produces 23 kg of food waste per year [49].
Sustainable housing and energy: Housing and energy constitute nearly a third of the average Finnish carbon footprint. The majority (75%) of these emissions accounts for heating energy, of which one third is used for water heating [29]. Heated living area has greatly increased because the average living space per person has more than doubled (+113%) between 1970 and 2016 [50]. On the other hand, the energy use for household lighting in Finland decreased by almost a third (30%) between 2010 and 2015. The energy use by household appliances has also decreased by 13% [51]. The growth in the cleantech sector, which focuses on energy and material efficiency, was approximately 30% in 2013 [52]. Unfortunately, energy upgrades may cause a rebound effect: an estimated 5–15% of emissions saved by energy efficiency improvements are spent elsewhere, causing carbon emissions [53].
Sustainable consumption: Consumption of goods and services including waste management is responsible for a third (31%) of the average Finnish carbon footprint. An average Finn produces 330 kg of household waste per year [29]. The recycle rate of household waste is 41%; this is below the average level (45%) in the EU [54]. Still, recycling is among the first examples of a sustainable lifestyle in Finland. In 2006, one in three Finnish households sorted cardboard packaging, but in 2012, 61% of households made efforts to ensure that cardboard packaging could be recycled [55]. In the context of climate change, however, the effect of recycling is rather small, only 2% [29]. Moreover, environmental aspects of consumption are still mostly inferior compared to experienced fluency and comfort together with personal and family well-being at all income levels [56].
Sustainable mobility: Mobility and transportation constitute a fifth of the average Finnish carbon footprint [29]. An average Finn uses a car for 32 km a day; this amounts to 12,000 km per year with 1.7 passengers on board on average. Public transportation travel has halved in Finland between 1974 (15%) and 2011 (8%). [57,58]. Car travel and holidays abroad have become the norm in Finnish society. High-carbon overnight leisure travel abroad has almost doubled (+98%) among Finns between 2005 and 2015 [59]. In contrast, low-carbon trips by walking and cycling have decreased 5% between 2005 and 2011 [57]. There is local variation in sustainable living. For example, use of public transportation has increased by 28% in Espoo during 2005–2015 [60]. However, the mobility trend in Finland is still in general increasingly carbon-intensive.
There is a promising global trend in transport and mobility. Especially in cities, people are more often moving from ownership of cars to use of mobility services. Vehicles are replaced by access of seamless collective mobility services such as public transport. In Stockholm, Sweden, only one in ten 18-year-olds obtains a driving license [61]. This trend is also identified in Helsinki, Finland [62].

3. Materials and Methods

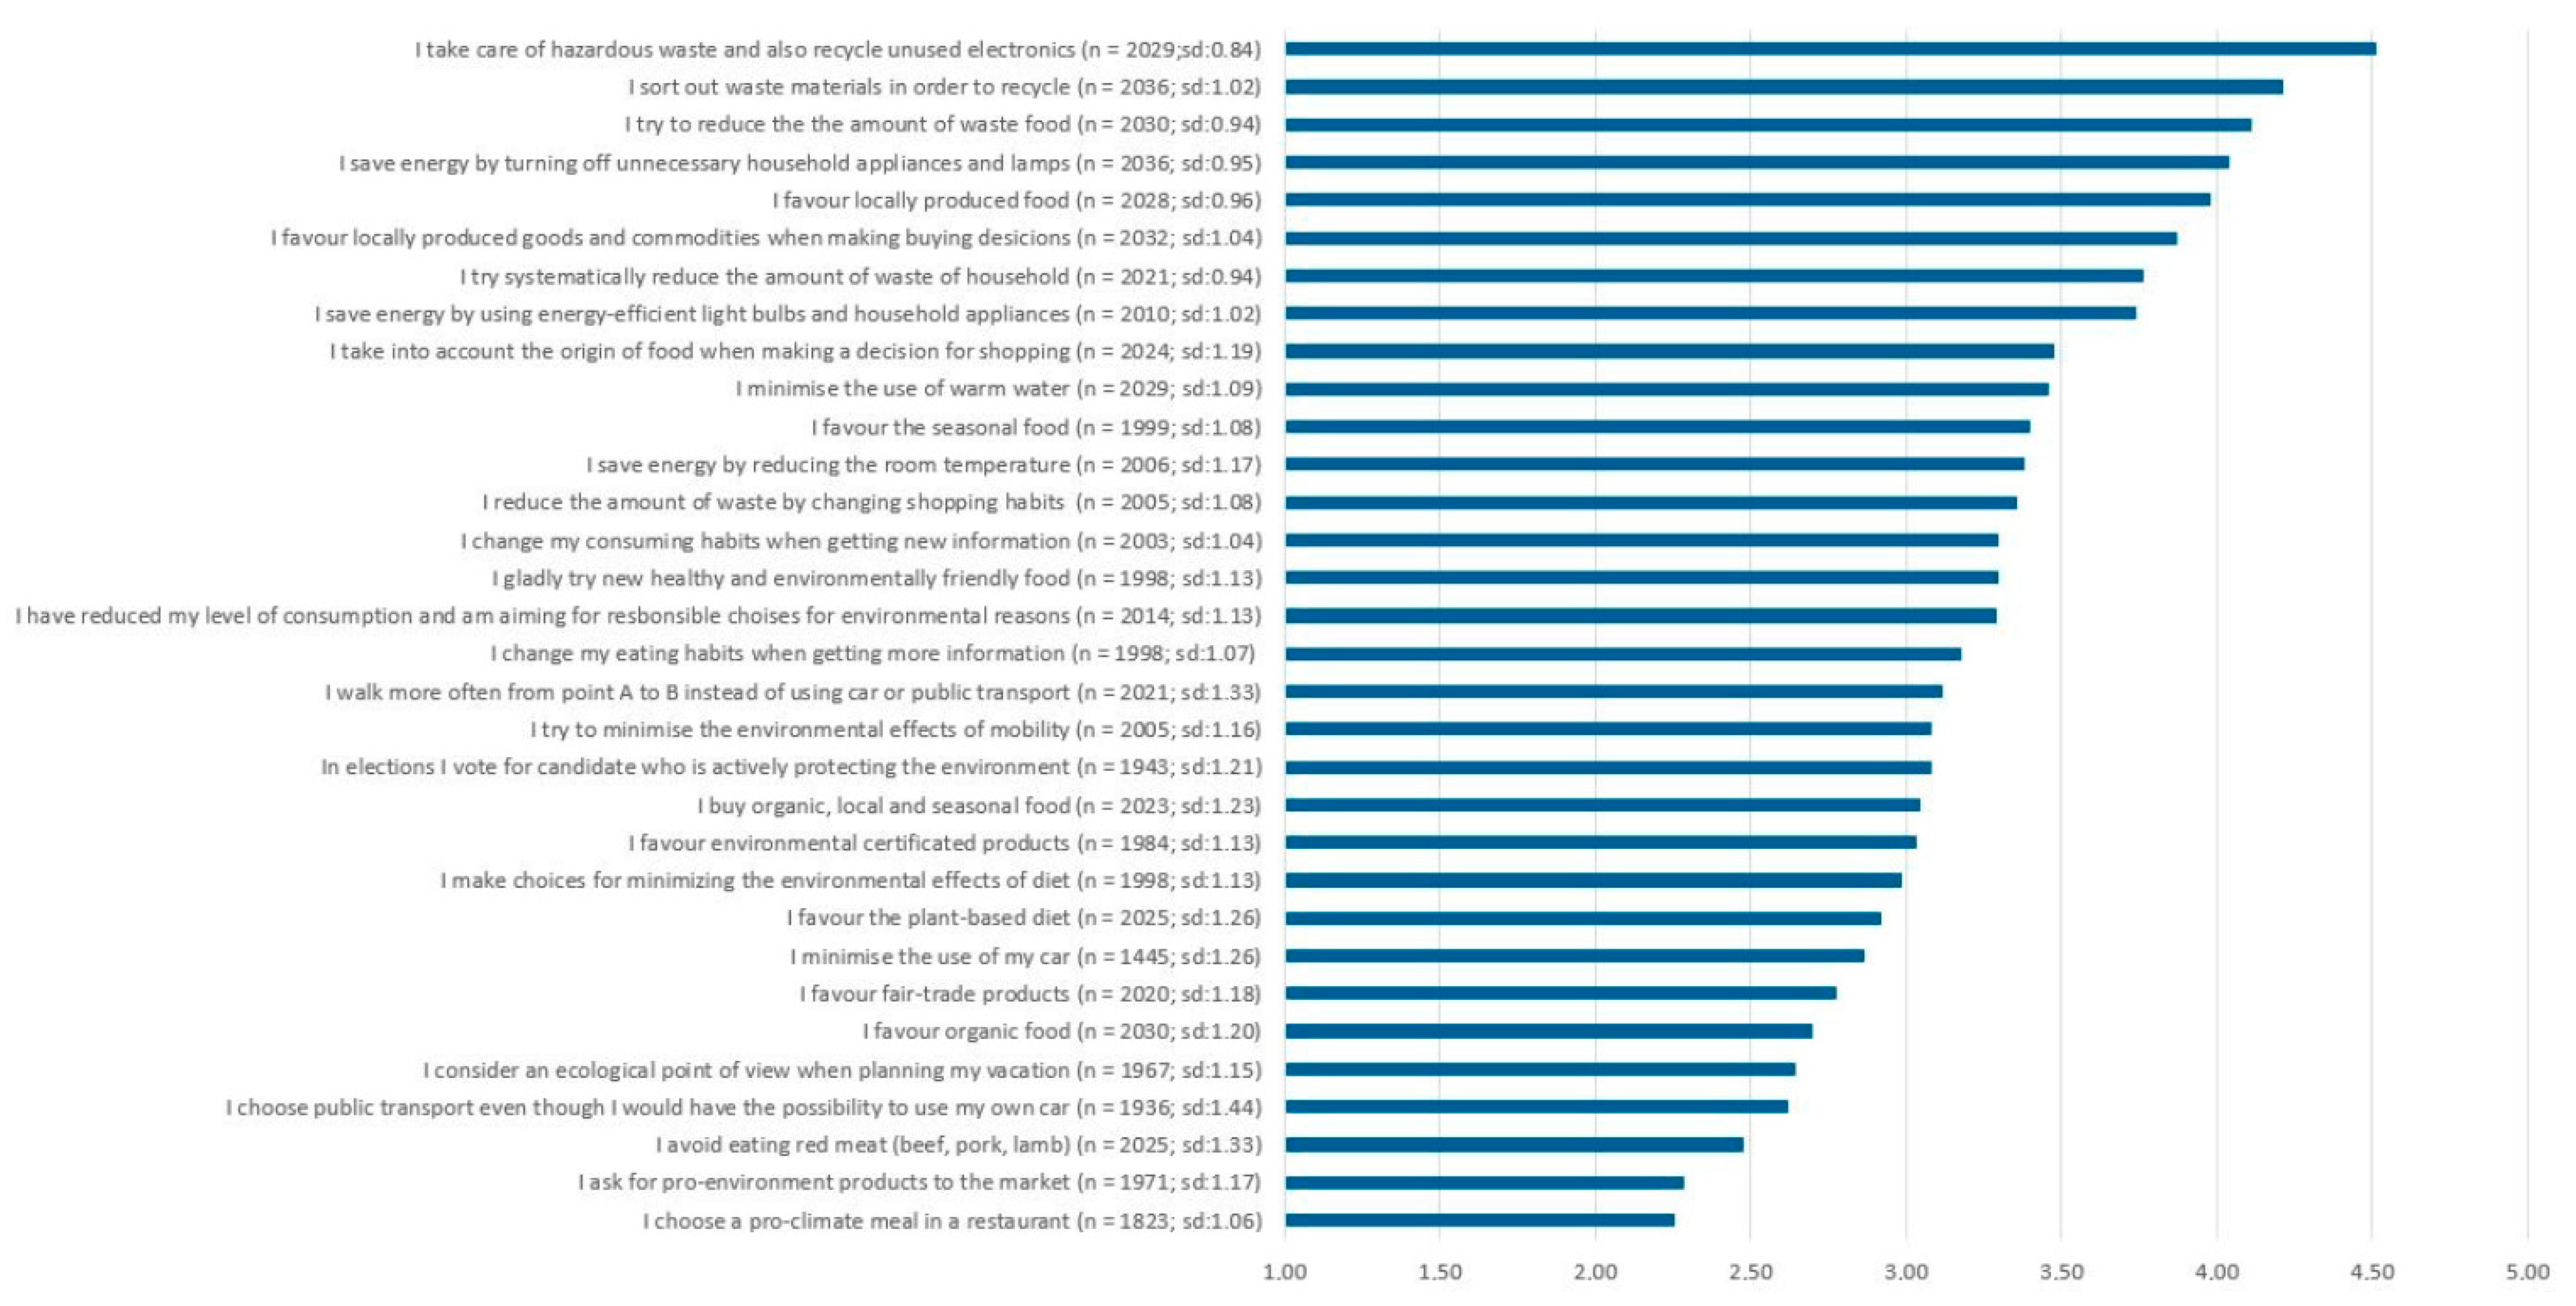
The data were collected by questionnaire in April 2017. The questionnaire was pretested and the propositions improved in accordance with feedback. A sample (n = 2052) was corrected by sex, age and residential area to correspond to the population of Finland. Therefore, the sample of 1030 woman and 1022 men represented the population of Finland (18–79 years old). Respondents were asked to respond to 46 propositions about the sustainable way of life. The response pattern followed a 5-point Likert scale (1 = totally disagree, 5 = totally agree) and open questions.
We applied mixed methods. A principal axis factoring was conducted on the 46 variables. Consistency of the measure was maximized by deleting variables that improved overall reliability. We ended up with 32 variables with orthogonal rotation (varimax). The Kaiser–Meyer–Olkin measure verified the sampling adequacy for the analysis (KMO = 0.96), which is well above the acceptable limit [63]. Bartlett’s test of sphericity, χ2 (496) = 22,304.2, p < 0.000, indicated that correlations between variables were sufficiently large for principal axis factoring. With the correlation matrix, we verified that the correlations were not too strong (>0.8), so that the multicollinearity would prevent presenting results [64]. The lowest loading included in the analysis was 0.38, which surpassed the limit of 0.32 defined by Tabachnik and Fidel [65].
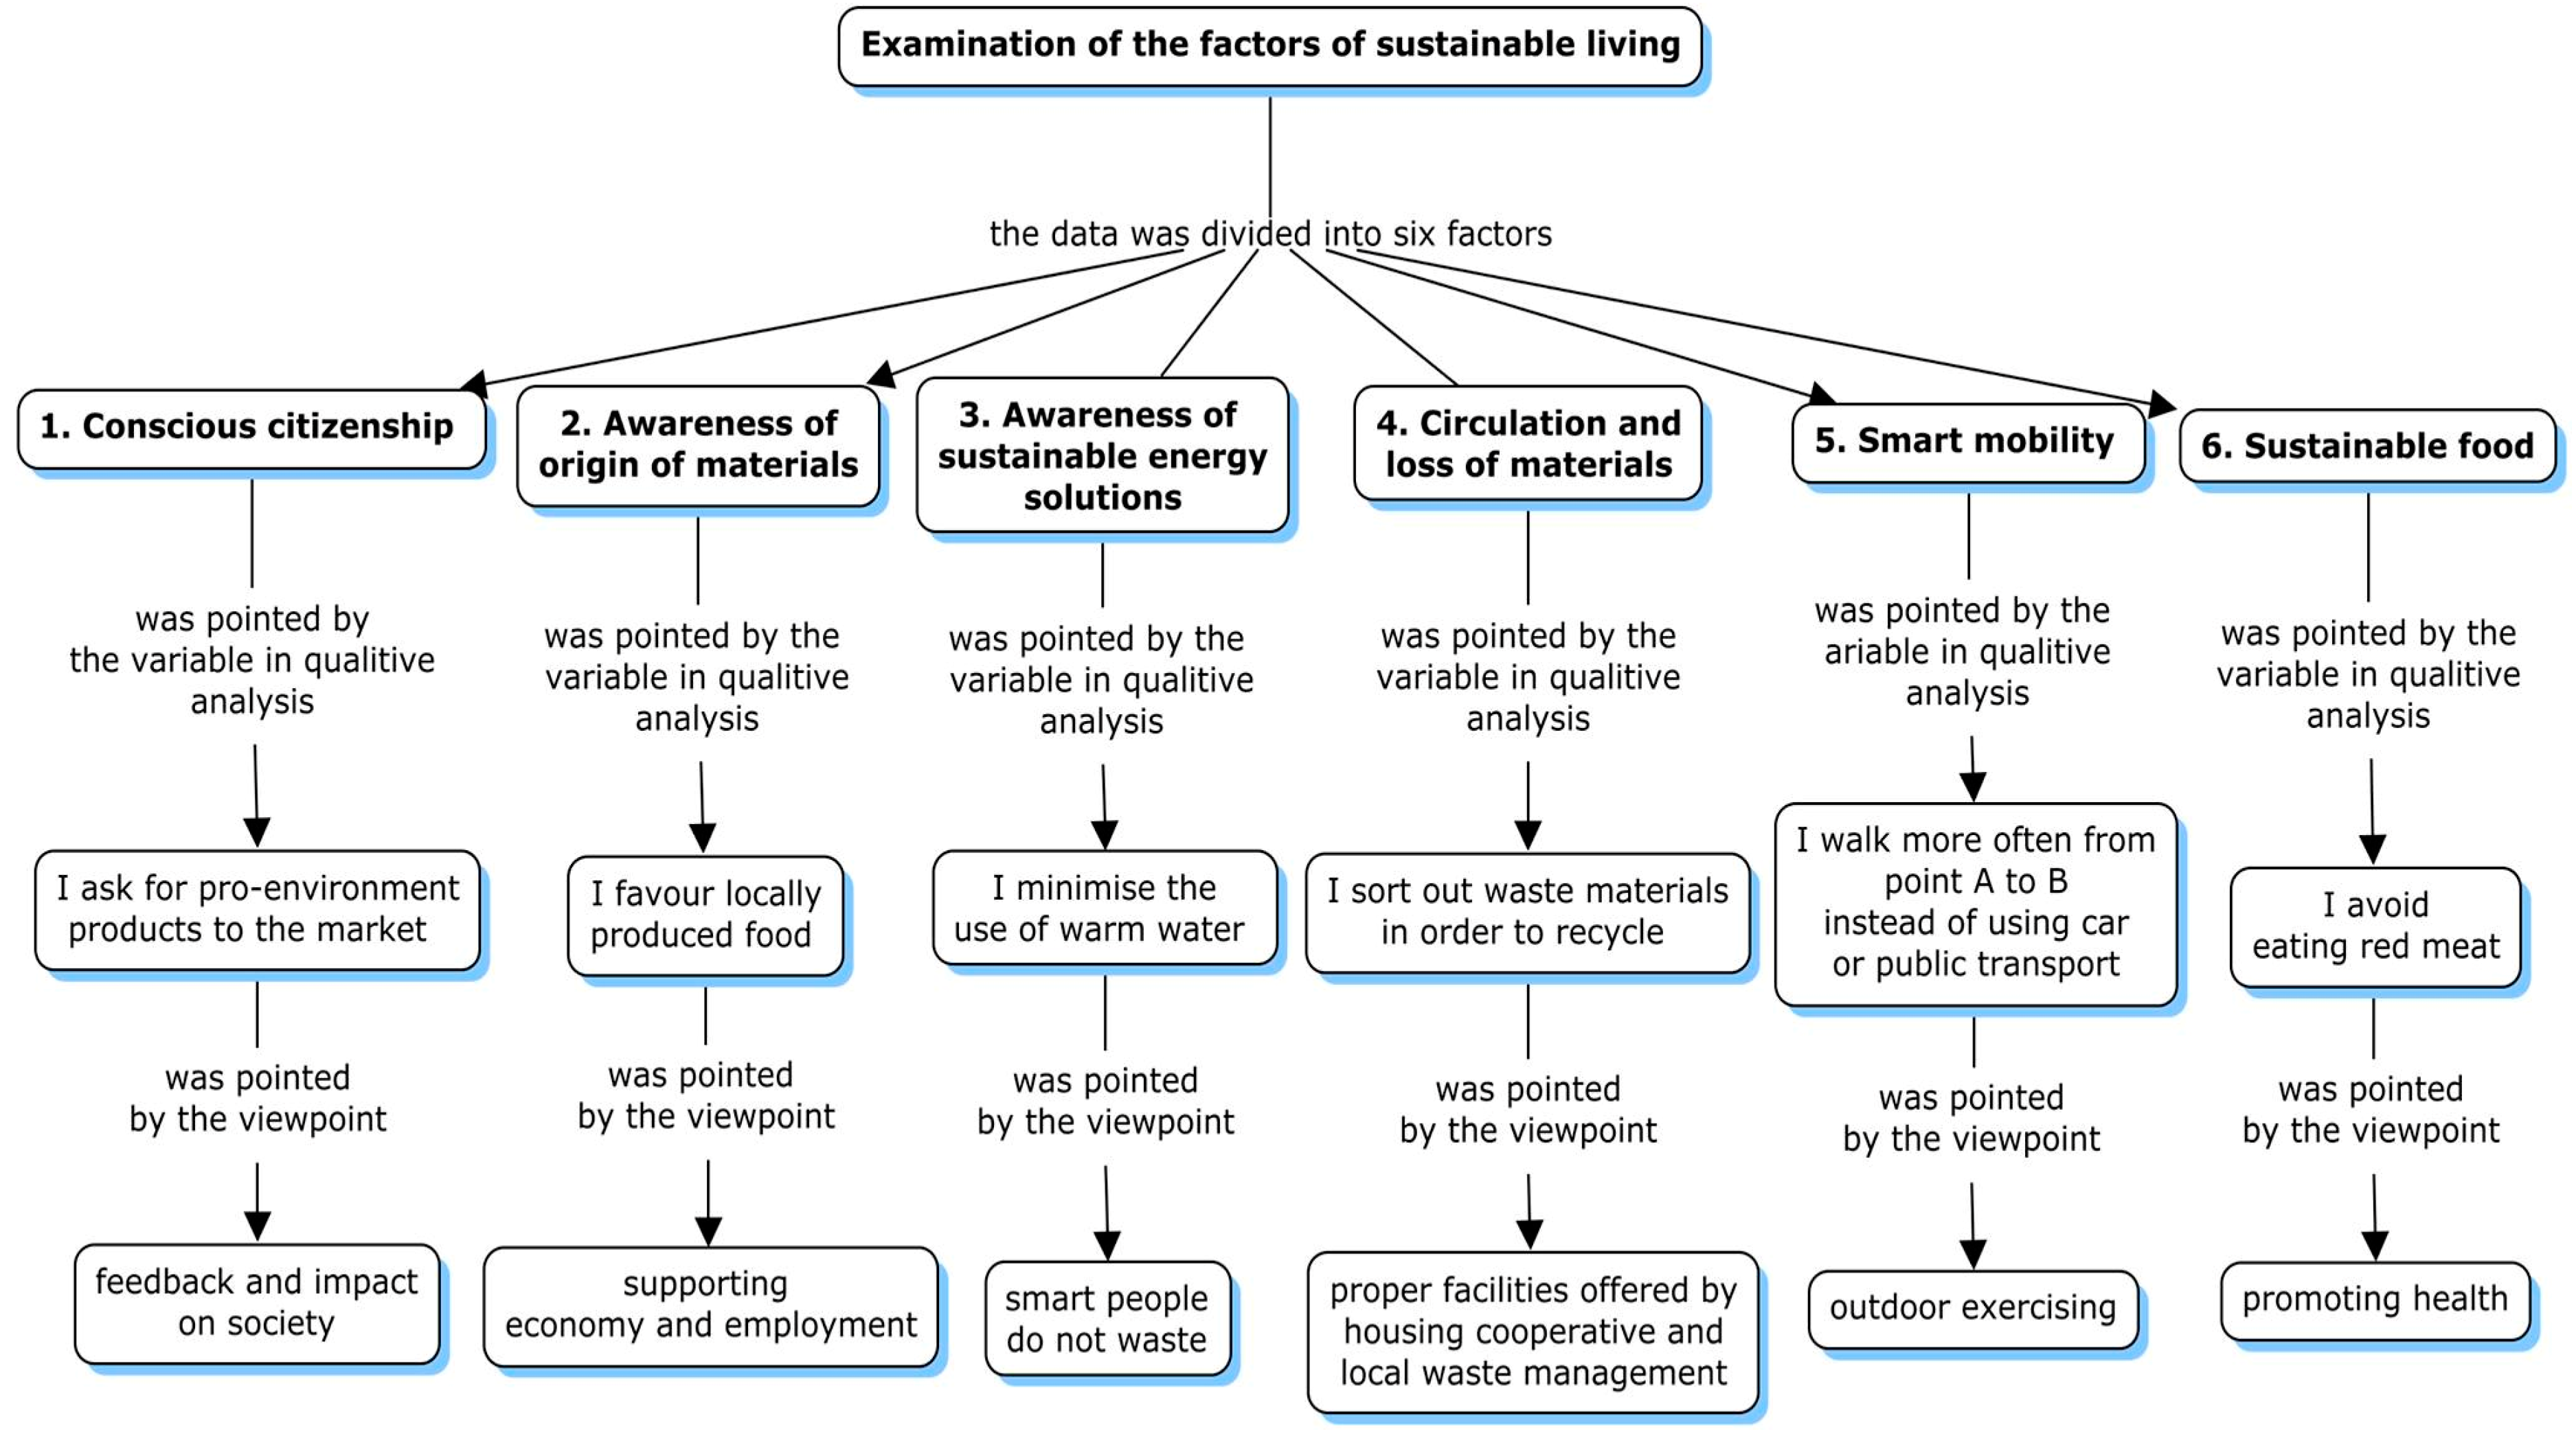
The respondents were able to explain why they considered the specific proposition to be important for them. After the principal axis factoring, we classified 2811 written reasonings. By classifying these open questions, it was possible to get complementary information to be added to the quantitative analysis. The most emphasized variable from each factor was analyzed by qualitative analysis using point rating. Thus, our qualitative analysis contained quantitative examination [66]. Counting the frequencies of these qualitative themes does not reduce the “qualitativity” of analysis, but brings another dimension [67]. The answer written as an open question for different variables of sustainable living was analyzed by the crucial proposition of the respondent. The general viewpoints were termed based on how they best described the propositions made by the respondents. The viewpoints (reasons) made from each variable can be seen as a general concept [68].

4. Results

4.1. Sustainability in Everyday Life

Descriptive statistics of the data were interesting. In Figure 1, we present descriptive information about the 32 variables. Four variables of sustainable living materialized frequently among the respondents (mean ≥ 4). The common denominator for the three most-favored variables was recycling and reduction of waste: I take care of hazardous waste and also recycle unused electronics (mean 4.51), I sort out waste materials in order to recycle (mean 4.21), and I try to reduce the amount of waste food (mean 4.11). The fourth variable that materialized frequently was I save energy by turning off unnecessary household appliances and lamps (mean 4.04).
Eighteen variables of sustainable living materialized occasionally among respondents (3 ≤ mean < 4). The very next variables to frequently materialize were I favor locally produced food (mean 3.98), I favor locally produced goods and commodities when making buying decisions (mean 3.87), I try systematically reduce the amount of waste of household (mean 3.76), and I save energy by using energy-efficient light bulbs and household appliances (mean 3.74).
Ten variables of sustainable living materialized rarely among respondents (mean < 3). The very next variables to occasionally materialize were I make choices for minimizing the environmental effects of diet (mean 2.99), I favor the plant-based diet (mean 2.92), I minimize the use of my car (mean 2.87), I favor fair-trade products (mean 2.77), and I favor organic food (mean 2.70). I choose a pro-climate meal in a restaurant was the rarest variable that materialized among the respondents (mean 2.26).

4.2. Structure of Sustainable Living

The data was divided into six factors which explained 65.2% of variance. We called the first factor conscious citizenship, which explained 40.1% of the variance. This factor is profiled as a generally descriptive factor for the sustainable way of living unlike the other factors where a certain sector of sustainability is described. The other five factors were named awareness of origin of materials, awareness of sustainable energy solutions, circulation and loss of materials, smart mobility and sustainable food (Table 1). Factors and rotated factor loadings are presented in Table 1. Bolded loadings over 0.38 are included in the interpretation. Cronbach’s alpha was used as a reliability analysis. It measures the consistency of the questionnaire. The overall reliability of a questionnaire is good because values are around 0.8 [69,70].

4.3. Qualitative Analysis of the Structure of Sustainable Living

Most loaded variables selected from the factors and the viewpoints emphasized by their qualitative analysis are visualized as a concept map (Figure 2).
Conscious citizenship: The most important reason for asking for pro-environmental products to the market was giving feedback and influencing. “My feedback deals with sustainable food and need for ecologically produced commodities. I’ve also asked for biodegradable shopping bags to the market”. The next aspects for reasons were versatile product range possibility to make societal impact through shopping. Furthermore, minimizing the effects of climate change and ecological sustainability were emphasized in the results. “The less is consumed by transport, the more it helps taking care of the environment and minimizing the carbon footprint” (Table 2).
Awareness of origin of materials: The most important viewpoint about the importance of locally produced food according to the respondents was supporting the economy and employment, as one of the respondents mentioned to be the core thing: “Vitality of countryside and domestic employment”. The next aspects for reasoning were safety, quality and purity of food and supporting domestic food production, which is illuminated by the comments such as “I try to choose domestic products whenever it’s possible” (Table 3).
Awareness of sustainable energy solutions: The most important viewpoint was reducing the use of warm water as a smart behavior, which does not accept any kind of waste: avoiding waste of natural resources, money and energy: “Everyone should avoid the unnecessary use of water” mentioned one of the respondents. The next aspects of reasons were saving costs and saving energy: “I save energy by reducing the amount of warm water” (Table 4).
Circulation and preventing loss of materials: The most important reason for the behavior was proper facilities offered by housing cooperatives and local waste management. This is articulated as follows: “The waste management is organized very well in our city. There are own places for different materials. Also, the recycling of clothes comes out well”. The next aspects for reason were promoting the circular economy: “Recycling of materials is important so that they can be used also in the future”. Recycling seems to be a solid habit for the respondents, which is demonstrated by comments such as “Recycling has been an obvious way of action for years”. Sustainable use of natural resources and combating climate change comprise the fourth biggest reason for recycling. One of the respondents said that “Every little decision helps the environment” (Table 5).
Smart mobility: The most important viewpoint for the respondents to support walking instead of motoring was outdoor exercising: “I like to walk and utilize it as an outdoor exercise”. The next reasons were health and well-being, which is articulated for example like this: “I rather walk because of the health issues not for protecting the environment. A good thing about living in the city is that the services are near”, illuminating the fact that available services in a neighborhood decrease the need for cycling, owning a car or public transport (Table 6).
Sustainable food: The most important reason to avoid red meat among the respondents was promoting health, which is described by comments such as “Avoiding red meat is important in the prevention of cancer”. A smooth shift towards veganism is apparent in the data. One of the respondents mentioned that “I choose pulled oats, pulled pork and similar, and also favor fish nowadays.” Ethics is the third reason for avoiding red meat: “The living conditions of farmed animal are terrible” (Table 7).

5. Discussion

This research was a holistic and horizontal view of sustainable living in Finland. We did not focus on demographics. Instead, we were interested to know on a general level how sustainable living materializes among Finnish people, what was the structure of sustainable lifestyle in Finland and how did people argue their everyday behavior choices and decisions in the context of sustainability in order to combat climate change. These questions are current because Finland aims to be a carbon-neutral society by the year 2050; some Finnish cities, such as the City of Espoo, already by 2030. Key measures to reach carbon-neutrality are to improve energy efficiency, increase the share of renewable energy sources in a sustainable way, produce and export climate-friendly products and services and develop the low-carbon sectors of the economy [71]. This means a fundamental change in citizens’ way of living due to the fact that households are the last gatekeepers for 72% of the global greenhouse gas (GHG) emissions at the end of the pipeline [72,73]. The role of household consumption is, however, often overlooked [37]. If public engagement is in such a way considered as trivial socio-culturally when combating climate change, this means that one powerful potential for climate leadership and direct impact on collective carbon reduction is lost and immobilized.
According to our results, the structure of sustainable lifestyle has six elements: conscious citizenship, awareness of origin of materials, awareness of sustainable energy solutions, circulation and preventing loss of materials, smart mobility and sustainable food. Holistic approaches to sustainable living need to be extensively adopted and socio-culturally encouraged to strengthen the needed progress from the thin and scattered sustainability today towards the systematic and solid sustainable living of tomorrow. According to our results, a holistic approach to sustainable living starts by focusing more on conscious citizenship, which explained most of variance of the data. The most important items of conscious citizenship were requesting pro-environmental products on the market and choosing a pro-climate meal at a restaurant. Rotated factor loadings of these items were strong (Table 1), but the implementation of the items was weak (Figure 1).
What Finns already do is recycling. It has been automated, so that it is part of a Finn’s everyday routine and habits. However, the meaning of recycling is generally overemphasized. It is treated as the main category of sustainable living even if it has rather small importance in the carbon reduction of households [29]. This embodies a problem of weak sustainability: recycling waste is not connected adequately to the overall picture explaining the gravity, that is the importance of a particular sector of sustainable living. This result is similar to prior research [68].
Smart, carbon-free mobility is a challenge for Finns. In practical terms, this means how to travel from Point A to Point B. Despite a trend of shifting from cars to public transport and mobility services, Finns seem to estimate that their personal car use is at the proper level. On the other hand, even one fifth (21%) reported consideration of environmental effects when planning holidays. In the context of behavioral change, it is interesting that temporary forced use of public transport may result in permanent private car reduction [74]. This raises a question of smart regulation in order to ensure a sustainable future for all.
Climate change and the very much needed lifestyle changes might involve difficult emotions such as grief, anxiety, fear, guilt, helplessness and loss [75]. To meet the challenge of this potential psychological cost of a new way of living, several value perspectives could be utilized (e.g., health and well-being, effectiveness, convenience). Finns seem to be practical, so that they simultaneously save money and combat climate change by reducing waste and applying smart technology. According to our results, Finns favor domestic food and products, and they are interested in the origin of materials. Therefore, multiple benefits of sustainable living are apparent. Finns support the local economy and ensure a good employment rate for the state. For example, locally produced organic vegetables benefit the local community; food and nutrition promote public health and animal well-being; and consumer choice maintains biodiversity and helps establish global food security [76]. Moreover, favoring domestic food and products combats climate change by reducing the carbon footprint of logistics [42].
There are many good signals for more sustainable life in Finland. Awareness of sustainable energy solutions is good. Energy consumption of household lighting has decreased radically, and new housing must meet nearly zero-energy building criteria from 2020. Renewable energy is generally seen as positive and appealing for many, as well as avoiding energy waste. Moreover, the majority of Finnish businesses see carbon neutrality as a source of strategic competitive ability. Carbon neutrality brings global cleantech opportunities in transportation, energy systems, sustainable buildings, industrial processes and water and waste management [77]. According to the National Energy and Climate Strategy of Finland, traffic emissions will be reduced by 50% by 2030 (compared to the 2005 level), and total greenhouse gas emissions will systematically set the course for achieving an 80–95% reduction by 2050 [78].
On the level of materialized sustainability, Finns have, however, still so far been moving further away from sustainability instead of moving towards it in total. This embodies a challenge of thin and scattered sustainability, as well as constitutes a demand and need for a more holistic approach to behavioral change. Thus, the role of formal and non-formal education is essential when changing values and attitudes of citizens towards a more sustainable way of living. This also raises a challenge for teacher training. However, most of the barriers to sustainability-promoting daily life are contextual barriers in a society. This is the reason why smart regulation is very much needed. It is a much faster way toward sustainable society than the interventions for changing citizens’ values and attitudes by education [79].

6. Conclusions

Even though Finns have become conscious of climate change, carbon reduction has not been mainstreamed in their everyday life. Finns seem to be testing the water of sustainable behavior, but on the other hand, are still ambivalent about making the change a part of everyday life. Circulation and preventing loss of materials shows a very promising start to a Finn’s behavioral change towards a more sustainable way of life. Recycling is considered as a norm. When targeting a sustainable future, citizens’ sustainable behavior needs to be spread and widened to new sectors and areas of everyday life in society. Maybe lessons learned from recycling can be utilized as an encouraging example of behavior changes when targeting more carbon-intensive areas of everyday life? Moving toward smarter mobility would require stronger awareness of the carbon-intensive effects of private cars and fast accelerating holiday travel abroad. Combating climate change also requires casting light on the blind spots in current carbon-intensive norms and actions in society. Every consumer behavior pattern, such as international flights and imported goods, is not counted in Finland’s GHG emissions. This means that both smart regulation and active citizenship are very much needed. For future research, exploring social rewards and penalties within the demanding learning process of a sustainable lifestyle is worth studying: are we collectively encouraging or punishing, mainstreaming or marginalizing sustainable behavior socially and culturally?

Author Contributions

Arto O. Salonen and Jani Siirilä designed the research and analyzed the data, which were gathered together with Sitra, the Finnish Innovation Fund. Arto O. Salonen, Jani Siirilä and Mikko Valtonen wrote the paper. All authors read and approved the final manuscript.

Conflicts of Interest

The authors declare no conflict of interest.

Funding

The authors received no financial support for the research and/or authorship of this article.

References

  1. Ehrlich, P.; Kareiva, P.; Gretchen, D. Securing natural capital and expanding equity to rescale civilization. Nature 2012, 486, 68–73. [Google Scholar] [CrossRef] [PubMed]
  2. Wiedmann, T.O.; Schandl, H.; Lenzen, M.; Moran, D.; Suh, S.; West, J.; Kanemoto, K. The Material Footprint of Nations. Proc. Natl. Acad. Sci. USA 2015, 112, 6271–6276. [Google Scholar] [CrossRef] [PubMed]
  3. Huber, M.; Knutti, R. Anthropogenic and natural warming inferred from changes in Earth’s energy balance. Nat. Geosci. 2012, 5, 31–36. [Google Scholar] [CrossRef]
  4. Crutzen, P.J. Geology of Mankind: The Anthropocene. Nature 2002, 415, 23. [Google Scholar] [CrossRef] [PubMed]
  5. Salonen, A.; Rouhinen, S. Vastuullinen maailmasuhde—Tulevaisuuden toivoa säilyttävän kulttuurievoluution suunnannäyttäjä. Tiedepolitiikka 2015, 3, 7–16. [Google Scholar]
  6. Salonen, A.; Bardy, M. Ekososiaalinen sivistys herättää luottamusta tulevaisuuteen. Aikuiskasvatus 2015, 35, 4–15. [Google Scholar]
  7. Åhlberg, M. Kestävää kehitystä edistävän kasvatuksen teoreettisesta perustasta. In Korkeakouluopetus kestäväksi—Opas YK:n Kestävää Kehitystä Edistävän Koulutuksen Vuosikymmentä Varten; Kaivola, T., Rohweder, L., Eds.; Yliopistopaino: Helsinki, Finland, 2006; pp. 28–36. [Google Scholar]
  8. Ott, K. The Case for Strong Sustainability. In Greifswald’s Environmental Ethics; Ott, K., Thapa, P., Eds.; Steinbecker Verlag: Greifswald, Germany, 2003. [Google Scholar]
  9. Hediger, W. Reconciling ‘weak’ and ‘strong’ sustainability. Int. J. Soc. Econ. 1999, 26, 1120–1144. [Google Scholar] [CrossRef]
  10. Intergovernmental Panel on Climate Change (IPCC). Climate Change 2007: The Physical Science Basis; Contribution of Working Group I to the Fourth Assessment Report of the Intergovernmental Panel on Climate Change; Cambridge University Press: Cambridge, UK, 2007. [Google Scholar]
  11. Intergovernmental Panel on Climate Change (IPCC). Climate Change 2007: Synthesis Report. 2007. Available online: https://www.ipcc.ch/pdf/assessment-report/ar4/syr/ar4_syr.pdf (accessed on 2 December 2017).
  12. Intergovernmental Panel on Climate Change (IPCC). Climate Change 2014: Impacts, Adaptation, and Vulnerability. Part A: Global and Sectoral Aspects; Contribution of Working Group II to the Fifth Assessment Report of the Intergovernmental Panel on Climate Change; Cambridge University Press: Cambridge, UK, 2014. [Google Scholar]
  13. Intergovernmental Panel on Climate Change (IPCC). Climate Change 2014: Impacts, Adaptation, and Vulnerability. Part B: Regional Aspects; Contribution of Working Group II to the Fifth Assessment Report of the Intergovernmental Panel on Climate Change; Cambridge University Press: Cambridge, UK, 2014. [Google Scholar]
  14. German Advisory Council on Global Change (WBGU). World in Transition—A Social Contract for Sustainability; WBGU: Berlin, Germany, 2011. [Google Scholar]
  15. World Meteorological Organization (WMO). WMO Statement on the State of the Global Climate in 2016; WMO-No. 1189; WMO: Geneva, Switzerland, 2016; pp. 4–9. [Google Scholar]
  16. NOAA. Global Climate Report. 2017. Available online: https://www.ncdc.noaa.gov/sotc/global/201709 (accessed on 2 December 2018).
  17. Ripple, W.J.; Wolf, C.; Newsome, T.M.; Galetti, M.; Alamgir, M.; Crist, E.; Mahmoud, M.I.; Laurance, W.F. World Scientists’ Warning to Humanity: A Second Notice. BioScience 2017, 67, 1026–1028. [Google Scholar] [CrossRef]
  18. Diener, E.; Lucas, R.; Schimmack, U.; Helliwell, J. Well-Being for Public Policy; Oxford University Press: Oxford, UK, 2009. [Google Scholar]
  19. McNeill, J.R.; McNeill, W.H. The Human Web: A Bird’s-Eye View of World History; W. W. Norton & Company: London, UK, 2003. [Google Scholar]
  20. Dauvergne, P. The Shadows of Consumption: Consequences for the Global Environment; The MIT Press: Cambridge, MA, USA, 2008. [Google Scholar]
  21. Doppelt, B. The Power of Sustainable Thinking: How to Create a Positive Future for the Climate, the Planet, Your Organization and Your Life; Earthscan: London, UK, 2008. [Google Scholar]
  22. Sachs, J. Common Wealth: Economics for a Crowded Planet; Penguin Press: New York, NY, USA, 2008; pp. 113–114. [Google Scholar]
  23. Blake, J. Overcoming the Value-Action Gap in Environmental Policy: Tensions between National Policy and Local Experience. Local Environ. 1999, 4, 257–278. [Google Scholar] [CrossRef]
  24. Diekmann, A.; Preisendörfer, P. Green and Greenback. The Behavioral Effects of Environmental Attitudes in Low-Cost and High-Cost Situations. Ration. Soc. 2003, 15, 441–472. [Google Scholar] [CrossRef]
  25. Jurin, R.; Fortner, R. Symbolic Beliefs as Barriers to Responsible Environmental Behavior. Environ. Educ. Res. 2002, 8, 373–394. [Google Scholar] [CrossRef]
  26. Kollmuss, A.; Agyeman, J. Mind the Gap: Why Do People Act Environmentally and What Are the Barriers to Pro-Environmental Behavior? Environ. Educ. Res. 2002, 8, 239–260. [Google Scholar] [CrossRef]
  27. Salo, M.; Nissinen, A.; Mattinen, M.; Manninen, K. Ilmastodieetti—Mihin Sen Antamat Ilmastopainot Perustuvat? 2016. Available online: https://beta.ilmastodieetti.fi/pdf/Ilmastodieetti_dokumentaatio_2016-05-31.pdf (accessed on 2 December 2017).
  28. German Advisory Council on Global Change (WBGU). Solving the Climate Dilemma: The Budget Approach; Special Report; WBGU: Berlin, Germany, 2009. [Google Scholar]
  29. SYKE. Finnish Carbon Footprint Calculator. 2017. Available online: http://www.syke.fi/en-US/Research__Development/Consumption_and_production/Calculators/Carbon_footprint_calculators (16813) (accessed on 2 December 2017).
  30. Global Footprint Network. National Footprint Accounts. 2017. Available online: http://data.footprintnetwork.org/#/ (accessed on 2 December 2017).
  31. Caldeira, K.; Davies, S. Consumption-based accounting of CO2 emissions. Proc. Natl. Acad. Sci. USA 2010, 107, 5687–5692. [Google Scholar]
  32. Salonen, A.; Konkka, J. Kun tyytyväisyys ratkaisee. Nuorten suhtautuminen globaaleihin haasteisiin, käsitykset ihanneyhteiskunnasta ja toiveet omasta tulevaisuudesta. In Katse Tulevaisuudessa, Nuorisobarometri 2016; Myllyniemi, S., Ed.; Opetus-ja Kulttuuriministeriö, Valtion Nuorisoneuvosto ja Nuorisotutkimusverkosto: Helsinki, Finland, 2017; pp. 137–156. [Google Scholar]
  33. EVA. Pyrkimällä Jatkuvaan Taloudelliseen Kasvuun Ihminen Tuhoaa Vähitellen Luonnon ja Lopulta Myös Itsensä. 2014. Available online: http://www.eva.fi/arvopankki/perusnakyma.php?q=143 (accessed on 2 December 2017).
  34. Rowson, J. A New Agenda on Climate Change; RSA—Action and Research Centre: London, UK, 2013. [Google Scholar]
  35. Wilkinson, R.; Pickett, K. The Spirit Level: Why Equality Is Better for Everyone; Penquin: London, UK, 2010. [Google Scholar]
  36. Brown, P.; Caldeira, K. Greater future global warming inferred from Earth’s recent energy budget. Nature 2017, 552, 45–50. [Google Scholar] [CrossRef] [PubMed]
  37. Salo, M.; Nissinen, A. Consumption Choices to Decrease Personal Carbon Footprints of Finns; Reports of the Finnish Environment Institute; Finnish Environment Institute, Centre for Sustainable Consumption and Production: Helsinki, Finland, 2017. [Google Scholar]
  38. Carlsson-Kanayama, A.; Ekstrom, M.; Shanahan, H. Food and life cycle energy inputs: Consequences of diet and ways to increase efficiency. Ecol. Econ. 2003, 44, 293–307. [Google Scholar] [CrossRef]
  39. Tukker, A.; Huppes, G.; Guinée, J.; Heijungs, R.; de Koning, A.; Van Oers, L.; Nielsen, P. Environmental Impact of Products (EIPRO). Analysis of the Life Cycle Environmental Impacts Related to the Final Consumption of the EU-25; Technical Report EUR 22284 EN; European Commission, JRC, Institute for Prospective Technological Studies: Seville, Spain, 2006; Available online: http://ec.europa.eu/environment/ipp/pdf/eipro report.pdf (accessed on 2 December 2017).
  40. Steinfeld, H.; Gerber, P.; Wassenaar, T.; Castel, V.; Rosales, M.; de Haan, C. Livestock’s Long Shadow: Environmental Issues and Options; United Nations Food and Agriculture Organization: Geneva, Switzerland, 2006. [Google Scholar]
  41. Smil, V. Should We Eat Meat? Evolution and Consequences of Modern Carnivory; Wiley-Blackwell: Hoboken, NJ, USA, 2013. [Google Scholar]
  42. Weber, C.; Matthews, S. Food-Miles and the Relative Climate Impacts of Food Choices in the United States. Environ. Sci. Technol. 2008, 42, 3508–3513. [Google Scholar] [CrossRef] [PubMed]
  43. Risku-Norja, H.; Kurppa, S.; Helenius, J. Dietary choices and greenhouse gas emissions: Assessment of impact of vegetarian and organic options at national scale. Prog. Ind. Ecol. 2009, 6, 340–354. [Google Scholar] [CrossRef]
  44. Viinisalo, M.; Nikkilä, M.; Varjonen, J. Elintarvikkeiden Kulutusmuutokset Kotitalouksissa Vuosina 1966–2006; Kuluttajatutkimuskeskus: Helsinki, Finland, 2008. [Google Scholar]
  45. Springmann, M.; Godfray, C.; Rayner, M.; Scarborough, P. Analysis and valuation of the health and climate change cobenefits of dietary change. Proc. Natl. Acad. Sci. USA 2016, 113, 4146–4151. [Google Scholar] [CrossRef] [PubMed]
  46. Pro Luomu. Luomumarkkinat Kasvoivat Aiempaa Hitaammin. 2013. Available online: http://luomu.fi/kirjoitus/luomumarkkinat-kasvoivat-aiempaa-hitaammin/3/ (accessed on 2 December 2017).
  47. Pauschert, V.; Russell, L.; Freund, K. Unlocking the Power. Annual Report 2012–13; Fairtrade International: Bonn, Germany, 2013; Available online: http://www.fairtrade.net/fileadmin/user_upload/content/2009/resources/2012-13_AnnualReport_FairtradeIntl_web.pdf (accessed on 2 December 2017).
  48. Institute of Mechanical Engineering. Global Food: Waste Not, Want Not; Institute of Mechanical Engineering: London, UK, 2013. [Google Scholar]
  49. Silvennoinen, K.; Koivupuro, H.K.; Katajajuuri, J.M.; Jalkanen, L.; Reinikainen, A. Ruokahävikki Suomalaisessa Ruokaketjussa: Foodspill 2010–2012 Hankkeen Loppuraportti; MTT: Helsink, Finland, 2012. [Google Scholar]
  50. Statistics Finland. Energy Consumption in Households 2010–2015. 2016. Available online: https://tilastokeskus.fi/til/asen/2015/asen_2015_2016-11-18_en.pdf (accessed on 2 December 2017).
  51. Statistics Finland. Pinta-Ala Huoneistoa Kohti (m2) Asunnon Talotyypin Mukaan 1970–2016, Koko Asuntokanta. 2016. Available online: http://www.stat.fi/til/asas/2016/asas_2016_2017-05-22_tau_003_fi.html (accessed on 2 December 2017).
  52. Cleantech Industry in Finland. Cleantech Finland & Pohjoisranta Burson-Marsteller. 2013. Available online: http://www.ek.fi/ek/liitteet/CleantechindustryinFinland2013.pdf (accessed on 2 December 2017).
  53. Chitnis, M.; Sorrell, S.; Druckman, A.; Firth, S.; Jackson, T. Turning Lights into Flights: Estimating Direct and Indirect Rebound Effects for UK Households. Energy Policy 2013, 55, 234–250. [Google Scholar] [CrossRef] [Green Version]
  54. Eurostat. Recycling Rate of Municipal Waste; European Commission: Luxembourg, 2015. [Google Scholar]
  55. Statistics Finland. Consumption in Households; Statistic of Finland: Helsinki, Finland, 2012. [Google Scholar]
  56. Aro, R. Living Standards and Changing Expectations: Investigating Domestic Necessity; Jyväskylä Studies in Education, Psychology and Social Research 581; University of Jyväskylä: Jyväskylä, Finland, 2017. [Google Scholar]
  57. Finnish Transport Agency. National Travel Survey 2010–2011; Transport Planning, 31; Finnish Transport Agency: Helsinki, Finland, 2012. [Google Scholar]
  58. Tie-ja Vesirakennushallitus. Näin Me Liikumme; Liikennevirasto: Helsinki, Finland, 1977/2016. [Google Scholar]
  59. Statistics Finland. Overnight Stay Trips by Finnish Residents in 2005 to 2015. 2016. Available online: http://www.stat.fi/til/smat/2015/smat_2015_2016-03-30_tau_001_en.html (accessed on 2 December 2017).
  60. Liikenne Espoossa. Espoon Kaupunki: Kaupunkisuunnittelukeskus. 2015. Available online: https://issuu.com/espoonkaupunki/docs/liikenne_espoossa_2015_kaupunkisuun (accessed on 2 December 2017).
  61. Aretun, Å.; Nordbakke, S. Developments in Driver’s Licence Holding among Young People: Potential Explanations, Implications and Trends; VTI Rapport 824A; VTI: Linköping, Sweden, 2014. [Google Scholar]
  62. Brandt, E.; Lindeqvist, M. Car Ownership in the Helsinki Region—Past Development and Future Outlooks; HSL, Helsinki Region Transport: Helsinki, Finland, 2016. [Google Scholar]
  63. Hutcheson, G.; Sofroniou, N. The Multivariate Social Scientist; Sage: London, UK, 1999; p. 225. [Google Scholar]
  64. Field, A. Discovering Statistics Using SPSS for Windows: Advanced Techniques for the Beginner; Sage: London, UK, 2000; Volume 446, pp. 456–457, 648. [Google Scholar]
  65. Tabachnick, B.; Fidell, L. Using Multivariate Statistics: Pearson International Edition, 5th ed.; Pearson: London, UK, 2007; p. 649. [Google Scholar]
  66. Alasuutari, P. Laadullinen Tutkimus 2.0; Osuuskunta Vastapaino: Tampere, Finland, 2014; p. 53. [Google Scholar]
  67. Silverman, D. Interpreting Qualitative Data: Methods for Analysing Talk, Text and Interaction; Sage: London, UK, 1993; p. 300. [Google Scholar]
  68. Siirilä, J. Tulkintoja Kestävän Kehityksen Käsitteestä YK:n Kestävää Kehitystä Edistävän Teemavuosikymmenen 2015–2015 Yhteydessä. Ph.D. Thesis, University of Helsinki, Helsinki, Finland, 2016; pp. 59–60. [Google Scholar]
  69. Field, A. Discovering Statistics Using SPSS, 3rd ed.; Sage: London, UK, 2009; pp. 673–681. [Google Scholar]
  70. Howitt, D.; Cramer, D. Introduction to Statistics in Psychology, 4th ed.; Pearson: London, UK, 2008; pp. 406–408. [Google Scholar]
  71. Finnish National Commission on Sustainable Development. The Finland We Want by 2050—Society’s Commitment to Sustainable Development. 2013. Available online: http://kestavakehitys.fi/documents/2167391/2186383/FINAL+Kest%C3%A4v%C3%A4n+kehityksen+yhteiskuntasitoumus+20+4+2016_eng-GBs_Final+-+kielenhuolto_EN_rev+%282%29.pdf/e057e638-507e-464c-a3dd-d3f0826f8950 (accessed on 3 January 2018).
  72. Girod, B.; van Vuuren, P.; Hertwich, E. Climate policy through changing consumption choices: Options and obstacles for reducing greenhouse gas emissions. Glob. Environ. Chang. 2014, 25, 5–15. [Google Scholar] [CrossRef]
  73. Hertwich, E.; Peters, G. Carbon Footprint of Nations: A Global, Trade-Linked Analysis. Environ. Sci. Technol. 2009, 43, 6414–6420. [Google Scholar] [CrossRef] [PubMed]
  74. Fujii, S.; Gärling, T. Development of script-based travel mode choice after forced change. Transp. Res. Part F Traffic Psychol. Behav. 2003, 6, 117–124. [Google Scholar] [CrossRef]
  75. Buchs, M.; Hinton, E.; Smith, G. ‘It helped me sort of face the end of the world’: The role of emotions for third sector climate change engagement initiatives. Environ. Values 2015, 24, 621–640. [Google Scholar] [CrossRef]
  76. Salonen, A.; Fredriksson, L.; Järvinen, S.; Korteniemi, P.; Danielsson, J. Sustainable consumption in Finland—The phenomenon, consumer profiles and future scenarios. Int. J. Mark. Stud. 2014, 6, 59–82. [Google Scholar] [CrossRef]
  77. Sitra. Benefits of Carbon Neutrality in a Rapidly Changing Business Environment; Sitra Studies 102; Sitra, The Finnish Innovation Fund: Helsinki, Finland, 2015. [Google Scholar]
  78. Huttunen, R. (Ed.) Government report on the National Energy and Climate Strategy for 2030; Ministry of Economic Affairs: Helsinki, Finland, 2017. [Google Scholar]
  79. Salonen, A.; Åhlberg, M. Obstacles to Sustainable Living in the Helsinki Metropolitan Area. Sustain. Cities Soc. 2013, 8, 48–55. [Google Scholar] [CrossRef]
Figure 1. Variables of sustainable living.
Sustainability 10 00104 g001
Figure 2. Examination of the factors of sustainable living: the variables and viewpoints pointed out by qualitative analysis.
Sustainability 10 00104 g002
Table 1. Summary of exploratory factor analysis for the sustainable living questionnaire by principal axis factoring with Varimax-rotation and Kaiser normalization. Bolded loadings over 0.38 are included in the interpretation.
VARIABLESFactors and Rotated Factor Loadings
Conscious CitizenshipAwareness of Origin of MaterialsAwareness of Sustainable Energy SolutionsCirculation and Preventing Loss of MaterialsSmart MobilitySustainable Food
1. I ask for pro-environment products to the market0.7190.1660.2030.0160.1860.096
2. I choose a pro-climate meal in a restaurant0.6890.1200.1910.0360.1800.275
3. I favor fair-trade products0.6810.2810.1600.0590.1210.215
4. I make choices for minimizing the environmental effects of diet0.6770.1510.1960.2700.1730.248
5. I favor environmental certificated products0.6500.3510.1860.2080.1900.171
6. I consider an ecological point of view when planning my vacation0.6490.0930.2000.1970.2680.090
7. I favor organic food0.6070.3840.1290.0370.0850.338
8. In elections I vote for the candidate who is actively protecting the environment0.5690.1280.0490.3310.1930.208
9. I have reduced my level of consumption and am aiming for responsible choices for environmental reasons0.5570.1400.2080.4450.2100.188
10. I buy organic, local and seasonal food0.5550.4330.0750.1280.0380.298
11. I try to minimize the environmental effects of mobility0.5330.0520.2200.2800.4440.150
12. I gladly try new healthy and environmentally friendly food0.4840.2500.1240.2420.1370.413
13. I reduce the amount of waste by changing shopping habits0.4320.2230.3470.4130.2340.093
14. I change my consuming habits when getting new information0.4310.2700.2070.3270.2210.370
15. I favor locally produced food0.1760.7840.1550.2110.0210.065
16. I favor locally produced goods and commodities when making buying decisions0.2110.7680.1570.2030.0550.030
17. I take into account the origin of food when making a decision for shopping0.3430.6350.1030.1930.0830.216
18. I favor seasonal food0.3330.3610.1820.1570.1390.343
19. I minimize the use of warm water0.2250.0190.6620.1620.1170.073
20. I save energy by reducing the room temperature0.1950.0970.6610.0850.0910.140
21. I save energy by turning off unnecessary household appliances and lamps0.0600.1140.6180.2590.1140.029
22. I save energy by using energy-efficient light bulbs and household appliances0.1620.1920.5340.1860.0750.082
23. I sort out waste materials in order to recycle0.1440.1930.2240.6160.0760.106
24. I try to systematically reduce the amount of waste of household0.3530.1330.3210.5610.1470.129
25. I take care of hazardous waste and also recycle unused electronics0.0600.2390.2510.5460.0240.061
26. I try to reduce the amount of waste food0.1100.2290.3780.3880.1640.158
27. I walk more often from point A to B instead of using car or public transport0.1690.0800.0920.0730.7470.136
28. I minimize the use of my car0.1820.0220.2300.1370.6210.113
29. I choose public transport even though I would have the possibility to use my own car0.2060.0440.0470.0330.6000.094
30. I favor a plant-based diet0.3710.1070.1440.0970.1790.666
31. I avoid eating red meat (beef, pork, lamb)0.4030.0230.0860.0980.1980.539
32. I change my eating habits when getting more information0.3550.2710.1730.2140.1910.497
Eigenvalues13.2462.2391.9841.2721.1111.029
65.2% of variance explained41.37.06.24.03.53.2
Cronbach α1.00.80.80.80.70.8
Table 2. Reasons for asking for pro-environmental products on the market.
Reasonf%
feedback and impact on society5055
versatile product range1213
making societal impact through shopping1213
ecology and combating climate change1011
awareness of products45
sustainable consumption22
healthiness and cleanness11
Total91100
Table 3. Reasons for domestic food.
Reasonf%
supporting economy and employment20320
safety and quality16216
purity of food15115
favoring domestic food13613
locally produced food848
domestic production of food596
price of food505
ecology and carbon foot print of food production495
taste of food404
healthiness232
self-grown food212
information about the origin of food182
security of supply101
ethics7<1
seasonal food5<1
organic food2<1
domestic food as a value2<1
Total1022100
Table 4. Reasons for minimizing the use of warm water.
Reasonf%
smart people do not waste11045.8
saving costs7129.6
saving energy3615.0
ecological reasons, combating climate change135.4
other reasons104.2
Total240100
Table 5. Respondents’ reasons for recycling.
Reasonf%
proper facilities offered by housing cooperative and local waste management11117
promoting circular economy10416
habit and routine, automated action10215
sustainable use of natural resources and combating climate change9514
easiness6910
economy497
reducing the amount of waste467
plastic separation335
responsibility, duty and influencing254
compliance, following rules234
waste can be used as energy81
Total665100
Table 6. Respondents’ reasons for supporting walking instead of motoring.
Reasonf%
outdoor exercising13728
health and well-being12726
services in neighborhood8918
economy337
ecology326
walking, cycling and public transport goes together306
challenges of dispersed settlement245
reducing carbon footprint122
commuting92
Total493100
Table 7. Most important reasons to avoid red meat.
Reasonf%
promoting health10334.6
vegan or partly vegan6722.5
ethics6120.5
taste of food258.4
climate206.7
production of food175.7
price of food51.6
Total298100

