
Evaluation of Protein and Polysaccharide Biopolymers as Dust Suppressants on Mine Soils: Laboratory Experiments

Abstract
:1. Introduction
2. Materials and Methods
2.1. Materials
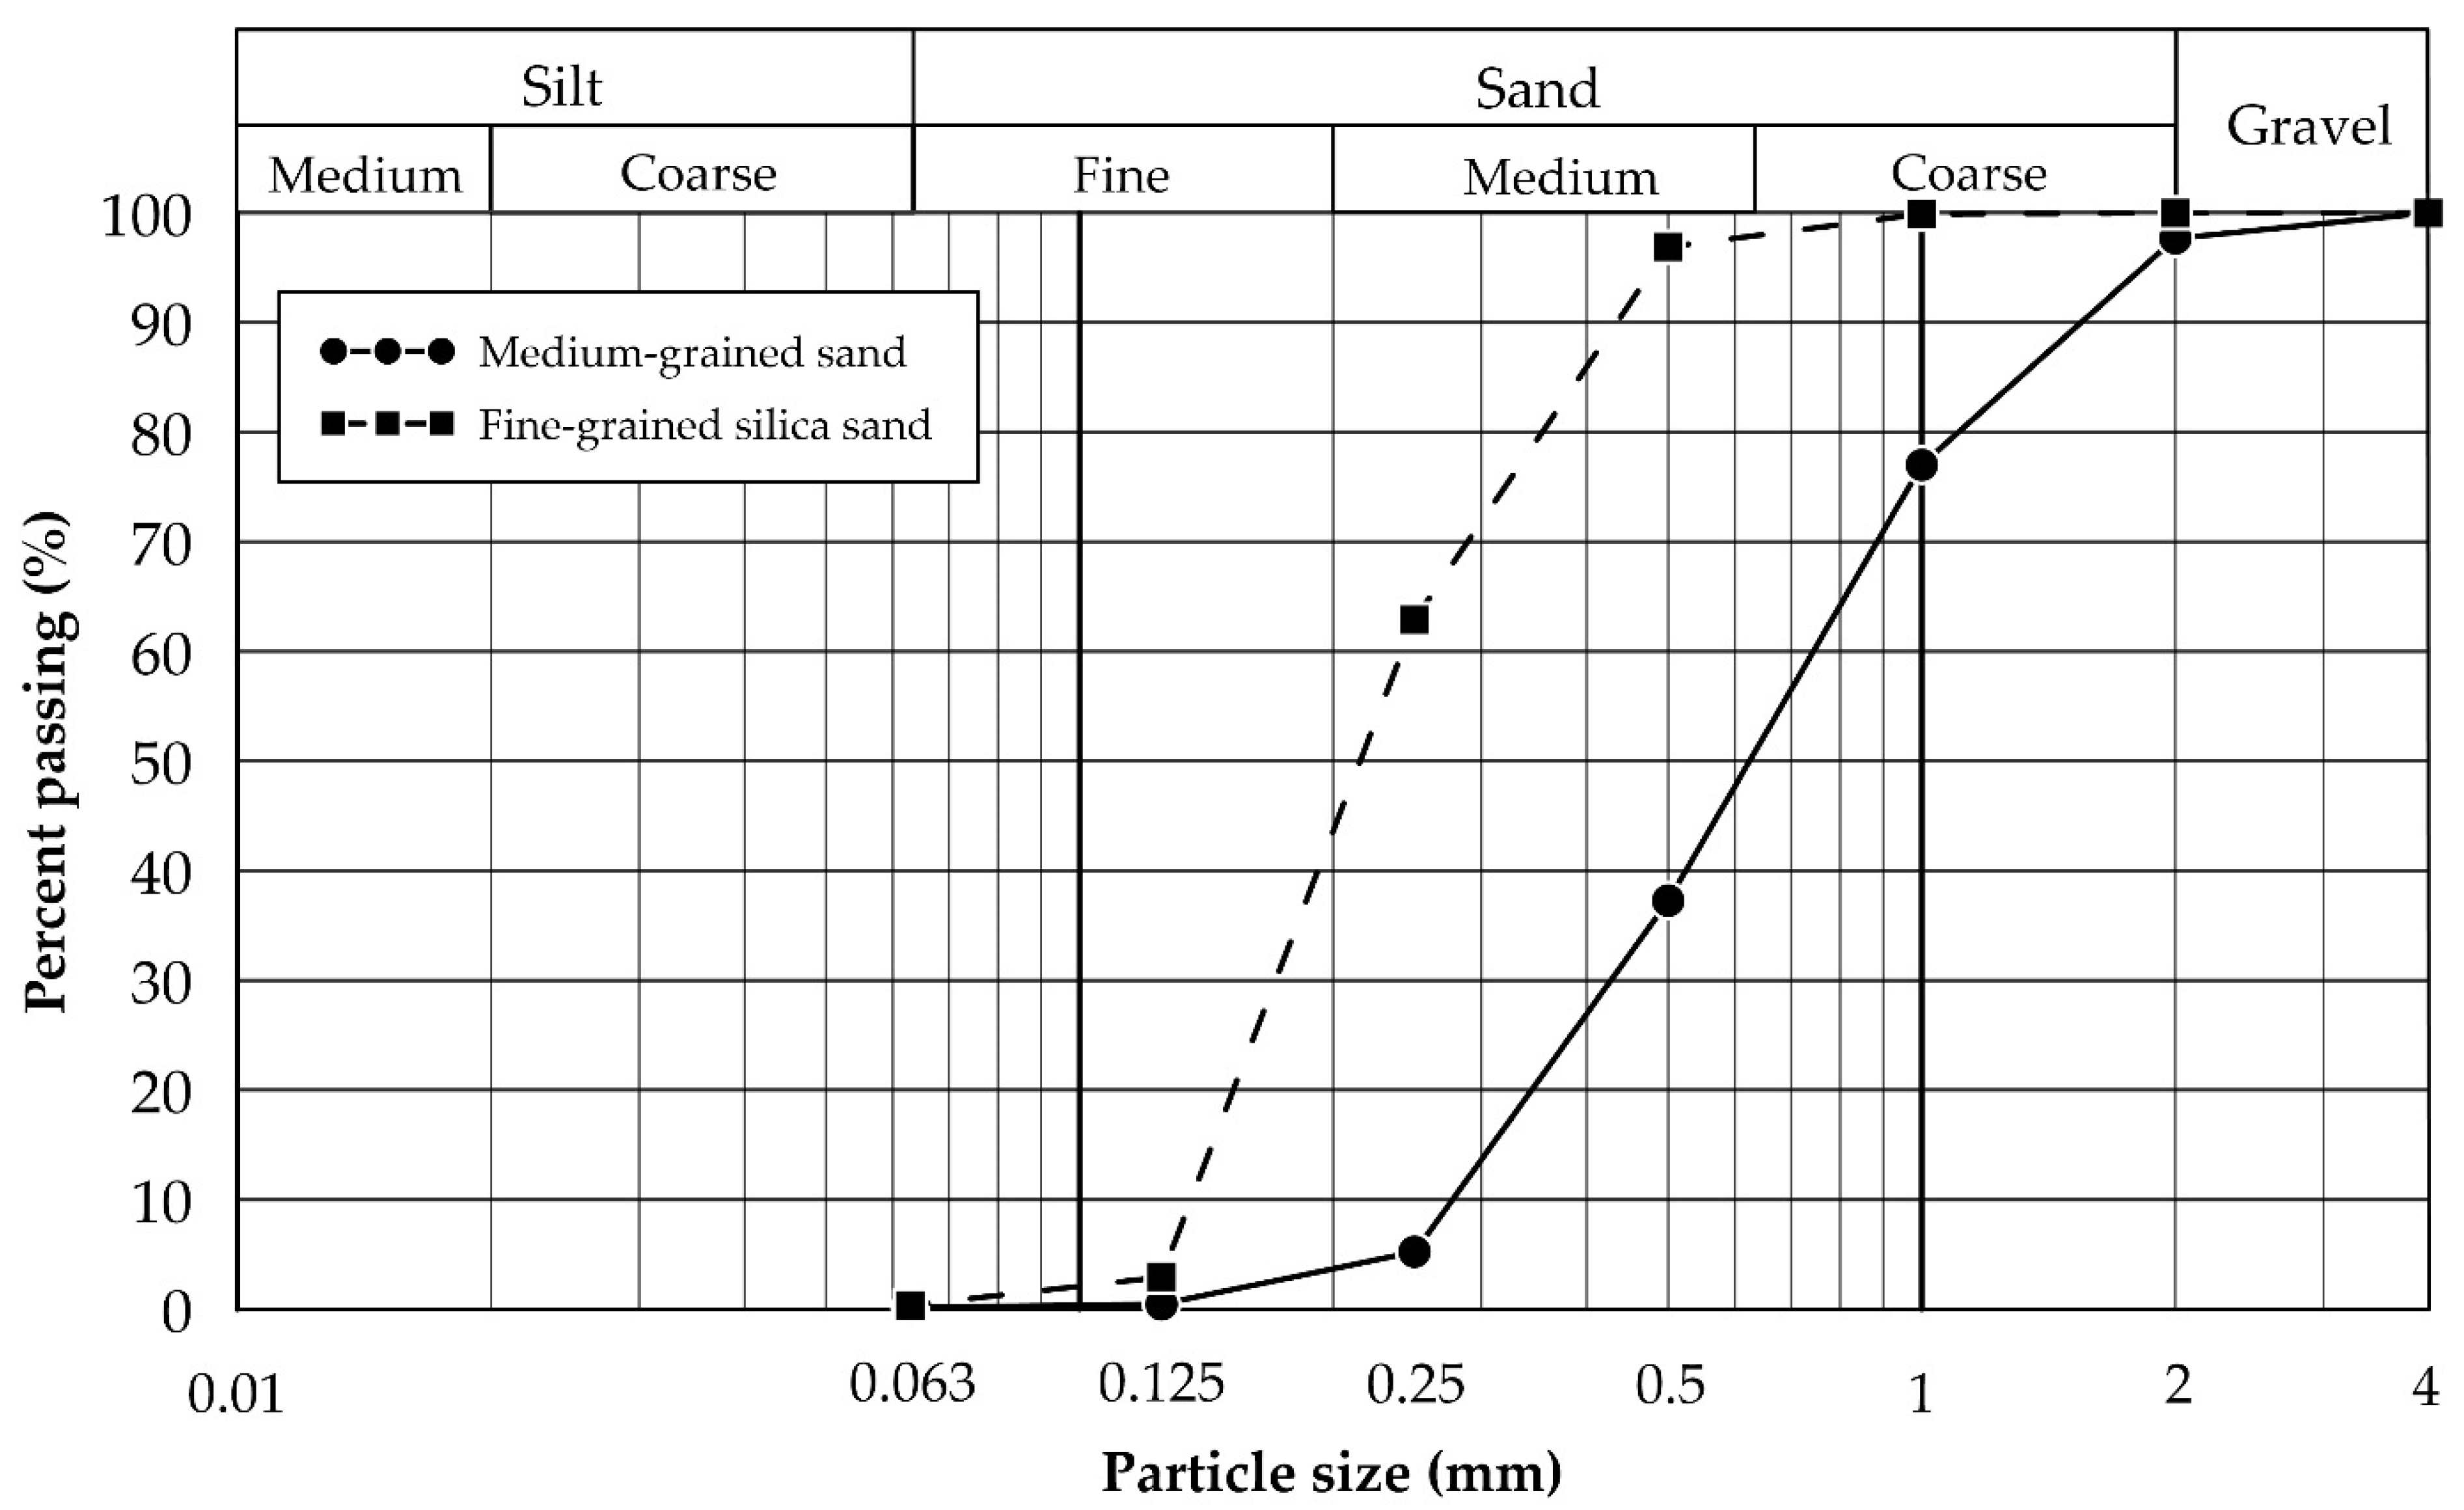
2.1.1. Soils
2.1.2. Biopolymers
- The biopolymer should be able to be sourced regionally within central European countries where continental climate prevails.
- The biopolymer should be readily soluble in water to enable large-scale field testing and potential industrial implementation. Such a requirement precludes biopolymers, whose dissolution would rely on either high temperature (e.g., agar or gellan gum) or acetic/alkaline solutions (e.g., chitosan or casein).
2.2. Laboratory Experiments
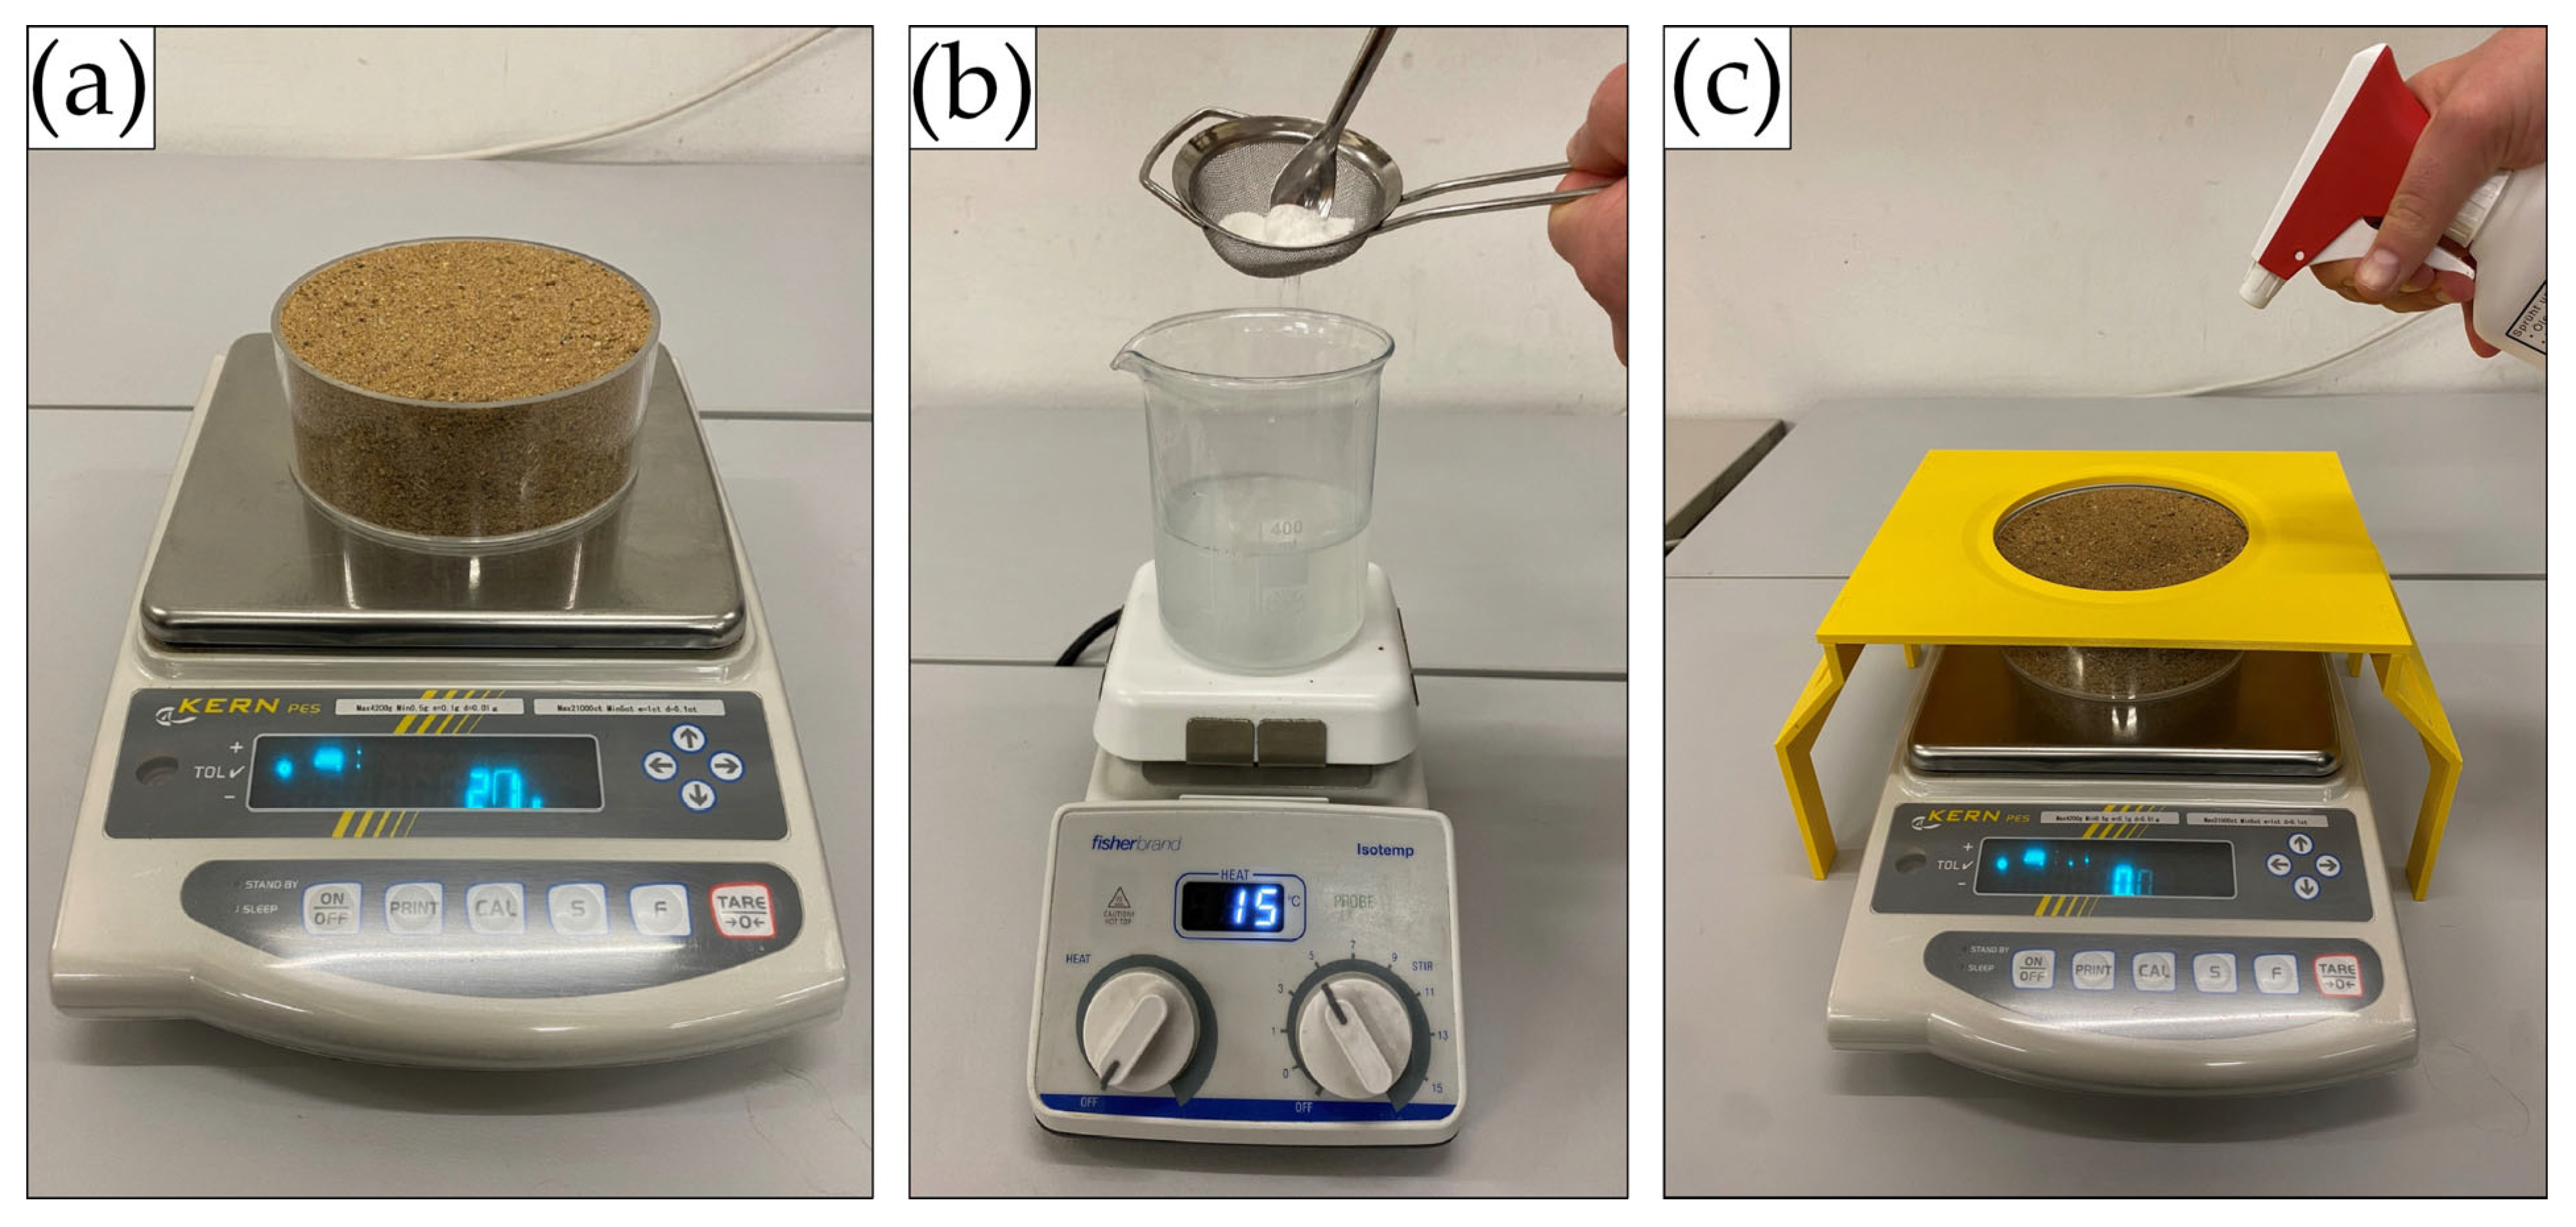
2.2.1. Sample Preparation
2.2.2. Moisture Retention Tests
2.2.3. Penetrometer Tests
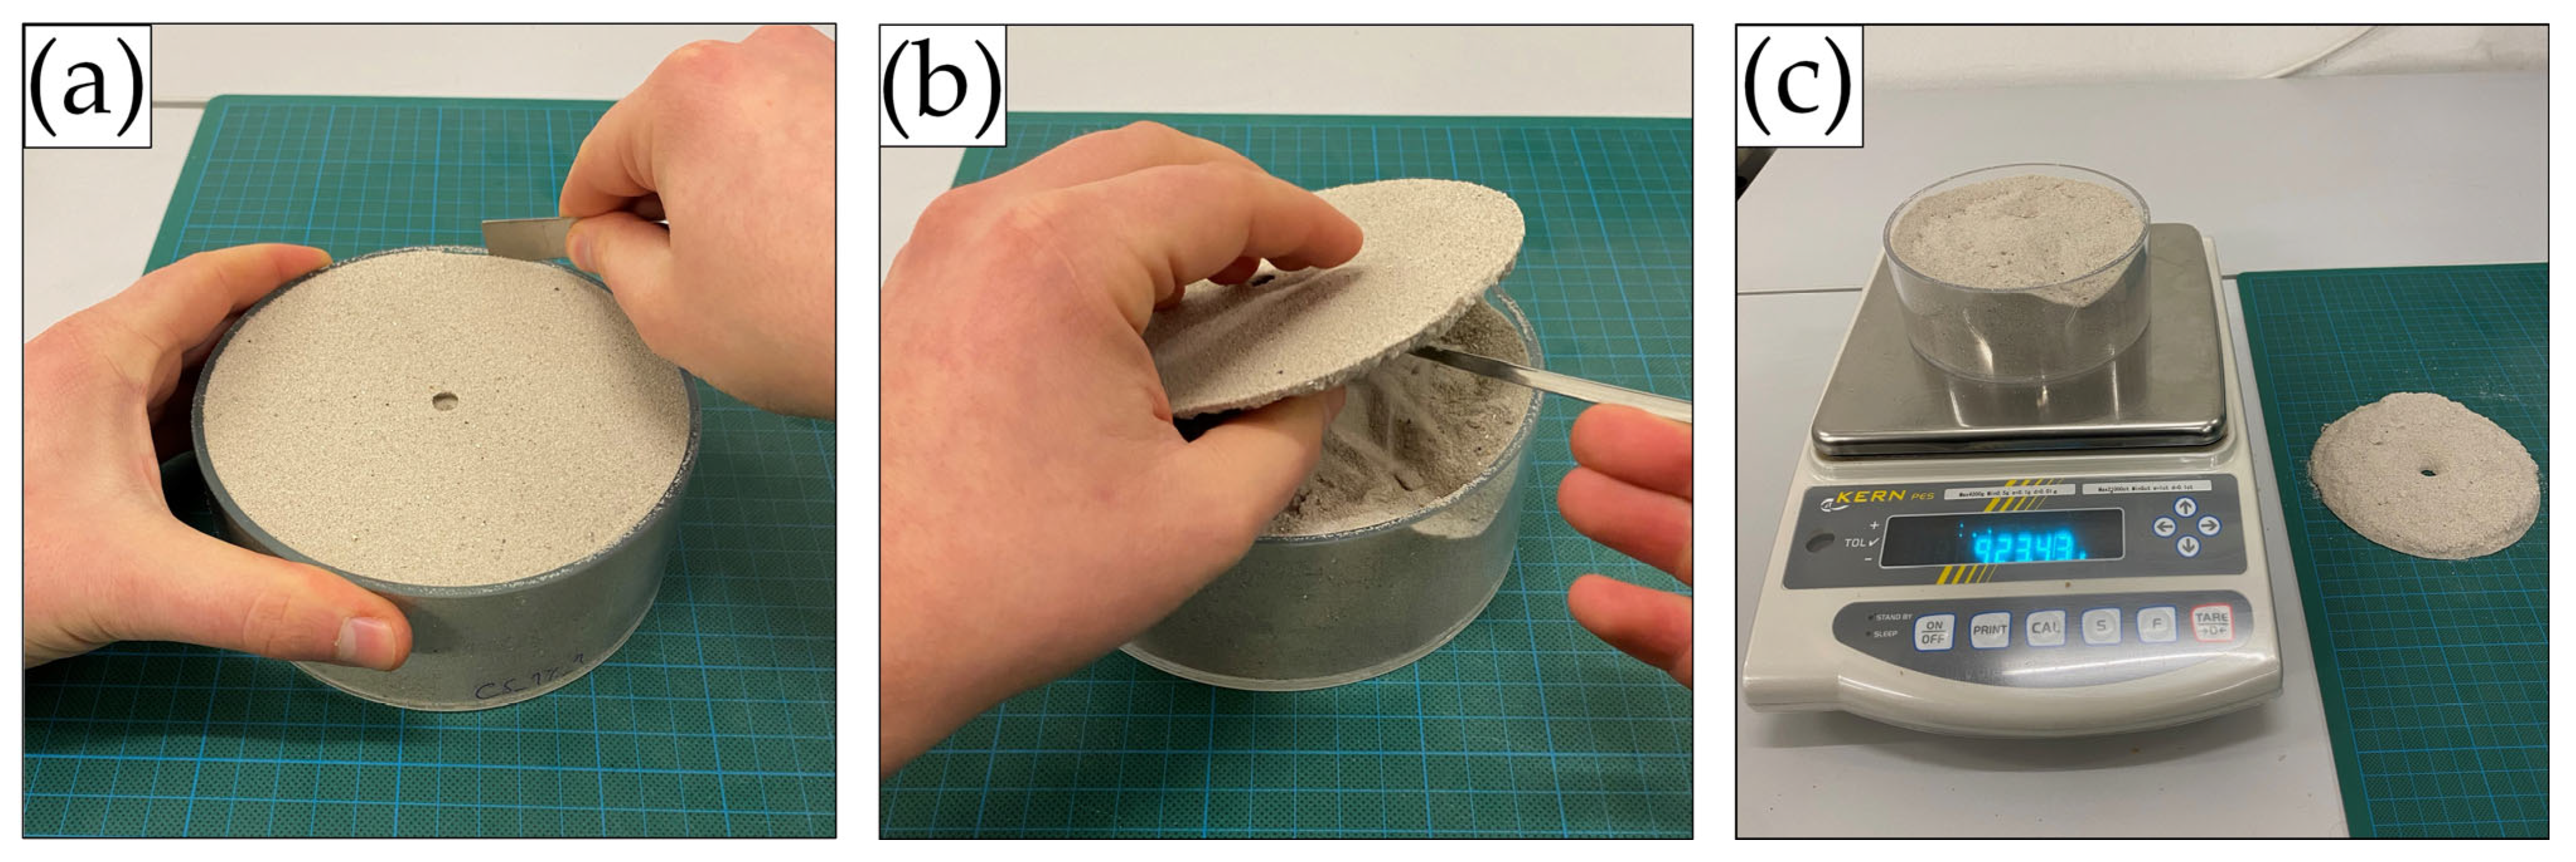
2.2.4. Crust Thickness Measurements
2.2.5. Statistical Analysis
3. Results
3.1. Moisture Retention Tests
3.1.1. Medium-Grained Sand
3.1.2. Fine-Grained Silica Sand
3.2. Penetrometer Tests
3.2.1. Medium-Grained Sand
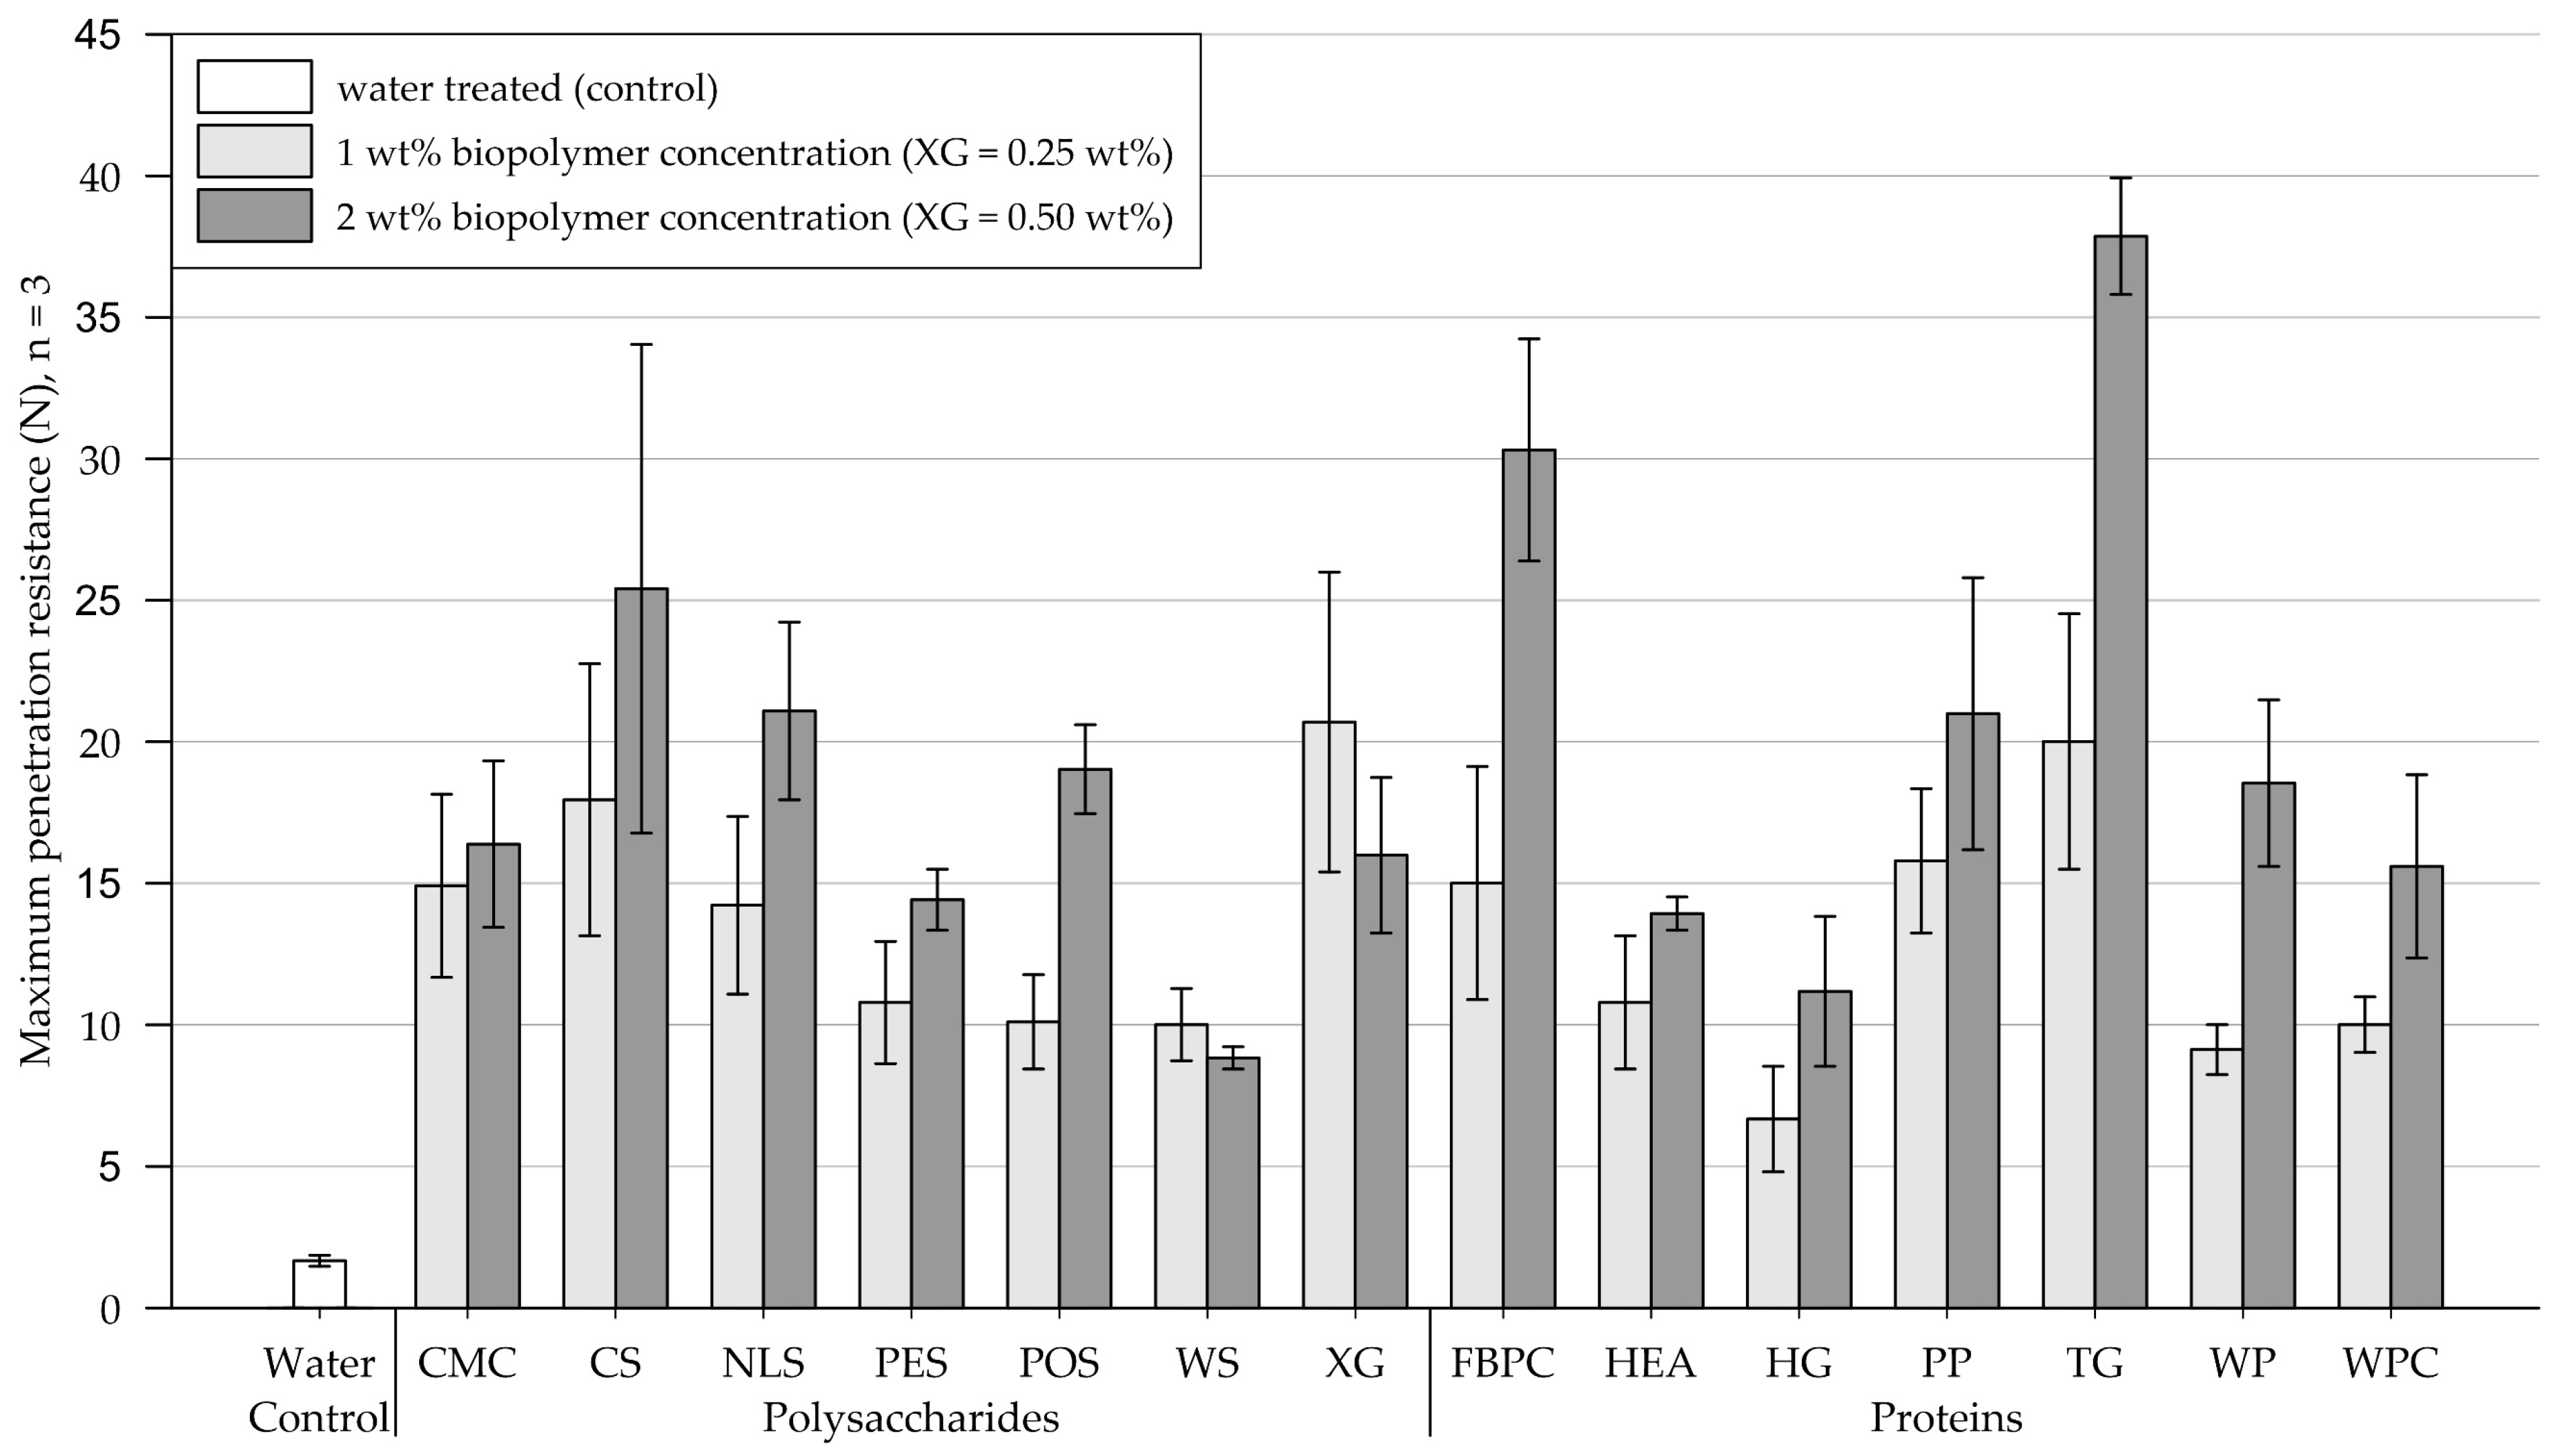
3.2.2. Fine-Grained Silica Sand
3.3. Crust Thickness Measurements
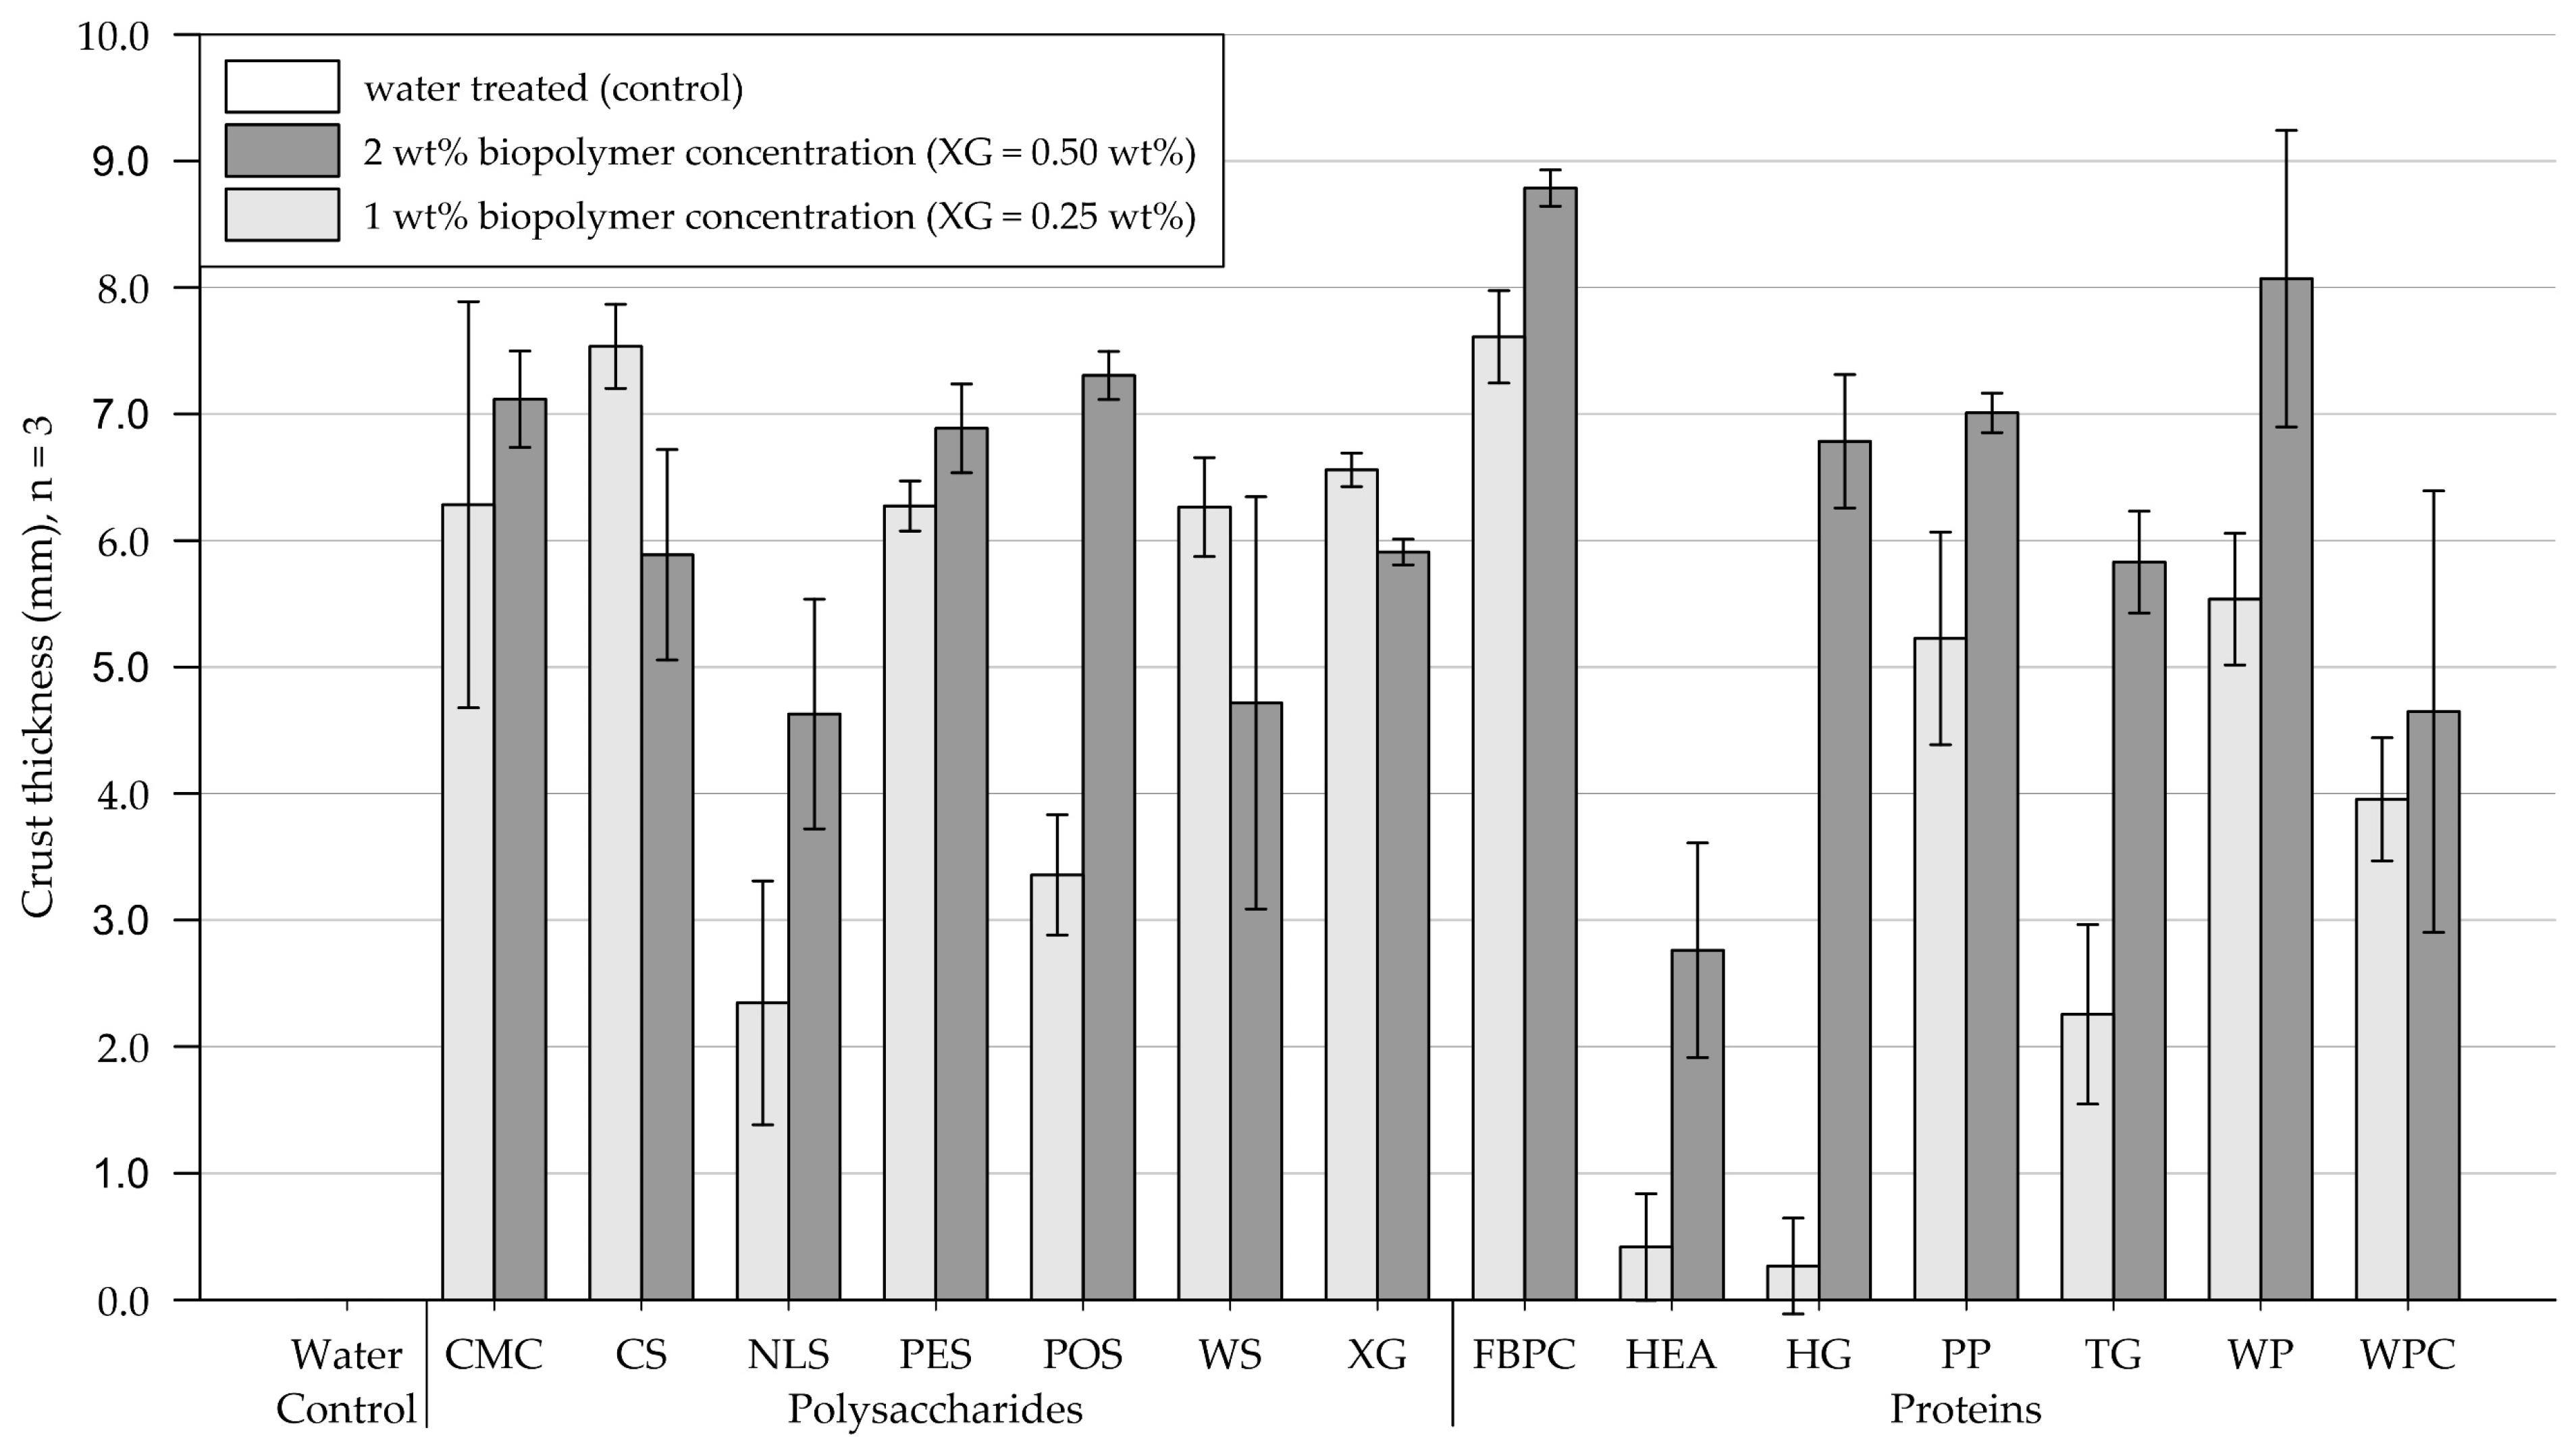
3.3.1. Medium-Grained Sand
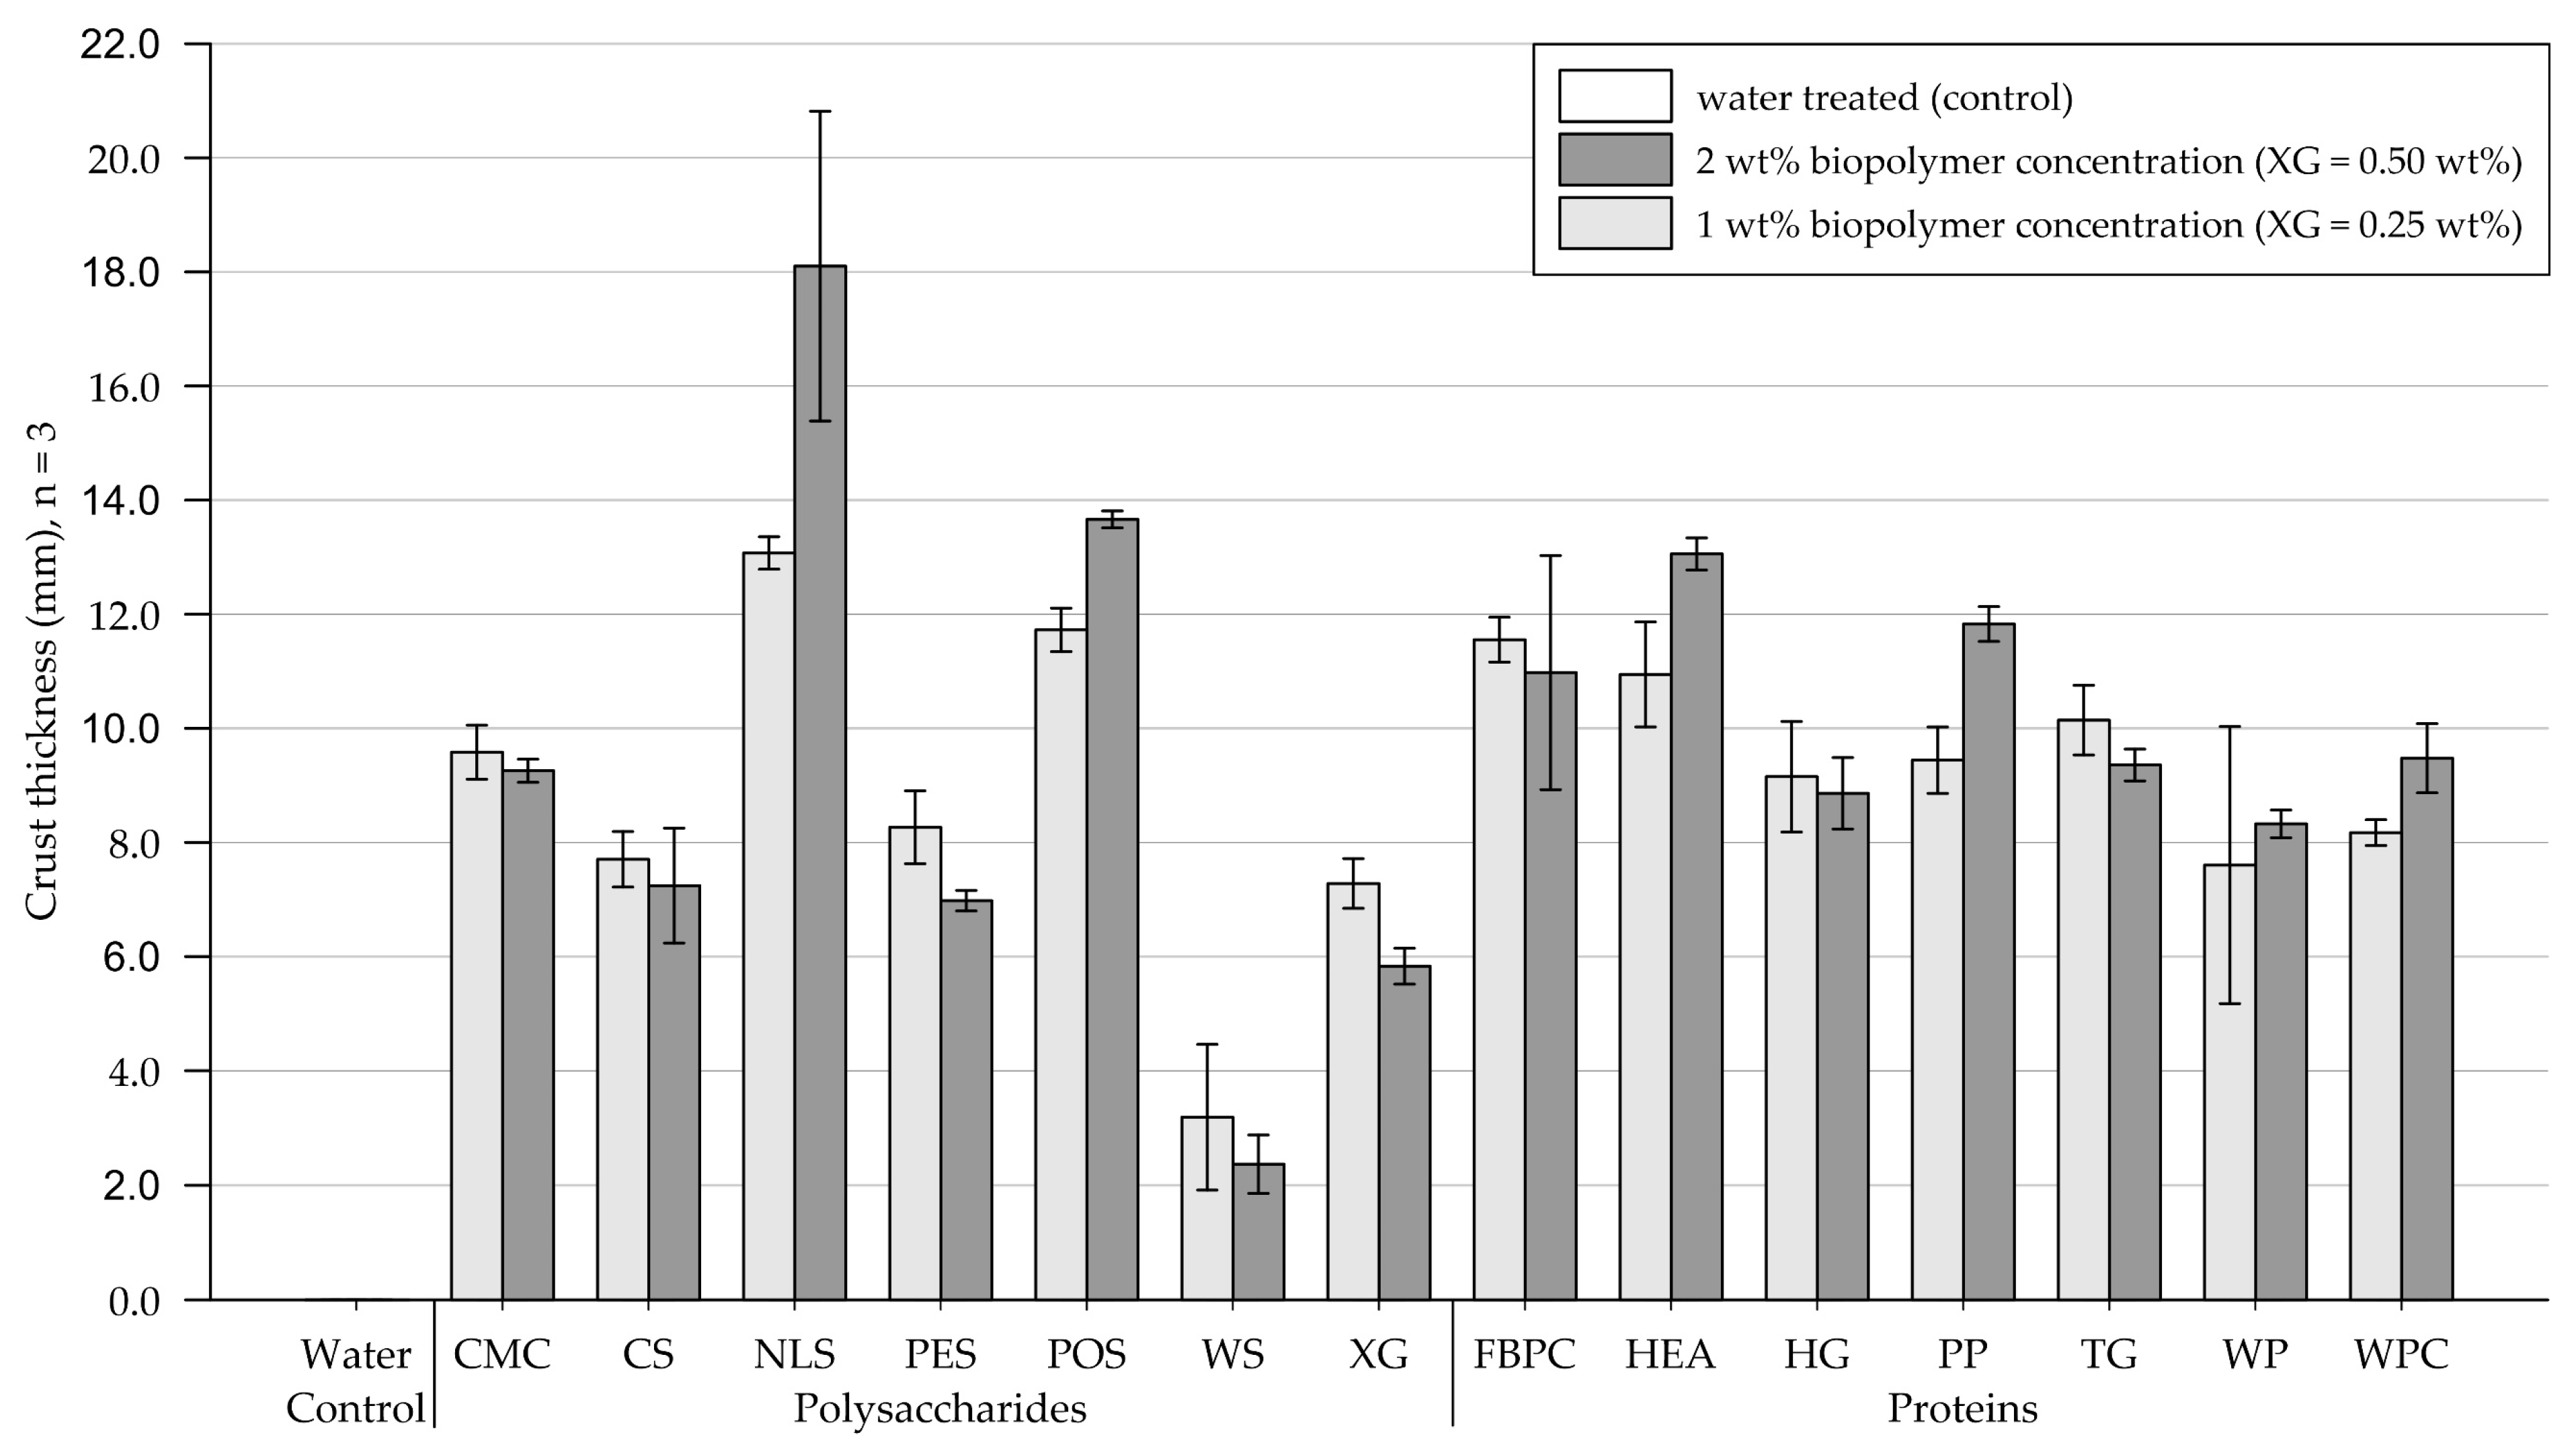
3.3.2. Fine-Grained Silica Sand
4. Discussion
4.1. Moisture Retention Tests
4.1.1. Effect of Biopolymer Type
4.1.2. Effect of Biopolymer Concentration
4.2. Penetrometer Tests
4.2.1. Effect of Biopolymer Type
4.2.2. Effect of Biopolymer Concentration
4.3. Crust Thickness Measurements
4.3.1. Effect of Biopolymer Type
4.3.2. Effect of Biopolymer Concentration
4.4. Evaluation of Tested Biopolymers as Dust Suppressants
5. Conclusions
- Penetrometer test results on biopolymer-treated medium-grained sand ranged from 1.7 to 34.0 N (control = 1.5 N) and on fine-grained silica sand from 6.7 to 37.9 N (control = 1.7 N), respectively. The results showed that all tested biopolymers formed crusts with significantly differing penetration resistances depending on the biopolymer type (p < .05). Increasing the biopolymer concentration significantly increased the penetration resistance on medium-grained sand (p < .001). In contrast, on fine-grained silica sand, it only increased the penetration resistance of protein treatments significantly (p < .001). Proteins achieved similar penetration resistances as polysaccharides but required higher concentrations.
- Moisture-retention test results on medium-grained sand ranged from 3.4 to 19.5 wt% (control = 6.9 wt%) and on fine-grained silica sand from 1.0 to 18.2 wt% (control = 2.5 wt%). On both tested soil types, the biopolymer type had a significant effect (p < .001) on the samples’ moisture retention, resulting in it decreasing or increasing relative to the water-treated control. Increasing the concentration increased moisture retention of protein-treated fine-grained silica sand samples significantly (p < .001).
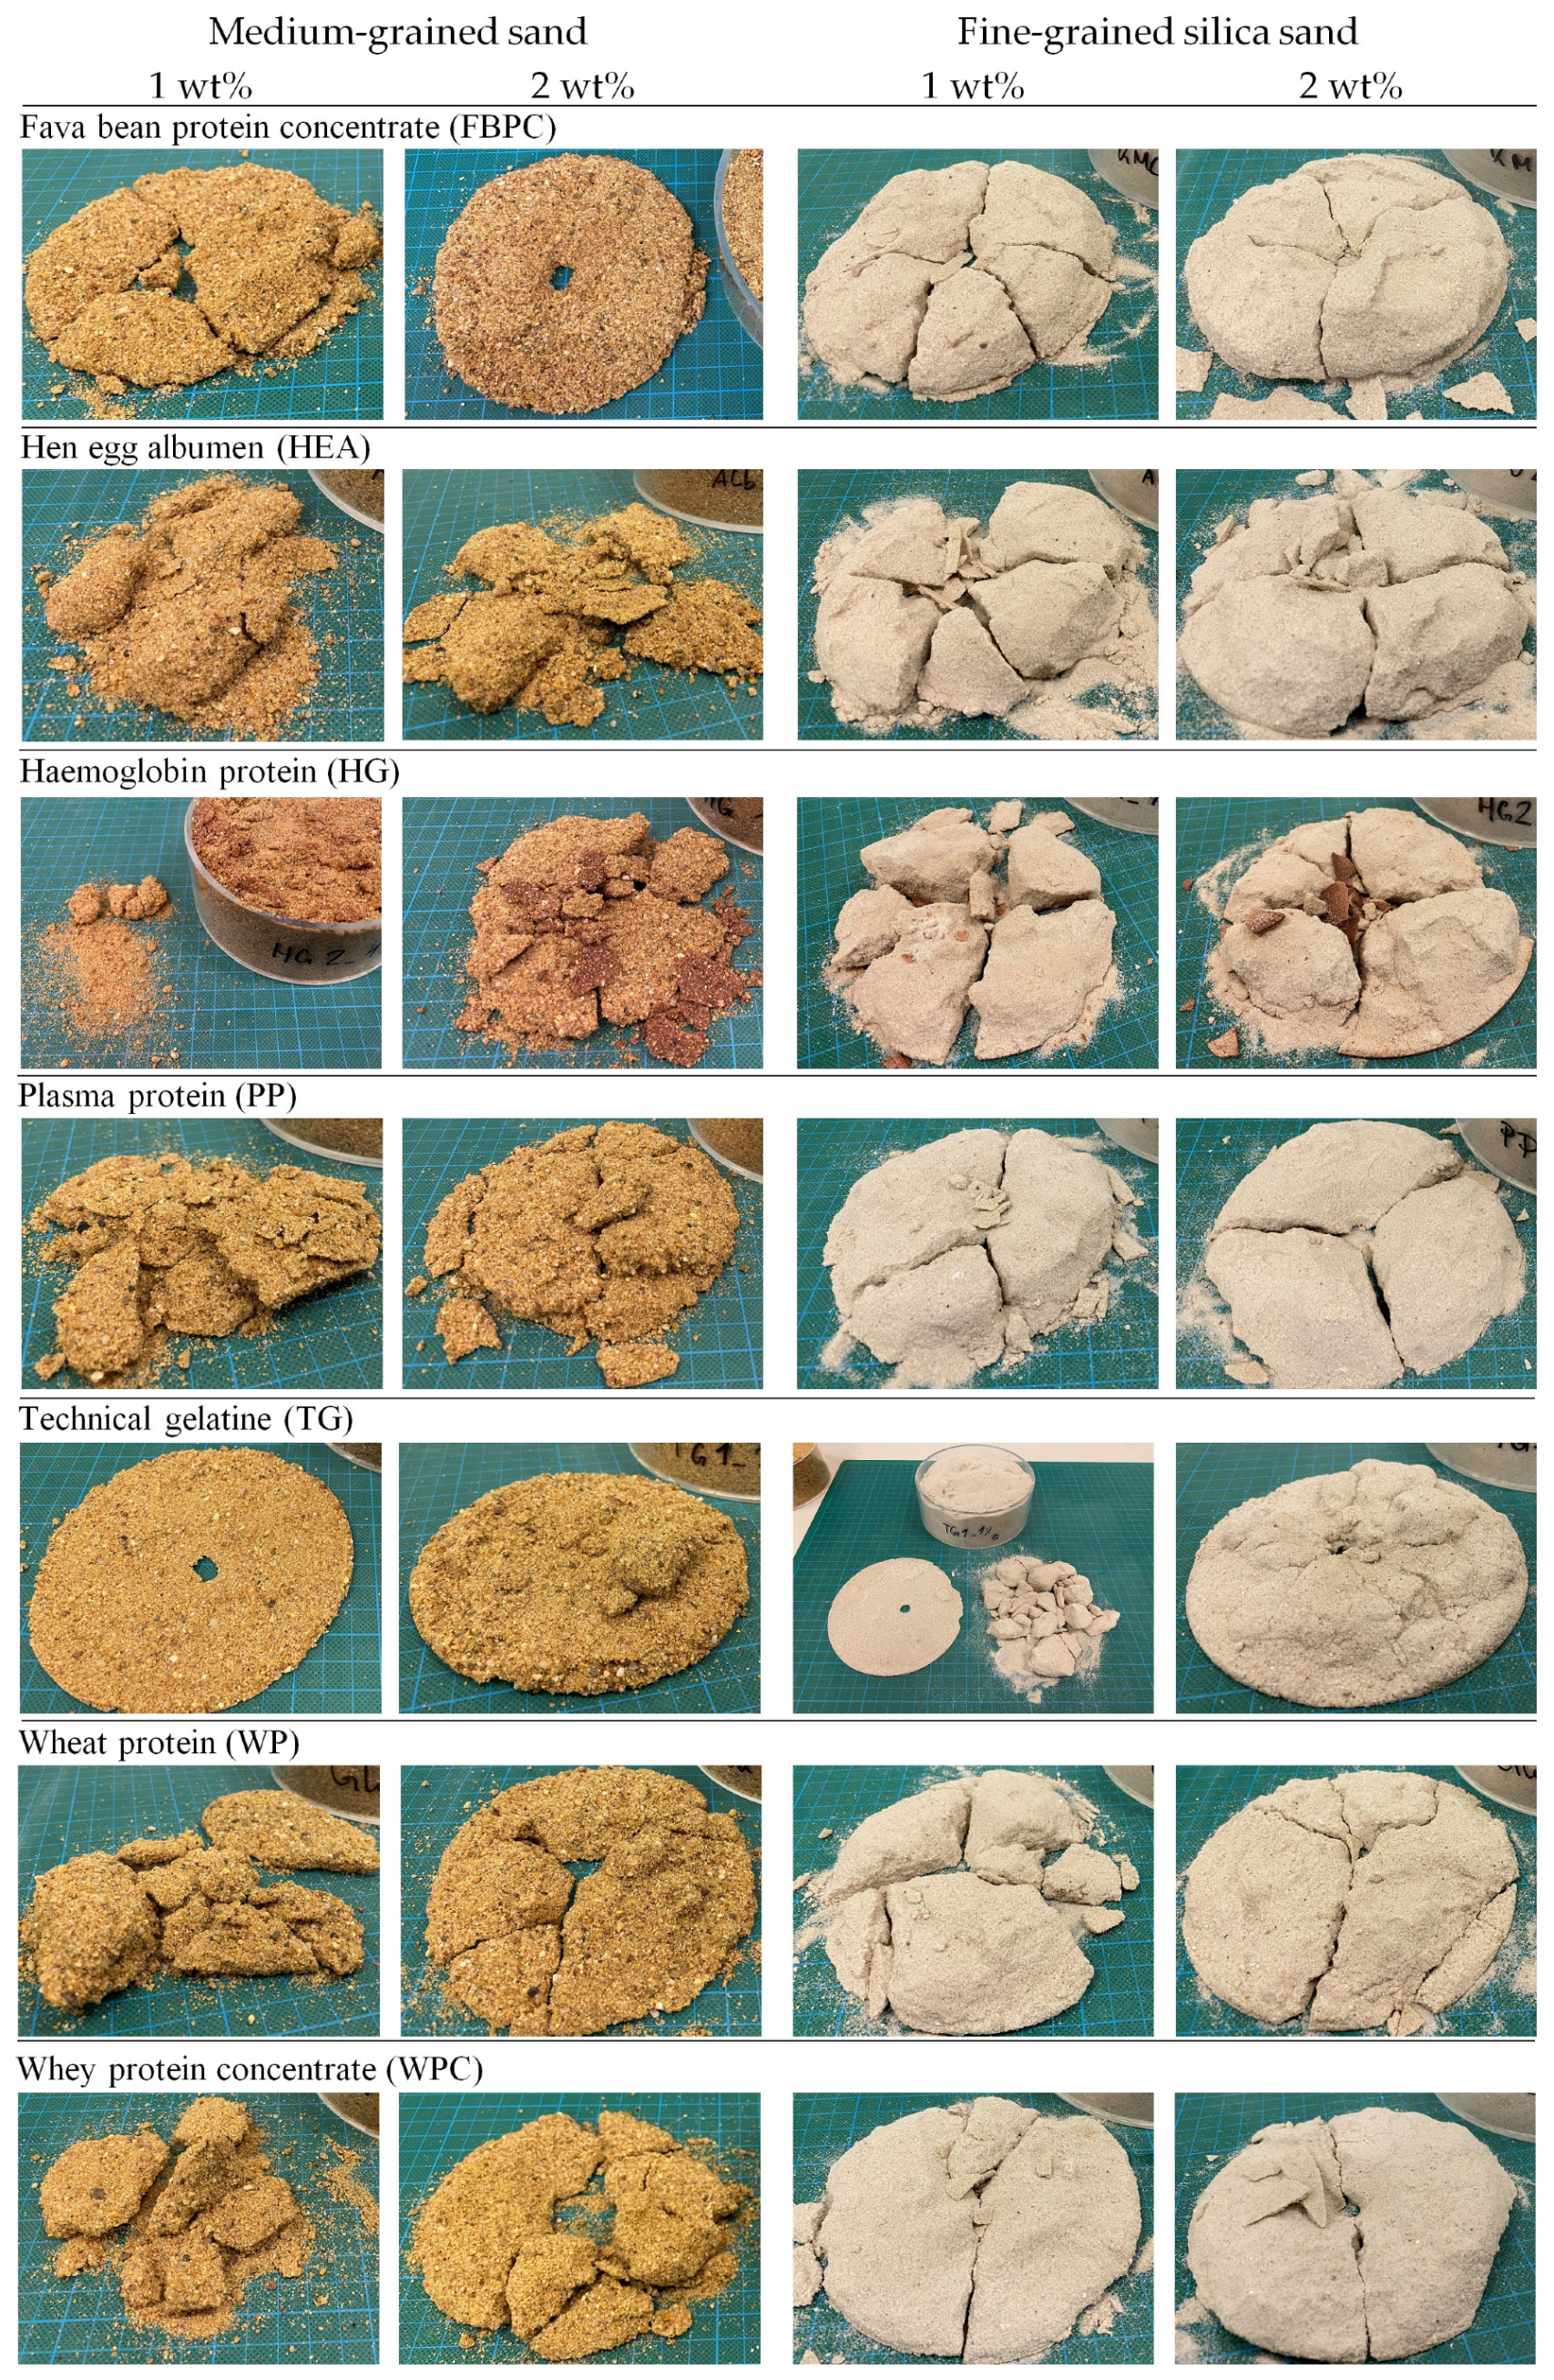
- The thicknesses of crusts formed on biopolymer-amended medium-grained sand samples ranged from 0.3 to 8.8 mm (control = 0 mm) and on fine-grained silica sand from 3.2 to 18.1 mm (control = 0 mm). The results showed that the different biopolymers formed crusts of varying thicknesses, with the biopolymer type significantly affecting the crust thickness (p < .001). On medium-grained sand, doubling the concentration only had a significant effect for protein amendments (p < .001) and resulted in the crust thickness increasing. On fine-grained sand, increasing the concentration slightly reduced the crust thickness of most treatments because of a lower infiltration depth.
Author Contributions
Funding
Data Availability Statement
Acknowledgments
Conflicts of Interest
Appendix A

| Biopolymer | Source | Solubility | Type of Application | References |
|---|---|---|---|---|
| Polysaccharides | ||||
| Arabic gum (Acacia gum) | Exudate from acacia trees | Cold-water soluble | Spray-on (dust control) | [16] |
| Mix-in (soil stabilisation) | [16,78] | |||
| Agar gum | Red algae (Gelidium and Gracilaria) | Hot-water soluble (>86 °C) | Mix-in (soil stabilisation) | [25,79,80] |
| β-glucan | Extracted from cells of yeast, fungi, certain bacteria and cereals | Cold-water soluble | Mix-in (soil stabilisation) | [25,81,82,83,84,85,86] |
| Carrageenan | Red algae (Chondracanthus) | Cold-water soluble | Spray-on (dust control) | [87,88] |
| Mix-in (soil stabilisation) | [58,88] | |||
| Chitosan | Chitin shells of crustaceans | Soluble in acetic solutions | Mix-in (soil stabilisation) | [55,89,90,91,92,93] |
| Spray-on (dust control) | [87,94,95] | |||
| Carboxymethyl cellulose | Cellulose derivative | Cold-water soluble | Mix-in (soil stabilisation) | [96,97,98,99] |
| Spray-on (dust control) | [14,17] | |||
| Dextran | Microbial | Mix-in (soil stabilisation) | [100] | |
| Spray-on (dust control) | [101] | |||
| Gellan gum | Bacteria | Poor solubility at low temperature (fully dissolvable > 80 °C) | Mix-in (soil stabilisation) | [37,96,102,103,104,105,106] |
| Guar gum | Guar beans | Cold-water soluble | Mix-in (soil stabilisation) | e.g., [13,33,82,83,96,107,108,109,110,111] |
| Spray-on (dust control) | [14,15,46] | |||
| Lignosulfonate | By-product of wood pulp production | Cold-water soluble | Spray-on (dust control) | [19,26,33,112] |
| Locust bean gum | Carob tree seeds | Mix-in (soil stabilisation) | [113] | |
| Pectin | Citrus fruit lamella and cell walls | Cold-water soluble | Spray-on (dust control) | [16] |
| Persian gum | Exudate from almond tree trunk and branches | Cold-water soluble (30% soluble, 70% insoluble) | Mix-in (soil stabilisation) | [114] |
| Sodium alginate | Brown algae | Cold-water soluble | Spray-on (dust control) | [15,16,67,115] |
| Mix-in (soil stabilisation) | [16,91,116,117,118,119,120] | |||
| Starch | ||||
| Corn | Corn | Cold-water soluble | Spray-on (dust control) | [121] |
| Mix-in (soil stabilisation) | [58,80] | |||
| Potato | Potato | Cold-water soluble | Spray-on (dust control) | [47] |
| Xanthan gum | Bacteria | Cold-water soluble | Spray-on (dust control) | [17,122] |
| Mix-in (soil stabilisation) | e.g., [82,107,123,124,125,126,127,128] | |||
| Proteins | ||||
| Casein | Milk | Soluble in alkaline solutions | Mix-in (soil stabilisation) | [129,130,131,132,133,134] |
| Bovine blood plasma | Bovine blood | [62] | ||
| Gelatin | Collagen from animal bones and tissues | Warm-water soluble (>40 °C) | Spray-on (dust control) | [47,63] |
| Soybean | Soybean | Cold-water soluble | Spray-on (dust control) | [135,136] |
| Moisture Retention (wt%) | ||||||||
|---|---|---|---|---|---|---|---|---|
| Medium-Grained Sand | Fine-Grained Silica Sand | |||||||
| 1 wt% | 2 wt% | 1 wt% | 2 wt% | |||||
| M | SD | M | SD | M | SD | M | SD | |
| Polysaccharides | ||||||||
| Carboxymethyl cellulose | 6.3 | 3.1 | 5.8 | 0.5 | 4.0 | 0.9 | 4.1 | 0.1 |
| Corn starch | 16.1 | 3.6 | 13.6 | 1.0 | 1.5 | 0.5 | 2.7 | 0.1 |
| Sodium lignosulfonate | 9.2 | 2.7 | 11.2 | 1.6 | 1.7 | 0.3 | 3.7 | 1.2 |
| Pea starch | 7.8 | 0.9 | 4.6 | 0.2 | 1.0 | 0.3 | 2.1 | 0.8 |
| Potato starch | 5.3 | 0.5 | 5.3 | 0.7 | 1.5 | 0.1 | 2.5 | 0.1 |
| Wheat starch | 6.2 | 0.5 | 12.3 | 1.7 | 5.1 | 0.9 | 7.2 | 1.5 |
| Xanthan gum | 3.4 | 0.2 | 4.0 | 0.9 | 6.2 | 0.9 | 2.5 | 0.3 |
| Average | 7.8 | 3.8 | 8.1 | 3.8 | 3.0 | 1.9 | 3.6 | 1.6 |
| Proteins | ||||||||
| Fava bean protein concentrate | 12.7 | 3.7 | 14.5 | 1.2 | 14.0 | 1.0 | 17.2 | 0.8 |
| Hen egg albumen | 12.3 | 2.0 | 12.4 | 1.7 | 1.6 | 0.2 | 2.3 | 0.0 |
| Haemoglobin protein | 7.0 | 1.9 | 4.9 | 3.2 | 13.1 | 2.4 | 18.2 | 2.0 |
| Plasma protein | 3.2 | 0.4 | 2.4 | 0.1 | 1.4 | 0.2 | 2.1 | 0.0 |
| Technical gelatin | 17.9 | 0.9 | 19.5 | 3.0 | 14.0 | 1.2 | 12.7 | 0.6 |
| Wheat protein | 15.6 | 1.0 | 19.0 | 2.7 | 2.0 | 0.4 | 2.1 | 0.2 |
| Whey protein concentrate | 5.2 | 2.0 | 5.3 | 2.1 | 1.2 | 0.1 | 2.8 | 0.1 |
| Average | 10.5 | 5.1 | 11.1 | 6.5 | 6.7 | 6.0 | 8.2 | 7.0 |
| Penetration Resistance (N) | ||||||||
|---|---|---|---|---|---|---|---|---|
| Medium-Grained Sand | Fine-Grained Silica Sand | |||||||
| 1 wt% | 2 wt% | 1 wt% | 2 wt% | |||||
| M | SD | M | SD | M | SD | M | SD | |
| Polysaccharides | ||||||||
| Carboxymethyl cellulose | 11.5 | 2.0 | 21.1 | 3.6 | 14.9 | 3.2 | 16.4 | 2.9 |
| Corn starch | 14.2 | 2.0 | 27.4 | 4.4 | 18.0 | 4.8 | 25.4 | 8.6 |
| Sodium lignosulfonate | 1.7 | 0.2 | 4.3 | 1.3 | 14.2 | 3.1 | 21.1 | 3.1 |
| Pea starch | 8.0 | 1.2 | 20.1 | 4.3 | 10.8 | 2.2 | 14.4 | 1.1 |
| Potato starch | 4.4 | 0.6 | 16.8 | 1.3 | 10.1 | 1.7 | 19.0 | 1.6 |
| Wheat starch | 13.3 | 0.9 | 14.4 | 2.1 | 10.0 | 1.3 | 8.8 | 0.4 |
| Xanthan gum | 12.4 | 5.5 | 26.5 | 3.9 | 20.7 | 5.3 | 16.0 | 2.8 |
| Average | 9.4 | 4.5 | 18.7 | 7.3 | 14.1 | 3.8 | 17.3 | 4.9 |
| Proteins | ||||||||
| Fava bean protein concentrate | 8.8 | 2.9 | 15.9 | 1.7 | 15.0 | 4.1 | 30.3 | 3.9 |
| Hen egg albumen | 2.5 | 0.7 | 5.6 | 3.0 | 10.8 | 2.4 | 13.9 | 0.6 |
| Haemoglobin protein | 2.1 | 0.5 | 10.2 | 1.7 | 6.7 | 1.9 | 11.2 | 2.7 |
| Plasma protein | 3.5 | 1.6 | 15.4 | 2.8 | 15.8 | 2.6 | 21.0 | 4.8 |
| Technical gelatin | 8.0 | 0.2 | 34.0 | 6.0 | 20.0 | 4.5 | 37.9 | 2.1 |
| Wheat protein | 3.5 | 1.2 | 13.5 | 3.8 | 9.1 | 0.9 | 18.5 | 2.9 |
| Whey protein concentrate | 2.4 | 0.5 | 2.5 | 0.7 | 10.0 | 1.0 | 15.6 | 3.2 |
| Average | 4.4 | 2.6 | 13.9 | 9.5 | 12.5 | 4.3 | 21.2 | 8.9 |
| Modulus of Elasticity (kN m−1) | ||||||||
|---|---|---|---|---|---|---|---|---|
| Medium-Grained Sand | Fine-Grained Silica Sand | |||||||
| 1 wt% | 2 wt% | 1 wt% | 2 wt% | |||||
| M | SD | M | SD | M | SD | M | SD | |
| Polysaccharides | ||||||||
| Carboxymethyl cellulose | 17.2 | 4.0 | 21.7 | 5.7 | 20.7 | 4.3 | 20.7 | 6.3 |
| Corn starch | 27.7 | 14.1 | 27.2 | 5.9 | 69.1 | 50.5 | 38.7 | 26.2 |
| Sodium lignosulfonate | 0.6 | 0.1 | 3.7 | 2.1 | 22.2 | 9.1 | 28.7 | 6.4 |
| Pea starch | 6.8 | 1.4 | 20.1 | 3.2 | 24.2 | 8.3 | 43.4 | 18.8 |
| Potato starch | 4.8 | 0.3 | 20.2 | 6.2 | 25.7 | 5.9 | 65.0 | 13.9 |
| Wheat starch | 15.9 | 1.5 | 13.2 | 3.0 | 8.6 | 2.4 | 7.4 | 0.7 |
| Xanthan gum | 23.9 | 9.3 | 36.0 | 11.4 | 41.2 | 12.1 | 20.7 | 3.5 |
| Average | 13.8 | 9.4 | 20.3 | 9.4 | 30.2 | 18.2 | 32.1 | 17.5 |
| Proteins | ||||||||
| Fava bean protein concentrate | 13.0 | 8.6 | 21.1 | 5.0 | 36.3 | 7.8 | 87.2 | 44.8 |
| Hen egg albumen | 1.3 | 0.3 | 7.4 | 3.3 | 19.7 | 9.3 | 26.3 | 3.7 |
| Haemoglobin protein | 1.2 | 0.2 | 13.1 | 5.6 | 14.1 | 7.1 | 27.3 | 12.8 |
| Plasma protein | 4.3 | 3.1 | 18.3 | 9.3 | 22.7 | 6.1 | 30.9 | 3.0 |
| Technical gelatin | 9.4 | 1.4 | 31.2 | 5.3 | 32.8 | 9.3 | 33.7 | 6.2 |
| Wheat protein | 3.7 | 2.8 | 13.8 | 3.8 | 14.1 | 3.7 | 47.0 | 16.6 |
| Whey protein concentrate | 1.8 | 1.6 | 1.5 | 0.5 | 19.9 | 2.6 | 22.4 | 6.2 |
| Average | 5.0 | 4.2 | 15.2 | 8.9 | 22.8 | 8.0 | 39.3 | 20.9 |
| Crust Thickness (mm) | ||||||||
|---|---|---|---|---|---|---|---|---|
| Medium-Grained Sand | Fine-Grained Silica Sand | |||||||
| 1 wt% | 2 wt% | 1 wt% | 2 wt% | |||||
| M | SD | M | SD | M | SD | M | SD | |
| Polysaccharides | ||||||||
| Carboxymethyl cellulose | 6.3 | 1.6 | 7.1 | 0.4 | 9.6 | 0.5 | 9.3 | 0.2 |
| Corn starch | 7.5 | 0.3 | 5.9 | 0.8 | 7.7 | 0.5 | 7.3 | 1.0 |
| Sodium lignosulfonate | 2.4 | 1.0 | 4.6 | 0.9 | 13.1 | 0.3 | 18.1 | 2.7 |
| Pea starch | 6.3 | 0.2 | 6.9 | 0.4 | 8.3 | 0.6 | 7.0 | 0.2 |
| Potato starch | 3.4 | 0.5 | 7.3 | 0.2 | 11.7 | 0.4 | 13.7 | 0.2 |
| Wheat starch | 6.3 | 0.4 | 4.7 | 1.6 | 3.2 | 1.3 | 2.4 | 0.5 |
| Xanthan gum | 6.6 | 0.1 | 5.9 | 0.1 | 7.3 | 0.4 | 5.8 | 0.3 |
| Average | 5.5 | 1.8 | 6.1 | 1.0 | 8.7 | 3.0 | 9.1 | 4.9 |
| Proteins | ||||||||
| Fava bean protein concentrate | 7.6 | 0.4 | 8.8 | 0.1 | 11.6 | 0.4 | 11.0 | 2.1 |
| Hen egg albumen | 0.4 | 0.4 | 2.8 | 0.9 | 11.0 | 0.9 | 13.1 | 0.3 |
| Haemoglobin protein | 0.3 | 0.4 | 6.8 | 0.5 | 9.2 | 1.0 | 8.9 | 0.6 |
| Plasma protein | 5.2 | 0.8 | 7.0 | 0.2 | 9.4 | 0.6 | 11.8 | 0.3 |
| Technical gelatin | 2.3 | 0.7 | 5.8 | 0.4 | 10.1 | 0.6 | 9.4 | 0.3 |
| Wheat protein | 5.5 | 0.5 | 8.1 | 1.2 | 7.6 | 2.4 | 8.3 | 0.2 |
| Whey protein concentrate | 4.0 | 0.5 | 4.7 | 1.7 | 8.2 | 0.2 | 9.5 | 0.6 |
| Average | 3.6 | 2.6 | 6.3 | 1.9 | 9.6 | 1.3 | 10.3 | 1.6 |
| Classification | Biopolymers | Description |
|---|---|---|
| Medium-grained sand | ||
| Solid crusts | Polysaccharides: CS, CMC, WS, XG Proteins: FBPC, TG | 1 and 2 wt% (XG = 0.25 and 0.50 wt%) concentrations. Crusts were recoverable in a single piece or up to four fully recoverable pieces. |
| Mediocre crusts | Polysaccharides: PES, POS Proteins: PP, WP, WPC | 1 wt% concentration. Crusts broke into multiple large pieces, whereby some pieces were only partially recoverable and crumbled into countless pieces. 2 wt% concentration. Crusts were almost fully recoverable in several pieces. |
| Weak crusts | Polysaccharides: NLS Proteins: HEA, HG | 1 wt% concentration. Crusts were very weak and brittle, crumbling into countless unrecoverable pieces. 2 wt% concentration. Crusts had increased stability but were still extremely fragile. |
| Fine-grained silica sand | ||
| Solid crusts | Polysaccharides: CS, CMC, PES, XG | 1 and 2 wt% (XG = 0.25 and 0.50 wt%) concentrations. Crusts were recoverable in a single piece or up to four fully recoverable pieces. |
| Mediocre crusts | Polysaccharides: NLS, POS Proteins: FBPC, HEA, HG, PP, TG, WP, WPC | 1 and 2 wt% concentrations. Crusts were thick and almost fully recoverable in a few pieces at both tested concentrations. (TG exhibited a unique characteristic, as the uppermost part of its crust peeled off from the lower part while recovering the crust.) |
| Ductile crusts | Polysaccharides: WP | 1 and 2 wt% concentrations. Crusts were very thin and ductile and even curled up during the curing period. |
| Biopolymer | Soil | D50 (mm) | Cu | Penetrometer | AR | Maximum Penetration Resistance (N) at Different Tested Concentrations (wt%) | Reference | ||||||||||||
|---|---|---|---|---|---|---|---|---|---|---|---|---|---|---|---|---|---|---|---|
| Shape | d (mm) | (L/m2) | 0 | 0.3 | 0.5 | 0.6 | 0.7 | 0.8 | 1.0 | 1.5 | 1.6 | 2.0 | 3.0 | 5.0 | |||||
| Acacia gum | Poorly graded sand (SP) | 0.15 a | 2.1 a | flat | 6 | 1.3 | 1.1 a | 10.0 a | 15.0 a | 21.0 a | 30.0 a | 50.0 a | [16] | ||||||
| 0.15 a | 2.1 a | flat | 6 | 3.5 | 6.4 a | 18.0 a | 20.0 a | 50.0 a | 70.0 a | 145.0 a | [16] | ||||||||
| Sodium alginate | 0.15 a | 2.1 a | flat | 6 | 1.3 | 1.1 a | 9.0 a | 17.5 a | 18.0 a | 15.0 a | N/A | [16] | |||||||
| 0.15 a | 2.1 a | flat | 6 | 3.5 | 6.4 a | 7.5 a | 21.0 a | 25.0 a | N/A | N/A | [16] | ||||||||
| Pectin | 0.15 a | 2.1 a | flat | 6 | 1.3 | 1.1 a | 15.0 a | 20.0 a | 28.0 a | 22.0 a | 15.0 a | [16] | |||||||
| 0.15 a | 2.1 a | flat | 6 | 3.5 | 6.4 a | 20.0 a | 39.0 a | 33.0 a | 30.0 a | N/A | [16] | ||||||||
| Carboxymethyl cellulose | Poorly graded sand with silt (SP-SM) | 0.16 a | 2.2 a | flat | 6 | 1 | 0.0 b | 1.0 b | 2.2 b | 2.3 b | [14] | ||||||||
| 0.16 a | 2.2 a | flat | 6 | 2 | 0.0 b | 2.8 b | 3.6 b | 5.7 b | [14] | ||||||||||
| Guar gum | 0.16 a | 2.2 a | flat | 6 | 1 | 0.0 b | 0.7 b | 1.4 b | 2.4 b | [14] | |||||||||
| 0.16 a | 2.2 a | flat | 6 | 2 | 0.0 b | 2.3 b | 2.8 b | 3.5 b | [14] | ||||||||||
| Guar gum | Mine tailings | 0.15 a | 33.9 a | flat | 6 | 1.9 | 212.8 | 263.0 | 358.8 | 428.0 | [49] | ||||||||
| Xanthan gum | 0.15 a | 33.9 a | flat | 6 | 1.9 | 212.8 | 250.8 | 304.5 | 340.6 | [49] | |||||||||
| Xanthan gum | Mine tailings | 0.13 a | 56.3 a | flat | 6 | 1.9 | 213.8 | 278.4 | 312.5 | 331.8 | [137] | ||||||||
| Xanthan gum | Hooralazim lagoon sand | 0.22 a | 7.5 a | flat | 6 | 1.9 | 5.0 a | 22.0 a | 28.0 a | 32.0 a | [17] | ||||||||
| Urmia lake sand | 0.13 a | 2.1 a | flat | 6 | 1.9 | 5.0 a | 6.0 a | 6.0 a | 11.0 a | [17] | |||||||||
| Mine tailings | 0.28 a | 9.4 a | flat | 6 | 1.9 | 12.0 a | 14.0 a | 27.0 a | 30.0 a | [17] | |||||||||
| Carboxymethyl cellulose | Hooralazim lagoon sand | 0.22 a | 7.5 a | flat | 6 | 1.9 | 5.0 a | 15.0 a | 38.0 a | 58.0 a | [17] | ||||||||
| Urmia lake sand | 0.13 a | 2.1 a | flat | 6 | 1.9 | 5.0 a | 14.0 a | 16.0 a | 28.0 a | [17] | |||||||||
| Mine tailings | 0.28 a | 9.4 a | flat | 6 | 1.9 | 12.0 a | 18.0 a | 27.0 a | 30.0 a | [17] | |||||||||
| Guar gum | Hooralazim lagoon sand | 0.22 a | 7.5 a | flat | 6 | 1.9 | 5.0 a | 8.0 a | 28.0 a | 39.0 a | [17] | ||||||||
| Urmia lake sand | 0.13 a | 2.1 a | flat | 6 | 1.9 | 5.0 a | 10.0 a | 14.0 a | 20.0 a | [17] | |||||||||
| Mine tailings | 0.28 a | 9.4 a | flat | 6 | 1.9 | 12.0 a | 16.0 a | 25.0 a | 31.0 | [17] | |||||||||
| Sodium alginate + CaCl2 | Poorly graded sand (SP) | 0.24 a | 1.7 | flat | 6 | 2.2 | N/A | 2.8 c | 5.4 c | 5.4 c | [67] | ||||||||
| Biopolymer | Soil | D50 (mm) | Cu | Penetrometer | AR | Maximum Penetration Resistance (N) at Different Tested Concentrations (wt%) | Reference | |||||||||||||
|---|---|---|---|---|---|---|---|---|---|---|---|---|---|---|---|---|---|---|---|---|
| shape | d (mm) | (L/m2) | 0 | 0.4 | 0.8 | 1.0 | 1.2 | 1.6 | 2.0 | 3.0 | 4.0 | 5.0 | 6.0 | 8.0 | 10.0 | |||||
| Polyacrylamide | Red loam sand (SP) | N/A | <5 | cone | 2 | 2 | 3.0 a | 5.5 a | 7.5 a | 9.5 a | 15.0 a | [46] | ||||||||
| Guar gum | N/A | <5 | cone | 2 | 2 | 3.0 a | 5.5 a | 7.0 a | 7.5 a | 8.5 a | [46] | |||||||||
| Xanthan gum | N/A | <5 | cone | 2 | 2 | 3.0 a | 5.5 a | 6.5 a | 7.0 a | 7.5 a | [46] | |||||||||
| Polyacrylamide | Red loam sand (SP) | N/A | <5 | cone | 2 | 2 | N/A | 6.0 a | 8.0 a | 9.8 a | [48] | |||||||||
| Guar gum | N/A | <5 | cone | 2 | 2 | N/A | 5.5 a | 7.0 a | 8.0 a | [48] | ||||||||||
| Xanthan gum | N/A | <5 | cone | 2 | 2 | N/A | 5.3 a | 6.5 a | 7.0 a | [48] | ||||||||||
| Sodium lignosulfonate | Red loam sand (SP) | N/A | <5 | cone | 2 | 2 | 3.0 a | 4.8 a | 5.0 a | 5.3 a | 6.5 a | 7.5 a | 7.8 a | 8.0 a | 9.5 a | [28] | ||||
| Calcium lignosulfonate | N/A | <5 | cone | 2 | 2 | 3.0 a | 3.5 a | 4.0 a | 4.5 a | 5.0 a | 5.3 a | 5.8 a | 6.3 a | 7.3 a | [28] | |||||
| Polyacrylamide | Red sand (d < 0.15) | N/A | N/A | cone | 2 | 2 | 3.2 | 6.2 | 7.8 | 9.6 | 12.3 | 15.3 | [13] | |||||||
| Red sand (0.15 < d < 0.3) | N/A | N/A | cone | 2 | 2 | 3.2 | 7.4 | 9.6 | 11.4 | 14.2 | 16.5 | [13] | ||||||||
| Red sand (0.3 < d < 0.45) | N/A | N/A | cone | 2 | 2 | 3.3 | 8.1 | 11.1 | 13.2 | 16.0 | 18.0 | [13] | ||||||||
| Guar gum | Red sand (d < 0.15) | N/A | N/A | cone | 2 | 2 | 3.2 | 5.7 | 7.0 | 8.3 | 9.3 | 10.2 | [13] | |||||||
| Red sand (0.15 < d < 0.3) | N/A | N/A | cone | 2 | 2 | 3.2 | 6.7 | 9.0 | 10.2 | 11.7 | 14.2 | [13] | ||||||||
| Red sand (0.3 < d < 0.45) | N/A | N/A | cone | 2 | 2 | 3.3 | 7.1 | 9.9 | 11.0 | 12.8 | 14.4 | [13] | ||||||||
| Xanthan gum | Red sand (d < 0.15) | N/A | N/A | cone | 2 | 2 | 3.2 | 5.4 | 6.4 | 7.2 | 7.7 | 8.1 | [13] | |||||||
| Red sand (0.15 < d < 0.3) | N/A | N/A | cone | 2 | 2 | 3.2 | 5.7 | 6.9 | 8.6 | 10.8 | 13.5 | [13] | ||||||||
| Red sand (0.3 < d < 0.45) | N/A | N/A | cone | 2 | 2 | 3.3 | 6.5 | 8.0 | 10.0 | 12.3 | 13.4 | [13] | ||||||||
| Sodium lignosulfonate | Red sand (d < 0.15) | N/A | N/A | cone | 2 | 2 | 3.0 a | 5.0 a | 7.0 a | 7.5 a | 8.0 a | 9.0 a | [33] | |||||||
| Red sand (0.15 < d < 0.3) | N/A | N/A | cone | 2 | 2 | 3.0 a | 6.5 a | 8.0 a | 9.0 a | 10.5 a | 13.0 a | [33] | ||||||||
| Red sand (d > 0.3) | N/A | N/A | cone | 2 | 2 | 3.0 a | 6.0 a | 8.5 a | 10.0 a | 12.5 a | 14.0 a | [33] | ||||||||
| Calcium lignosulfonate | Red sand (d < 0.15) | N/A | N/A | cone | 2 | 2 | 3.0 a | 3.5 a | 4.0 a | 5.5 a | 6.5 a | 7.5 a | [33] | |||||||
| Red sand (0.15 < d < 0.3) | N/A | N/A | cone | 2 | 2 | 3.0 a | 4.0 a | 5.5 a | 7.0 a | 8.5 a | 11.5 a | [33] | ||||||||
| Red sand (d > 0.3) | N/A | N/A | cone | 2 | 2 | 3.0 a | 5.0 a | 6.0 a | 8.0 a | 10.0 a | 12.5 a | [33] | ||||||||
| Biopolymer | Soil Type | AR | Crust Thickness (mm) at Different Tested Concentrations (%) | Reference | |||||||||||||||||
|---|---|---|---|---|---|---|---|---|---|---|---|---|---|---|---|---|---|---|---|---|---|
| (L/m2) | 0 | 0.3 | 0.4 | 0.5 | 0.7 | 0.8 | 1.0 | 1.2 | 1.6 | 2.0 | 3.0 | 4.0 | 5.0 | 6.0 | 7.0 | 8.0 | 9.0 | 10.0 | |||
| Acacia gum | Poorly graded sand (SP) | 1.3 | 7.4–11.9 | 5.1–11.4 | 5.2–11.5 | 3.8–10.9 | 2.8–10.9 | [16] | |||||||||||||
| Sodium alginate | 1.3 | 8.5–15.3 | 7.6–15.2 | 2.2–10.3 | 3.0–6.7 | [16] | |||||||||||||||
| Pectin | 1.3 | 3.8–8.4 | 3.6–7.3 | 4.6–6.1 | 2.4–3.0 | 0.9–1.2 | [16] | ||||||||||||||
| Acacia gum | 3.5 | 15.1–29.8 | 12.6–29.3 | 11.5–22.1 | 11.5–22.0 | 9.7–21.6 | [16] | ||||||||||||||
| Sodium alginate | 3.5 | 9.0–12.1 | 2.6–4.7 | 1.6–3.2 | 1.2–2.1 | [16] | |||||||||||||||
| Pectin | 3.5 | 8.5–15.3 | 7.6–15.2 | 2.2–10.3 | 3.0–6.7 | 0.7–1.9 | [16] | ||||||||||||||
| Sodium alginate + CaCl2 | Poorly graded sand (SP) | 2.2 | 5.2–7.8 | 4.9–8.0 | 5.9–7.7 | [67] | |||||||||||||||
| Carboxymethyl cellulose | Poorly graded sand with silt (SP-SM) | 1.0 | 4.0 | 3.8 | 3.4 | [14] | |||||||||||||||
| Guar gum | 2.0 | 3.9 | 4.5 | 4.2 | [14] | ||||||||||||||||
| Carboxymethylcellulose | 1.0 | 7.9 | 6.3 | 6.0 | [14] | ||||||||||||||||
| Guar gum | 2.0 | 6.6 | 7.8 | 10.3 | [14] | ||||||||||||||||
| Sodium lignosulfonate | Red sand (SP) | 2.0 | 11.0 a | 10.5 a | 11.0 a | 8.5 a | 7.5 a | 7.5 a | 7.0 a | 6.5 a | 6.5 a | 6.0 a | [28] | ||||||||
| Calcium lignosulfonate | 2.0 | 11.0 a | 10.5 a | 10.5 a | 10.0 a | 10.0 a | 9.5 a | 9.0 a | 8.5 a | 8.0 a | 7.5 a | [28] | |||||||||
| Polyacrylamide | Red sand (SP) | 2.0 | 30.0 a | 26.0 a | 15.0 a | 14.5 a | 12.0 a | [46] | |||||||||||||
| Guar gum | 2.0 | 30.0 a | 19.0 a | 23.0 a | 27.0 a | 22.5 a | [46] | ||||||||||||||
| Xanthan gum | 2.0 | 30.0 a | 13.0 a | 12.0 a | 10.0 a | 8.0 a | [46] | ||||||||||||||
| Polyacrylamide | Red sand (d < 0.15) | 2.0 | 30.0 a | 27.5 a | 22.5 a | 19.0 a | 15.0 a | 15.0 a | [33] | ||||||||||||
| Guar gum | 2.0 | 30.0 a | 26.0 a | 20.0 a | 14.0 a | 14.5 a | 14.0 a | [33] | |||||||||||||
| Xanthan gum | 2.0 | 30.0 a | 13.5 a | 11.5 a | 12.0 a | 12.5 a | 10.5 a | [33] | |||||||||||||
References
- Entwistle, J.A.; Hursthouse, A.S.; Marinho Reis, P.A.; Stewart, A.G. Metalliferous mine dust: Human health impacts and the potential determinants of disease in mining communities. Curr. Pollut. Rep. 2019, 5, 67–83. [Google Scholar] [CrossRef] [Green Version]
- Zota, A.R.; Riederer, A.M.; Ettinger, A.S.; Schaider, L.A.; Shine, J.P.; Amarasiriwardena, C.J.; Wright, R.O.; Spengler, J.D. Associations between metals in residential environmental media and exposure biomarkers over time in infants living near a mining-impacted site. J. Expo. Sci. Environ. Epidemiol. 2016, 26, 510–519. [Google Scholar] [CrossRef] [PubMed] [Green Version]
- Tian, S.; Liang, T.; Li, K. Fine road dust contamination in a mining area presents a likely air pollution hotspot and threat to human health. Environ. Int. 2019, 128, 201–209. [Google Scholar] [CrossRef] [PubMed]
- Zanetta-Colombo, N.C.; Fleming, Z.L.; Gayo, E.M.; Manzano, C.A.; Panagi, M.; Valdés, J.; Siegmund, A. Impact of mining on the metal content of dust in indigenous villages of northern Chile. Environ. Int. 2022, 169, 107490. [Google Scholar] [CrossRef]
- Khan, R.K.; Strand, M.A. Road dust and its effect on human health: A literature review. Epidemiol. Health 2018, 40, e2018013. [Google Scholar] [CrossRef]
- du Plessis, J.J.; Janse van Rensburg, L. Effectiveness of applying dust suppression palliatives on haul roads. J. Mine Vent. Soc. S. Afr. 2015, 69, 15–19. [Google Scholar]
- Thompson, R.J.; Visser, A.T. Selection, performance and economic evaluation of dust palliatives on surface mine haul roads. J. S. Afr. Inst. Min. Metall. 2007, 107, 435–450. [Google Scholar]
- Clarke, B.; Otto, F.; Stuart-Smith, R.; Harrington, L. Extreme weather impacts of climate change: An attribution perspective. Environ. Res. Clim. 2022, 1, 12001. [Google Scholar] [CrossRef]
- IPCC. Climate Change 2022: Impacts, Adaption and Vulnerability: Contribution of Working Group II to the Sixth Assessment Report of the Intergovernmental Panel on Climate Change; IPCC: Geneva, Switzerland, 2022. [Google Scholar] [CrossRef]
- Philip, S.; Martin, R.V.; Snider, G.; Weagle, C.L.; van Donkelaar, A.; Brauer, M.; Henze, D.K.; Klimont, Z.; Venkataraman, C.; Guttikunda, S.K.; et al. Anthropogenic fugitive, combustion and industrial dust is a significant, underrepresented fine particulate matter source in global atmospheric models. Environ. Res. Lett. 2017, 12, 44018. [Google Scholar] [CrossRef]
- Parvej, S.; Naik, D.L.; Sajid, H.U.; Kiran, R.; Huang, Y.; Thanki, N. Fugitive dust suppression in unpaved roads: State of the art research review. Sustainability 2021, 13, 2399. [Google Scholar] [CrossRef]
- Piechota, T.C.; van Ee, J.; Stave, K.; James, D. Potential Environmental Impacts of Dust Suppressants: “Avoiding Another Times Beach”; U.S. Environmental Protection Agency: Las Vegas, NV, USA, 2002.
- Ding, X.; Luo, Z.; Xu, G.; Chang, P. Characterization of red sand dust pollution control performance via static and dynamic laboratorial experiments when applying polymer stabilizers. Environ. Sci. Pollut. Res. Int. 2021. [Google Scholar] [CrossRef] [PubMed]
- Owji, R.; Habibagahi, G.; Nikooee, E.; Afzali, S.F. Wind erosion control using carboxymethyl cellulose: From sand bombardment performance to microfabric analysis. Aeolian Res. 2021, 50, 100696. [Google Scholar] [CrossRef]
- Wade, E.; Zowada, R.; Foudazi, R. Alginate and guar gum spray application for improving soil aggregation and soil crust integrity. Carbohydr. Polym. 2021, 2, 100114. [Google Scholar] [CrossRef]
- Lemboye, K.; Almajed, A.; Alnuaim, A.; Arab, M.; Alshibli, K. Improving sand wind erosion resistance using renewable agriculturally derived biopolymers. Aeolian Res. 2021, 49, 100663. [Google Scholar] [CrossRef]
- Toufigh, V.; Ghassemi, P. Control and stabilization of fugitive dust: Using eco-friendly and sustainable materials. Int. J. Geomech. 2020, 20, 4020140. [Google Scholar] [CrossRef]
- Runnels, C.M.; Lanier, K.A.; Williams, J.K.; Bowman, J.C.; Petrov, A.S.; Hud, N.V.; Williams, L.D. Folding, assembly, and persistence: The essential nature and origins of biopolymers. J. Mol. Evol. 2018, 86, 598–610. [Google Scholar] [CrossRef] [Green Version]
- Katra, I. Comparison of diverse dust control products in wind-induced dust emission from unpaved roads. Appl. Sci. 2019, 9, 5204. [Google Scholar] [CrossRef] [Green Version]
- Jang, J. A review of the application of biopolymers on geotechnical engineering and the strengthening mechanisms between typical biopolymers and soils. Adv. Mater. Sci. Eng. 2020, 2020, 1465709. [Google Scholar] [CrossRef] [Green Version]
- Fatehi, H.; Ong, D.E.L.; Yu, J.; Chang, I. Biopolymers as green binders for soil improvement in geotechnical applications: A review. Geosci. J. 2021, 11, 291. [Google Scholar] [CrossRef]
- Mendonça, A.; Morais, P.V.; Pires, A.C.; Chung, A.P.; Oliveira, P.V. A Review on the importance of microbial biopolymers such as xanthan gum to improve soil properties. Appl. Sci. 2021, 11, 170. [Google Scholar] [CrossRef]
- Choi, S.-G.; Chang, I.; Lee, M.; Lee, J.-H.; Han, J.-T.; Kwon, T.-H. Review on geotechnical engineering properties of sands treated by microbially induced calcium carbonate precipitation (MICP) and biopolymers. Constr. Build. Mater. 2020, 246, 118415. [Google Scholar] [CrossRef]
- Chang, I.; Im, J.; Cho, G.-C. Introduction of microbial biopolymers in soil treatment for future environmentally-friendly and sustainable geotechnical engineering. Sustainability 2016, 8, 251. [Google Scholar] [CrossRef] [Green Version]
- Chang, I.; Prasidhi, A.K.; Im, J.; Shin, H.-D.; Cho, G.-C. Soil treatment using microbial biopolymers for anti-desertification purposes. Geoderma 2015, 253–254, 39–47. [Google Scholar] [CrossRef]
- Xu, G.; Ding, X.; Kuruppu, M.; Zhou, W.; Biswas, W. Research and application of non-traditional chemical stabilizers on bauxite residue (red sand) dust control, a review. Sci. Total Environ. 2018, 616–617, 1552–1565. [Google Scholar] [CrossRef] [PubMed]
- Liu, J.; Wang, T.; Jin, L.; Li, G.; Wang, S.; Wei, Y.; Ou, S.; Wang, Y.; Xu, J.; Lin, M.; et al. Suppression Characteristics and Mechanism of Molasses Solution on Coal Dust: A Low-Cost and Environment-Friendly Suppression Method in Coal Mines. Int. J. Environ. Res. Public Health 2022, 19, 16472. [Google Scholar] [CrossRef] [PubMed]
- Ding, X.; Xu, G.; Kizil, M.; Zhou, W.; Guo, X. Lignosulfonate treating bauxite residue dust pollution: Enhancement of mechanical properties and wind erosion behavior. Water Air Soil Pollut. 2018, 229, 1084. [Google Scholar] [CrossRef]
- German Institute for Standardization. DIN EN ISO 17892-4; Geotechnical Investigation and Testing-Laboratory Testing of Soil-Part 4: Determination of Particle Size Distribution. German Institute for Standardization: Berlin, Germany, 2017.
- AST D2487-17; Standard Practice for Classification of Soils for Engineering Purposes (Unified Soil Classification System). ASTM International: West Conshohocken, PA, USA, 2018.
- German Institute for Standardization. DIN EN ISO 11508-2017; Soil Quality-Determination of Particle Density. German Institute for Standardization: Berlin, Germany, 2017.
- DIN EN 15933:2012-11; Sludge, Treated Biowaste and Soil—Determination of pH. German Institute for Standardization: Berlin, Germany, 2012.
- Ding, X.; Xu, G.; Zhang, Y.; Luo, Z.; Deng, J. Reduction of airborne bauxite residue dust pollution by enhancing the structural stability via the application of non-traditional stabilizers. Water Air Soil Pollut. 2021, 232, 100. [Google Scholar] [CrossRef]
- Bixler, H.J.; Porse, H. A decade of change in the seaweed hydrocolloids industry. J. Appl. Phycol. 2011, 23, 321–335. [Google Scholar] [CrossRef]
- Zuorro, A.; Moreno-Sader, K.A.; González-Delgado, Á.D. Economic Evaluation and Techno-Economic Sensitivity Analysis of a Mass Integrated Shrimp Biorefinery in North Colombia. Polymers 2020, 12, 2397. [Google Scholar] [CrossRef]
- Criminna, R.; Fidalgo, A.; Delisi, R.; Ilharco, L.M.; Pagliaro, M. Pectin production and global market. Agro Food Ind. Hi-Tech 2016, 27, 17–20. [Google Scholar]
- Chang, I.; Im, J.; Cho, G.-C. Geotechnical engineering behaviors of gellan gum biopolymer treated sand. Can. Geotech. J. 2016, 53, 1658–1670. [Google Scholar] [CrossRef] [Green Version]
- Gosselink, R.J.A. Lignin as a Renewable Aromatic Resource for the Chemical Industry. Ph.D. Thesis, Wageningen University, Wageningen, The Netherlands, 2011. [Google Scholar]
- Hailu, A. Production and Optimisation of Carboxymethylcellulose from Waste Cartons. Master Thesis, Addis Ababa University, Addis Ababa, Ethiopia, 2016. [Google Scholar]
- Phillips, G.O.; Edwards, C.A.; Garcia, A.L.; Williams, P.A.; Dickinson, E.; Armisén, R.; Taggart, P.; Mitchell, J.R.; Haug, I.J.; Draget, K.I.; et al. Handbook of Hydrocolloids; CRC: Boca Raton, FL, USA; Woodhead: Cambridge, UK, 2009; ISBN 978-1-84569-414-2. [Google Scholar]
- Mulder, W.; van der Peet-Schwering, C.; Hua, N.-P.; van Ree, R. Proteins for Food, Feed and Biobased Applications: Biorefining of Protein Containing Biomass. 2016. Available online: https://www.ieabioenergy.com/wp-content/uploads/2016/10/Proteins-for-Food_Feed_and_Biobased_Applications_-IEA-Bioenergy-Task42_September-2016.pdf (accessed on 6 January 2023).
- Heusala, H.; Sinkko, T.; Sözer, N.; Hytönen, E.; Mogensen, L.; Knudsen, M.T. Carbon footprint and land use of oat and faba bean protein concentrates using a life cycle assessment approach. J. Clean. Prod. 2020, 242, 118376. [Google Scholar] [CrossRef]
- German Institute for Standardization. EN ISO 1666-1997; Starch-Determination of Moisture Content-Oven-Drying Method. German Institute for Standardization: Berlin, Germany, 1998.
- International Organization for Standardization. ISO 6496:1999; Animal Feeding Stuffs-Determination of Moisture and Other Volatile Matter Content. International Organization for Standardization: Genève, Switzerland, 1999.
- Association of Official Analytical Chemists. Official Methods of Analysis-Agricultural Chemicals; Contaminants Drugs; Association of Official Analytical chemists: Arlington, TX, USA, 1990. [Google Scholar]
- Ding, X.; Xu, G.; Zhou, W.; Kuruppu, M. Effect of synthetic and natural polymers on reducing bauxite residue dust pollution. Environ. Technol. 2018, 41, 556–565. [Google Scholar] [CrossRef] [PubMed]
- Hu, Y.; Shi, L.; Shan, Z.; Dai, R.; Chen, H. Efficient removal of atmospheric dust by a suppressant made of potato starch, polyacrylic acid and gelatin. Environ. Chem. Lett. 2020, 18, 1701–1711. [Google Scholar] [CrossRef]
- Ding, X.; Xu, G.; Liu, W.V.; Yang, L.; Albijanic, B. Effect of polymer stabilizers’ viscosity on red sand structure strength and dust pollution resistance. J. Powder Technol. 2019, 352, 117–125. [Google Scholar] [CrossRef]
- Chen, R.; Lee, I.; Zhang, L. Biopolymer stabilization of mine tailings for dust control. J. Geotech. Geoenviron. Eng. 2014, 141, 4014100. [Google Scholar] [CrossRef]
- Maidapwad, S.L.; Sananse, S.L. On analysis of two-way ANOVA using data transformation techniques. Int. J. Sci. Res. 2014, 3, 480–483. [Google Scholar]
- Tran, T.P.A.; Cho, G.-C.; Ilhan, C. Water retention characteristics of biopolymer hydrogel containing sandy soils. Hue Univ. J. Sci. Earth Sci. Environ. 2020, 129, 5–17. [Google Scholar] [CrossRef]
- Tran, T.P.; Cho, G.C.; Lee, S.J.; Chang, I. Effect of xanthan gum biopolymer on the water retention characteristics of unsaturated sand. In Proceedings of the UNSAT2018 the 7th International Conference on Unsaturated Soils, Hong Kong, China, 3–6 August 2018. [Google Scholar]
- Huang, J.; Ho, C.-H.; Gao, Y.; Wu, Z.; Zhang, Y. Evaluation of polymer based dust suppressant mixed with clayey soil in unpaved road: Lab experiment. In Transportation and Geotechniques: Materials, Sustainability and Climate: Proceedings of the 5th GeoChina International Conference 2018-Civil Infrastructures Confronting Severe Weathers and Climate Changes: From Failure to Sustainability, Held on July 23 to 25, 2018 in HangZhou, China, 1st ed.; Barman, M., Zaman, M., Chang, J.-R., Eds.; Springer International Publishing: Cham, Switzerland, 2019; pp. 1–9. ISBN 978-3-319-95768-5. [Google Scholar]
- Parameswaran, K.; Ekholm, J.; Zhang, L. Evaluation of mine tailings dust control. In Proceedings of the Geoenvironmental Engineering, Selected Papers from the 2014 Geoshanghai International Congress, Shanghai, China, 26–28 May 2014; Reddy, K.R., Ed.; Curran: New York, NY, USA, 2014; pp. 80–89, ISBN 978-0-784-41343-2. [Google Scholar]
- Hataf, N.; Ghadir, P.; Ranjbar, N. Investigation of soil stabilization using chitosan biopolymer. J. Clean. Prod. 2018, 170, 1493–1500. [Google Scholar] [CrossRef]
- Tran, T.P.A.; Im, J.; Cho, G.-C.; Chang, I. Soil-water characteristics of xanthan gum biopolymer containing soils. In Proceedings of the UNSAT2018 the 7th International Conference on Unsaturated Soils, Hong Kong, China, 3–6 August 2018. [Google Scholar]
- Liu, J.; Shi, B.; Lu, Y.; Jiang, H.; Huang, H.; Wang, G.; Kamai, T. Effectiveness of a new organic polymer sand-fixing agent on sand fixation. Environ. Earth Sci. 2012, 65, 589–595. [Google Scholar] [CrossRef]
- Ayeldeen, M.; Negm, A.; El Sawwaf, M.; Gädda, T. Laboratory study of using biopolymer to reduce wind erosion. Int. J. Geo-Eng. 2017, 12, 228–240. [Google Scholar] [CrossRef]
- Seo, S.; Lee, M.; Im, J.; Kwon, Y.-M.; Chung, M.-K.; Cho, G.-C.; Chang, I. Site application of biopolymer-based soil treatment (BPST) for slope surface protection: In-situ wet-spraying method and strengthening effect verification. Constr. Build. Mater. 2021, 307, 124983. [Google Scholar] [CrossRef]
- Kwon, Y.-M.; Ham, S.-M.; Kwon, T.-H.; Cho, G.-C.; Chang, I. Surface-erosion behaviour of biopolymer-treated soils assessed by EFA. Géotechnique Lett. 2020, 10, 106–112. [Google Scholar] [CrossRef]
- Vishweshwaran, M.; Padmashree, S.; Kalambari, R.; Sathya Bhaarathi, C.R.; Ramani Sujatha, E. Pre-gelatinized starch-a sustainable soil stabilizer. J. Adv. Res. Dyn. Control Syst. 2018, 10, 543–546. [Google Scholar]
- Rosa, I.; Roedel, H.I.; Allende, M.D.; Lepech, M.J.; Loftus, D. On Designing Biopolymer-Bound Soil Composites (BSC) for Peak Compressive Strength. J. Renew. Mater. 2020, 8, 845–861. [Google Scholar] [CrossRef]
- Dang, X.; Shan, Z.; Chen, H. Usability of oxidized corn starch-gelatin blends for suppression and prevention of dust. J. Appl. Polym. Sci. 2017, 134, 1–9. [Google Scholar] [CrossRef]
- Brown, M.J.; Robbins, C.W.; Freeborn, L.L. Combining cottage cheese whey and straw reduces erosion while increasing infiltration in furrow irrigation. J. Soil Water Conserv. 1998, 53, 152–156. [Google Scholar]
- Sharan, S.; Zanghelini, G.; Zotzel, J.; Bonerz, D.; Aschoff, J.; Saint-Eve, A.; Maillard, M.-N. Fava bean (Vicia faba L.) for food applications: From seed to ingredient processing and its effect on functional properties, antinutritional factors, flavor, and color. Compr. Rev. Food Sci. Food Saf. 2021, 20, 401–428. [Google Scholar] [CrossRef] [PubMed]
- Phillips, G.O.; Williams, P.A.; O’Kennedy, B.T.; Boland, M.; Tarté, R.; Mayer, O.; Haug, I.J.; Draget, K.I.; Tahergorabi, R.; Hosseini, S.V.; et al. Handbook of Food Proteins; Woodhead Publishing: Oxford, UK, 2011; ISBN 978-1-84569-758-7. [Google Scholar]
- Almajed, A.; Lemboye, K.; Arab, M.G.; Alnuaim, A. Mitigating wind erosion of sand using biopolymer-assisted EICP technique. Soils Found. 2020, 60, 356–371. [Google Scholar] [CrossRef]
- Blanck, G.; Cuisinier, O.; Masrouri, F. Soil treatment with organic non-traditional additives for the improvement of earthworks. Acta Geotech. 2014, 9, 1111–1122. [Google Scholar] [CrossRef]
- Moghal, A.A.B.; Vydehi, K.V. State-of-the-art review on efficacy of xanthan gum and guar gum inclusion on the engineering behavior of soils. Innov. Infrastruct. Solut. 2021, 6, 108. [Google Scholar] [CrossRef]
- Kunz, B.K.; Little, E.E.; Barandino, V.L. Aquatic toxicity of chemical road dust suppressants to freshwater organisms. Arch. Environ. Contam. Toxicol. 2021, 82, 294–305. [Google Scholar] [CrossRef]
- Katebi, H.; Fahmi, A.; Ouria, A.; Babaeian Amini, A.; Kafil, H.S. Microbial surface treatment of sand with sporosarcina pasteurii to improve the wind erosion resistance in Urmia Lake. Appl. Environ. Soil Sci. 2021, 2021, 1–11. [Google Scholar] [CrossRef]
- Liu, J.; Li, G.; Li, X. Geotechnical engineering properties of soils solidified by microbially induced CaCO3 precipitation (MICP). Adv. Civ. Eng. 2021, 2021, 6683930. [Google Scholar] [CrossRef]
- Meng, H.; Gao, Y.; He, J.; Qi, Y.; Hang, L. Microbially induced carbonate precipitation for wind erosion control of desert soil: Field-scale tests. Geoderma 2021, 383, 114723. [Google Scholar] [CrossRef]
- Freer, J.; Lübeck, M.; Sieger, J.L.; Lottermoser, B.G.; Braun, M. Effectiveness of food processing by-products as dust suppressants for exposed mine soils: Results from laboratory experiments and field trials. Appl. Sci. 2022, 12, 11551. [Google Scholar] [CrossRef]
- Freer, J.; Bucher, P.G.; Braun, M.; Lottermoser, B.G. Food processing by-products and wastes as potential dust suppressants at mine sites: Results from unconfined compressive strength testing. J. Air Waste Manag. Assoc. 2022, 72, 1012–1026. [Google Scholar] [CrossRef] [PubMed]
- Niaounakis, M. Definitions of terms and types of biopolymers. In Biopolymers: Applications and Trends; Niaounakis, M., Ed.; Elsevier: Oxford, UK, 2015; pp. 1–90. ISBN 9780323353991. [Google Scholar]
- Thomas, S.; Durand, D.; Chassenieux, C.; Jyotishkumar, P. Handbook of Biopolymer-Based Materials; Wiley-VCH Verlag GmbH & Co. KGaA: Weinheim, Germany, 2013; ISBN 9783527652457. [Google Scholar]
- Rimbarngaye, A.; Mwero, J.N.; Ronoh, E.K. Effect of gum arabic as partial replacement of cement on the durability properties of compressed laterite blocks. Open J. Civ. Eng. 2021, 11, 398–410. [Google Scholar] [CrossRef]
- Smitha, S.; Sachan, A. Use of agar biopolymer to improve the shear strength behavior of sabarmati sand. Int. J. Geo. Eng. 2016, 10, 387–400. [Google Scholar] [CrossRef]
- Khatami, H.R.; O’Kelly, B.C. Improving mechanical properties of sand using biopolymers. J. Geotech. Geoenviron. Eng. 2013, 139, 1402–1406. [Google Scholar] [CrossRef] [Green Version]
- Vishweshwaran, M.; Sujatha, E.R. β-glucan as a sustainable alternative to stabilize pavement subgrade. Polymers 2022, 14, 2850. [Google Scholar] [CrossRef]
- Soldo, A.; Aguilar, V.; Miletić, M. Macroscopic stress-strain response and strain-localization behavior of biopolymer-treated soil. Polymers 2022, 14, 997. [Google Scholar] [CrossRef] [PubMed]
- Anandha Kumar, S.; Sujatha, E.R. An appraisal of the hydro-mechanical behaviour of polysaccharides, xanthan gum, guar gum and β-glucan amended soil. Carbohydr. Polym. 2021, 265, 118083. [Google Scholar] [CrossRef] [PubMed]
- Chang, I.; Im, J.; Cho, G.-C. An environmentally-friendly geotechnical approach for soil erosion reduction using microbial biopolymers. In Proceedings of the Geo-Chicago 2016, Sustainability and Resiliency in Geotechnical Engineering, Chicago, IL, USA, 14–18 August 2016; Zekkos, D., Farid, A., De, A., Reddy, K.R., Yesiller, N., Eds.; American Society of Civil Engineers: Reston, VA, USA, 2016; pp. 17–24, ISBN 9780784480120. [Google Scholar]
- Chang, I.; Cho, G.-C. Geotechnical behavior of a beta-1,3/1,6-glucan biopolymer-treated residual soil. Geomech. Eng. 2014, 7, 633–647. [Google Scholar] [CrossRef] [Green Version]
- Chang, I.; Cho, G.-C. Strengthening of Korean residual soil with β-1, 3/1, 6-glucan biopolymer. Constr. Build. Mater. 2012, 30, 30–35. [Google Scholar] [CrossRef]
- Donayre, A.; Sanchez, L.F.; Kim, S.; Aguilar, R.; Nakamatsu, J. Eco-friendly improvement of water erosion resistance of unstable soils with biodegradable polymers. IOP Conf. Ser. Mater. Sci. Eng. 2018, 416, 12044. [Google Scholar] [CrossRef] [Green Version]
- Nakamatsu, J.; Kim, S.; Ayarza, J.; Ramírez, E.; Elgegren, M.; Aguilar, R. Eco-friendly modification of earthen construction with carrageenan: Water durability and mechanical assessment. Constr. Build. Mater. 2017, 139, 193–202. [Google Scholar] [CrossRef]
- Bocheńska, M.; Bujko, M.; Dyka, I.; Srokosz, P.; Ossowski, R. Effect of chitosan solution on low-cohesive soil’s shear modulus G determined through resonant column and torsional shearing tests. Appl. Sci. 2022, 12, 5332. [Google Scholar] [CrossRef]
- Shariatmadari, N.; Reza, M.; Tasuji, A.; Ghadir, P.; Javadi, A.A. Experimental study on the effect of chitosan biopolymer on sandy soil stabilization. E3S Web Conf. 2020, 195, 6007. [Google Scholar] [CrossRef]
- Soldo, A.; Miletić, M.; Auad, M.L. Biopolymers as a sustainable solution for the enhancement of soil mechanical properties. Sci. Rep. 2020, 10, 267. [Google Scholar] [CrossRef] [Green Version]
- Aguilar, R.; Nakamatsu, J.; Ramírez, E.; Elgegren, M.; Ayarza, J.; Kim, S.; Pando, M.A.; Ortega-San-Martin, L. The potential use of chitosan as a biopolymer additive for enhanced mechanical properties and water resistance of earthen construction. Constr. Build. Mater. 2016, 114, 625–637. [Google Scholar] [CrossRef]
- Taytak, B.; Pulat, H.F.; Yukselen-Aksoy, Y. Improvement of engineering properties of soils by biopolymer additives. In Proceedings of the 3. ICNDSMGE-ZM 2012 3rd International Conference on New Developments, Nicosia, Cyprus, 28–30 June 2012. [Google Scholar]
- Alsand, A. Novel Biopolymer Treatment for Wind Induced Soil Erosion. Ph.D. Thesis, Arizona State University, Tempe, AZ, USA, 2011. [Google Scholar]
- Kavazanjian, E.; Iglesias, E.; Karatas, I. Biopolymer soil stabilization for wind erosion control. In Proceedings of the 17th International Conference on Soil Mechanics and Geotechnical Engineering; Hamza, M., Shahien, M., El-Mossallamy, Y., Eds.; IOS Press: Amsterdam, The Netherlands, 2009. ISBN 978-1-60750-031-5. [Google Scholar]
- Armistead, S.J.; Rawlings, A.E.; Smith, C.C.; Staniland, S.S. Biopolymer stabilization/solidification of soils: A rapid, micro-macro, cross-disciplinary approach. Environ. Sci. Technol. 2020, 54, 13963–13972. [Google Scholar] [CrossRef] [PubMed]
- Ojuri, O.O.; Ramdas, V.; Aderibigbe, E.A.; Williams, C.G.; Ramchuran, S.; Al-Nageim, H. Improving strength and hydraulic characteristics of regional clayey soils using biopolymers. Case Stud. Constr. Mater. 2022, 17, e01319. [Google Scholar] [CrossRef]
- Yang, Q.; Pei, X.; Huang, R. Impact of polymer mixtures on the stabilization and erosion control of silty sand slope. J. Mt. Sci. 2019, 16, 470–485. [Google Scholar] [CrossRef]
- Inyang, H.I.; Bae, S.; Pando, M.A. Contaminant dust suppression materials: A cost-effectiveness estimation methodology. Measurement 2016, 93, 563–571. [Google Scholar] [CrossRef]
- Ham, S.-M.; Chang, I.; Noh, D.-H.; Kwon, T.-H.; Muhunthan, B. Improvement of surface erosion resistance of sand by microbial biopolymer formation. J. Geotech. Geoenviron. Eng. 2018, 144, 6018004. [Google Scholar] [CrossRef] [Green Version]
- Ramachandran, A.L.; Mukherjee, A.; Dhami, N.K. Nanoscale to macroscale characterization of in-situ bacterial biopolymers for applications in soil stabilization. Front. Mater. 2022, 8, 546. [Google Scholar] [CrossRef]
- Bitar, L. Optimum Mixing Design of Xanthan and Gellan Treated Soils for Slope Stabilization for Weathered Shales and Glacial Tills in Nebraska. Master’s Thesis, University of Nebraska, Lincoln, NE, USA, 2020. [Google Scholar]
- Chang, I.; Cho, G.-C. Shear strength behavior and parameters of microbial gellan gum-treated soils: From sand to clay. Acta Geotech. 2019, 14, 361–375. [Google Scholar] [CrossRef]
- Chang, I.; Im, J.; Lee, S.-W.; Cho, G.-C. Strength durability of gellan gum biopolymer-treated Korean sand with cyclic wetting and drying. Constr. Build. Mater. 2017, 143, 210–221. [Google Scholar] [CrossRef] [Green Version]
- Im, J.; Tran, A.T.; Chang, I.; Cho, G.-C. Dynamic properties of gel-type biopolymer-treated sands evaluated by Resonant Column (RC) Tests. Geomech. Eng. 2017, 12, 815–830. [Google Scholar] [CrossRef]
- Ferruzzi, G.; Pan, N.; Casey, W.H. Mechanical properties of gellan and polyacrylamide gels with implications for soil stabilization. Soil Sci. 2000, 165, 778–792. [Google Scholar] [CrossRef]
- Bonal, N.S.; Prasad, A.; Verma, A.K. Effect of microbial biopolymers on mechanical properties of bauxite residue. KSCE J. Civ. Eng. 2021, 25, 2437–2450. [Google Scholar] [CrossRef]
- Bozyigit, I.; Javadi, A.; Altun, S. Strength properties of xanthan gum and guar gum treated kaolin at different water contents. J. Rock Mech. Geotech. Eng. 2021, 13, 1160–1172. [Google Scholar] [CrossRef]
- Muguda, S.; Hughes, P.N.; Augarde, C.E.; Perlot, C.; Walter Bruno, A.; Gallipoli, D. Cross-linking of biopolymers for stabilizing earthen construction materials. Build. Res. Inf. 2021, 50, 502–514. [Google Scholar] [CrossRef]
- Bonal, N.S.; Prasad, A.; Verma, A.K. Use of biopolymers to enhance the geotechnical properties of coal mine overburden waste. Géotech. Lett. 2020, 10, 179–185. [Google Scholar] [CrossRef]
- Muguda, S.; Lucas, G.; Hughes, P.N.; Augarde, C.E.; Perlot, C.; Bruno, A.W.; Gallipoli, D. Durability and hygroscopic behaviour of biopolymer stabilised earthen construction materials. Constr. Build. Mater. 2020, 259, 119725. [Google Scholar] [CrossRef]
- Zhao, X.; Zhao, X.; Han, F.; Song, Z.; Wang, D.; Fan, J.; Jia, Z.; Jiang, G. A research on dust suppression mechanism and application technology in mining and loading process of burnt rock open pit coal mines. J. Air Waste Manag. Assoc. 2021, 71, 1568–1584. [Google Scholar] [CrossRef] [PubMed]
- Armistead, S.J.; Smith, C.C.; Staniland, S.S. Sustainable biopolymer soil stabilization in saline rich, arid conditions: A ‘micro to macro’ approach. Sci. Rep. 2022, 12, 2880. [Google Scholar] [CrossRef]
- Ghasemzadeh, H.; Modiri, F. Application of novel Persian gum hydrocolloid in soil stabilization. Carbohydr. Polym. 2020, 246, 116639. [Google Scholar] [CrossRef]
- Yan, J.; Nie, W.; Xiu, Z.; Yuan, M.; Zhou, W.; Bao, Q.; Peng, H.; Niu, W.; Yu, F. Development and characterization of a dust suppression spray agent based on an adhesive NaAlg−gln−poly/polysaccharide polymer. Sci. Total Environ. 2021, 785, 147192. [Google Scholar] [CrossRef]
- Soltani, A.; Raeesi, R.; Taheri, A.; Deng, A.; Mirzababaei, M. Improved shear strength performance of compacted rubberized clays treated with sodium alginate biopolymer. Polymers 2021, 13, 764. [Google Scholar] [CrossRef] [PubMed]
- Arab, M.G.; Mousa, R.A.; Gabr, A.R.; Azam, A.M.; El-Badawy, S.M.; Hassan, A.F. Resilient behavior of sodium alginate–treated cohesive soils for pavement applications. J. Mater. Civ. Eng. 2019, 31, 4018361. [Google Scholar] [CrossRef]
- Fatehi, H.; Bahmani, M.; Noorzad, A. Strengthening of dune sand with sodium alginate biopolymer. In Proceedings of the Geo-Congress 2019 8th International Conference on Case Histories in Geotechnical Engineering, Philadelphia, PA, USA, 24–27 March 2019; Meehan, C.L., Kumar, S., Pando, M.A., Coe, J.T., Eds.; American Society of Civil Engineers: Reston, VA, USA, 2019; pp. 157–166, ISBN 9780784482117. [Google Scholar]
- Zhao, Y.; Zhuang, J.; Wang, Y.; Jia, Y.; Niu, P.; Jia, K. Improvement of loess characteristics using sodium alginate. Bull. Eng. Geol. Environ. 2019, 79, 1879–1891. [Google Scholar] [CrossRef]
- Bouazza, A.; Gates, W.P.; Ranjith, P.G. Hydraulic conductivity of biopolymer-treated silty sand. Géotechnique 2009, 59, 71–72. [Google Scholar] [CrossRef]
- Zhou, Y.; Wu, L.; Tong, L.; Liu, Y.; Yang, X.; Zhang, B.; Liao, Z.; Chen, A.; Hu, Y. Preparation of high-temperature resistant and environment friendly dust suppressant. J. Phys. Conf. Ser. 2021, 2076, 12054. [Google Scholar] [CrossRef]
- Chen, R.; Ding, X.; Lai, H.; Zhang, L. Improving dust resistance of mine tailings using green biopolymer. Environ. Geotech. 2019, 8, 382–391. [Google Scholar] [CrossRef]
- Chen, C.; Peng, Z.; Gu, J.; Peng, Y.; Huang, X.; Wu, L. Exploring environmentally friendly biopolymer material effect on soil tensile and compressive behavior. Int. J. Environ. Res. Public Health 2020, 17, 9032. [Google Scholar] [CrossRef]
- Ni, J.; Hao, G.-L.; Chen, J.-Q.; Ma, L.; Geng, X.-Y. The optimisation analysis of sand-clay mixtures stabilised with xanthan gum biopolymers. Sustainability 2021, 13, 3732. [Google Scholar] [CrossRef]
- Ramachandran, A.L.; Dubey, A.A.; Dhami, N.K.; Mukherjee, A. Multiscale study of soil stabilization using bacterial biopolymers. J. Geotech. Geoenviron. Eng. 2021, 147, 4021074. [Google Scholar] [CrossRef]
- Sujatha, E.R.; Atchaya, S.; Sivasaran, A.; Keerdthe, R.S. Enhancing the geotechnical properties of soil using xanthan gum—An eco-friendly alternative to traditional stabilizers. Bull. Eng. Geol. Environ. 2021, 80, 1157–1167. [Google Scholar] [CrossRef]
- Joga, J.R.; Varaprasad, B.J.S. Effect of xanthan gum biopolymer on dispersive properties of soils. World J. Eng. 2020, 17, 563–571. [Google Scholar] [CrossRef]
- Singh, S.P.; Das, R. Geo-engineering properties of expansive soil treated with xanthan gum biopolymer. Geomech. Eng. 2020, 15, 107–122. [Google Scholar] [CrossRef]
- Theyab, A.F.; Muhauwiss, F.M.; Alabdraba, W.M. Enhancing gypseous soil behavior using casein from milk wastes. J. Mech. Behav. Mater. 2022, 31, 306–313. [Google Scholar] [CrossRef]
- Park, S.-S.; Woo, S.-W.; Jeong, S.-W.; Lee, D.-E. Durability and strength characteristics of casein-cemented sand with slag. Materials 2020, 13, 3182. [Google Scholar] [CrossRef] [PubMed]
- Gopika, A.S.; Mohandas, T.V. Soil strengthening using caseinate: A protein based biopolymer. Int. J. Res. Eng. Sci. Manag. 2019, 2, 538–540. [Google Scholar]
- Chang, I.; Im, J.; Chung, M.-K.; Cho, G.-C. Bovine casein as a new soil strengthening binder from diary wastes. Constr. Build. Mater. 2018, 160, 1–9. [Google Scholar] [CrossRef]
- Fatehi, H.; Abtahi, S.M.; Hashemolhosseini, H.; Hejazi, S.M. A novel study on using protein based biopolymers in soil strengthening. Constr. Build. Mater. 2018, 167, 813–821. [Google Scholar] [CrossRef]
- Im, J.; Cho, G.-C.; Chang, I. A new soil treatment method using casein from bovine milk. In Proceedings of the Geo-Chicago 2016, Sustainability and Resiliency in Geotechnical Engineering, Chicago, IL, USA, 14–18 August 2016; Zekkos, D., Farid, A., De, A., Reddy, K.R., Yesiller, N., Eds.; American Society of Civil Engineers: Reston, VA, USA, 2016; pp. 1–6, ISBN 9780784480120. [Google Scholar]
- Jin, H.; Nie, W.; Zhang, Y.; Wang, H.; Zhang, H.; Bao, Q.; Yan, J. Development of environmental friendly dust suppressant based on the modification of soybean protein isolate. Processes 2019, 7, 165. [Google Scholar] [CrossRef] [Green Version]
- Cruse, R.M.; Berghoefer, B.E.; Mize, C.W.; Ghaffarzadeh, M. Water drop impact angle and soybean protein amendment effects on soil detachment. Soil Sci. Soc. Am. J. 2000, 64, 1474–1478. [Google Scholar] [CrossRef]
- Chen, R.; Ding, X.; Ramey, D.; Lee, I.; Zhang, L. Experimental and numerical investigation into surface strength of mine tailings after biopolymer stabilization. Acta Geotech. 2016, 11, 1075–1085. [Google Scholar] [CrossRef]


| Parameter | Unit | Medium-Grained Sand | Fine-Grained Silica Sand | Test Method |
|---|---|---|---|---|
| Soil properties | ||||
| D60 | mm | 0.75 | 0.24 | DIN EN ISO 17892-4 [29] |
| D50 | mm | 0.63 | 0.22 | DIN EN ISO 17892-4 [29] |
| D30 | mm | 0.43 | 0.18 | DIN EN ISO 17892-4 [29] |
| D10 | mm | 0.28 | 0.14 | DIN EN ISO 17892-4 [29] |
| Cu | - | 2.73 | 1.78 | DIN EN ISO 17892-4 [29] |
| Cc | - | 0.91 | 0.95 | DIN EN ISO 17892-4 [29] |
| USCS classification | - | SP | SP | ASTM D-2487 [30] |
| Specific gravity | g/cm3 | 2.59 | 2.63 | DIN EN ISO 11508:2018-04 [31] |
| pH value | 7.53 | 6.48 | DIN EN 15933:2012-11 [32] | |
| Soil colour | Munsell | 9.7 YR 6.0/2.8 | 0.9 Y 7.1/1.3 | |
| Geochemistry (oxides) | ||||
| SiO2 | wt% | 94.58 | 98.65 | |
| Al2O3 | wt% | 2.35 | 0.55 | |
| K2O | wt% | 1.15 | 0.04 | |
| Fe2O3 | wt% | 0.74 | 0.05 | |
| Na2O | wt% | 0.22 | 0.01 | |
| CaO | wt% | 0.05 | 0.01 | |
| MgO | wt% | 0.10 | 0.01 | |
| TiO2 | wt% | 0.06 | 0.07 | |
| P2O5 | wt% | 0.02 | <0.01 | |
| MnO | wt% | 0.01 | <0.01 | |
| Biopolymer | Product Name | Specification | Manufacturer | Appearance | Moisture (wt%) |
|---|---|---|---|---|---|
| Polysaccharides | |||||
| Carboxymethyl cellulose (CMC) | DTK NV CMC | Technical grade, low viscosity | Mikro-Technik-CMC | Light-yellowish granules | 8.6 a |
| Corn starch (CS) | C-Gel Instant | Pregelatinised | Cargill GmbH | White powder | 5.8 b |
| Sodium lignosulfonate (NLS) | N18 | Cold-water soluble | Otto Dille GmbH | Brown powder | 8.6 a |
| Pea starch (PES) | Emcol EST (F11025) | Pregelatinised | Emsland Group | Off-white powder | 10.4 b |
| Potato starch (POS) | KMC 18-09 | Pregelatinised (acetylated) | KMC Germany | White powder | 9.4 b |
| Wheat starch (WS) | Tigel | Pregelatinised | Krörner Stärke | White powder | 6.3 b |
| Xanthan gum (XG) | XG TGRD | Technical grade, readily dispersible | Jungbunzlauer | White, free-flowing powder | 5.1 a |
| Proteins | |||||
| Fava bean protein concentrate (FBPC) | ABPK 65% | Enzyme activated | Aloja-Starkelsen | Creamy light-yellow powder | 8.8 d |
| Hen egg albumen (HEA) | Hen egg albumen | Cold-water soluble | Ovopol Sp. z. o.o. | Yellowish powder | 7.0 a |
| Haemoglobin protein (HG) | HG 92P | Haemoglobin powder, porcine protein | Sonac | Dark red powder | 6.6 c |
| Plasma protein (PP) | PP 70P | Plasma powder, porcine protein | Sonac | Cream-white powder | 7.5 c |
| Technical gelatine (TG) | TG 330 | Water soluble at ≥40 °C | Hellmann GmbH | Yellowish, free-flowing granules | 13.0 a |
| Wheat protein (WP) | Glusol | Degraded, without viscoelastic properties | Kröner Stärke | Yellowish powder | 6.0 d |
| Whey protein concentrate (WPC) | Instant WPC 80 | From fresh cheese whey | Lactoland GmbH | White to pale yellow powder | 6.2 d |
| Group | Factor | SS | df | MS | F | p |
|---|---|---|---|---|---|---|
| Medium-grained sand | ||||||
| Polysaccharides | Type | 0.01297 | 6 | 0.00216 | 20.578 | < .001 |
| Concentration | 0.00003 | 1 | 0.00003 | 0.288 | .596 | |
| Interaction | 0.00219 | 6 | 0.00036 | 3.48 | .011 | |
| Error | 0.00294 | 28 | 0.00011 | 0 | ||
| Proteins | Type | 0.03497 | 6 | 0.00583 | 34.945 | < .001 |
| Concentration | 0.00009 | 1 | 0.00009 | 0.538 | .469 | |
| Interaction | 0.00075 | 6 | 0.00013 | 0.752 | .613 | |
| Error | 0.00467 | 28 | 0.00017 | |||
| Fine-grained silica sand | ||||||
| Polysaccharides | Type | 0.00241 | 6 | 0.00040 | 20.551 | < .001 |
| Concentration | 0.00008 | 1 | 0.00008 | 4.136 | .052 | |
| Interaction | 0.00089 | 6 | 0.00015 | 7.598 | < .001 | |
| Error | 0.00055 | 28 | 0.00002 | |||
| Proteins | Type | 0.04336 | 6 | 0.00723 | 197.484 | < .001 |
| Concentration | 0.00056 | 1 | 0.00056 | 15.193 | < .001 | |
| Interaction | 0.00103 | 6 | 0.00017 | 4.691 | .020 | |
| Error | 0.00102 | 28 | 0.00004 | |||
| Group | Factor | SS | df | MS | F | p |
|---|---|---|---|---|---|---|
| Medium-grained sand | ||||||
| Polysaccharides | Type | 1277.93 | 6 | 212.99 | 17.57 | < .001 |
| Concentration | 908.30 | 1 | 908.30 | 74.93 | < .001 | |
| Interaction | 250.04 | 6 | 41.67 | 3.44 | .011 | |
| Error | 339.46 | 28 | 12.12 | |||
| Proteins | Type | 1386.02 | 6 | 231.00 | 24.74 | < .001 |
| Concentration | 952.47 | 1 | 952.47 | 101.99 | < .001 | |
| Interaction | 623.11 | 6 | 103.85 | 11.12 | < .001 | |
| Error | 261.49 | 28 | 9.34 | |||
| Fine-grained silica sand | ||||||
| Polysaccharides | Type | 582.82 | 6 | 97.14 | 4.91 | < .001 |
| Concentration | 108.78 | 1 | 108.78 | 5.50 | .026 | |
| Interaction | 227.89 | 6 | 37.98 | 1.92 | .113 | |
| Error | 554.29 | 28 | 19.80 | |||
| Proteins | Type | 1753.52 | 6 | 292.25 | 21.93 | < .001 |
| Concentration | 798.95 | 1 | 798.95 | 59.95 | < .001 | |
| Interaction | 298.17 | 6 | 49.70 | 3.73 | .007 | |
| Error | 373.13 | 28 | 13.33 | |||
| BP Type | Factor | SS | df | MS | F | p |
|---|---|---|---|---|---|---|
| Medium-grained sand | ||||||
| Polysaccharides | Type | 48.6 | 6 | 8.1 | 8.86 | < .001 |
| Concentration | 3.15 | 1 | 3.15 | 3.44 | .074 | |
| Interaction | 37.96 | 6 | 6.33 | 6.92 | < .001 | |
| Error | 25.61 | 28 | 0.91 | 0 | ||
| Proteins | Type | 188.1 | 6 | 31.35 | 38.42 | < .001 |
| Concentration | 77.67 | 1 | 77.67 | 95.18 | < .001 | |
| Interaction | 33.83 | 6 | 5.64 | 6.91 | < .001 | |
| Error | 22.85 | 28 | 0.82 | 0 | ||
| Fine-grained silica sand | ||||||
| Polysaccharides | Type | 636.09 | 6 | 106.01 | 84.27 | < .001 |
| Concentration | 1.47 | 1 | 1.47 | 1.17 | .288 | |
| Interaction | 49.2 | 6 | 8.2 | 6.52 | < .001 | |
| Error | 35.23 | 28 | 1.26 | 0 | ||
| Proteins | Type | 75.25 | 6 | 12.54 | 8.44 | < .001 |
| Concentration | 5.08 | 1 | 5.08 | 3.42 | .075 | |
| Interaction | 15.02 | 6 | 2.5 | 1.69 | .161 | |
| Error | 41.6 | 28 | 1.49 | 0 | ||
Disclaimer/Publisher’s Note: The statements, opinions and data contained in all publications are solely those of the individual author(s) and contributor(s) and not of MDPI and/or the editor(s). MDPI and/or the editor(s) disclaim responsibility for any injury to people or property resulting from any ideas, methods, instructions or products referred to in the content. |
© 2023 by the authors. Licensee MDPI, Basel, Switzerland. This article is an open access article distributed under the terms and conditions of the Creative Commons Attribution (CC BY) license (https://creativecommons.org/licenses/by/4.0/).
Share and Cite
Sieger, J.L.; Lottermoser, B.G.; Freer, J. Evaluation of Protein and Polysaccharide Biopolymers as Dust Suppressants on Mine Soils: Laboratory Experiments. Appl. Sci. 2023, 13, 1010. https://doi.org/10.3390/app13021010
Sieger JL, Lottermoser BG, Freer J. Evaluation of Protein and Polysaccharide Biopolymers as Dust Suppressants on Mine Soils: Laboratory Experiments. Applied Sciences. 2023; 13(2):1010. https://doi.org/10.3390/app13021010
Chicago/Turabian StyleSieger, Johannes L., Bernd G. Lottermoser, and Justus Freer. 2023. "Evaluation of Protein and Polysaccharide Biopolymers as Dust Suppressants on Mine Soils: Laboratory Experiments" Applied Sciences 13, no. 2: 1010. https://doi.org/10.3390/app13021010
APA StyleSieger, J. L., Lottermoser, B. G., & Freer, J. (2023). Evaluation of Protein and Polysaccharide Biopolymers as Dust Suppressants on Mine Soils: Laboratory Experiments. Applied Sciences, 13(2), 1010. https://doi.org/10.3390/app13021010