
Mendelian Randomisation Confirms the Role of Y-Chromosome Loss in Alzheimer’s Disease Aetiopathogenesis in Men

 , , , , , , , , , , , , ,
  , , , add
Show full author list
, , , add
Show full author list
Abstract
:1. Introduction
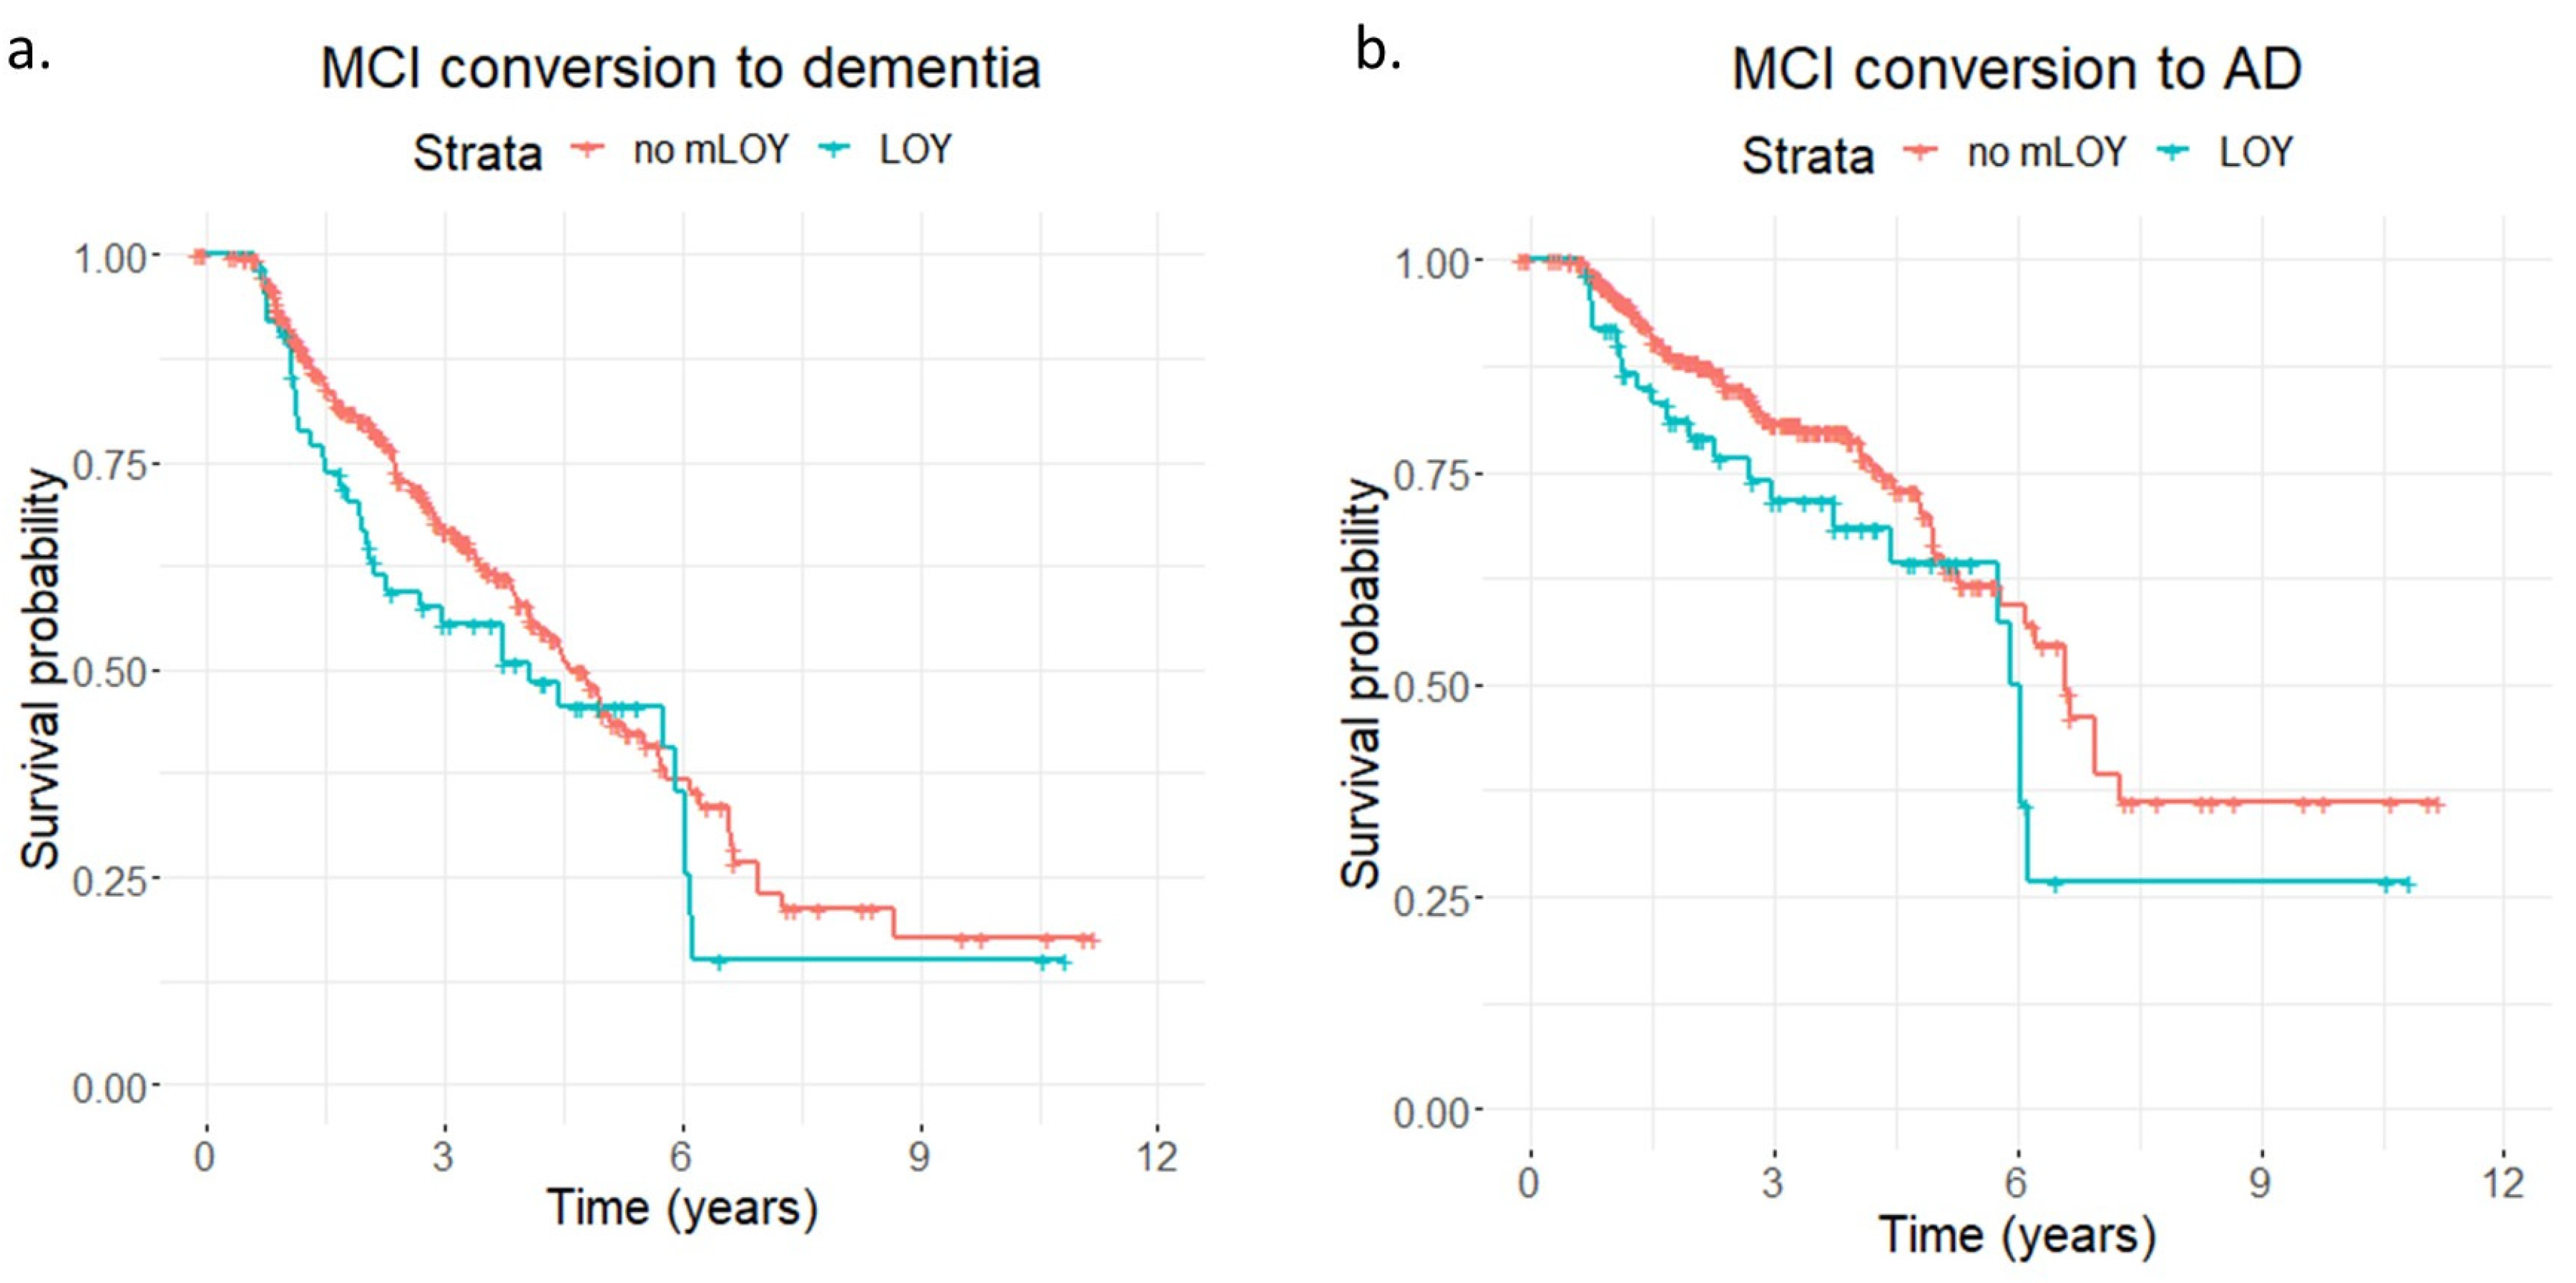
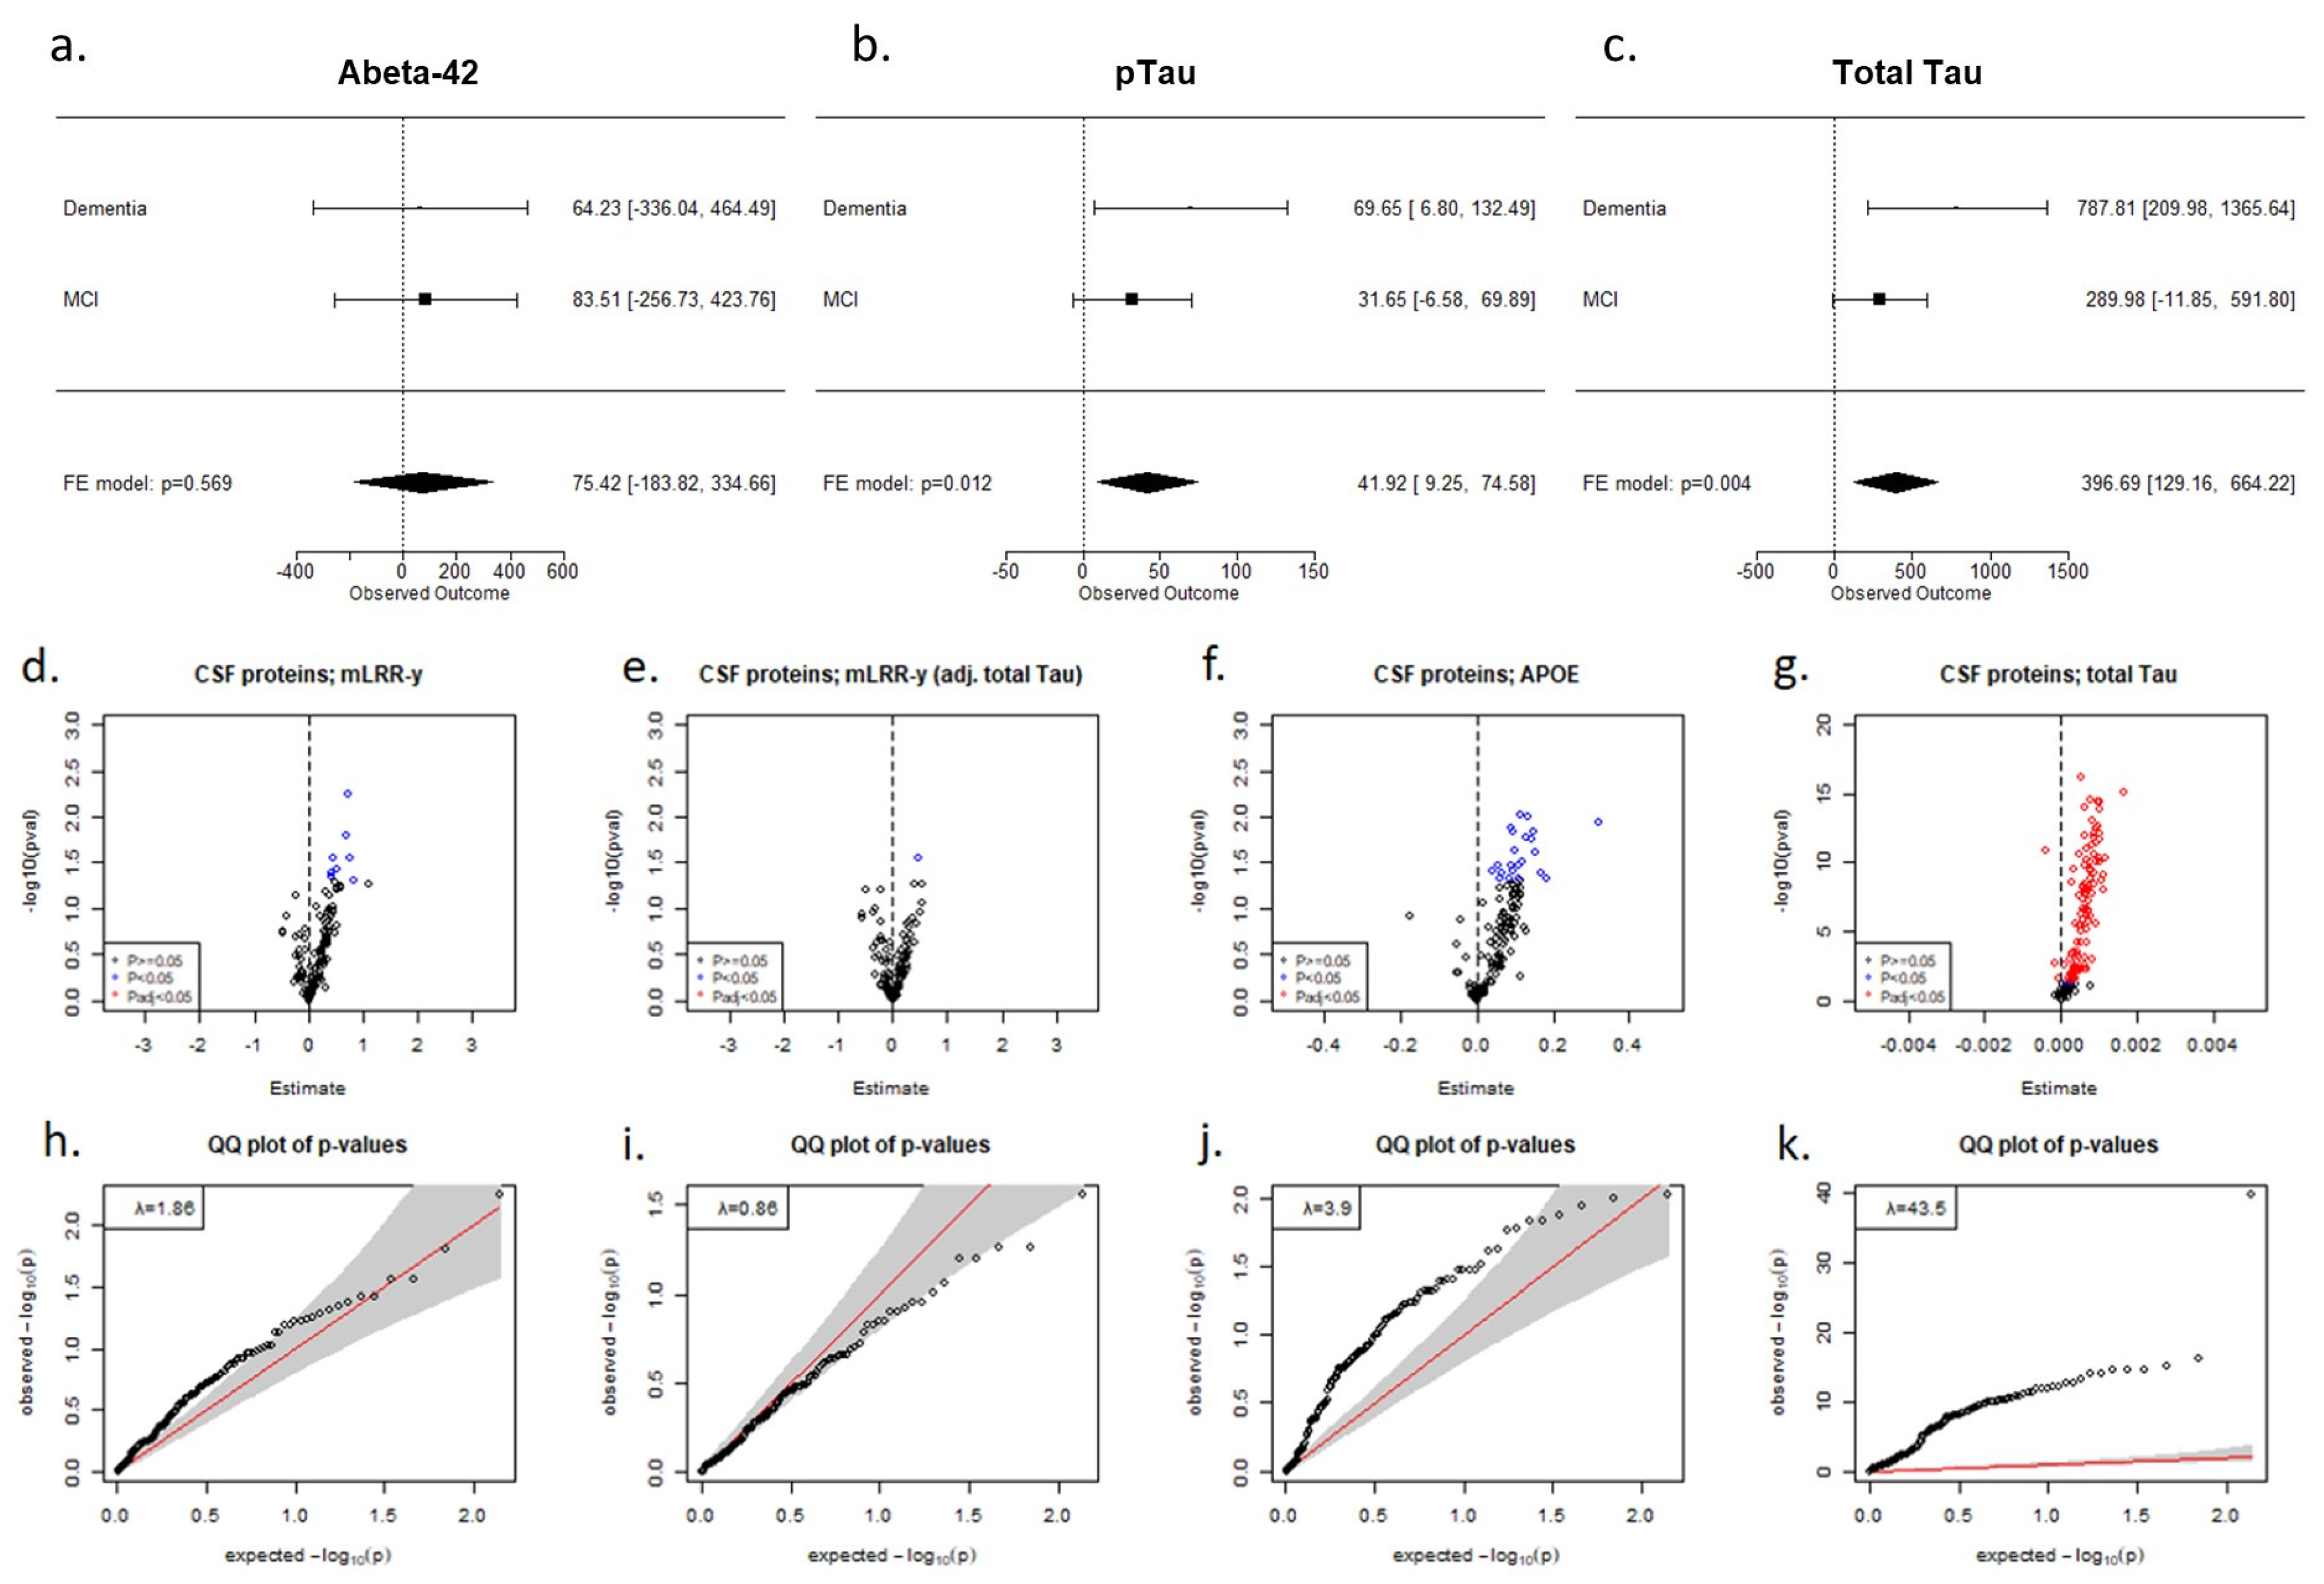
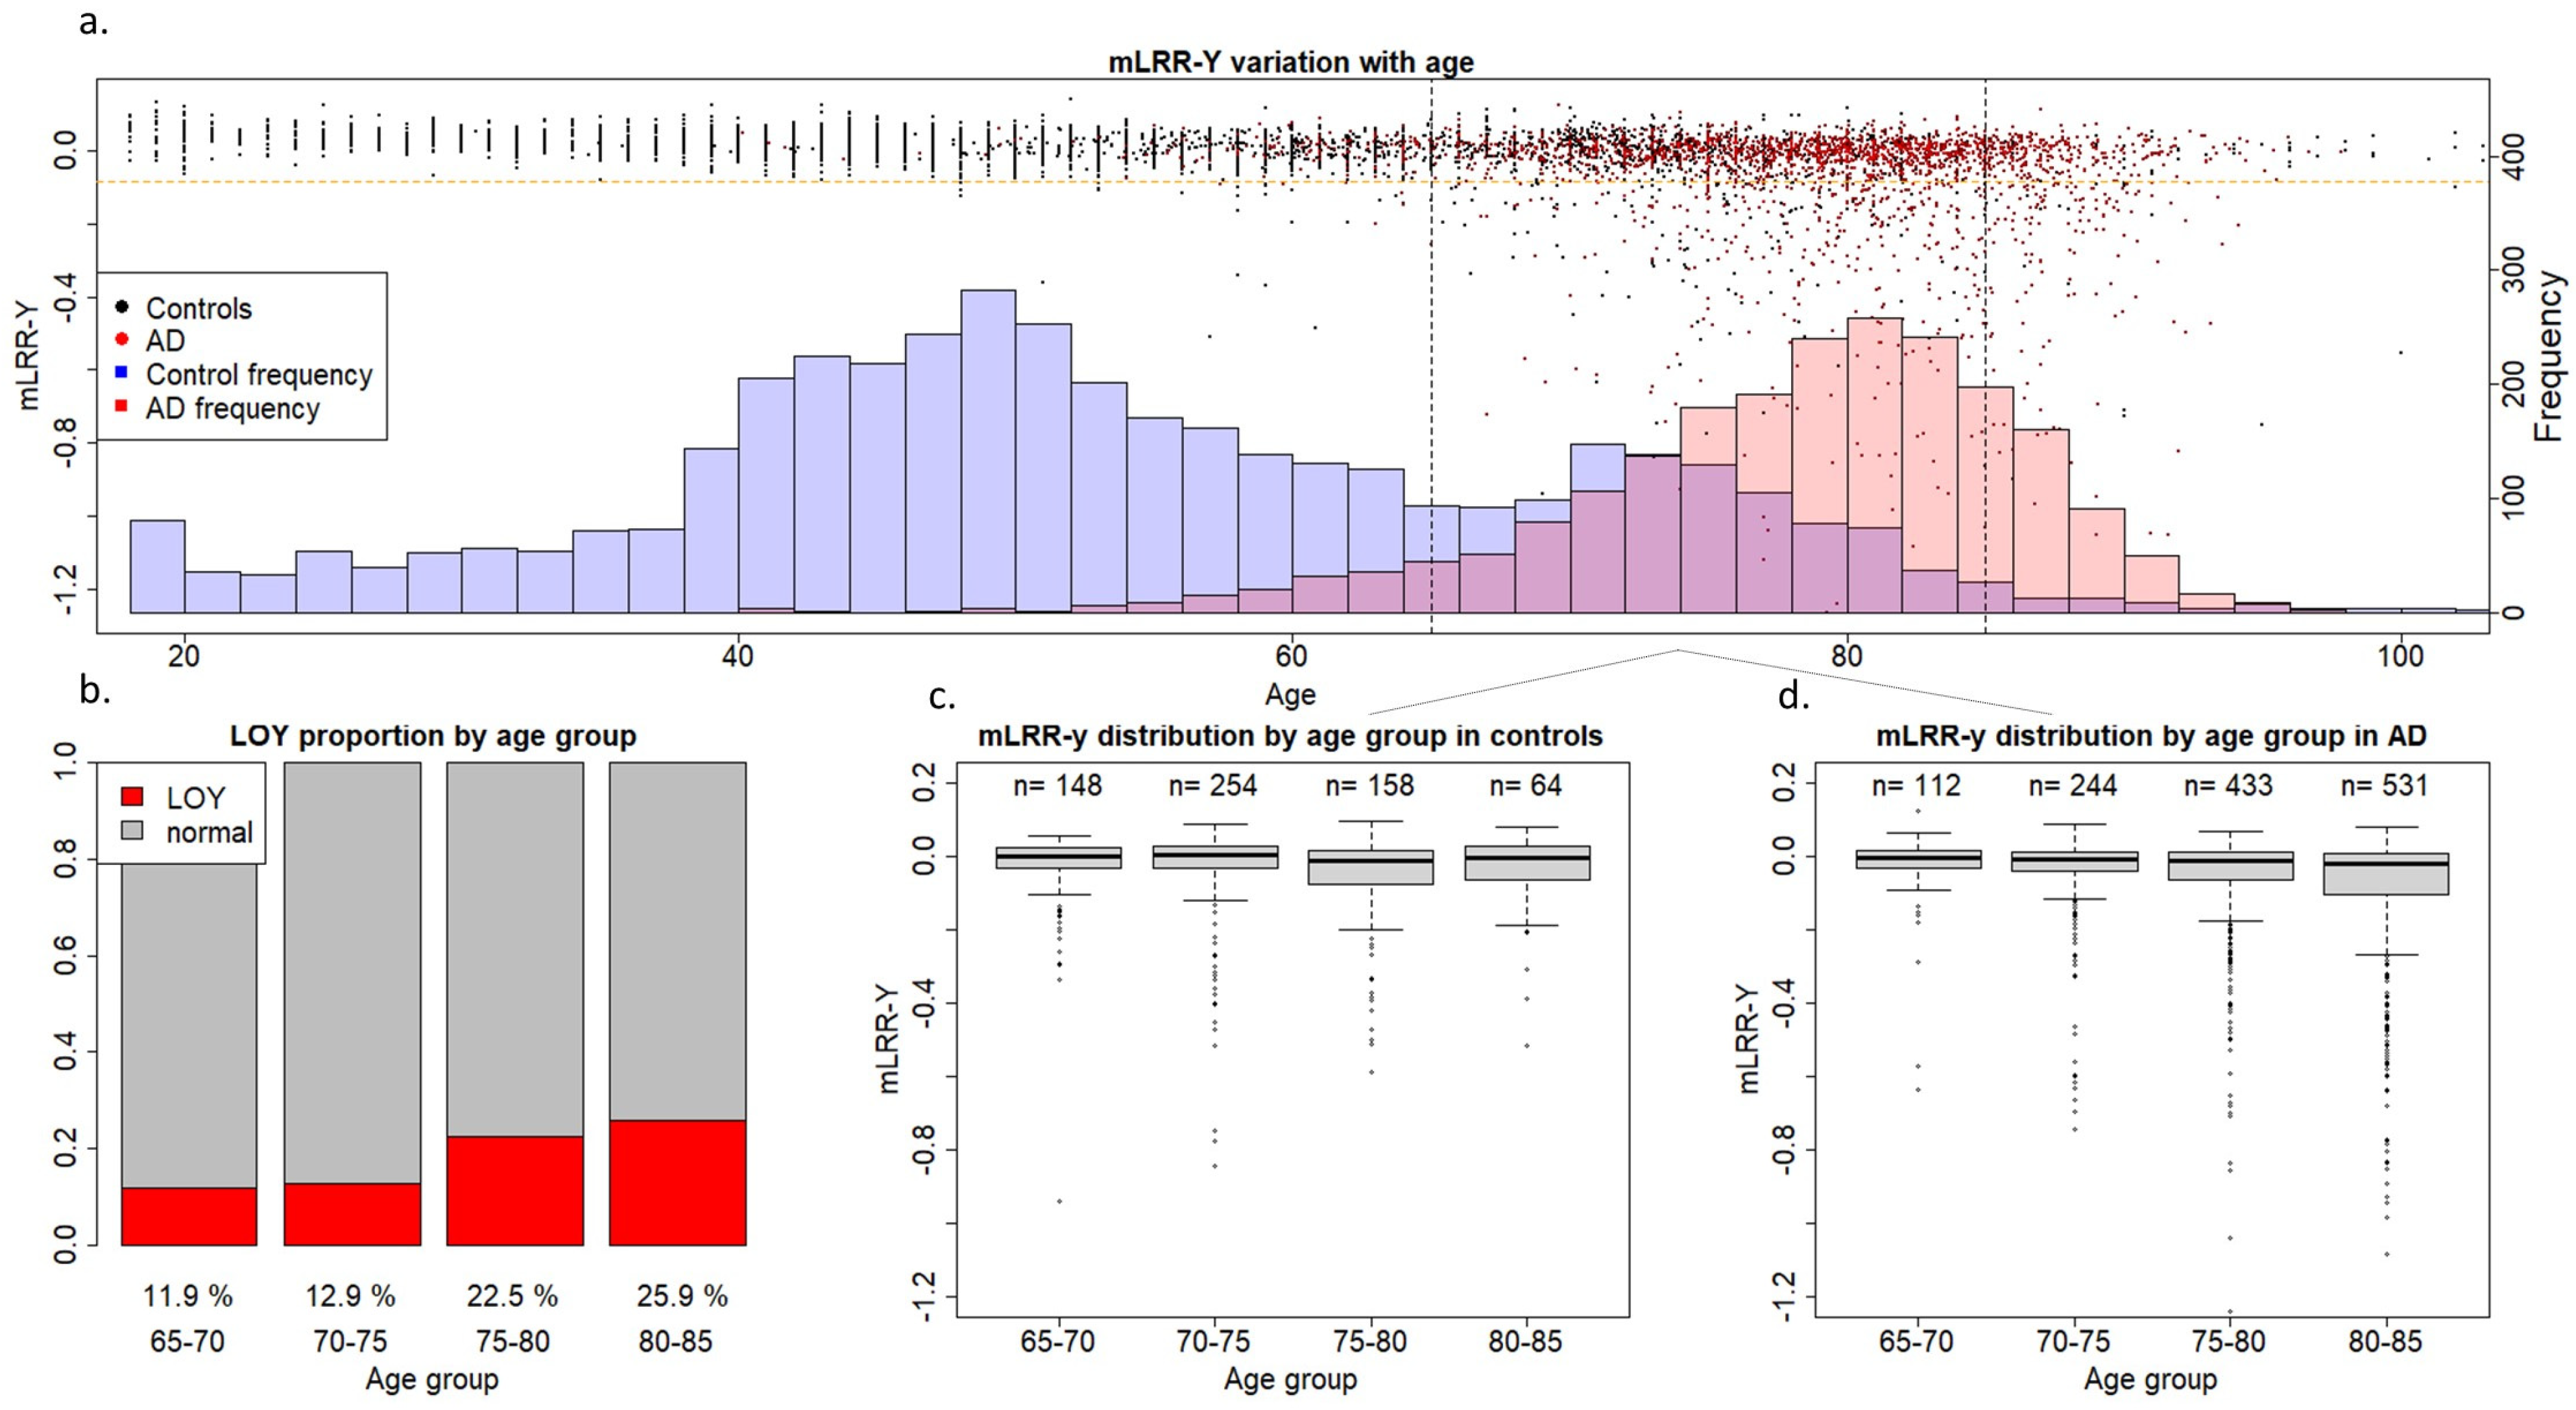
2. Results
3. Discussion
4. Materials and Methods
4.1. The GR@ACE-DEGESCO Cohort
4.2. The ACE MCI-EADB Cohort
4.3. Criteria for AD Diagnosis Case-Control Setup
4.4. Assessment of MCI-To-Dementia/AD Conversion
4.5. LOY Determination
4.6. Sample Processing and QC
4.7. mloy-PRS
4.8. Core AD Biomarkers and Targeted Proteomics
4.9. Statistical Analysis
Supplementary Materials
Author Contributions
Funding
Institutional Review Board Statement
Informed Consent Statement
Data Availability Statement
Acknowledgments
Conflicts of Interest
References
- The Alzheimer’s association. 2021 Alzheimer’s Disease Facts and Figures. Alzheimer’s Dement. 2021, 17, 327–406. [Google Scholar] [CrossRef] [PubMed]
- Wingo, T.S.; Lah, J.J.; Levey, A.I.; Cutler, D.J. Autosomal Recessive Causes Likely in Early-Onset Alzheimer Disease. Arch. Neurol. 2012, 69, 59–64. [Google Scholar] [CrossRef] [PubMed] [Green Version]
- Gatz, M.; Reynolds, C.A.; Fratiglioni, L.; Johansson, B.; Mortimer, J.A.; Berg, S.; Fiske, A.; Pedersen, N.L. Role of Genes and Environments for Explaining Alzheimer Disease. Arch. Gen. Psychiatry 2006, 63, 168–174. [Google Scholar] [CrossRef] [PubMed] [Green Version]
- Strittmatter, W.J.; Saunders, A.M.; Schmechel, D.; Pericak-Vance, M.; Enghild, J.; Salvesen, G.S.; Roses, A.D. Apolipoprotein E: High-Avidity Binding to β-Amyloid and Increased Frequency of Type 4 Allele in Late-Onset Familial Alzheimer Disease. Proc. Natl. Acad. Sci. USA 1993, 90, 1977–1981. [Google Scholar] [CrossRef] [PubMed] [Green Version]
- Herrup, K. Reimagining Alzheimer’s Disease—An Age-Based Hypothesis. J. Neurosci. 2010, 30, 16755–16762. [Google Scholar]
- Lin, K.A.; Choudhury, K.R.; Rathakrishnan, B.G.; Marks, D.M.; Petrella, J.R.; Doraiswamy, P.M. Marked Gender Differences in Progression of Mild Cognitive Impairment over 8 Years. Alzheimer’s Dement. Transl. Res. Clin. Interv. 2015, 1, 103–110. [Google Scholar] [CrossRef] [Green Version]
- Holland, D.; Desikan, R.S.; Dale, A.M.; McEvoy, L.K. Higher Rates of Decline for Women and Apolipoprotein e Ε4 Carriers. Am. J. Neuroradiol. 2013, 34, 2287–2293. [Google Scholar] [CrossRef] [Green Version]
- Snyder, H.M.; Asthana, S.; Bain, L.; Brinton, R.; Craft, S.; Dubal, D.B.; Espeland, M.A.; Gatz, M.; Mielke, M.M.; Raber, J.; et al. Sex Biology Contributions to Vulnerability to Alzheimer’s Disease: A Think Tank Convened by the Women’s Alzheimer’s Research Initiative. Alzheimer’s Dement. 2016, 12, 1186–1196. [Google Scholar] [CrossRef]
- Ferretti, M.T.; Iulita, M.F.; Cavedo, E.; Chiesa, P.A.; Dimech, A.S.; Chadha, A.S.; Baracchi, F.; Girouard, H.; Misoch, S.; Giacobini, E.; et al. Sex Differences in Alzheimer Disease—The Gateway to Precision Medicine. Nat. Rev. Neurol. 2018, 14, 457–469. [Google Scholar] [CrossRef]
- Forsberg, L.A.; Rasi, C.; Malmqvist, N.; Davies, H.; Pasupulati, S.; Pakalapati, G.; Sandgren, J.; De Ståhl, T.D.; Zaghlool, A.; Giedraitis, V.; et al. Mosaic Loss of Chromosome y in Peripheral Blood Is Associated with Shorter Survival and Higher Risk of Cancer. Nat. Genet. 2014, 46, 624–628. [Google Scholar]
- Jacobs, P.A.; Brunton, M.; Brown, W.M.C.; Doll, R.; Goldstein, H. Change of Human Chromosome Count Distributions with Age: Evidence for a Sex Difference. Nature 1963, 197, 1080–1081. [Google Scholar] [CrossRef] [PubMed]
- Jacobs, P.A.; Court Brown, W.M.; Doll, R. Distribution of Human Chromosome Counts in Relation to Age. Nature 1961, 191, 1178–1180. [Google Scholar] [CrossRef] [PubMed]
- Guo, X.; Dai, X.; Zhou, T.; Wang, H.; Ni, J.; Xue, J.; Wang, X. Mosaic Loss of Human Y Chromosome: What, How and Why. Hum. Genet. 2020, 139, 421–446. [Google Scholar] [CrossRef] [PubMed]
- Thompson, D.J.; Genovese, G.; Halvardson, J.; Ulirsch, J.C.; Wright, D.J.; Terao, C.; Davidsson, O.B.; Day, F.R.; Sulem, P.; Jiang, Y.; et al. Genetic Predisposition to Mosaic Y Chromosome Loss in Blood. Nature 2019, 575, 652–657. [Google Scholar] [CrossRef] [PubMed]
- United Kingdom Cancer Cytogenetics Group. Loss of the Y Chromosome from Normal and Neoplastic Bone Marrows. Genes Chromosom. Cancer 1992, 5, 83–88. [Google Scholar] [CrossRef] [PubMed]
- Wiktor, A.; Rybicki, B.A.; Piao, Z.S.; Shurafa, M.; Barthel, B.; Maeda, K.; Van Dyke, D.L. Clinical Significance of Y Chromosome Loss in Hematologic Disease. Genes Chromosom. Cancer 2000, 27, 11–16. [Google Scholar]
- Stone, J.F.; Sandberg, A.A. Sex Chromosome Aneuploidy and Aging. Mutat. Res. DNAging 1995, 338, 107–113. [Google Scholar] [CrossRef]
- Wong, A.K.; Fang, B.; Zhang, L.; Guo, X.; Lee, S.; Schreck, R. Loss of the Y Chromosome: An Age-Related or Clonal Phenomenon in Acute Myelogenous Leukemia/Myelodysplastic Syndrome? Arch. Pathol. Lab. Med. 2008, 132, 1329–1332. [Google Scholar] [CrossRef]
- Dumanski, J.P.; Lambert, J.C.; Rasi, C.; Giedraitis, V.; Davies, H.; Grenier-Boley, B.; Lindgren, C.M.; Campion, D.; Dufouil, C.; Pasquier, F.; et al. Mosaic Loss of Chromosome y in Blood Is Associated with Alzheimer Disease. Am. J. Hum. Genet. 2016, 98, 1208–1219. [Google Scholar] [CrossRef] [Green Version]
- Noveski, P.; Madjunkova, S.; Stefanovska, E.S.; Geshkovska, N.M.; Kuzmanovska, M.; Dimovski, A.; Plaseska-Karanfilska, D. Loss of Y Chromosome in Peripheral Blood of Colorectal and Prostate Cancer Patients. PLoS ONE 2016, 11, e0146264. [Google Scholar] [CrossRef] [Green Version]
- Haitjema, S.; Kofink, D.; Van Setten, J.; Van Der Laan, S.W.; Schoneveld, A.H.; Eales, J.; Tomaszewski, M.; De Jager, S.C.A.; Pasterkamp, G.; Asselbergs, F.W.; et al. Loss of y Chromosome in Blood Is Associated with Major Cardiovascular Events during Follow-Up in Men after Carotid Endarterectomy. Circ. Cardiovasc. Genet. 2017, 10, e001544. [Google Scholar] [CrossRef] [PubMed] [Green Version]
- Loftfield, E.; Zhou, W.; Graubard, B.I.; Yeager, M.; Chanock, S.J.; Freedman, N.D.; Machiela, M.J. Predictors of Mosaic Chromosome Y Loss and Associations with Mortality in the UK Biobank. Sci. Rep. 2018, 8, 12316. [Google Scholar] [CrossRef] [PubMed]
- Forsberg, L.A. Loss of Chromosome Y (LOY) in Blood Cells Is Associated with Increased Risk for Disease and Mortality in Aging Men. Hum. Genet. 2017, 136, 657–663. [Google Scholar] [CrossRef] [PubMed]
- Dumanski, J.P.; Halvardson, J.; Davies, H.; Rychlicka-Buniowska, E.; Mattisson, J.; Moghadam, B.T.; Nagy, N.; Węglarczyk, K.; Bukowska-Strakova, K.; Danielsson, M.; et al. Immune Cells Lacking Y Chromosome Show Dysregulation of Autosomal Gene Expression. Cell. Mol. Life Sci. 2021, 78, 4019–4033. [Google Scholar] [CrossRef] [PubMed]
- Guo, X. Loss of Y Chromosome at the Interface between Aging and Alzheimer’s Disease. Cell. Mol. Life Sci. 2021, 78, 7081–7084. [Google Scholar] [CrossRef] [PubMed]
- Moreno-Grau, S.; de Rojas, I.; Hernández, I.; Quintela, I.; Montrreal, L.; Alegret, M.; Hernández-Olasagarre, B.; Madrid, L.; González-Perez, A.; Maroñas, O.; et al. Genome-Wide Association Analysis of Dementia and Its Clinical Endophenotypes Reveal Novel Loci Associated with Alzheimer’s Disease and Three Causality Networks: The GR@ACE Project. Alzheimer’s Dement. 2019, 15, 1333–1347. [Google Scholar] [CrossRef] [PubMed]
- De Rojas, I.; Moreno-Grau, S.; Tesi, N.; Grenier-Boley, B.; Andrade, V.; Jansen, I.E.; Pedersen, N.L.; Stringa, N.; Zettergren, A.; Hernández, I.; et al. Common Variants in Alzheimer’s Disease and Risk Stratification by Polygenic Risk Scores. Nat. Commun. 2021, 12, 3417. [Google Scholar] [CrossRef]
- González, J.R.; López-Sánchez, M.; Cáceres, A.; Puig, P.; Esko, T.; Pérez-Jurado, L.A. MADloy: Robust Detection of Mosaic Loss of Chromosome Y from Genotype-Array-Intensity Data. BMC Bioinform. 2020, 21, 533. [Google Scholar] [CrossRef]
- Boada, M.; Tárraga, L.; Hernández, I.; Valero, S.; Alegret, M.; Ruiz, A.; Lopez, O.L.; Becker, J.T. Design of a Comprehensive Alzheimer’s Disease Clinic and Research Center in Spain to Meet Critical Patient and Family Needs. Alzheimer’s Dement. 2014, 10, 409–415. [Google Scholar] [CrossRef] [Green Version]
- Mattisson, J.; Danielsson, M.; Hammond, M.; Davies, H.; Gallant, C.J.; Nordlund, J.; Raine, A.; Edén, M.; Kilander, L.; Ingelsson, M.; et al. Leukocytes with Chromosome Y Loss Have Reduced Abundance of the Cell Surface Immunoprotein CD99. Sci. Rep. 2021, 11, 15160. [Google Scholar] [CrossRef]
- Kinney, J.W.; Bemiller, S.M.; Murtishaw, A.S.; Leisgang, A.M.; Salazar, A.M.; Lamb, B.T. Inflammation as a Central Mechanism in Alzheimer’s Disease. Alzheimer’s Dement. Transl. Res. Clin. Interv. 2018, 4, 575–590. [Google Scholar] [CrossRef] [PubMed]
- Caceres, A.; Jene, A.; Esko, T.; Perez-Jurado, L.A.; Gonzalez, J.R. Extreme Downregulation of Chromosome Y and Alzheimer’s Disease in Men. Neurobiol. Aging 2020, 90, 150.e1–150.e4. [Google Scholar]
- Riaz, M.; Mattisson, J.; Polekhina, G.; Bakshi, A.; Halvardson, J.; Danielsson, M.; Ameur, A.; McNeil, J.; Forsberg, L.A.; Lacaze, P. A Polygenic Risk Score Predicts Mosaic Loss of Chromosome Y in Circulating Blood Cells. Cell Biosci. 2021, 11, 205. [Google Scholar] [CrossRef] [PubMed]
- Bettcher, B.M.; Tansey, M.G.; Dorothée, G.; Heneka, M.T. Peripheral and Central Immune System Crosstalk in Alzheimer Disease—A Research Prospectus. Nat. Rev. Neurol. 2021, 17, 689–701. [Google Scholar] [CrossRef]
- Bellenguez, C.; Küçükali, F.; Jansen, I.E.; Kleineidam, L.; Moreno-Grau, S.; Amin, N.; Naj, A.C.; Campos-Martin, R.; Grenier-Boley, B.; Andrade, V.; et al. New Insights into the Genetic Etiology of Alzheimer’s Disease and Related Dementias. Nat. Genet. 2022, 54, 412–436. [Google Scholar] [CrossRef]
- Schenkel, A.R.; Mamdouh, Z.; Chen, X.; Liebman, R.M.; Muller, W.A. CD99 Plays a Major Role in the Migration of Monocytes through Endothelial Junctions. Nat. Immunol. 2002, 3, 143–150. [Google Scholar] [CrossRef]
- Vestweber, D. How Leukocytes Cross the Vascular Endothelium. Nat. Rev. Immunol. 2015, 15, 692–704. [Google Scholar] [CrossRef]
- Sämgård, K.; Zetterberg, H.; Blennow, K.; Hansson, O.; Minthon, L.; Londos, E. Cerebrospinal Fluid Total Tau as a Marker of Alzheimer’s Disease Intensity. Int. J. Geriatr. Psychiatry 2010, 25, 403–410. [Google Scholar] [CrossRef]
- Espinosa, A.; Alegret, M.; Valero, S.; Vinyes-Junqué, G.; Hernández, I.; Mauleón, A.; Rosende-Roca, M.; Ruiz, A.; López, O.; Tárraga, L.; et al. A Longitudinal Follow-up of 550 Mild Cognitive Impairment Patients: Evidence for Large Conversion to Dementia Rates and Detection of Major Risk Factors Involved. J. Alzheimer’s Dis. 2013, 34, 769–780. [Google Scholar] [CrossRef] [Green Version]
- Lacour, A.; Espinosa, A.; Louwersheimer, E.; Heilmann, S.; Hernández, I.; Wolfsgruber, S.; Fernández, V.; Wagner, H.; Rosende-Roca, M.; Mauleón, A.; et al. Genome-Wide Significant Risk Factors for Alzheimer’s Disease: Role in Progression to Dementia Due to Alzheimer’s Disease among Subjects with Mild Cognitive Impairment. Mol. Psychiatry 2017, 22, 153–160. [Google Scholar] [CrossRef] [Green Version]
- McKhann, G.; Drachman, D.; Folstein, M.; Katzman, R.; Price, D.; Stadlan, E.M. Clinical Diagnosis of Alzheimer’s Disease: Report of the NINCDS-ADRDA Work Group⋆ under the Auspices of Department of Health and Human Services Task Force on Alzheimer’s Disease. Neurology 1984, 34, 939–944. [Google Scholar] [CrossRef] [Green Version]
- McKhann, G.M.; Knopman, D.S.; Chertkow, H.; Hyman, B.T.; Jack, C.R.; Kawas, C.H.; Klunk, W.E.; Koroshetz, W.J.; Manly, J.J.; Mayeux, R.; et al. The Diagnosis of Dementia Due to Alzheimer’s Disease: Recommendations from the National Institute on Aging-Alzheimer’s Association Workgroups on Diagnostic Guidelines for Alzheimer’s Disease. Alzheimer’s Dement. 2011, 7, 263–269. [Google Scholar] [CrossRef] [PubMed] [Green Version]
- Román, G.C.; Tatemichi, T.K.; Erkinjuntti, T.; Cummings, J.L.; Masdeu, J.C.; Garcia, J.H.; Amaducci, L.; Orgogozo, J.M.; Brun, A.; Hofman, A.; et al. Vascular Dementia: Diagnostic Criteria for Research Studies: Report of the Ninds-Airen International Workshop. Neurology 1993, 43, 250–260. [Google Scholar] [CrossRef] [PubMed]
- Neary, D.; Snowden, J.S.; Gustafson, L.; Passant, U.; Stuss, D.; Black, S.; Freedman, M.; Kertesz, A.; Robert, P.H.; Albert, M.; et al. Frontotemporal Lobar Degeneration: A Consensus on Clinical Diagnostic Criteria. Neurology 1998, 51, 1546–1554. [Google Scholar] [CrossRef] [PubMed]
- Rascovsky, K.; Hodges, J.R.; Knopman, D.; Mendez, M.F.; Kramer, J.H.; Neuhaus, J.; Van Swieten, J.C.; Seelaar, H.; Dopper, E.G.P.; Onyike, C.U.; et al. Sensitivity of Revised Diagnostic Criteria for the Behavioural Variant of Frontotemporal Dementia. Brain 2011, 134, 2456–2477. [Google Scholar] [CrossRef]
- McKeith, I.G.; Dickson, D.W.; Lowe, J.; Emre, M.; O’Brien, J.T.; Feldman, H.; Cummings, J.; Duda, J.E.; Lippa, C.; Perry, E.K.; et al. Diagnosis and Management of Dementia with Lewy Bodies: Third Report of the DLB Consortium. Neurology 2005, 65, 1863–1872. [Google Scholar] [CrossRef] [Green Version]
- Petersen, R.C.; Smith, G.E.; Waring, S.C.; Ivnik, R.J.; Tangalos, E.G.; Kokmen, E. Mild Cognitive Impairment: Clinical Characterization and Outcome. Arch. Neurol. 1999, 56, 303–308. [Google Scholar] [CrossRef]
- Petersen, R.C. Mild Cognitive Impairment as a Diagnostic Entity. J. Intern. Med. 2004, 256, 183–194. [Google Scholar] [CrossRef]
- Diskin, S.J.; Li, M.; Hou, C.; Yang, S.; Glessner, J.; Hakonarson, H.; Bucan, M.; Maris, J.M.; Wang, K. Adjustment of Genomic Waves in Signal Intensities from Whole-Genome SNP Genotyping Platforms. Nucleic Acids Res. 2008, 36, e126. [Google Scholar] [CrossRef] [Green Version]
- Wang, K.; Li, M.; Hadley, D.; Liu, R.; Glessner, J.; Grant, S.F.A.; Hakonarson, H.; Bucan, M. PennCNV: An Integrated Hidden Markov Model Designed for High-Resolution Copy Number Variation Detection in Whole-Genome SNP Genotyping Data. Genome Res. 2007, 17, 1665–1674. [Google Scholar] [CrossRef] [Green Version]
- Wang, K.; Chen, Z.; Tadesse, M.G.; Glessner, J.; Grant, S.F.A.; Hakonarson, H.; Bucan, M.; Li, M. Modeling Genetic Inheritance of Copy Number Variations. Nucleic Acids Res. 2008, 21, e138. [Google Scholar] [CrossRef] [PubMed]
- Kendall, K.M.; Rees, E.; Escott-Price, V.; Einon, M.; Thomas, R.; Hewitt, J.; O’Donovan, M.C.; Owen, M.J.; Walters, J.T.R.; Kirov, G. Cognitive Performance Among Carriers of Pathogenic Copy Number Variants: Analysis of 152,000 UK Biobank Subjects. Biol. Psychiatry 2017, 82, 103–110. [Google Scholar] [CrossRef]
- Gogarten, S.M.; Sofer, T.; Chen, H.; Yu, C.; Brody, J.A.; Thornton, T.A.; Rice, K.M.; Conomos, M.P. Genetic Association Testing Using the GENESIS R/Bioconductor Package. Bioinformatics 2019, 35, 5346–5348. [Google Scholar] [CrossRef] [PubMed]
- Rodriguez-Gomez, O.; Sanabria, A.; Perez-Cordon, A.; Sanchez-Ruiz, D.; Abdelnour, C.; Valero, S.; Hernandez, I.; Rosende-Roca, M.; Mauleon, A.; Vargas, L.; et al. FACEHBI: A Prospective Study of Risk Factors, Biomarkers and Cognition in a Cohort of Individuals with Subjective Cognitive Decline. Study Rationale and Research Protocols. J. Prev. Alzheimer’s Dis. 2017, 4, 100–108. [Google Scholar] [CrossRef] [PubMed]
- Pesini, P.; Pérez-Grijalba, V.; Monleón, I.; Boada, M.; Tárraga, L.; Martínez-Lage, P.; San-José, I.; Sarasa, M. Reliable Measurements of the β -Amyloid Pool in Blood Could Help in the Early Diagnosis of AD. Int. J. Alzheimers. Dis. 2012, 2012, 604141. [Google Scholar] [CrossRef] [PubMed] [Green Version]
- Adami, P.V.M.; Orellana, A.; García, P.; Kleineidam, L.; Alarcón-Martín, E.; Montrreal, L.; Aguilera, N.; Espinosa, A.; Abdelnour, C.; Rosende-Roca, M.; et al. Matrix Metalloproteinase 10 Is Linked to the Risk of Progression to Dementia of the Alzheimer’s Type. Brain 2022, 145, 2507–2517. [Google Scholar] [CrossRef]
- R Core Team. R: A Language and Environment for Statistical Computing; R Foundation for Statistical Computing: Vienna, Austria, 2020. [Google Scholar]
- Therneau, T.M.; Grambsch, P.M. Modeling Survival Data: Extending the Cox Model; Statistics for Biology and Health; Springer: New York, NY, USA, 2000. [Google Scholar]
- Pierre, R.V.; Hoagland, H.C. Age-associated Aneuploidy: Loss of Y Chromosome from Human Bone Marrow Cells with Aging. Cancer 1972, 30, 889–894. [Google Scholar] [CrossRef]
- Viechtbauer, W. Conducting Meta-Analysis in R with the Metafor Package. J. Stat. Softw. 2010, 36, 1–48. [Google Scholar] [CrossRef]


| All Available Men | 65–85-Year-Old Men | Stratified 65–85-Year-Old Men | |||||||||||||||||
|---|---|---|---|---|---|---|---|---|---|---|---|---|---|---|---|---|---|---|---|
| OR | SE | p | CI2.5 | CI97.5 | OR | SE | p | CI2.5 | CI97.5 | Age Group | OR | SE | p | CI2.5 | CI97.5 | ||||
| mLRR-Y | mLRR-Y | 2.74 | 0.4 | 1.13 × 10⁻² | 1.29 | 6.16 | 2.19 | 0.47 | 9.28 × 10⁻² | 0.18 | 1.1 | 65–70 | 1.47 | 1.43 | 0.79 | 0.07 | 21.96 | ||
| Age | 1.16 | 0.01 | 2.74 × 10−104 | 1.15 | 1.18 | 1.27 | 0.01 | 6.61 × 10−70 | 1.24 | 1.31 | 70–75 | 1.74 | 0.77 | 0.48 | 0.39 | 8.18 | |||
| APOE | 2.52 | 0.08 | 1.61 × 10⁻³² | 2.17 | 2.94 | 2.86 | 0.10 | 5.40 × 10⁻²⁸ | 2.38 | 3.46 | 75–80 | 2.37 | 0.77 | 0.27 | 0.57 | 12.16 | |||
| PC1 | 2.01 × 10³ | 2.6 | 3.39 × 10⁻³ | 12.48 | 3.29 × 10⁵ | 0.01 | 3.33 | 0.11 | 0.00 | 3.48 | 80–85 | 44.44 | 2.51 | 0.13 | 0.99 | 2.63 × 10⁴ | |||
| PC2 | 0.02 | 2.58 | 0.15 | 0.00 | 3.8 | 0.00 | 3.45 | 0.12 | 0.00 | 4.00 | META | 2.20 | 0.50 | 0.12 | 0.83 | 5.88 | |||
| mLOY calls | mLOY | 1.14 | 0.14 | 0.35 | 0.87 | 1.49 | 1.04 | 0.16 | 0.81 | 0.76 | 1.43 | 65–70 | 0.55 | 0.45 | 0.19 | 0.22 | 1.30 | ||
| Age | 1.16 | 0.01 | 1.11 × 10−106 | 1.15 | 1.18 | 1.28 | 0.01 | 1.73 × 10−71 | 1.24 | 1.31 | 70–75 | 1.17 | 0.3 | 0.6 | 0.65 | 2.11 | |||
| APOE | 2.52 | 0.08 | 2.17 × 10⁻³² | 2.17 | 2.94 | 2.86 | 0.10 | 6.93 × 10⁻²⁸ | 2.37 | 3.46 | 75–80 | 1.00 | 0.25 | 0.99 | 0.62 | 1.66 | |||
| PC1 | 2.29 × 10³ | 2.59 | 2.78 × 10⁻³ | 14.5 | 3.69 × 10⁻⁵ | 0.00 | 3.32 | 0.10 | 0.00 | 2.96 | 80–85 | 3.70 | 0.77 | 0.09 | 1.00 | 24.08 | |||
| PC2 | 0.02 | 2.58 | 0.14 | 0.00 | 3.44 | 0.00 | 3.44 | 0.11 | 0.00 | 3.34 | META | 1.03 | 0.17 | 0.86 | 0.74 | 1.45 | |||
| Conversion to All-Cause Dementia | Conversion to AD Dementia | |||||||||
|---|---|---|---|---|---|---|---|---|---|---|
| HR | SE | p | 95% CI | HR | SE | p | 95% CI | |||
| Association results for mLRR-Y (continuous mLOY variable) | ||||||||||
| mLRR-Y | 1.93 | 0.40 | 0.10 | 0.87–4.27 | 2.05 | 0.55 | 0.19 | 0.70–5.97 | ||
| Age | 1.10 | 0.01 | 3.62 × 10⁻¹⁵ | 1.07–1.12 | 1.13 | 0.02 | 2.38 × 10⁻¹² | 1.09–1.16 | ||
| APOE | 1.29 | 0.13 | 4.10 × 10⁻² | 1.01–1.66 | 1.56 | 0.17 | 8.89 × 10⁻³ | 1.12–2.17 | ||
| Association results for mLOY calls | ||||||||||
| mLOY | 1.17 | 0.19 | 0.40 | 0.81–1.70 | 1.38 | 0.25 | 0.20 | 0.85–2.24 | ||
| Age | 1.10 | 0.01 | 1.33 × 10⁻¹⁵ | 1.07–1.13 | 1.13 | 0.02 | 1.62 × 10⁻¹² | 1.09–1.17 | ||
| APOE | 1.28 | 0.13 | 5.09 × 10⁻² | 1.00–1.63 | 1.54 | 0.17 | 1.05E × 10−2 | 1.11–2.13 | ||
| (a) Logistic regression results: | ||||||
| OR | SE | Z | p | CI2.5 | CI97.5 | |
| Case-control, all | 1.03 | 0.03 | 1.09 | 0.28 | 0.98 | 1.09 |
| Case-control, men | 1.07 | 0.05 | 1.55 | 0.12 | 0.98 | 1.18 |
| Case-control, women | 1.00 | 0.03 | 0.10 | 0.93 | 0.90 | 1.10 |
| (b) Cox model results: | ||||||
| HR | SE | Z | p | CI2.5 | CI97.5 | |
| All, MCI to dementia | 1.04 | 0.04 | 0.97 | 0.33 | 0.96 | 1.12 |
| All, MCI to AD | 1.07 | 0.05 | 1.45 | 0.15 | 0.98 | 1.16 |
| Men, MCI to dementia | 1.11 | 0.06 | 1.77 | 7.68 × 10⁻² | 0.99 | 1.26 |
| Men, MCI to AD | 1.23 | 0.08 | 2.53 | 1.14 × 10⁻² | 1.05 | 1.43 |
| Women, MCI to dementia | 0.99 | 0.05 | -0.23 | 0.81 | 0.90 | 1.08 |
| Women, MCI to AD | 0.99 | 0.06 | -0.19 | 0.85 | 0.89 | 1.11 |
Disclaimer/Publisher’s Note: The statements, opinions and data contained in all publications are solely those of the individual author(s) and contributor(s) and not of MDPI and/or the editor(s). MDPI and/or the editor(s) disclaim responsibility for any injury to people or property resulting from any ideas, methods, instructions or products referred to in the content. |
© 2023 by the authors. Licensee MDPI, Basel, Switzerland. This article is an open access article distributed under the terms and conditions of the Creative Commons Attribution (CC BY) license (https://creativecommons.org/licenses/by/4.0/).
Share and Cite
García-González, P.; de Rojas, I.; Moreno-Grau, S.; Montrreal, L.; Puerta, R.; Alarcón-Martín, E.; Quintela, I.; Orellana, A.; Andrade, V.; Adami, P.V.M.; et al. Mendelian Randomisation Confirms the Role of Y-Chromosome Loss in Alzheimer’s Disease Aetiopathogenesis in Men. Int. J. Mol. Sci. 2023, 24, 898. https://doi.org/10.3390/ijms24020898
García-González P, de Rojas I, Moreno-Grau S, Montrreal L, Puerta R, Alarcón-Martín E, Quintela I, Orellana A, Andrade V, Adami PVM, et al. Mendelian Randomisation Confirms the Role of Y-Chromosome Loss in Alzheimer’s Disease Aetiopathogenesis in Men. International Journal of Molecular Sciences. 2023; 24(2):898. https://doi.org/10.3390/ijms24020898
Chicago/Turabian StyleGarcía-González, Pablo, Itziar de Rojas, Sonia Moreno-Grau, Laura Montrreal, Raquel Puerta, Emilio Alarcón-Martín, Inés Quintela, Adela Orellana, Victor Andrade, Pamela V. Martino Adami, and et al. 2023. "Mendelian Randomisation Confirms the Role of Y-Chromosome Loss in Alzheimer’s Disease Aetiopathogenesis in Men" International Journal of Molecular Sciences 24, no. 2: 898. https://doi.org/10.3390/ijms24020898
APA StyleGarcía-González, P., de Rojas, I., Moreno-Grau, S., Montrreal, L., Puerta, R., Alarcón-Martín, E., Quintela, I., Orellana, A., Andrade, V., Adami, P. V. M., Heilmann-Heimbach, S., Gomez-Garre, P., Periñán, M. T., Alvarez, I., Diez-Fairen, M., Nuñez Llaves, R., Olivé Roig, C., Garcia-Ribas, G., Menéndez-González, M., ... Ruiz, A. (2023). Mendelian Randomisation Confirms the Role of Y-Chromosome Loss in Alzheimer’s Disease Aetiopathogenesis in Men. International Journal of Molecular Sciences, 24(2), 898. https://doi.org/10.3390/ijms24020898