Next Article in Journal
Microcystin-LR Acute Exposure Does Not Alter In Vitro and In Vivo ATP, ADP and AMP Hydrolysis in Adult Zebrafish (Danio rerio) Brain Membranes
Previous Article in Journal
Assessment of Polychlorinated Biphenyls and Organochlorine Pesticides in Water Samples from the Yamuna River
 
 
Journal of Xenobiotics is published by MDPI from Volume 10 Issue 1 (2020). Previous articles were published by another publisher in Open Access under a CC-BY (or CC-BY-NC-ND) licence, and they are hosted by MDPI on mdpi.com as a courtesy and upon agreement with PAGEPress.
Article

Congener Specific Distribution of Polychlorinated Dibenzo-p-Dioxins and Dibenzo-p-Furans in Ambient Air Particulates (<PM10) in Delhi, India

by
Bhupander Kumar
1,*,
Satish Kumar Singh
1,
Ram Bharoshey Lal
2,
Sanjay Kumar
1 and
Chandra Shekhar Sharma
1
1
National Reference Trace Organics Laboratory Central Pollution Control Board East Arjun Nagar Delhi, India
2
HSM Division, Ministry of Environment & Forest, Lodhi Road, New Delhi, India
*
Author to whom correspondence should be addressed.
J. Xenobiot. 2012, 2(1), e7; https://doi.org/10.4081/xeno.2012.e7
Submission received: 7 March 2012 / Revised: 17 May 2012 / Accepted: 18 May 2012 / Published: 1 August 2012

Abstract

:
Polychlorinated dibenzo-p-dioxins (PCDDs) and polychlorinated dibenzo-p-furans (PCDFs) are unintentionally formed during inefficient combustions and as a by-product. Due to their resistance to degradation and their toxic effect on health, PCDD/Fs are listed by the Stockholm Convention as persistent organic pollutants (POPs). Once released into the atmosphere, most of them are adsorbed to air particles and transported away from sources in atmosphere. India signed the Stockholm Convention India agreeing thereby to reduce and eliminate the use of POPs. The German agency for Technical Cooperation helped develop facilities for monitoring POPs at a national level in Delhi. This paper presents the data generated during a training assignment for Central Pollution Control Board officials at the German laboratory. Air borne particulate matter (<PM10) was collected from 6 different locations in Delhi, India and analyzed in a German laboratory for 17 congeners of PCDD/Fs. The concentrations of ∑PCDD/Fs ranged between 1720–9010 fg m−3 (mean 5559 fg m−3) and their toxic equivalency values ranged from 67 to 460 fg I-toxic equivalent quantities (TEQ) m−3, with an average of 239 fg I-TEQ m−3 which was lower than the ambient air standards. The dominant congeners were octachlorinated dibenzo-p-dioxin (OCDD), octachlorinated dibenzo-p-furans (OCDF), 1,2,3,4,6,7,8-heptachlorinated dibenzo-p-furans, and 1,2,3,4,6,7,8-heptachlorinated dibenzo-p-dioxin. The contributions of individual homologs for ∑PCDDs/Fs I-TEQ was in the order of OCDD (31%) > HCDF (21%) > hexa-chlorodibenzofurans (13%) = OCDF (13%) > HCDF (12%) and other individual congeners contribute less than 5%. High chlorinated congeners contributed with more than 80% for ∑PCDD/Fs I-TEQ. Rough estimates of tolerable daily intake (TDI) shows low health risk of exposure to ∑PCDD/Fs with inhalation of 0.098 pg I-TEQ kg−1 day−1 for adult and 0.152 pg TEQ kg−1 day−1 for children, which is much lower than World Health Organization recommended TDI for dioxins.

Introduction

Polychlorinated dibenzo-p-dioxins (PCDDs) and polychlorinated dibenzo-p-furans (PCDFs) are primarily formed from inefficient combustion processes, such as biomass combustion in incineration plants, sintering plants, cement kiln plants [1] and unintentional by-products from the synthesis of various chlorinated products. [2,3] PCDD/Fs are ubiquitous chemicals, listed by the Stockholm Convention as one of 12 persistent organic pollutants (POPs). Due to their resistance to chemical, physical and bio-logical degradation, they have been transported worldwide, affecting regions far from their original sources and found in all environmental media of the earth. [4] PCDD/Fs adsorbed to dust particles in the atmosphere and most PCDD/Fs are found in the particulate phase. [5] Gas-phase PCDD/Fs are believed to be depleted due to degradation reactions in the atmosphere, and the particle properties play an important role in the transport of particlebound PCDD/Fs away from sources. [6] Compared with the larger particles, the inhalable <PM10 could remain longer in the air and, therefore, cause greater concern for human health. [7] In this sense, the levels of PCDDs/Fs in <PM10 have been recognized and have widened our knowledge about these pollutants resulting in stringent regulations aimed at protecting public health being established worldwide. [8,9,10,11,12,13,14]
Several studies have been carried out on the occurrence and distribution of PCDDs/Fs in India and have reported different matrices, such as water, soil, sludge, [15,16] wildlife and biological samples, [17,18] human milk [19,20] and atmospheric air. [21,22,23]
On 17th May 2004, the Stockholm Convention on POPs came into force with the intention of reducing and ultimately eliminating these pollutants. India is a signatory of the treaty the purpose of which is to encourage support for research on POPs. The Advisory Services in Environment Management (ASEM), the executive arm of the German agency for Technical Cooperation (GTZ) in India, helped develop facilities for monitoring POPs at the headquarters of the Central Pollution Control Board (CPCB). CPCB is a statuary body under the Ministry of Environment and Forest, and with this the Indian government is looking to identify the sources of persistent organic pollutants with a view to quantifying and estimating their potential release into the environment. A national implementation plan has already been developed. [24] This paper presents for the first time data on PCDDs/Fs levels in airborne particulate matter in Delhi which have been processed and analyzed at a German laboratory.

Materials and Methods

Study area

Delhi is the administrative capital city of India with a population of approximately 18 million. It is situated between the geographical coordinates of 28° 36’ 36” N to 77° 13’ 48” E. There are specified industrial zones with more than 8000 small to medium sized industries in the food, textile, chemical, paints, metallic and non-metallic dye sectors, etc.
The monitoring locations of the National Ambient Air Monitoring Programme in Delhi had been used for Ambient Air Sampling in this study. Airborne particulate matter (PM10) was monitored and sampled at 6 different locations in Delhi on US Environmental Protection Agency (USEPA) glass filter papers during March 2007 using respirable suspended particulate matter sampler (modified high volume sampler with cyclone for particle size cut off). Samples were taken every 24 h (6 a.m. to 6 a.m.) and collected operating the instrument at an average ambient airflow of 1.0 m3 min-1. The exposed filter papers were wrapped in aluminum foil and shipped to Germany.

Chemicals and solvents

Solvents (acetone, dichloromethane, nhexane, and cyclohexane) for organic trace analysis and chemicals (sodium sulfate, silver nitrate, potassium hydroxide, silica gel, aluminum oxide) were purchased from Merck (Darmstadt, Germany). Reference standard solutions of 17 PCDDs/Fs congeners in nonane (CS1 to CS5, extraction spike solutions and syringe spike solutions) used for instrument calibration, quantification, recovery and quality control were purchased from Wellington Laboratories Inc. (Guelph Ontario, Canada).

Sample extraction and cleanup

Sample extraction and cleanup was performed according to standard methods. [25] Sample extraction and cleanup was performed in the analytical laboratory for dioxin and furan of the Fraunhofer Institute for Process Engineering and Packaging (IVV) at Friesing, Germany. The exposed filter papers with particulate matter were spiked with the 2,3,7,8 substituted PCDD and PCDF as 13C12 labeled quantification standards. The pollutants were extracted from the filter papers by Soxhlet with toluene for 24 h. Extracts were concentrated to near 5 mL using Buchi Rotary Vacuum Evaporator.
The extracts were cleaned after EN 1948 in two stages: first by modified multi-layer silica gel column and second alumina column chromatography. Primarily, cleanup of the extracts was performed on multilayered column (30x300 mm) packed with absorbent in the following order from bottom to top: 2.0 g activated silica, 5.0 g KOH silica, 1.0 g activated silica, 10.0 g sulfuric acid impregnated silica, 5.0 g silver nitrate coated silica and followed by 5.0 g sodium sulphate. After loading, the concentrated sample extracts were washed three times onto the column; the analytes were eluted with 250 mL n-hexane and concentrated to near 2.0 mL with rotavapor. The final cleanup of the concentrated elute was performed on aluminum oxide column (22x250 mm) using 25 g activated aluminum oxide (basic) and 10 g sodium sulphate. The elution of the analytes was carried out as fraction 1:60 mL n-hexane; fraction 2:120 mL of 2% dichloromethane in n-hexane; and fraction 3:200 mL of dichloromethane/n-hexane (1:1 v/v). Fractions 1 and 2 were discarded as they contained unwanted analyte but dioxins containing fraction 3 were retained and concentrated to near 1.0 mL. The final concentrate was dried under gentle stream of high purity nitrogen. Before analysis, 13C12 1,2,3,4 tetrachlorinated dibenzo-p-dioxin (TCDD) was added as recovery standard.

Instrumental analysis

Identification and quantification of PCDDs/Fs were performed in the laboratory of the Bavarian Environmental Agency, Augsburg, Germany by HRGC-HRMS (Thermo, Finnigan MAT 95) coupled to auto sampler using a positive electron ionization (EI+) source operating selective ion mode at a 10,000 resolution (10% valley definition). Chromatographic separation was performed on a weakly polar 60 m×0.25 ID×0.25 um (DB-XLB) capillary column. Quantification of each congener was performed by direct comparison of peak areas of mass fragmentograms for the (M+2)+-ion of the native compound and the (M+2)+-ion of the corresponding 13C12-labeled standard (isotopic dilution method). For congeners with a concentration below the limit of quantification, signal to noise value of 10:1 of the mass was used for quantification.
Analytical quality assurance and quality control procedures were conducted using method blank and recovery of target analytes by spiking 13C12-labeled standards. Recovery rates of 13C12-labeled internal standards were within the acceptable 50-130% ranges set by the EN 1948 methods. Toxic equivalent quantities (TEQ) were calculated by multiplying the concentration of individual PCDD/PCDF congener with the corresponding toxicity equivalent factors (TEFs) proposed by the international system.26 The results were presented as fg m−3 and their toxic equivalent in fg I-TEQ m−3.

Results

Concentrations of polychlorinated dibenzo-p-dioxins/dibenzo-p-furans

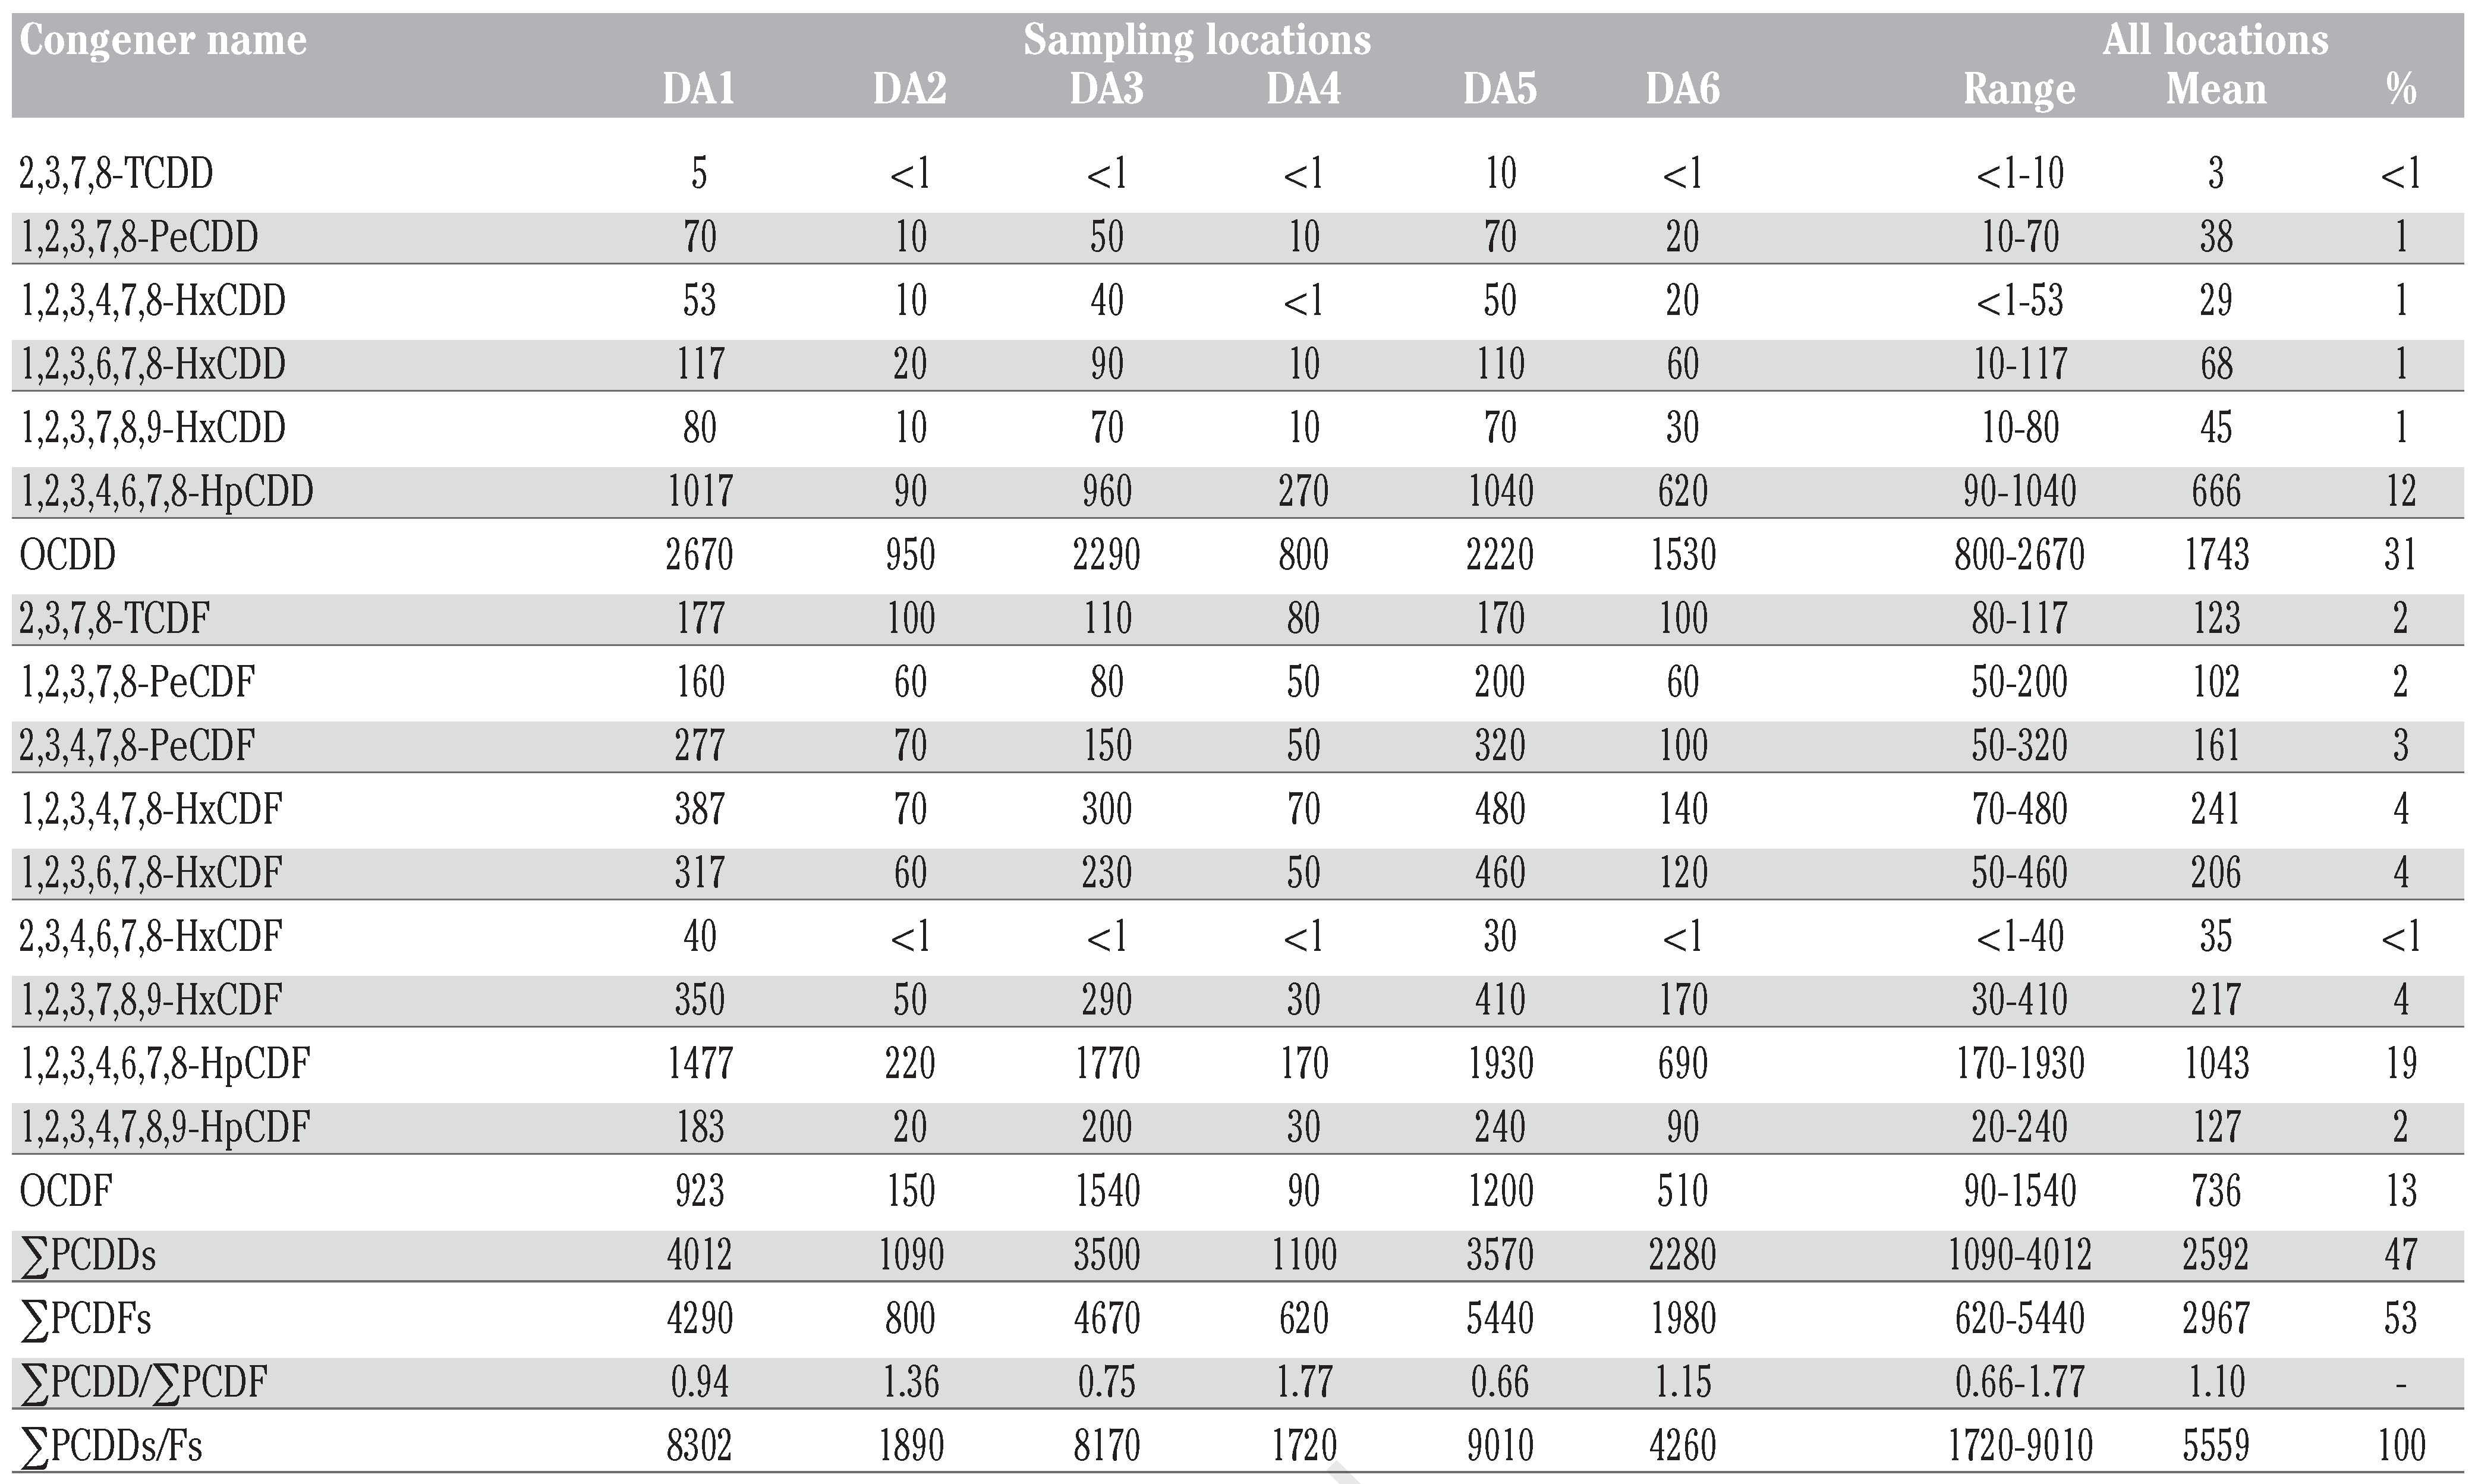
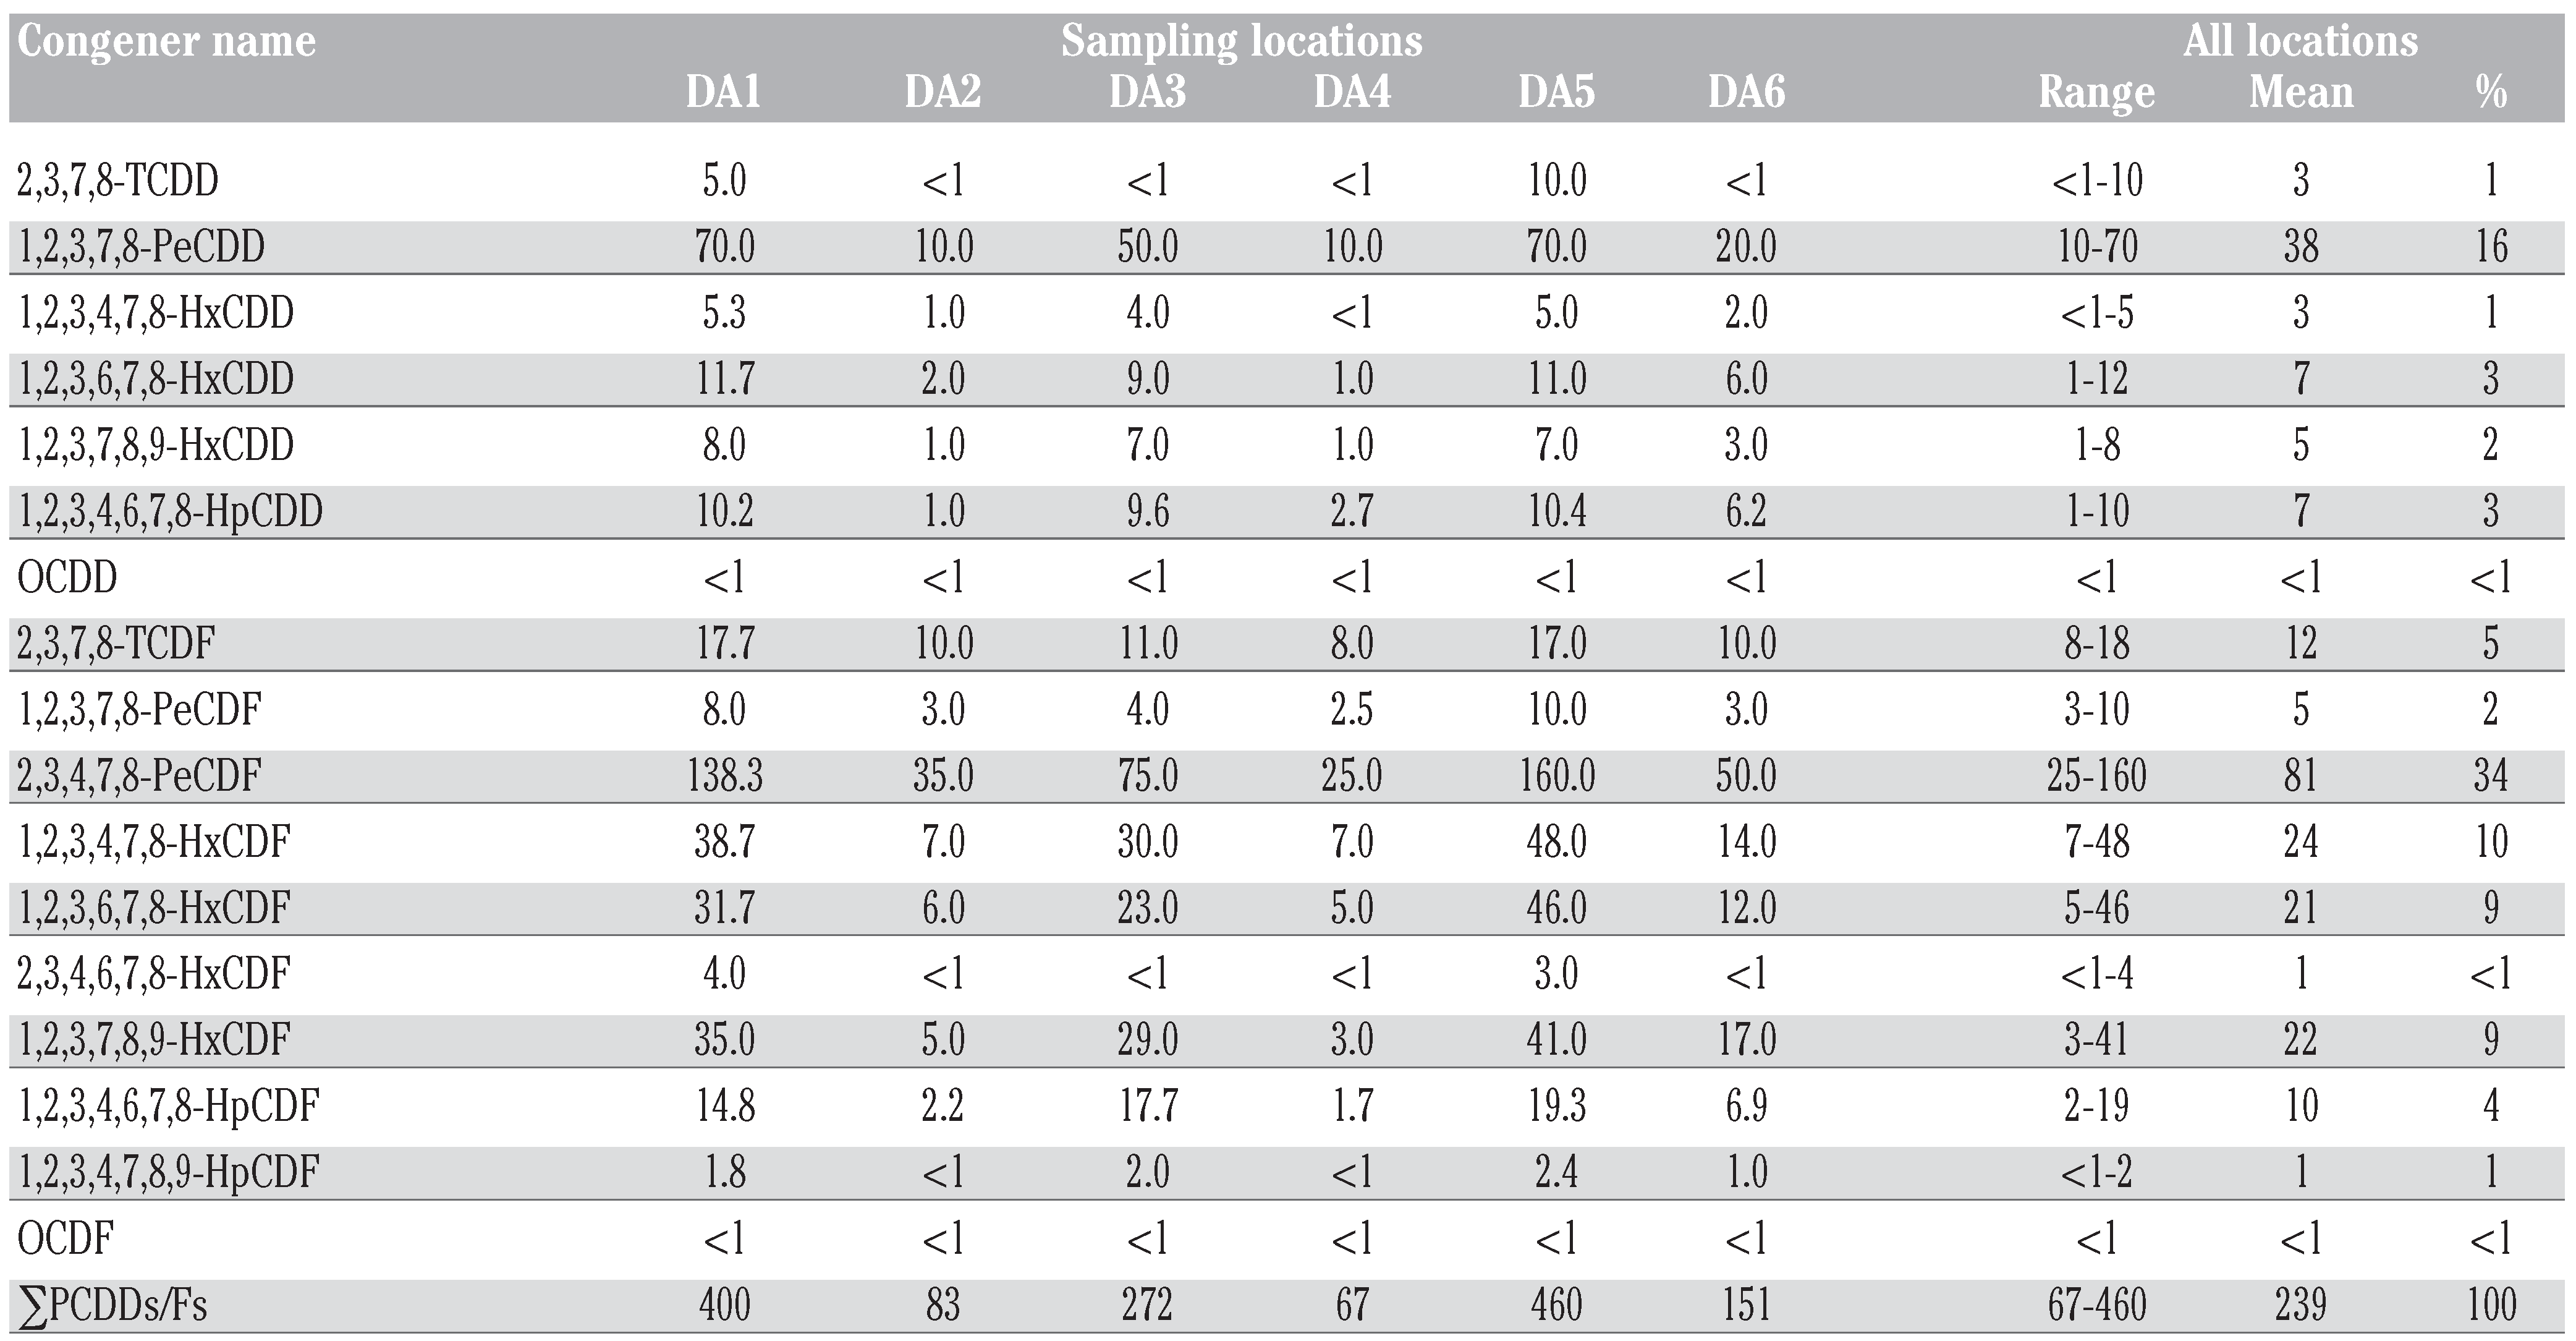
The concentrations of 17 individual PCDD/PCDFs congeners and their I-TEQs in particulate matter (<PM10) of Delhi are presented in Table 1 and Table 2, respectively. The concentrations of ∑PCDD/PCDFs in ambient air in Delhi ranged from 1720-9010 fg m−3 (mean 5559 fg m−3) and their TEQ values ranged between 67 to 460 fg I-TEQ m−3 (average 239 fg I-TEQ m−3).
Congener profiles and group homolog pro-files of native PCDD/Fs in atmospheric particulate matter (<PM10) in Delhi are illustrated in Figure 1 and Figure 2, respectively. The dominant congeners were octachlorinated dibenzo-p-dioxin (OCDD) (31%), 1,2,3,4,6,7,8-hep-tachlorinated dibenzo-p-furans (HpCDF) (19%), octachlorinated dibenzo-p-furans (OCDF) (13%) and 1,2,3,4,6,7,8-heptachlorinated dibenzo-p-dioxin (HpCDD) (12%) and all these together accounted for more than 75% of total native PCDD/PCDFs concentration (Table 1 and Figure 1) and these are all highly chlorinated PCDD/Fs. OCDD had the lowest toxic potency (toxic equivalency factor proposed unternationally, I-TEF=0.0001), thus significantly lowering the total PCDD/F I-TEQ concentration. Similar profiles were obtained for all sampling locations and were found to be characterized by the predominance of OCDD, OCDF, 1,2,3,4,6,7,8-HpCDF and 1,2,3,4,6,7,8-HpCDD in the ambient air. The contributions of these four congeners to the total concentrations of PCDD/Fs were generally high. Considering homologous groups, an increase in the PCDDs concentrations was observed as chlorination level increased (low chlorinated<high chlorinated) (Figure 2). However, PCDF concentration increased with the increase in the degree of chlorination up to hepta-chlorinated. 2,3,4,7,8-pentachlorinated dibenzo-p-furans (34%) and 1,2,3,7,8-pentachlorinated dibenzo-p-dioxin (16%) congeners represent the higher TEQ values which both had high toxic potency (toxic equivalency factor proposed internationally I-TEF=0.5 and 1, respectively) thus significantly increasing the total PCDD/F I-TEQ and accounted for 50% (Table 2). The percent contributions of individual homolog for ∑PCDDs/Fs I-TEQ were in the order of OCDD (31%)>HCDF (21%)>hexachlorodibenzofurans (HxCDF) (13%)=OCDF (13%)>HCDF (12%) and other individual congeners have less than 5% contribution. High chlorinated congeners of PCDD (OCDD and HCDD) and PCDF (HxCDF, HCDF and OCDF) contributed with 43% and 47% for the ∑PCDD/Fs, I-TEQ (Figure 2).

Inhalation risk assessment

Diet ingestion, inhalation and dermal contact are the main pathways of direct exposure to toxic pollutants. Ambient and indoor air are potential sources of inhalation exposure to toxic substances. Adults and children may be exposed to contaminants in ambient air and may also inhale chemicals from various sources. Dioxins are associated strongly with carcinogenesis. To ensure public safety as far as possible, the tolerable daily intake of dioxins has been set by international agencies. The tolerable daily intake (TDI) is the amount of intake per kg of body weight per day of a chemical substance suspected of having adverse health effects when absorbed into the body over a long period of time. Daily dioxin inhalation exposure doses in Delhi for adults and children are computed by the equation after Health Canada [27] (1995) and Agency for Toxic Substances and Disease Registry (ATSDR). [28]
Jox 02 e7 i004
Where EDInh is the inhalation exposure dose in pg I-TEQ kg−1 day−1, IR is inhalation rate (20 m3 day−1 for adults and 12 m3 day−1 for children); Conc is the average air concentration of dioxin in pg I-TEQ m−3; EF is exposure factor and conservatively used as 1 for this study, rep-resenting a daily exposure to the PCDD/Fs; BW is the body weight (70 kg for adults and 27 kg for children).
In our study, the gaseous PCDD/Fs were not determined. Previous studies carried out in Asian countries indicate that the range of rela-tive particle-bound PCDD/Fs concentration is wider [29] i.e. from 36.4% to 71.5%. For the calculation of total TEQ concentration we conservatively used the values of 70% PCDD/Fs in particle and 30% PCDD/Fs in gaseous phase. [30] The total TEQ values thus calculated was 341 fg I-TEQ m−3. The rough estimates of inhalation risk of PCDD/Fs are presented in Table 3 which shows that residents in Delhi have inhalation exposure to PCDD/Fs with 0.098 pg I-TEQ kg−1day−1 for adults and 0.152 pg TEQ kg−1day−1 for children.

Discussion

Concentrations of polychlorinated dibenzo-p-dioxins dibenzo-p-furans

The observed concentrations of PCDDs/Fs in ambient air at were considerably lower than the ambient air standard of 0.6 pg I-TEQ m−3 proposed by Japan [14] and 1.0 pg I-TEQ m−3 expressed as 2,3,7,8-TCDD equivalents in the ambient air in the State of Connecticut in USA. [8] According to Lohmann and Jones, [6] PCDD/F concentrations for the total sum of TEQ are typically as follows: remote <10 fg I-TEQ m−3; rural ~20-50 fg I-TEQ m−3; and urban/industrial ~100-400 fg I-TEQ m−3. Concentrations of PCDDs/Fs observed in Delhi are comparable to those found in other urban areas worldwide. Similar to our results, the concentrations of ∑PCDD/Fs have been reported by other workers. [31,32,33,34] The observed concentrations of ∑PCDD/Fs in this study were higher than those in ambient air of Taiwan, [35] Durban, South Africa, [36] Manizales, Colombia, [37] Porto, Portugal, [38] and selected cities of Hong Kong. [39] However, higher concentrations of ∑PCDD/F in ambient air have been reported in literature. [30,40,41,42,43]
Group homolog distribution of PCDDs/Fs in Delhi was similar to that found by various researchers in the ambient air for other cities in the world. [6,34,35] It is interesting to note that the homologous groups profile found in this study is very similar to that of air borne particulate from Standard Reference Material (SRM-1649) of National Institute Standards and Technology. [44]
During many chemical reactions it has been found that PCDDs and PCDFs are formed as unwanted by-products. Another important primary source of PCDDs and PCDFs are combustion processes that involve burning of chlorinated organic or inorganic compounds resulting in the formation of PCDDs and PCDFs. Of special importance are the incinerations of various types of wastes, such as municipal, hospital and hazardous wastes, and the production of iron and steel and other metals (copper, magnesium, nickel). [45] In general, the ratio of ∑PCDD/∑PCDF was previously reported to be a good indicator for possible formation processes or emission sources of the PCDD/Fs. [46] The ratio of ∑PCDD/∑PCDF from chemical reaction formation is greater than 1, while de no o synthesis during combustion processes normally shows a ratio of ∑PCDD/∑PCDF less than 1. [30,31] In this study, the ratio of ∑PCDD/∑PCDF varies from 0.66 to 1.77 (average 1.10) (Table 1). In addition to the observation from the SPCDDs/S PCDFs ratio, the TEQs for PCDFs were 2-3 times higher than those for PCDDs. In our study, PCDFs were the major contributors to the TEQs in the atmospheric particles at different locations in Delhi. This is in agreement with data reported for particle-bound PCDD/Fs. [5] The characteristics of the profiles and ∑PCDD/∑PCDF ratios suggest the reaction processes are driven from precursors as well as by de no o synthesis during combustions. The homolog profiles at sampling locations DA1, DA3 and DA5 were enriched in PCDFs, and can, therefore, be classified as source profiles,47 meaning that the source for the homologs at these locations were not far away. Therefore, it indicates that de no o synthesis could be the main formation mechanism for the sources of the PCDD/PCDFs in the ambient air of Delhi, India, which could be highly influenced by anthropogenic activities like combustion sources such as small diffuse combustion sources, e.g. domestic burning of fossil fuels, traffic, non-industrial combustion and uncontrolled open mass burning.

Inhalation risk assessment

The Joint FAO/WHO Expert Committee on Food Additives [10] recommended a TDI for dioxin as 1.0 pg I-TEQ kg−1 d-1 and a warning value of 4.0 pg I-TEQ kg−1 d-1 or 70 pg to 280 pg day−1 for 70 kg adult. The USEPA [8] recommends that the daily inhalation exposure to dioxins should not exceed 1.0 pg WHO98-TEQ kg−1 d-1. The ATSDR48 assessed the non-cancer risks from dioxin exposure by setting minimal risk levels (MRLs) for acute sub-chronic and chronic exposures to dioxins, and the chronic MRL was set at 1 pg kg−1 d-1. The Scientific Committee for Food of the European Commission [11] set a tolerable weekly intake of 14 pg WHO-TEQ/kg body weight for dioxins and 12 dioxin-like PCBs. In 1999, Japan13 established the TDI of dioxins at 4 pg-TEQ kg−1 d-1.
Table 3 shows that residents of Delhi seem to have a low health risk from exposure to PCDD/Fs. However, the most significant uptake route of dioxins and furans is via the diet. Almost 95% of TDI is taken up by food contamination. Inhalation intake doses have been reported to contribute approximately 1-2% to the total daily intake. [13,32] Due to lack of data about PCDD/F diet exposure we cannot give precise total daily dioxin intake. However, according to our inhalation results, we can conclude that the TDIs of dioxins for the residents of Delhi, India were extremely low.

Conclusions

The concentrations of PCDD/PCDFs in ambient air in Delhi were lower than the ambient air standard stipulated by various environmental agencies. Rough estimated TDIs of inhalable PCDD/Fs for residents in Delhi are very low. Suggested sources could be anthropogenic activities of small diffuse combustions, e.g. domestic burning of fossil fuels, traffic, non-industrial combustion and uncontrolled open mass burning. The current data are still not sufficient to allow us to draw any concrete conclusions concerning the situation in Delhi and other Indian cities. More monitoring programs and studies on PCDD/Fs are required.

Author Contributions

BK, data processing and compilation, statistical analysis and manuscript preparation; BK, SKS, RBL, sample processing and analysis; SK, technical guidance during manuscript preparation; CSS, overall planning and guidance.

Acknowledgments

The authors express their sincere gratitude to the Member Secretary and Chairman of Central Pollution Control Board, Ministry of Environment and Forest Government of India for approval and support to conduct the study. The Authors thank ASEM-GTZ, Germany for sponsoring the training program at the Fraunhofer-Institute for Process Engineering and Packaging, Freising, Germany and the Bavarian Environment Agency, Augsburg, Germany. The assistance received from various officials of these agencies is gratefully acknowledged.

Conflicts of Interest

The authors declare no potential conflict of interests.

References

  1. Hagenmaier, H.; Linding, C.; She, J. Correlation of environmental occurrence of polychlorinated dibenzo-p-dioxins and dibenzo-p-furans with possible sources. Chemosphere 1994, 29, 2163–2174. [Google Scholar] [CrossRef]
  2. Rappe, C. Dioxins patterns and source identification. Fresenius J Anal Chem 1994, 348, 63–75. [Google Scholar] [CrossRef]
  3. Fiedler, H. Sources of PCDD/PCDF and impact on environment. Chemosphere 1996, 32, 55–64. [Google Scholar] [CrossRef] [PubMed]
  4. Baker JI and Hites, R.A. Polychlorinated dibenzo-p-dioxins and dibenzofurans in the remote North Atlantic marine atmosphere. Environ Sci Tech 1999, 33, 14–20. [Google Scholar] [CrossRef]
  5. Chao, M.R.; Hua, C.W.; Mac, H.W.; Chang, G.-P.C.; Lee, W.J.; Chang, L.W.; et al. Size distribution of particle-bound polychlorinated dibenzo-p-dioxins and dibenzofurans in the ambient air of a municipal incinerator. Atmos Environ 2003, 37, 4945–4954. [Google Scholar] [CrossRef]
  6. Lohmann, R.; Jones K, C. Dioxins and furans in air and deposition: a review of levels behavior and processes. Sci Total Environ 1998, 33, 4440–4447. [Google Scholar] [CrossRef]
  7. Kaupp, H.; Towara, J.; Mclachlan, M.S. Distribution of polychlorinated dibenzo-p- dioxins and dibenzofurans in atmospheric particulate matter with respect to particlesize. Atmos Environ 1994, 28, 585–593. [Google Scholar] [CrossRef]
  8. US Environmental Protection Agency (USEPA). Feasibility of environmental monitoring and exposure assessment for a municipal waste combustor: Rutland Vermont pilot study EPA/600/891/007 PB91-181917; USEPA: Cincinnati, OH, USA, 1991. [Google Scholar]
  9. Van Leeuwen, F.X.R.; Feeley, M.; Schrenk, D.; Larsen, J.C.; Farland, W.; et al. Dioxins WHOs tolerable daily intake (TDI) revisited. Chemosphere 2000, 40, 1095–1101. [Google Scholar] [CrossRef]
  10. Joint FAO/WHO Expert Committee on Food Additives. Evaluation of certain food additives and contaminants (57th report of the Joint FAO/WHO Expert Committee on Food Additives). WHO Tech Rep Series 2001, 909, 139–146. [Google Scholar]
  11. European Commission Regulation (EC). No 199/2006, Setting maximum levels for certain contaminants in foodstuffs as regards dioxins and dioxin-like PCBs. Off J European Union 2006, 2, 4. [Google Scholar]
  12. Van den Berg, M.; Birnbaum, L.S.; Denison, M.; De Vito, M.; Faland, W.; Feeley, M.; et al. The 2005 World Health Organization re-evaluation of human and mammalian toxic equivalency factors for dioxins and dioxin-like compounds. Toxicolo Sci 2006, 93, 223–241. [Google Scholar] [CrossRef] [PubMed]
  13. Government of Japan. Brochure Dioxin Office of Dioxins Control Environmental Management Bureau Government of Japan. Available online: http://www.env.go.jp/en/chemi/dioxins/brochure2009.pdf.
  14. Government of Japan. Environmental Quality Standards in Japan-Air Quality. 2012. Available online: http://www.env.go.jp/en/.
  15. Thacker, N.; Nitnaware, V.C.; Das, S.K.; Devotta, S. Dioxin formation in pulp and paper mills from Indi. Environ Sci Pollut Res 2007, 14, 225–226. [Google Scholar] [CrossRef] [PubMed]
  16. Kumar, B.; Kumar, S.; Lal, R.B.; Prakash, D.; Pathak, A.; Sharma, C.S.; et al. Emission levels of polychlorinated dibenzodioxins and dibenzofurans (PCDDs/PCDFs) from waste incinerators in India. Organohalogen Compounds 2009, 71, 194–197. [Google Scholar]
  17. Senthil Kumar, K.; Kannan, K.; Paramsivan, O.N.; Shanmugasundaram, V.P.; Nakanishi, J.; Giesy, J.P.; et al. PCDDs PCDFs and dioxin-like PCBs in human and wildlife samples from India. Environ Sci Technol 2001, 35, 3448–3455. [Google Scholar] [CrossRef]
  18. Watanabe, M.X.; Iwata, H.; Watanabe, M.; Tanabe, S.; Yoneda, K.; Hashimoto, T. Bioaccumulation of organochlorines in crows from an Indian open dumping site: evidence for direct transfer of dioxin-like congeners from the contaminated soil. Environ Sci Technol 2005, 39, 4421–4430. [Google Scholar] [CrossRef]
  19. Min, N.H.; Min, T.B.; Watanabe, M.; Kuniuse, T.; Monirith, I.; Tanabe, S.; et al. Open dumping sites in Asian developing countries: A potential sources of polychlorinated Dibenzo-p-dioxins and polychlorinated dibenzofurans. Environ Sci Technol 2003, 37, 1493–1502. [Google Scholar] [CrossRef]
  20. Kunisue, T.; Watanabe, M.; Iwata, H.; Subramanian, A.; Monirith, I.; Minh, T.B.; et al. Dioxins and related compounds in human breast milk collected around open dumping sites in Asian developing countries: bovine milk as a potential source. Arch Environ Contam Toxicol 2004, 47, 414–426. [Google Scholar] [CrossRef]
  21. Lal, R.B.; Kumar, S.; Kumar, B.; Sharma, C.S.; Makhijani, S.D.; Kamyotra, J.S.; et al. Air borne particulate bound polychlorinated dibenzodioxins and dibenzofurans (PCDDs/Fs) levels in Delhi India. Organo halogen Compounds 2009, 71, 190–193. [Google Scholar]
  22. Kumar, S.; Lal, R.B.; Kumar, B.; Sharma, C.S.; Makhijani, S.D.; Kamyotra, J.S.; et al. Identifying the contributing sources of PCDDs/PCDFs by comparison of congener distribution profiles observed in respirable suspended particulate matter sampled from ambient air of Delhi. Organohalogen Compounds 2009, 71, 183–186. [Google Scholar]
  23. Kumar, B.; Kumar, S.; Gaur, R.; Goel, G.; Chakraborty, P.; Sajwan, K.S.; Sharma, C.S. Polychlorinated dibenzo dioxins (PCDDs) and furans (PCDFs) in contaminated soil sewage sludge paper mill sludge and flyash. Organohalogen Compounds 2011, 73, 1842–1846. [Google Scholar]
  24. SC (Stockholm Convention). National Implementation Plan for POPs, India. 2012. Available online: www.pops.int/.
  25. EN. Part 2: Extraction & cleanup European Committee for Standardization. 1996, 1948.
  26. NATO/CCMS. International toxicity equivalency factor (I-TEF). Report No 176; North Atlantic Treaty Organization Committee, 1988. [Google Scholar]
  27. Health Canada. A handbook of exposure calculations. 1995. Available online: http://publications.gc.ca/collections/Collection/H49-96-1-1995E-3.pdf.
  28. Agency for Toxic Substances and Disease Registry (ATSDR). Public Health Assessment Guidance Manual (2005 Update). Atlanta GA: Agency for Toxic Substances and Disease Registry. 2005. Available online: http://www.atsdr.cdc.gov/hac/PHAManual/toc.html.
  29. Hayakawa, K.; Takatsuki, H.; Watanabe, I.; Sakai, S.I. Polybrominated diphenyl ethers (PBDEs) polybrominated dibenzo-p-dioxins/dibenzofurans (PBDD/Fs) and mono-bromopolychlorinated dibenzo-p-dioxins/ dibenzofurans (MoBPXDD/Fs) in the atmosphere and bulk deposition in Kyoto Japan. Chemosphere 2004, 57, 343–356. [Google Scholar] [CrossRef] [PubMed]
  30. Yu, L.; Mai, B.; Meng, X.; Bi, X.; Sheng, G.; Fu, J.; Peng, P. Particle-bound polychlorinated dibenzo-p-dioxins and dibenzofurans in the atmosphere of Guangzhou China. Atmos Environ 2006, 40, 96–108. [Google Scholar] [CrossRef]
  31. Ren, Z.; Zhang, B.; Lu, P.; Li, C.; Gao, L.; Zheng, M. Characteristics of air pollution by polychlorinated dibenzo-p-dioxins and dibenzofurans in the typical industrial areas of Tangshan City China. J Environ Sci 2011, 23, 228–235. [Google Scholar] [CrossRef] [PubMed]
  32. Li, H.R.; Yu, L.P.; Sheng, G.; Fu, J.M.; Peng, P.A. Severe PCDD/F and PBDD/F pollution in air around an electronic waste dismantling area in China. Environ Sci Technol 2007, 41, 5641–5646. [Google Scholar] [CrossRef]
  33. Chang, M.B.; Weng, Y.M.; Lee, T.Y.; Chen, Y.W.; Chang, S.H.; Chi, K.H. Sampling and analysis of ambient dioxins in northern Taiwan. Chemosphere 2003, 51, 1103–1110. [Google Scholar] [CrossRef]
  34. Sin, D.W.M.; Choi, J.Y.Y.; Louie, P.K.K. A study of polychlorinated dibenzo-p-dioxins and dibenzofurans in the atmosphere of Hong Kong. Chemosphere 2002, 47, 647–653. [Google Scholar]
  35. Lee, W.S.; Chang, G.P.; Wang, L.C.; Lee, W.J.; Tsai, P.J.; Wu, K.Y.; et al. Source identification of PCDD/Fs for various atmospheric environments in a highly industrialized city. Environ Sci Technol 2004, 38, 4937–4944. [Google Scholar] [CrossRef]
  36. Batterman, S.; Chernyak, S.; Gounden, Y.; Matooane, M. Concentrations of persistant organic pollutants in ambient air in Durban South Africa. Report No.: CSIR/NRE/PW/EXP/2007/0021/A. 2007. Available online: http://researchspace.csir.co.za/dspace/bitstream/10204/947/1/Batter man_2006_d.pdf.
  37. Aristizabal, B.H.; Gonzalez, C.M.; Morales, L.; Abalos, M.; Abad, E. Polychlorinated dibenzo-p-dioxin and dibenzofuran in urban air of an Andean city. Chemosphere 2011, 85, 70–78. [Google Scholar] [CrossRef]
  38. Coutinho, M.; Pereira, M.; Rodrigues, R.; Borrego, C. Impact of medical waste incineration in the atmospheric PCDD/F levels of Porto Portugal. Sci Total Environ 2006, 362, 157–165. [Google Scholar] [CrossRef]
  39. Choi, M.P.K.; Ho, S.K.M.; So, B.K.L.; Cai, Z.; Lau, A.K.H.; Wong, M.H. PCDD/F and dioxin-like PCB in Hong Kong air in relation to their regional transport in the Pearl River Delta region. Chemosphere 2008, 71, 211–218. [Google Scholar] [CrossRef]
  40. de Assuncao, J.V.; Pesquero, C.R.; Bruns, R.; Lilian, E.; Carvalho, R.F. Dioxins and furans in the atmosphere of Sao Paulo City Brazil. Chemosphere 2005, 58, 1391–1398. [Google Scholar] [CrossRef] [PubMed]
  41. Li, Y.M.; Jiang, G.; Wang, Y.; Wang, P.; Zhang, Q. Concentrations Profiles and Gas-particle partitioning of PCDD/Fs PCBs and PBDEs in the ambient air of an E-waste dismantling area southeast China. Chinese Sci Bullet 2008, 53, 521–528. [Google Scholar] [CrossRef]
  42. Deng, Y.; Peng, P.; Ren, M.; Song, J.; Huang, W. The winter effect on formation of PCDD/Fs in Guangzhou by vehicles: A tunnel study. Atmos Environ 2011, 45, 2541–2548. [Google Scholar] [CrossRef]
  43. Wen, S.; Gong, Y.; Li, J.; Shi, T.; Zhao, Y.; Wu, Y. Particle-bound PCDD/Fs in the atmosphere of an electronic waste dismantling area in china. Biomed Environ Sci 2011, 24, 102 11. [Google Scholar]
  44. Bacher, R.; Swerev, M.; Ballschmiter, K. Profile and pattern of monochlorothough octachlorodibenzodioxins and -dibenzofurans in chimney deposits from wood burning. Environ Sci Technol 1992, 26, 1649–1655. [Google Scholar] [CrossRef]
  45. Rappe, C. Sources and environmental concentrations of dioxins and related compounds. Pure Appl Chem 1996, 68, 1781–1789. [Google Scholar] [CrossRef]
  46. Lohmann, R.; Green, N.J.L.; Jones, K.C. Detailed studies of the factors controlling atmospheric PCDD/F concentrations. Environ Sci Technol 1999, 33, 4440–4447. [Google Scholar] [CrossRef]
  47. Wagrowski, D.M.; Hites, R.A. Insights into the global distribution of polychlorinated dibenzo-p-dioxins and dibenzofurans. Environ Sci Technol 2000, 34, 2952–2958. [Google Scholar] [CrossRef]
  48. Agency for Toxic Substances and Disease Registry (ATSDR). Toxicity Profile for Chlorinated Dibenzo-p-Dioxins (update); US Department of Health and Humans Services: Atlanta, GA, USA, 1998. [Google Scholar]
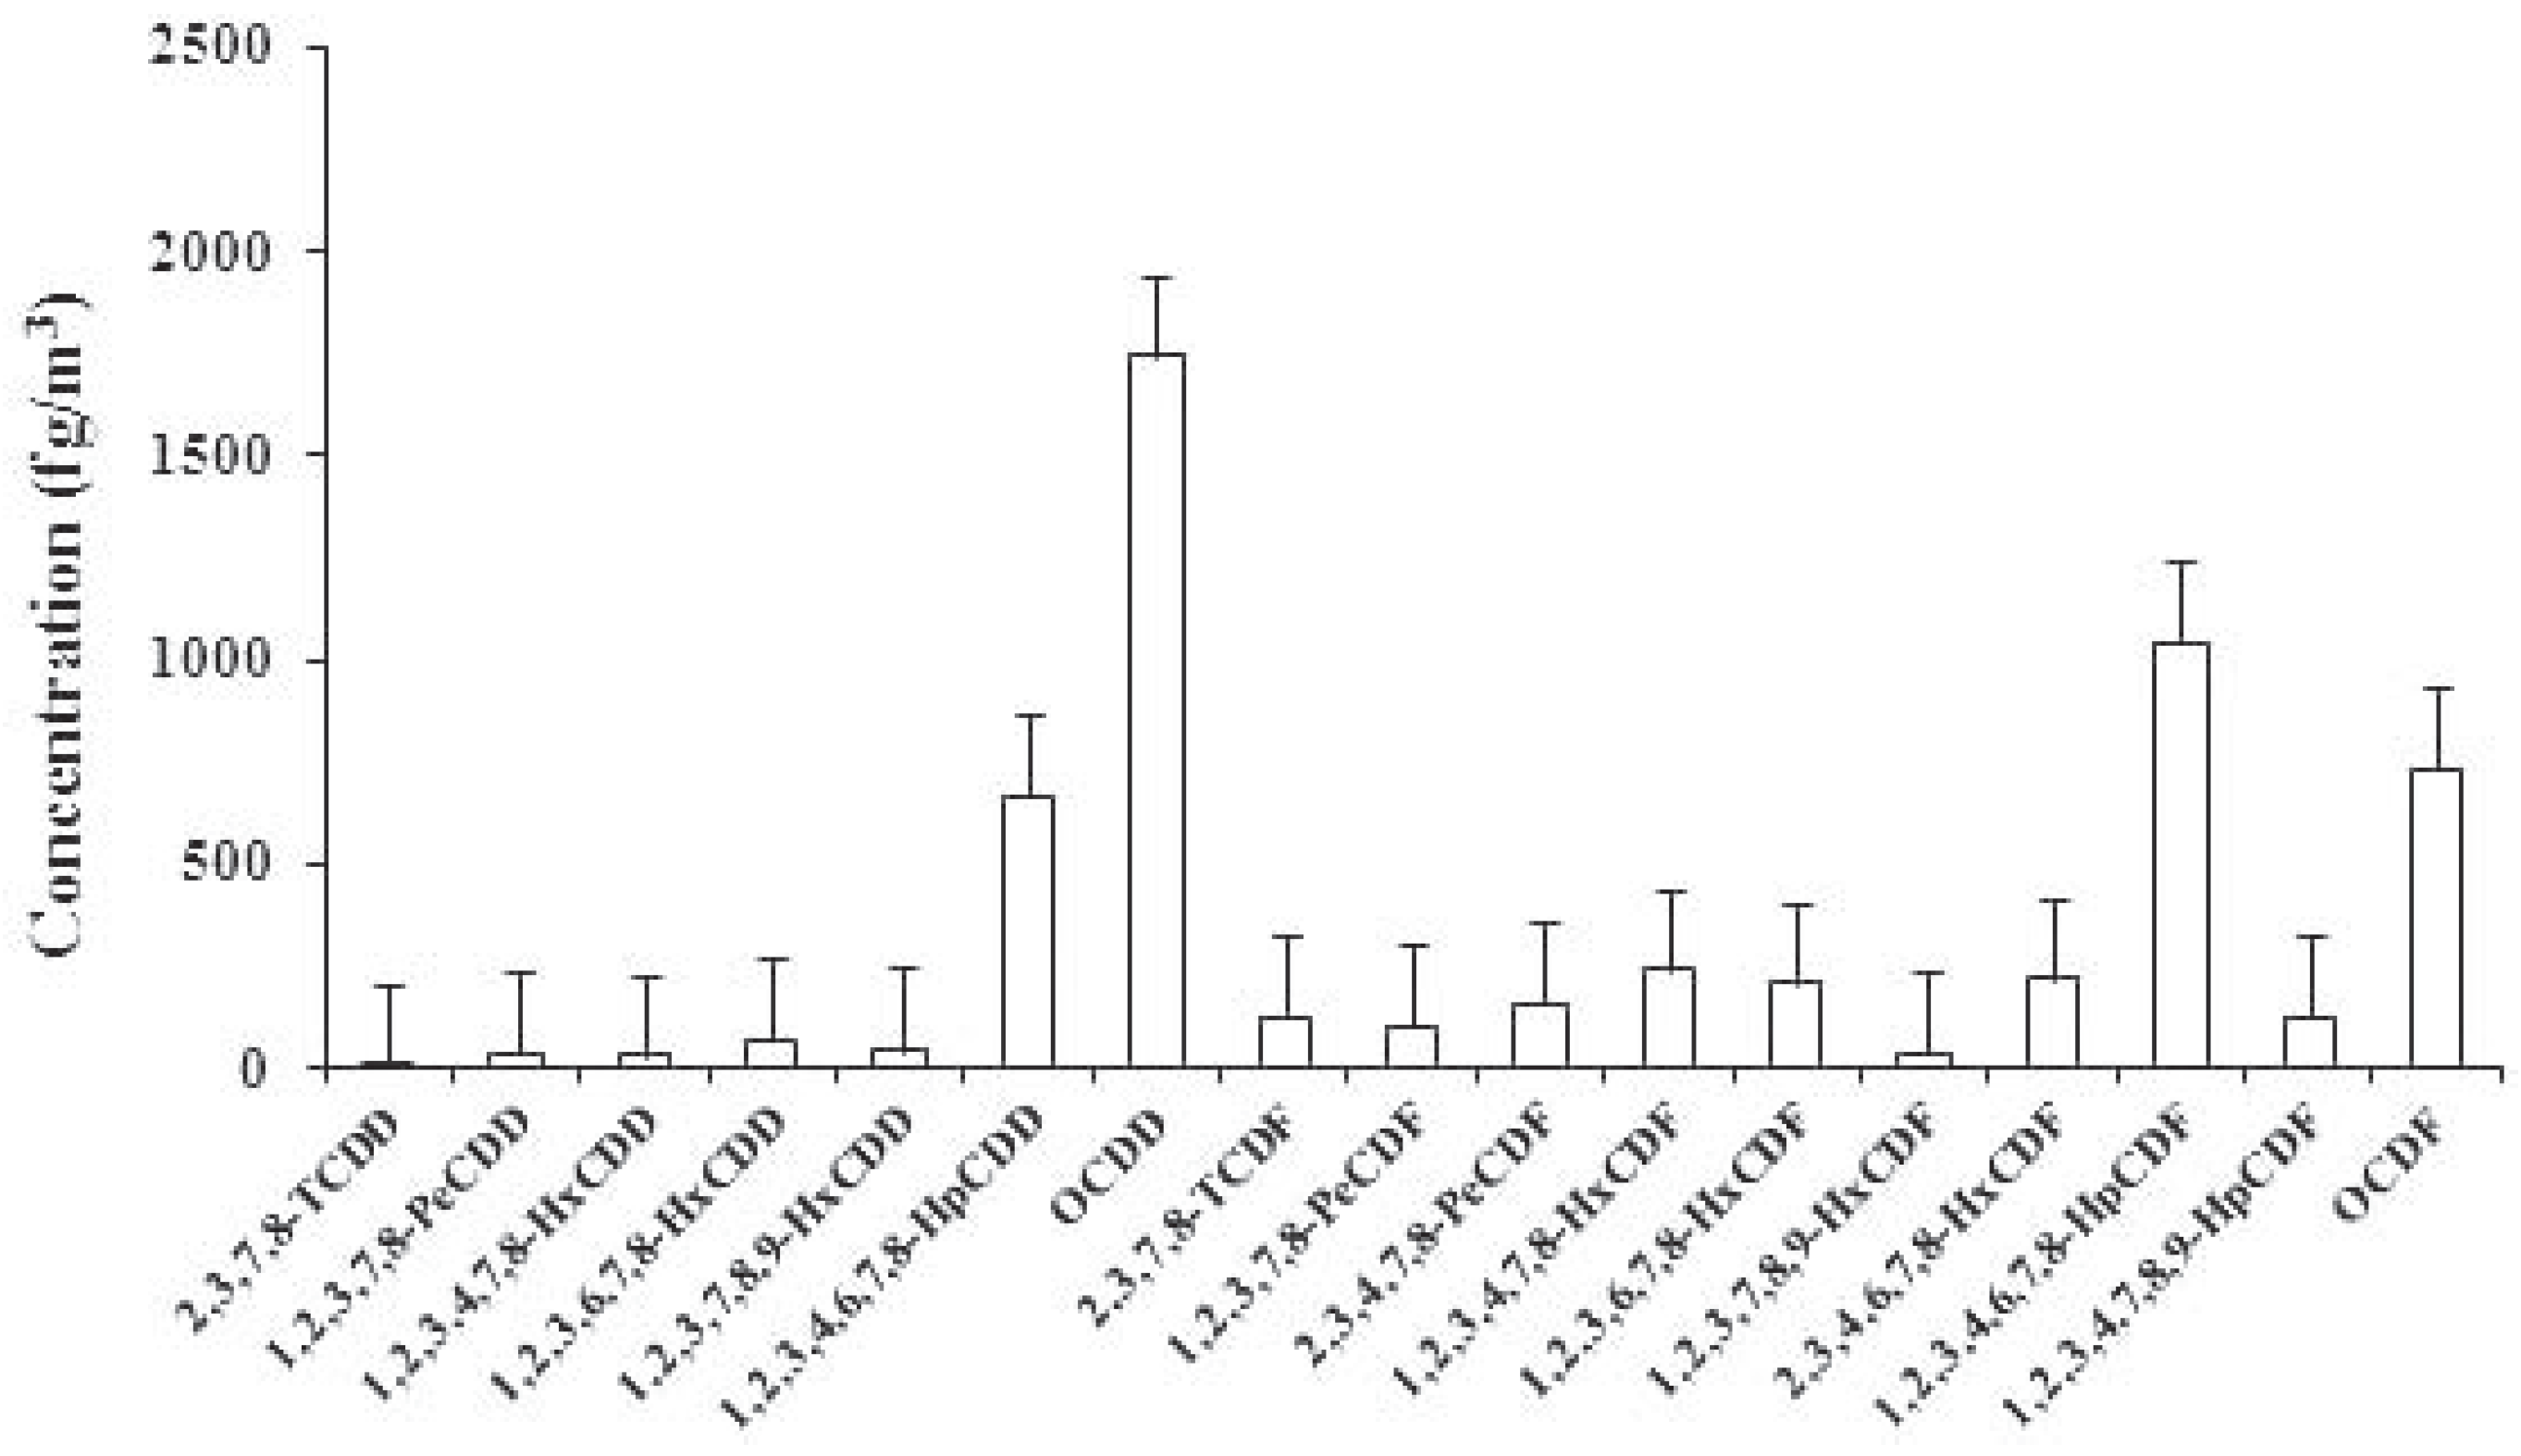
Figure 1. Concentration profiles of polychlorinated dibenzo-p-dioxin/dibenzo-p-furans congener in ambient air (PM10) in Delhi.
Jox 02 e7 g001
Figure 2. Percent of native polychlorinated dibenzo-p-dioxin/dibenzo-p-furans homologues in ambient air (PM10) in Delhi.
Jox 02 e7 g002
Table 1. Concentration of polychlorinated dibenzo-p-dioxins/dibenzo-p-furans (fg m−3) in ambient air (PM10) in Delhi.
Jox 02 e7 i001
PCDDs, polychlorinated dibenzo-p-dioxins; PCDFs, polychlorinated dibenzo-p-furans; TCDD, tetrachlorinated dibenzo-p-dioxin; HpCDF, heptachlorinated dibenzo-p-furans; HpCDD, heptachlorinated dibenzo-p-dioxin; PeCDF, pentachlorinated dibenzo-p-furans; PeCDD, pentachlorinated dibenzo-p-dioxin; HxCDF, hexachlorodibenzofurans.
Table 2. Toxic equivalent quantities (TEQ) of polychlorinated dibenzo-p-dioxins/dibenzo-p-furans (fg I-TEQ m−3) in ambient air (PM10) in Delhi.
Jox 02 e7 i002
PCDDs, polychlorinated dibenzo-p-dioxins; PCDFs, polychlorinated dibenzo-p-furans; TCDD, tetrachlorinated dibenzo-p-dioxin; HpCDF, heptachlorinated dibenzo-p-furans; HpCDD, heptachlorinated dibenzo-p-dioxin; PeCDF, pentachlorinated dibenzo-p-furans; PeCDD, pentachlorinated dibenzo-p-dioxin; HxCDF, hexachlorodibenzofurans.
Table 3. Rough assessment of inhalation risk (pg I-toxic equivalent quantities kg−1 day−1) of polychlorinated dibenzo-p-dioxins/Fs in Delhi.
Jox 02 e7 i003
PCDDs/Fs, polychlorinated dibenzo-p-dioxins/dibenzo-p-furans; TEQ, toxic equivalent quantities. *Gaseous PCDD/Fs are conservatively estimated as 30% of the total PCDD/Fs.