Next Article in Journal
Congener Specific Distribution of Polychlorinated Dibenzo-p-Dioxins and Dibenzo-p-Furans in Ambient Air Particulates (<PM10) in Delhi, India

Previous Article in Journal
Diazinon Mediated Biochemical Changes in the African Toad (Bufo regularis)
 
 
Journal of Xenobiotics is published by MDPI from Volume 10 Issue 1 (2020). Previous articles were published by another publisher in Open Access under a CC-BY (or CC-BY-NC-ND) licence, and they are hosted by MDPI on mdpi.com as a courtesy and upon agreement with PAGEPress.
Article

Assessment of Polychlorinated Biphenyls and Organochlorine Pesticides in Water Samples from the Yamuna River

by
Bhupander Kumar
*,
Satish Kumar Singh
,
Meenu Mishra
,
Sanjay Kumar
and
Chandra Shekhar Sharma
National Reference Trace Organics Laboratory, Central Pollution Control Board, East Arjun Nagar Delhi, India
*
Author to whom correspondence should be addressed.
J. Xenobiot. 2012, 2(1), e6; https://doi.org/10.4081/xeno.2012.e6
Submission received: 16 March 2012 / Revised: 3 May 2012 / Accepted: 3 May 2012 / Published: 31 July 2012

Abstract

:
Polychlorinated biphenyls (PCBs), hexachlorocyclohexane (HCH) and dichlorodiphenyltrichloroethane (DDT) are toxic, persistent and bioaccumulative long-range atmospheric transport pollutants. These are transported worldwide affecting remote regions far from their original sources, and can transfer into food webs with a wide range of acute and chronic health effects. India ratified the Stockholm Convention with the intention of reducing and eliminating persistent organic pollutants (POPs), and encouraged the support of research on POPs. Despite the ban and restriction on the use of these chemicals in India, their contamination of air, water, sediment, biota and humans has been reported. In this study, surface water samples were collected during January 2012 from the Yamuna River in Delhi, India, and analyzed for PCBs and organochlorine pesticides (OCPs). The concentrations of ΣPCBs and ΣOCPs ranged between 2-779 ng L–1 and from less than 0.1 to 618 ng L–1 (mean 99±38 ng L–1 and 221±50 ng L–1, respectively). The PCB homolog was dominated by 3-4 chlorinated biphenyls. In calculating the toxicity equivalent of dioxin-like PCBs (dl-PCBs)using World Health Organization toxic equivalency factors, dl-PCBs accounted for 10% of a total of 27 PCBs. The concentration of ΣHCH ranged between less than 0.1 and 285 ng L–1 (mean 151±32 ng L–1). However, ΣDDTs concentrations varied between less than 0.1 and 354 ng L–1 (mean 83±26 ng L–1). The concentrations were lower than the US guideline values; however, levels of lindane exceeded those recommended in guidelines. Further in-depth study is proposed to determine the bioaccumulation of these pollutants through aquatic biota to assess the risk of contaminants to human health.

Introduction

Polychlorinated biphenyls (PCBs), hexachlorocyclohexane (HCH) and dichlorodiphenyltrichloroethane (DDT) are ubiquitous chemicals which are persistent, toxic and bioaccumulative in nature and are found in all environments of the earth.[1,2] In 2004, the Stockholm Convention listed DDTs and PCBs as persistent organic pollutants (POPs) and α-HCH, β-HCH, and γ-HCH (lindane) were added to the list in 2009.[3] These compounds enter aquatic environments through, for example, effluent release, atmospheric deposition, and runoff. They can be transferred into food webs and, finally, accumulated in aquatic organisms.[4] For the past decades, there has been growing concern about the presence of these POPs in the environment and their threat to biological life. These are long-range atmospheric transport pollutants affecting regions far from their original sources, even in regions of the Arctic[5] and Antarctic.[6,7] Persistent organic pollutants have a wide range of effects on human health, such as carcinogenicity, nervous and reproductive disorders, and are also suspected to be hormonal disruptors.[8]
India actively participated in the International Negotiation Committee meetings leading to the drafting and acceptance of the Stockholm Convention. The Convention was adopted in May 2001 and came into force on 17th May 2004. India ratified the Convention on 13th January 2006 and it came into force on 12th April 2006. As a party to the Convention, India is obliged to abide by the objectives of the treaty with the intention of reducing and ultimately eliminating POPs, and encouraged to conduct research on POPs.
In earlier studies, PCBs, DDT and HCH contaminations with various matrices have been reported in India, including water,[9,10,11] soils,[2,12,13] sediments,[9,14,15,16,17] atmospheric air,[18,19,20] and biological samples, including those from humans.[21,22] This study focused on assessment of HCHs, DDTs and PCBs, including dioxinlike PCBs (dl-PCBs) in water samples from the Delhi stretch of the Yamuna River, India.

Materials and Methods

Description of study area

The River Yamuna, a major tributary of the River Ganges, originates from the Yamunotri glacier of the lower Himalayas and enters Delhi near the village of Palla after a journey of approximately 224 km. Delhi is the administrative capital city of India with a population of approximately 18 million and a total area of 1483 km2. It lies between 28° 36’ 36” N and 77° 13’ 48” E on the banks of the River Yamuna. There is a barrage at Wazirabad that supplies drinking water to Delhi accounting for more than 70% of overall water supply. Generally, no water is allowed to flow beyond the Wazirabad barrage in the dry season as the available water is not adequate to satisfy the demand for water to serve Delhi. Whatever water flows downstream of the Wazirabad barrage is the untreated or partially treated domestic and industrial wastewater that enters the river through several drains. Delhi alone generates 1900 million liters per day of sewage and available water treatment facilities are not adequate to remove all the pollutants. Consequently, untreated and partially treated sewage laden with the city’s biological and chemical wastes enters the river every day.[23] The Okhla barrage lies twenty-two kilometers downstream of the Wazirabad barrage and, here again, water is not allowed to flow through this barrage during the dry season. The total catchment area of the Delhi stretch of the Yamuna River is approximately 1485 km2.

Sample collection

Sampling was carried out at the 12 pre-determined sampling stations on the Yamuna River in Delhi extending between Palla and Okhla (Figure 1). Water samples in duplicates were collected in amber glass bottles during January 2012. Amber glass sampling bottles (1 L) were washed successively with detergent and tap water and then distilled water before sample collecting. Surface water samples were collected using a stainless steel bucket and transferred to sampling bottles. The glass bottles were filled to the top with the sample water to eliminate air bubbles. After appropriate labeling, the sample bottles were transported on ice to the laboratory and stored at 4°C followed by an extraction within seven days.

Chemicals and solvents

Chemicals and solvents were purchased from Merck, India. Silica gel 60 (0.063-0.100 mm) was from Sigma-Aldrich (St. Louis, MO, USA). Prior to use, silica gel and anhydrous sodium sulphate was cleaned separately with methanol dichloromethane and acetone in a Soxhlet extractor for 8 h each and stored air tight at 130°C. Certified reference standards were available for organochlorine pesticides (OCPs) and PCBs purchased from Sigma-Aldrich and from Dr. Ehrenstorfer (GmbH, Augsburg, Germany), respectively.

Sample extraction and cleanup

Samples were extracted, purified and analyzed according to the methods established by the US Environmental Protection Agency.[24] Briefly, a 1 L water sample was extracted three times with dichloromethane. The dichloromethane extract (lower layer) was drained into a funnel containing 5 cm of anhydrous sodium sulphate. The dichloromethane extract was then evaporated to 2-3 mL on the rotary vacuum evaporator (Eyela, Japan). Extracts were cleaned using silica gel column chromatography consisting of 2 cm of anhydrous sodium sulphate (approx. 2.0 g) overlaid with 10 cm of activated silica gel (approx. 10.0 g) and topped with another 2 cm of anhydrous sodium sulphate. Once the column was prerinsed with 30 mL of hexane, the sample was added and then a 50 mL mixture of hexane and dichloromethane (1:1 v/v). The eluted extract was concentrated using a rotatory vacuum evaporator and TurboVap (Caliper, Hopkinton, MA, USA) under a gentle stream of pure nitrogen and solvent-exchanged into hexane to 1.0 mL. The extract was transferred to auto sampler vial for quantification by gas chromatograph equipped with an electron capture detector (GC-ECD).

Instrumental analysis

In the present study, 4 DDT isomers, 4 HCH isomers and 27 congeners of PCBs were analyzed. Separation and quantification of pesticides was carried out using a gas chromatograph (Perkin Elmer, Clarus 500, Waltham, MA, USA) equipped with an Electron Capture Detector (ECD, 63Ni), on a fused silica capillary column 25 m×0.20 mm i.d. 0.33 μm film (Elite–1). The column oven temperature was initially maintained at 170°C and programmed to 220°C (7oC min–1) and again taken to 250°C at 5°C min–1 and held for 6.86 min. The injector and detector temperature were maintained at 250°C and 350oC, respectively. Purified nitrogen gas was used as carrier at the flow rate of 1.0 mL min–1. The separation and quantification of PCBs was performed by GC-ECD (Shimadzu 2010, Japan), on fused silica capillary column (HP-5MS, Agilent) 60 m×0.25 mm×0.25 μm film. The temperature program of the column oven was set at 170° C for 1 min then increased by 3°C min–1 to 270°C, kept for 1 min, then further increased by 10°C min–1 to 290°C, and maintained for 3 min. The injector and detector temperatures were maintained at 225°C and 300°C, respectively. Purified nitrogen gas was used as carrier at a flow rate of 1.0 mL min–1.

Quality assurance/quality control

Certified reference standards from Dr. Ehrenstorfer and Sigma-Aldrich were used for the instrument calibration and quantification of PCBs and pesticides, respectively. The target analytes were identified in the sample extract by comparing the accurate retention time from the standard mixture, and quantified using the response factors from five level calibration curves of the standards. Appropriate quality assurance quality control analysis was performed including analysis of procedural blanks (analyte concentrations were <MDL, method detection limit), random duplicate samples (standard deviation <5), and calibration curves with the r2 value of 0.999.
The instrument detection limits were established by using 3:1 signal to noise ratio to determine a peak as a valid quantifiable peak. Each sample was analyzed in duplicate and the average was used in analytical calculations. Calculated concentrations were reported as less than the limit of detection if the peak area did not exceed the specified threshold (three times the noise). Concentrations below the limit of detection were assigned zero values for the statistical analysis. Method detection limits were established by processing eight aliquots of a sample spiked with a quantity sufficient to produce a detectable response (s/n>3) and multiplying the standard deviation by 3 (the tstudents value for eight replicates). MDL for PCBs and organochlorine pesticides were 1 and 0.1 ng/L, respectively.
PCB congeners are denoted by their International Union of Pure and Applied Chemistry numbers. The dioxin-like PCBs (dl-PCBs) are assigned with the toxic equivalent factors (TEFs) based on the relative toxicity with 2, 3, 7, 8-tetrachloro dibenzo-p-dioxin (TCDD).[8] Toxic equivalent quantities (TEQ) of dl-PCBs were calculated by multiplying the concentration of individual dl-PCB congener with the corresponding World Health Organization (WHO) TEFs. The results were reported as ng L–1 and pg WHO2005-TEQ L–1.

Results

Polychlorinated biphenyls

Concentrations of a total of 27 PCBs congeners in water samples from the Yamuna River in Delhi varied from 2-779 ng L–1 (mean of 99±38 ng L–1) (Table 1). The average concentration of ΣPCBs (non-dl-PCBs) and Σdl-PCBs was 163±26 ng L–1 and 22±4 ng L–1, respectively. Σdl-PCBs accounted for 10% of the total PCBs in Yamuna River water. Among all PCBs, congeners CB-18, CB-52 and CB-207 were dominant and accounted for 28%, 33% and 11% of ΣPCBs, respectively.
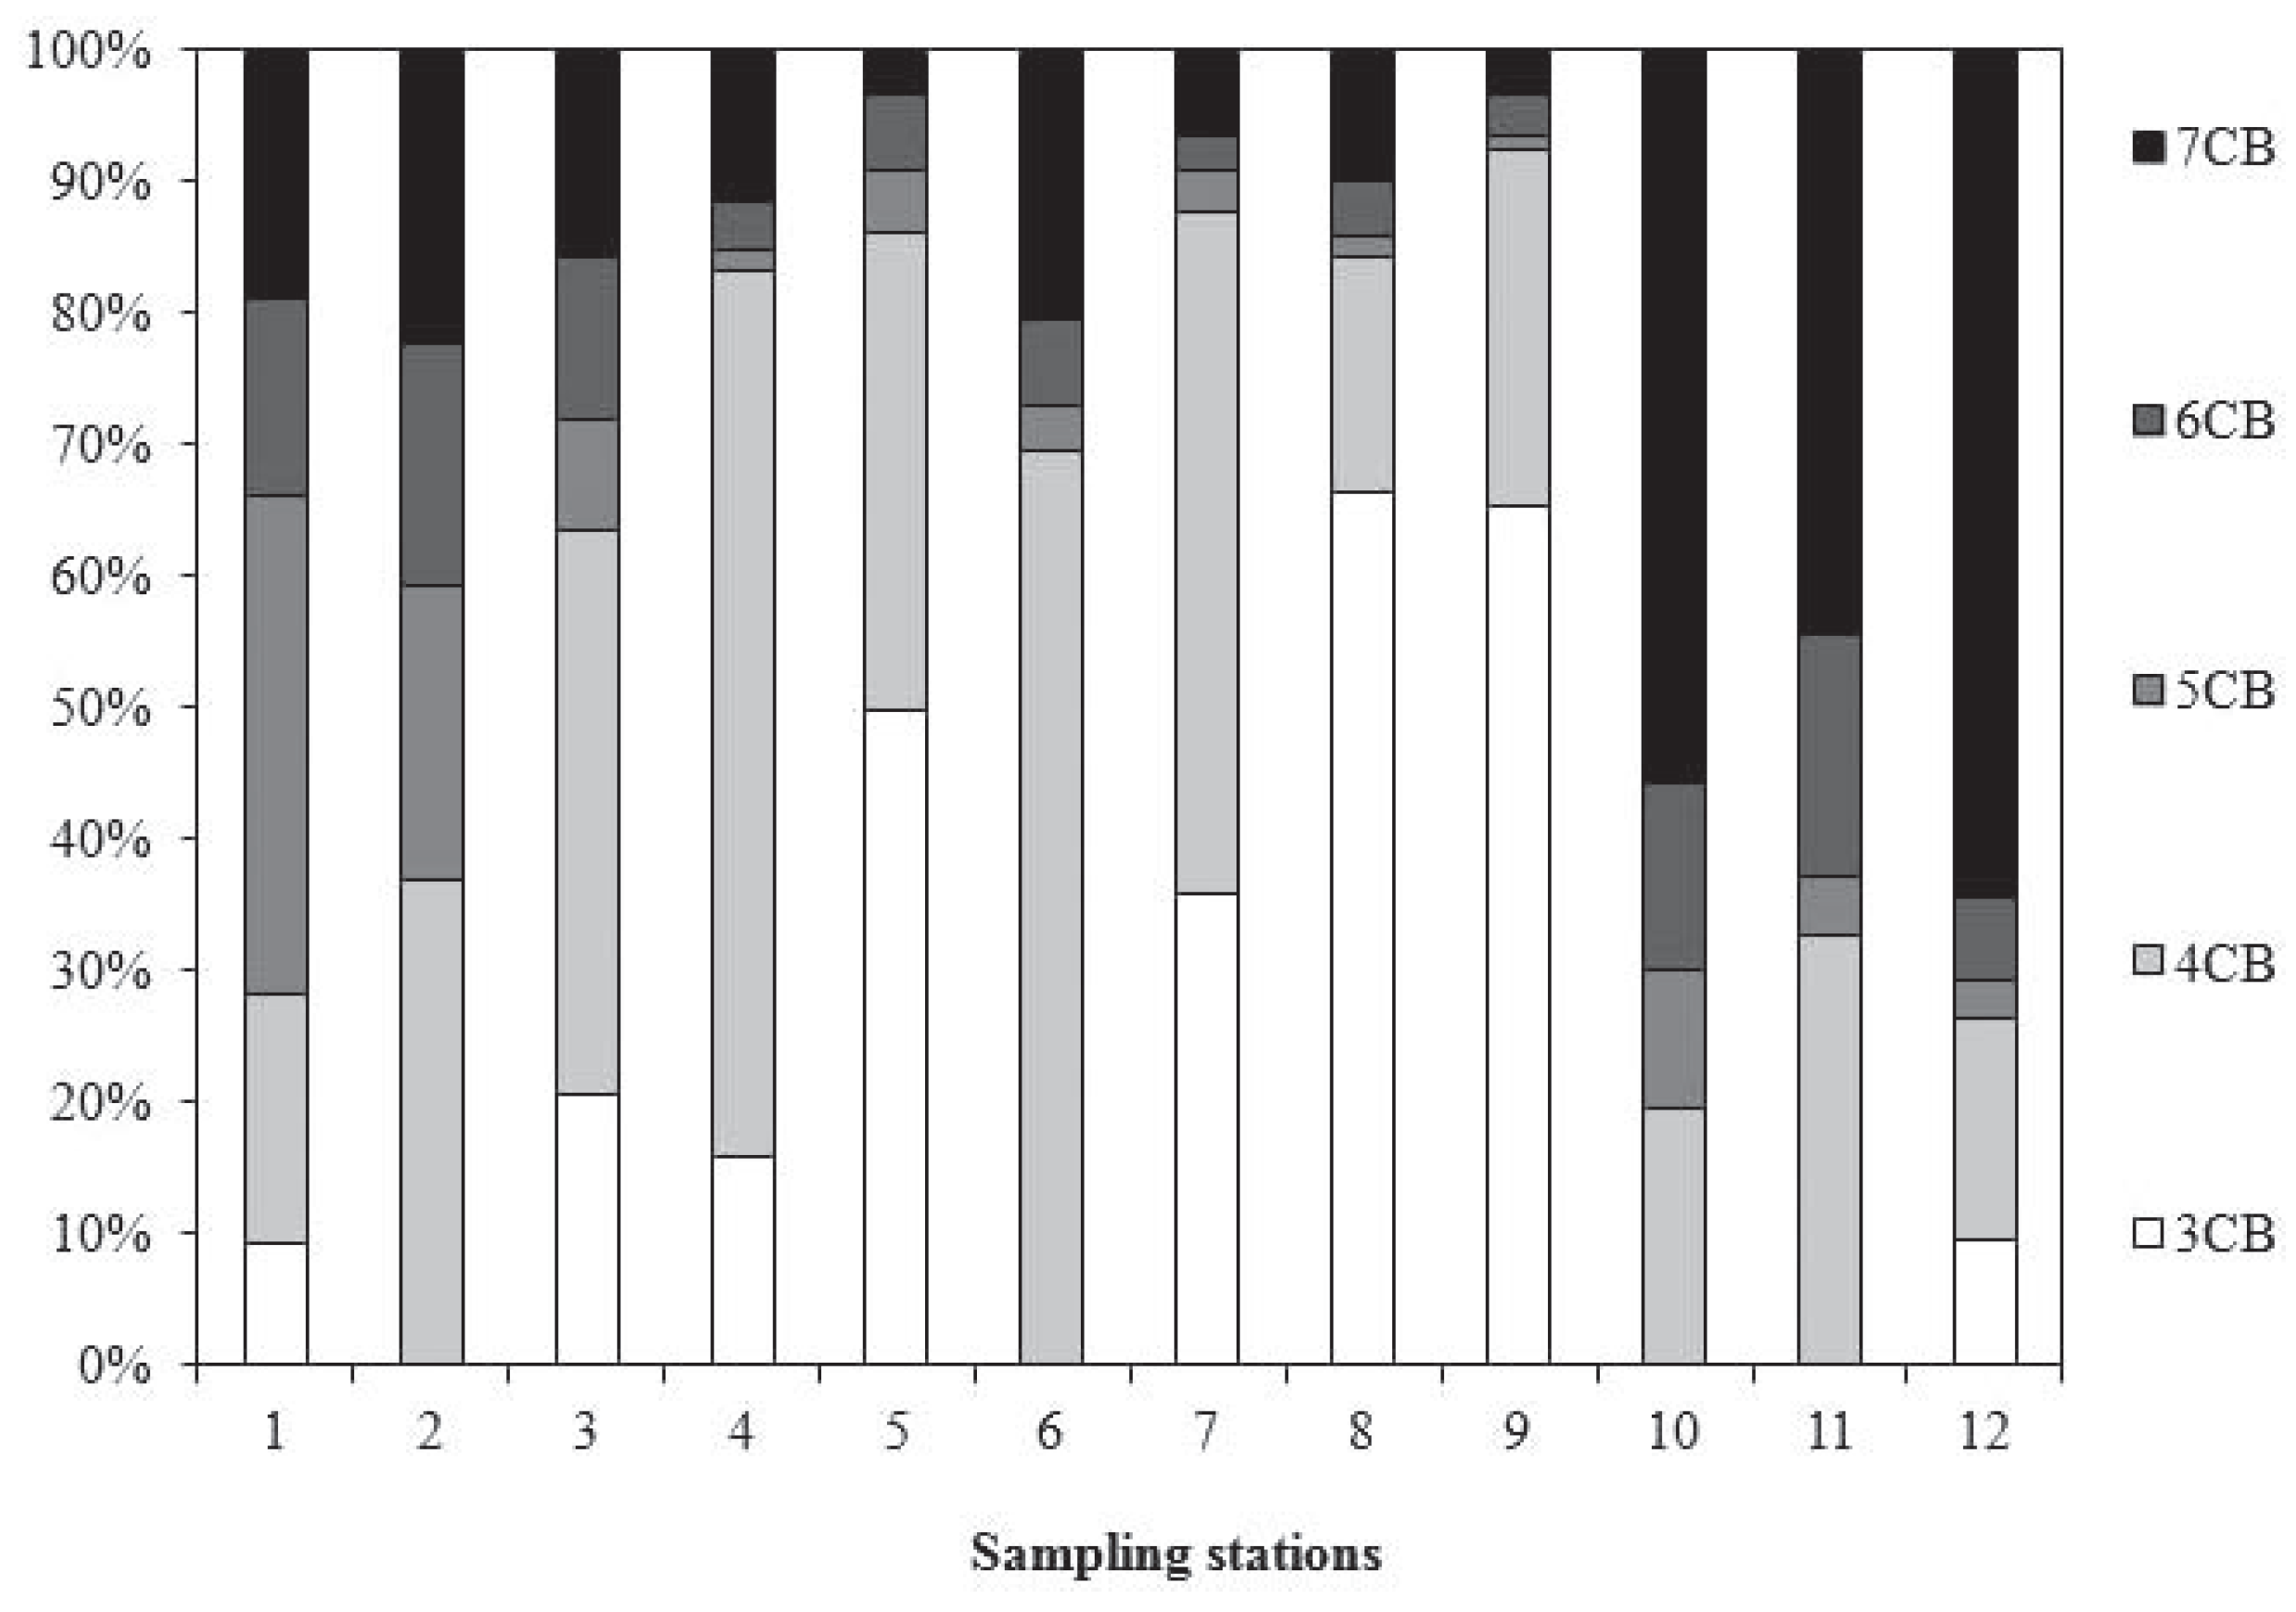
PCBs are not used as single compounds but as technical mixtures of different congeners. Trichlorobiphenyl was primarily used in power capacitors and transformers while high chlorinated biphenyls were mainly used as additive.[25] PCB homolog patterns observed in this study are presented in Table 2 and Figure 2. The PCB homolog was dominated with 3-4 chlorinated biphenyls and pattern was in order of; tetra-CBs (35%) > tri-CBs (25%) > hepta-CBs (22%) > hexa-CBs (9%) > penta-CBs (8%) (Table 2). The homolog patterns show that the lighter-weighted molecular PCBs were much higher than those higher-molecular weight PCBs, and accounted for 68% and 31%, respectively. However, sampling stations 10, 11 and 12 show dominance of high chlorinated biphenyls (heptachlorobiphenyls). Water quality at these locations is influenced by two major drains from which municipal and industrial wastewater enter the River. In an aquatic environment, the PCBs in water may come from industrial and municipal wastewater discharges and air deposition. These are usually adsorbed on the particles in water and settle in the sediment that could naturally become a sink of PCBs as PCBs are non-ionic compounds and the octanol/water partition coefficient (KOW) is in the range of 104-108.
TEQ concentrations of PCBs with established dioxin-like activity, especially nonand mono-ortho substituted PCBs, in water samples from the Yamuna River were calculated by multiplying the concentration of each dioxin-like PCB congener by its 2, 3, 7, 8-TCDD substituted TEF (Table 3). The TEQ values ranged between less than 1-1600 pg WHO2005 TEQ L−1 with a mean value of 221±143 pg WHO2005TEQ L−1.

Organochlorine pesticides

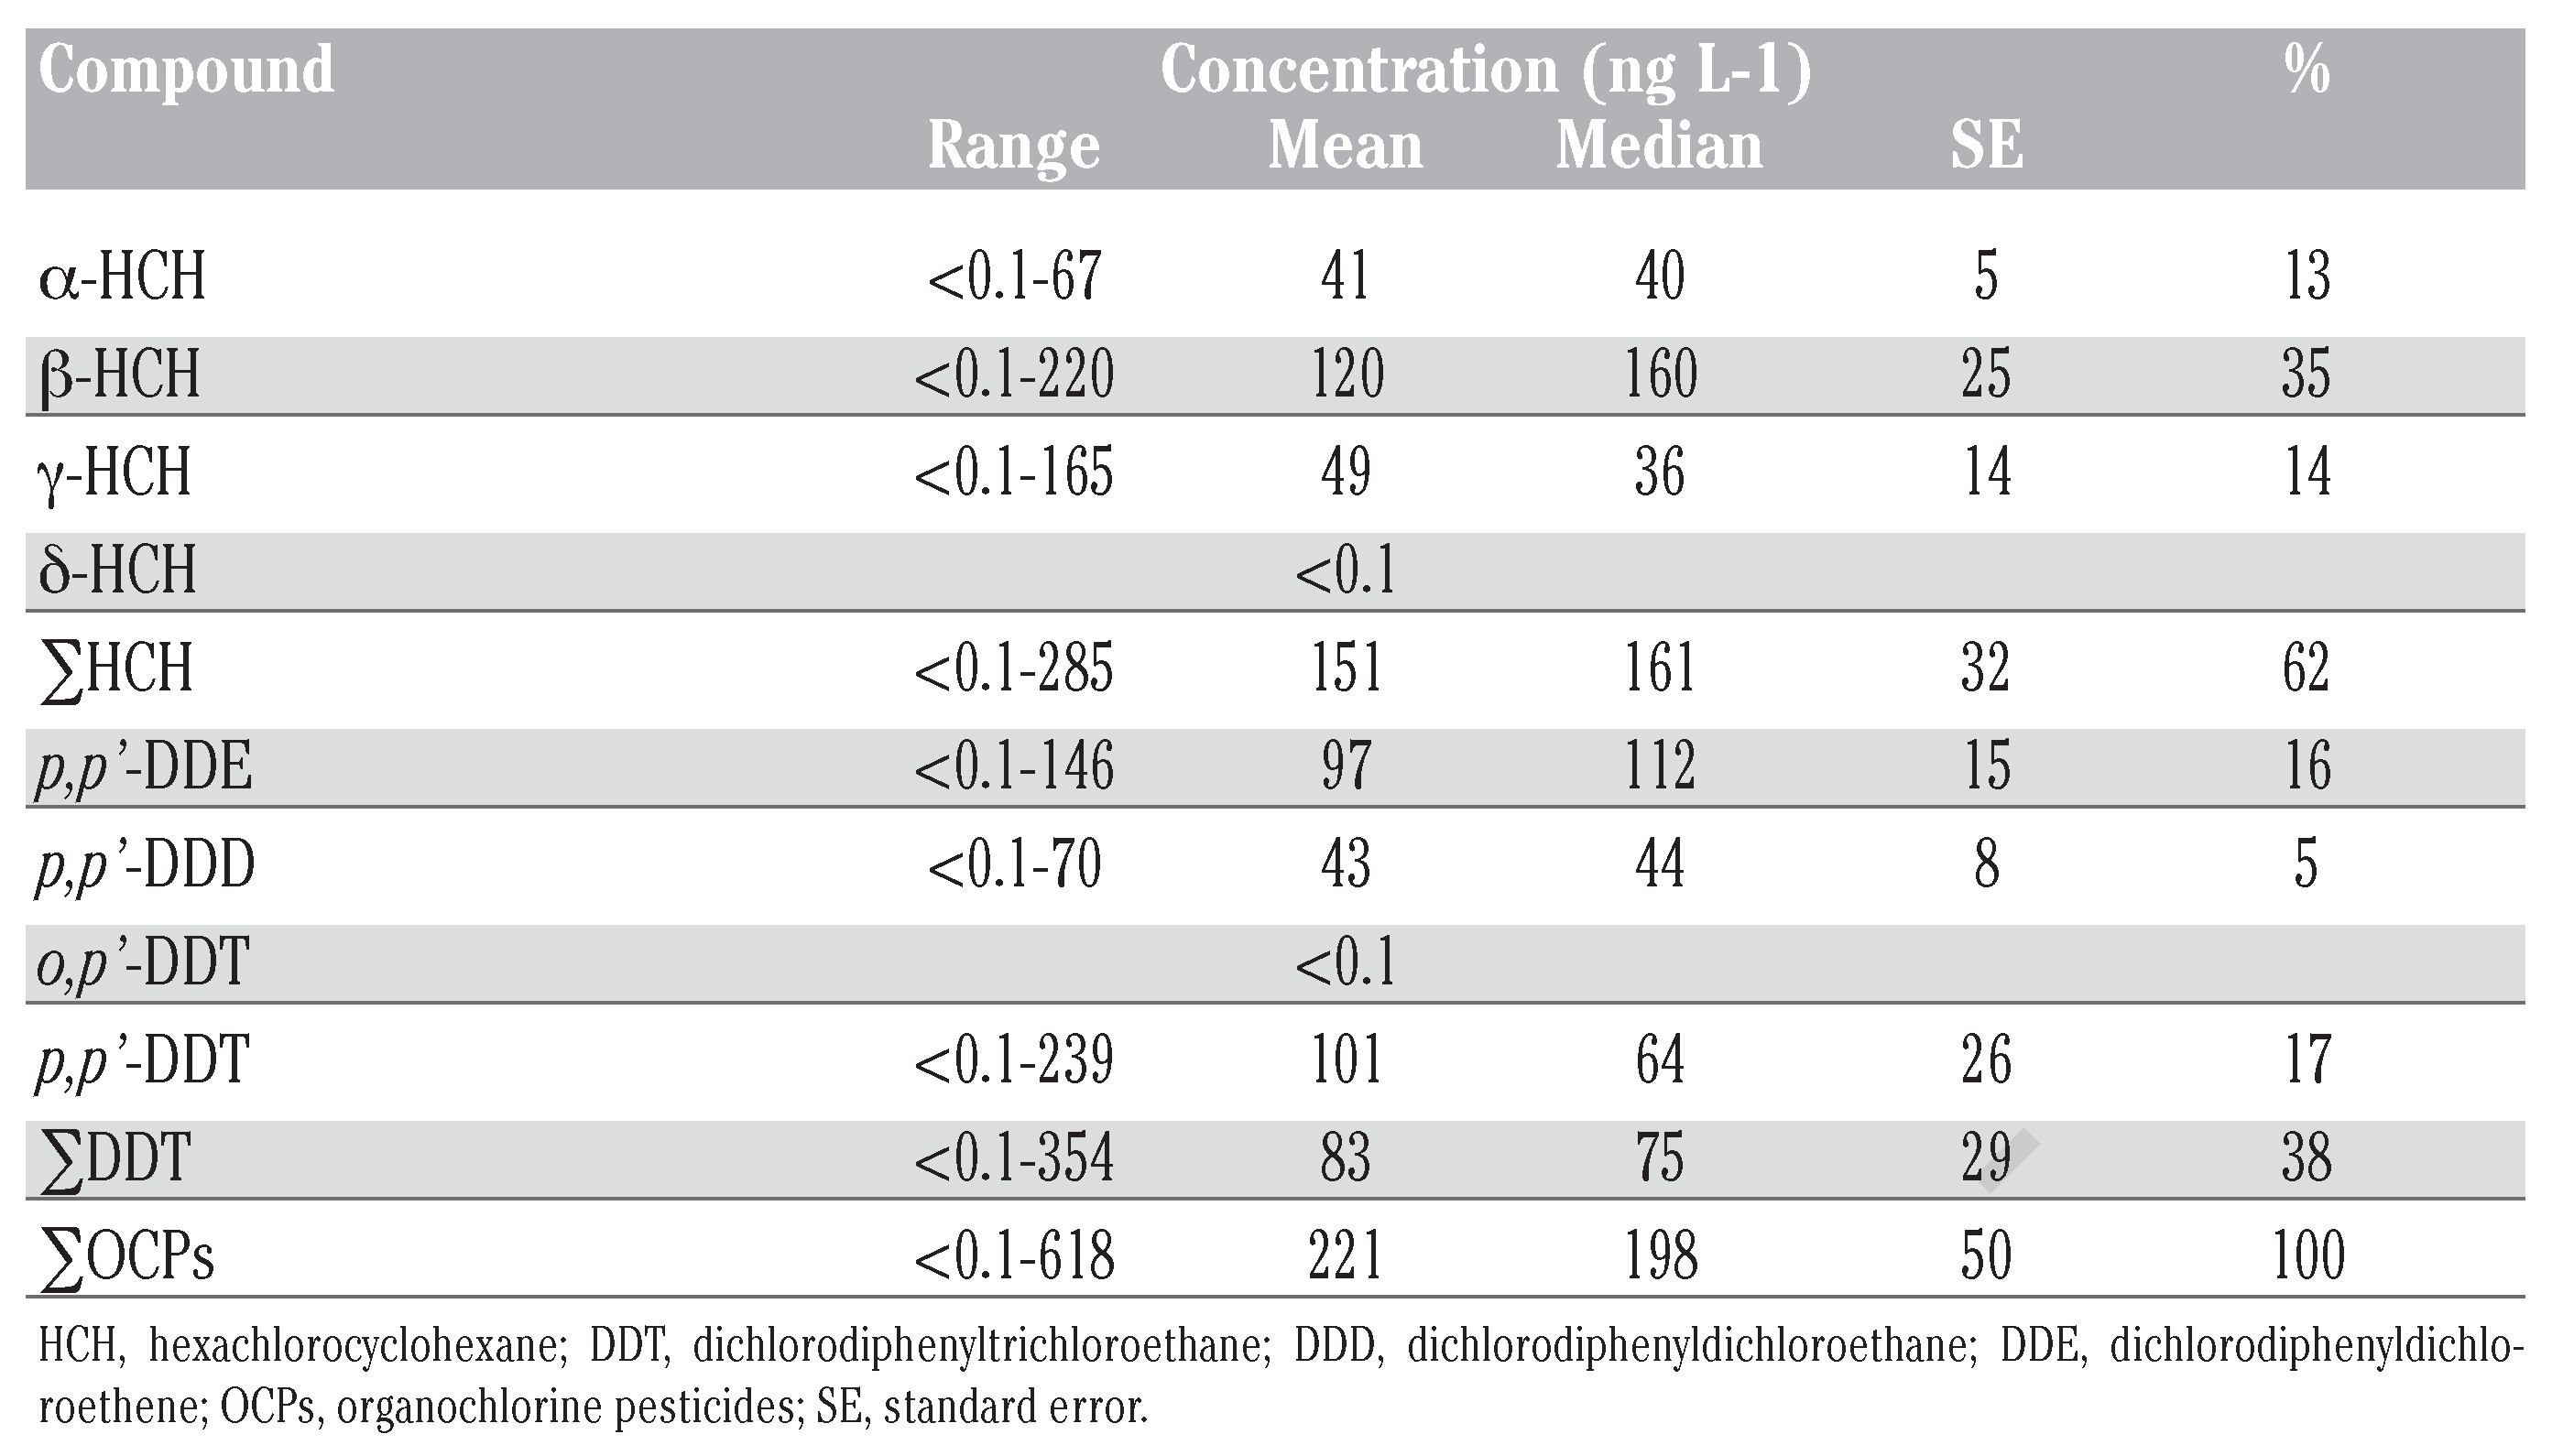
The concentration of HCH, DDT and their isomers in water samples from the Yamuna River is presented in Table 4. The total chlorinated pesticides ranged from less than 0.1 to 618 ng L–1 (mean and median 221 ng L–1 and 198 ng L–1 ±50 ng L–1, respectively). Concentrations of HCHs (62%) were higher than those of DDTs (38%). The concentration of ΣHCH ranged between less than 0.1 to 285 ng L–1 mean and median 151 ng L–1 and 161 ng L–1 , ±32 ng L–1, respectively). However, ΣDDTs concentrations varied between less than 0.1 to 354 ng L–1 (mean and median 83 ng L–1 and 75 ng L–1, ±26 ng L–1, respectively).
Differences in composition of HCH or DDT isomers and their ratios in the environment could indicate different contamination sources.[26] The ratios of HCH and DDT isomers obtained from this study are presented in Table 5. Technical HCH consists principally of four isomers, α-HCH (60-70%), β-HCH (5-12%), γ-HCH (10-15%), δ-HCH (6-10%), while lindane contains more than 99% of γ-HCH.[27] The average concentration of α-HCH, β-HCH, γ-HCH and δ-HCH in this study was 13%, 35%, 14% and less than 0.01%, respectively. The α/γ-HCH ratio has been used to identify the possible HCH source; the higher ratio (>3) indicates input of technical HCH and long-range transport. However, a smaller ratio (<1) is characteristic of lindane sources.[28] The ratio of α-HCH/γ-HCH in this study varied between 0.23 and 1.67 (mean 1.11).
The ratios between the parent compound of DDT and its metabolites [DDD dichlorodiphenyldichloroethane (DDD) and dichlorodiphenyldichloroethene (DDE)] can be used to identify the possible sources in the environment.[29] In the present study, occurrence order of DDT isomers was DDT > DDE > DDD. It is reported that DDTs can volatilize to an ambient environment in a few days.[1] After the DDT applications, much of the DDT slowly converted to DDE and DDD under aerobic and anaerobic conditions, respectively,[30] hence the ratios between the DDT and DDE and DDD is often used as an indication of age (recent or historic) and biotransformation of the DDT. A ratio (DDT/DDD+DDE) much greater than 1 indicates fresh use of DDT; however, a small ratio indicates historic DDT applications. In the present study, the ratios of DDT/(DDD+DDE) were in the range of less than 0.1 to 2.08 (mean 0.86), indicating that the DDT contaminations are from historic usage and biotransformation of DDT in this area. The ratio of p,p’-DDT and p,p’-DDE can be used to estimate the presence of technical DDT in recent inputs. A ratio of less than 1 is considered to be a very old or aged mixture, while a relatively high (>1) ratio indicates DDT use in the last five years.[31,32] In our study the pooled mean ratio of p,p’-DDT/p,p’-DDE was between 2.08 and 2.94 (mean 2.51) indicating input of DDT in recent years. The p,p’-DDT/ΣDDT ratio for technical DDTs was reported to be less than 1.[33] The mean ratio of p,p’-DDT to ΣDDT in the present study was 0.50, which indicates the presence of technical DDT. Furthermore, the ratio of DDD/DDE can reveal the degradation pathways of DDT, since DDE and DDD are the aerobic and anaerobic degradation products of DDT, respectively. A DDD/DDE ratio of less than 1 (<1) shows aerobic degradation and more than one (>1) indicates anaerobic degradation.[26] As shown in Table 5, the DDD/DDE ratios ranged between less than 0.1 and 2.44 (average 1.22). This indicates that degradation of parent DDT was prevalent under anaerobic conditions.

Discussion

Polychlorinated biphenyls

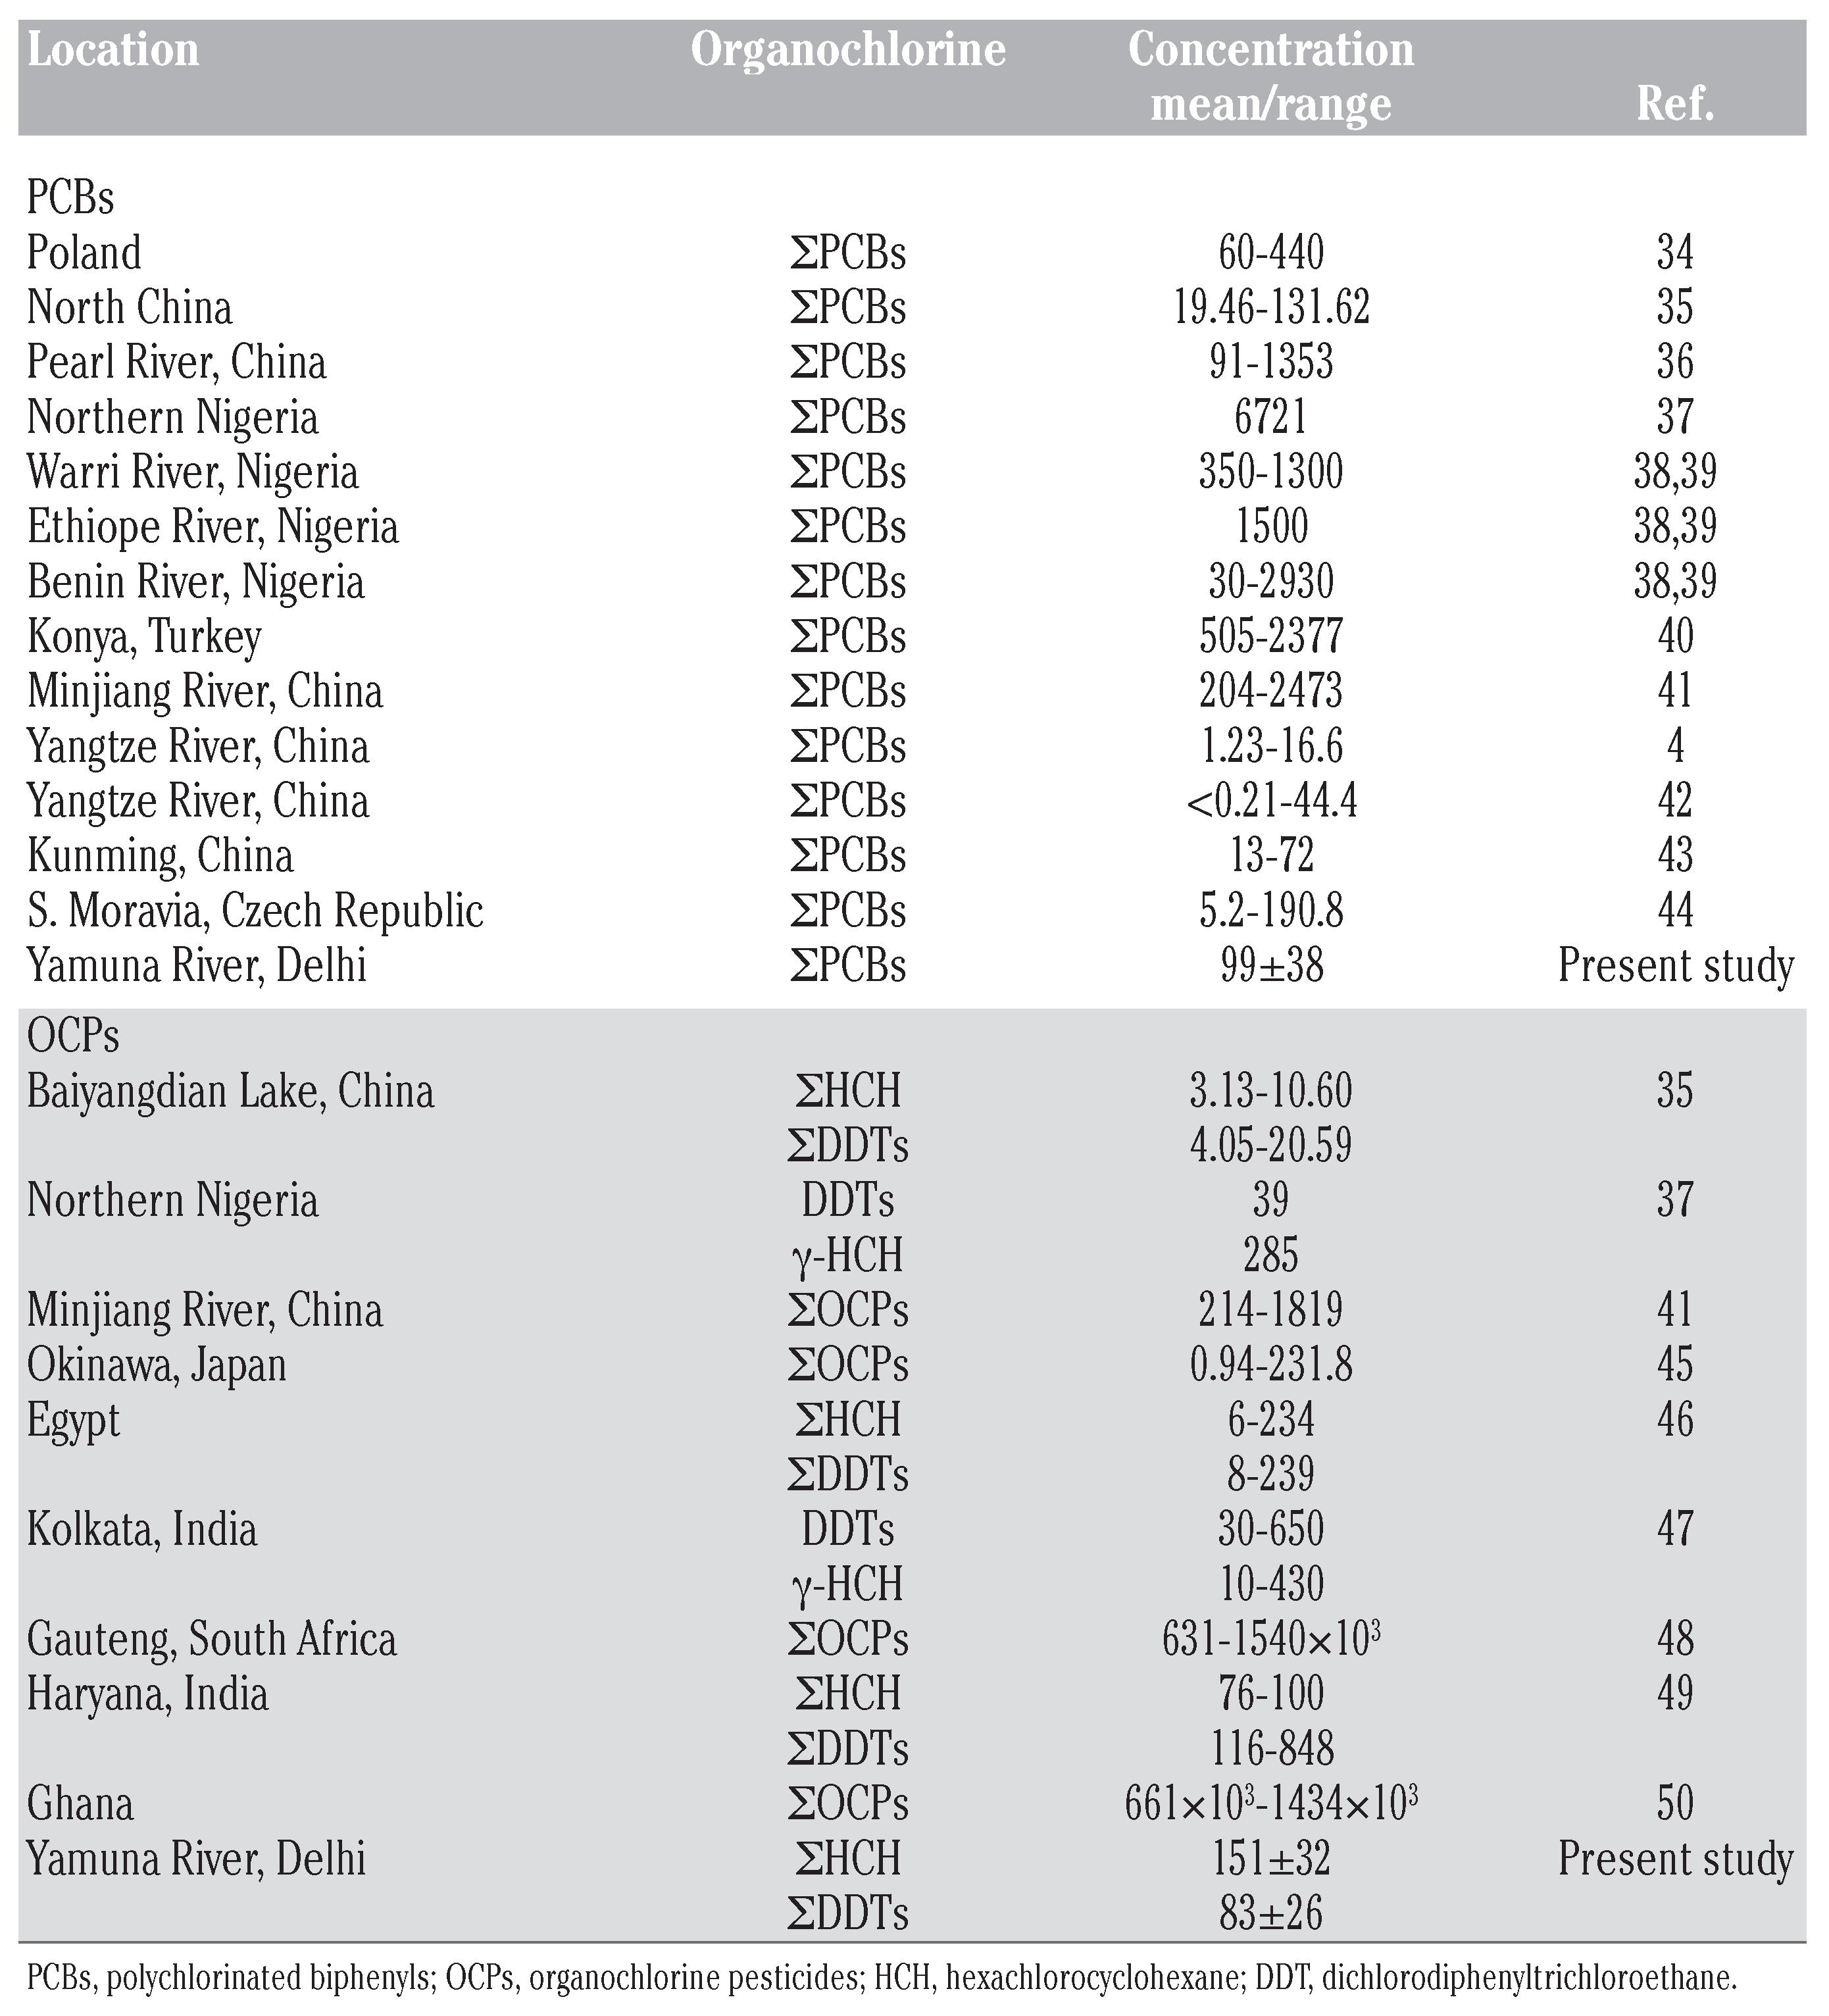
Significant levels of PCBs in different environmental matrices from Delhi and adjoining areas have been reported.[11,12,13,15,19] The results of this study were compared with reports from Europe, America and other tropical countries (Table 6). Similar to our study, PCB distribution in water has been reported from Poland (average 60-440 ng L–1),[34] northern China (19.46 to 131.62 ng L–1).[35] Higher levels of PCBs have been reported from the Pearl River, China (91-1353 ng L–1),[36] northern Nigeria (6721 ng L–1),[37] the Warri River (350-1300 ng L–1), the Ethiope River (1500 ng L–1) and the Benin River (30-2930 ng L–1) in Nigeria,[38,39] Konya, Turkey (505-2377 ng L–1),[40] and the Minjiang River, southeast China (204-2473 ng L–1).[41] However, lower concentrations of PCBs than those found in our study have been reported from the Jiangsu section of the Yangtze River, China (<0.21–44.4 ng L–1),[42] Kunming, China (13 to 72 ng L–1),[43] southern Moravia, Czech Republic (5.2 to 190.8 ng L–1),[44] and from the Yangtze River, China (1.23 to 16.6 ng L–1).[4]

Organochlorine pesticides

HCH and DDT isomers have been identified as contaminants worldwide (Table 6). DDT and γ-HCH concentrations of 39 ng L–1 and 285 ng L–1, respectively, have been reported in water samples from northern Nigeria.[37] Total OCPs of 0.94-231.8 ng L–1 have been reported from river water from Okinawa, Japan.[45] There have been reports of 3.13-10.60 ng L–1 of ΣHCHs and 4.05–20.59 ng L–1 of ΣDDTs in surface water from the Baiyangdian Lake, northern China[35] and of 8-239 ng L–1 DDTs and 6-234 ng L–1 HCHs in water samples from Egypt.[46] Ghose et al.[47] reported lindane (10-430 ng L–1) and DDT (30-650 ng L–1) concentrations for ground water in greater Kolkata, India. Even higher values of chlorinated pesticides have been reported in the literature such as ΣOCPs (631-1540x103 ng L–1) for the Jukskei River in Gauteng, South Africa,[48] HCH (76-100 ng L–1) and DDT (116-848 ng L–1) in drinking water from Haryana, India,[49] 661x103-1434x103 ng L–1 of ΣOCPs reported from Ghana[50] and ΣOCPs (214.4-1819 ng L–1) from the Minjiang River estuary, southeast China.[41]
The ratio of α-HCH/γ-HCH obtained from this study reflects the usage of technical HCH as well as lindane (γ-HCH) in this area. Other studies also anticipated the use of HCH mixture and lindane in this region.[12,13,15,16,19] The ratios between the parent compound of DDT and its metabolites (DDD and DDE) suggest that local input of DDT cannot be ruled out, and this may be caused by observation of significant DDT concentrations in this area[12,13,16,19,49,51,52] coupled with the higher longrange atmospheric transport tendency of DDT under tropical climate conditions. The possible sources of DDTs are the combined effect of past and ongoing use in vector control.

Eco-toxicological risk assessment

The PCB and OCP contamination levels in water from the Yamuna River in Delhi were compared with guideline values stipulated by the US National Oceanic and Atmospheric Administration (NOAA)[53] and the New Jersey Department of the Environment.[54] The NOAA has recommended 2000 ng L–1 for total PCBs as criteria maximum concentration in ambient freshwater. The observed concentrations of PCBs in this study were lower than the criteria maximum concentration (CMC) value, indicating no adverse toxicity effects to the aquatic biota and other users. NOAA’s recommended criteria maximum concentration for DDD, DDE and DDT are 600 ng L–1, 1050×103 ng L–1 and 550 ng L–1, respectively. Therefore, concentrations of these pollutants in the Yamuna River were far below the recommended CMC. The New Jersey Department of the Environment has recommended 12.4×10³ ng L–1, 495 ng L–1 and 26 ng L–1 as criteria continuous concentration for α-HCH, β-HCH and γ-HCH, respectively. It is clear from Table 4 that γ-HCH exceeds the recommended guideline concentration. As mentioned earlier, lindane formulation is registered for use in public health practices to control vector borne diseases. Eco-toxicological risk may not be ruled out since the level of γ-HCH exceeded the guideline values and might be a cause of concern for the river ecosystem.
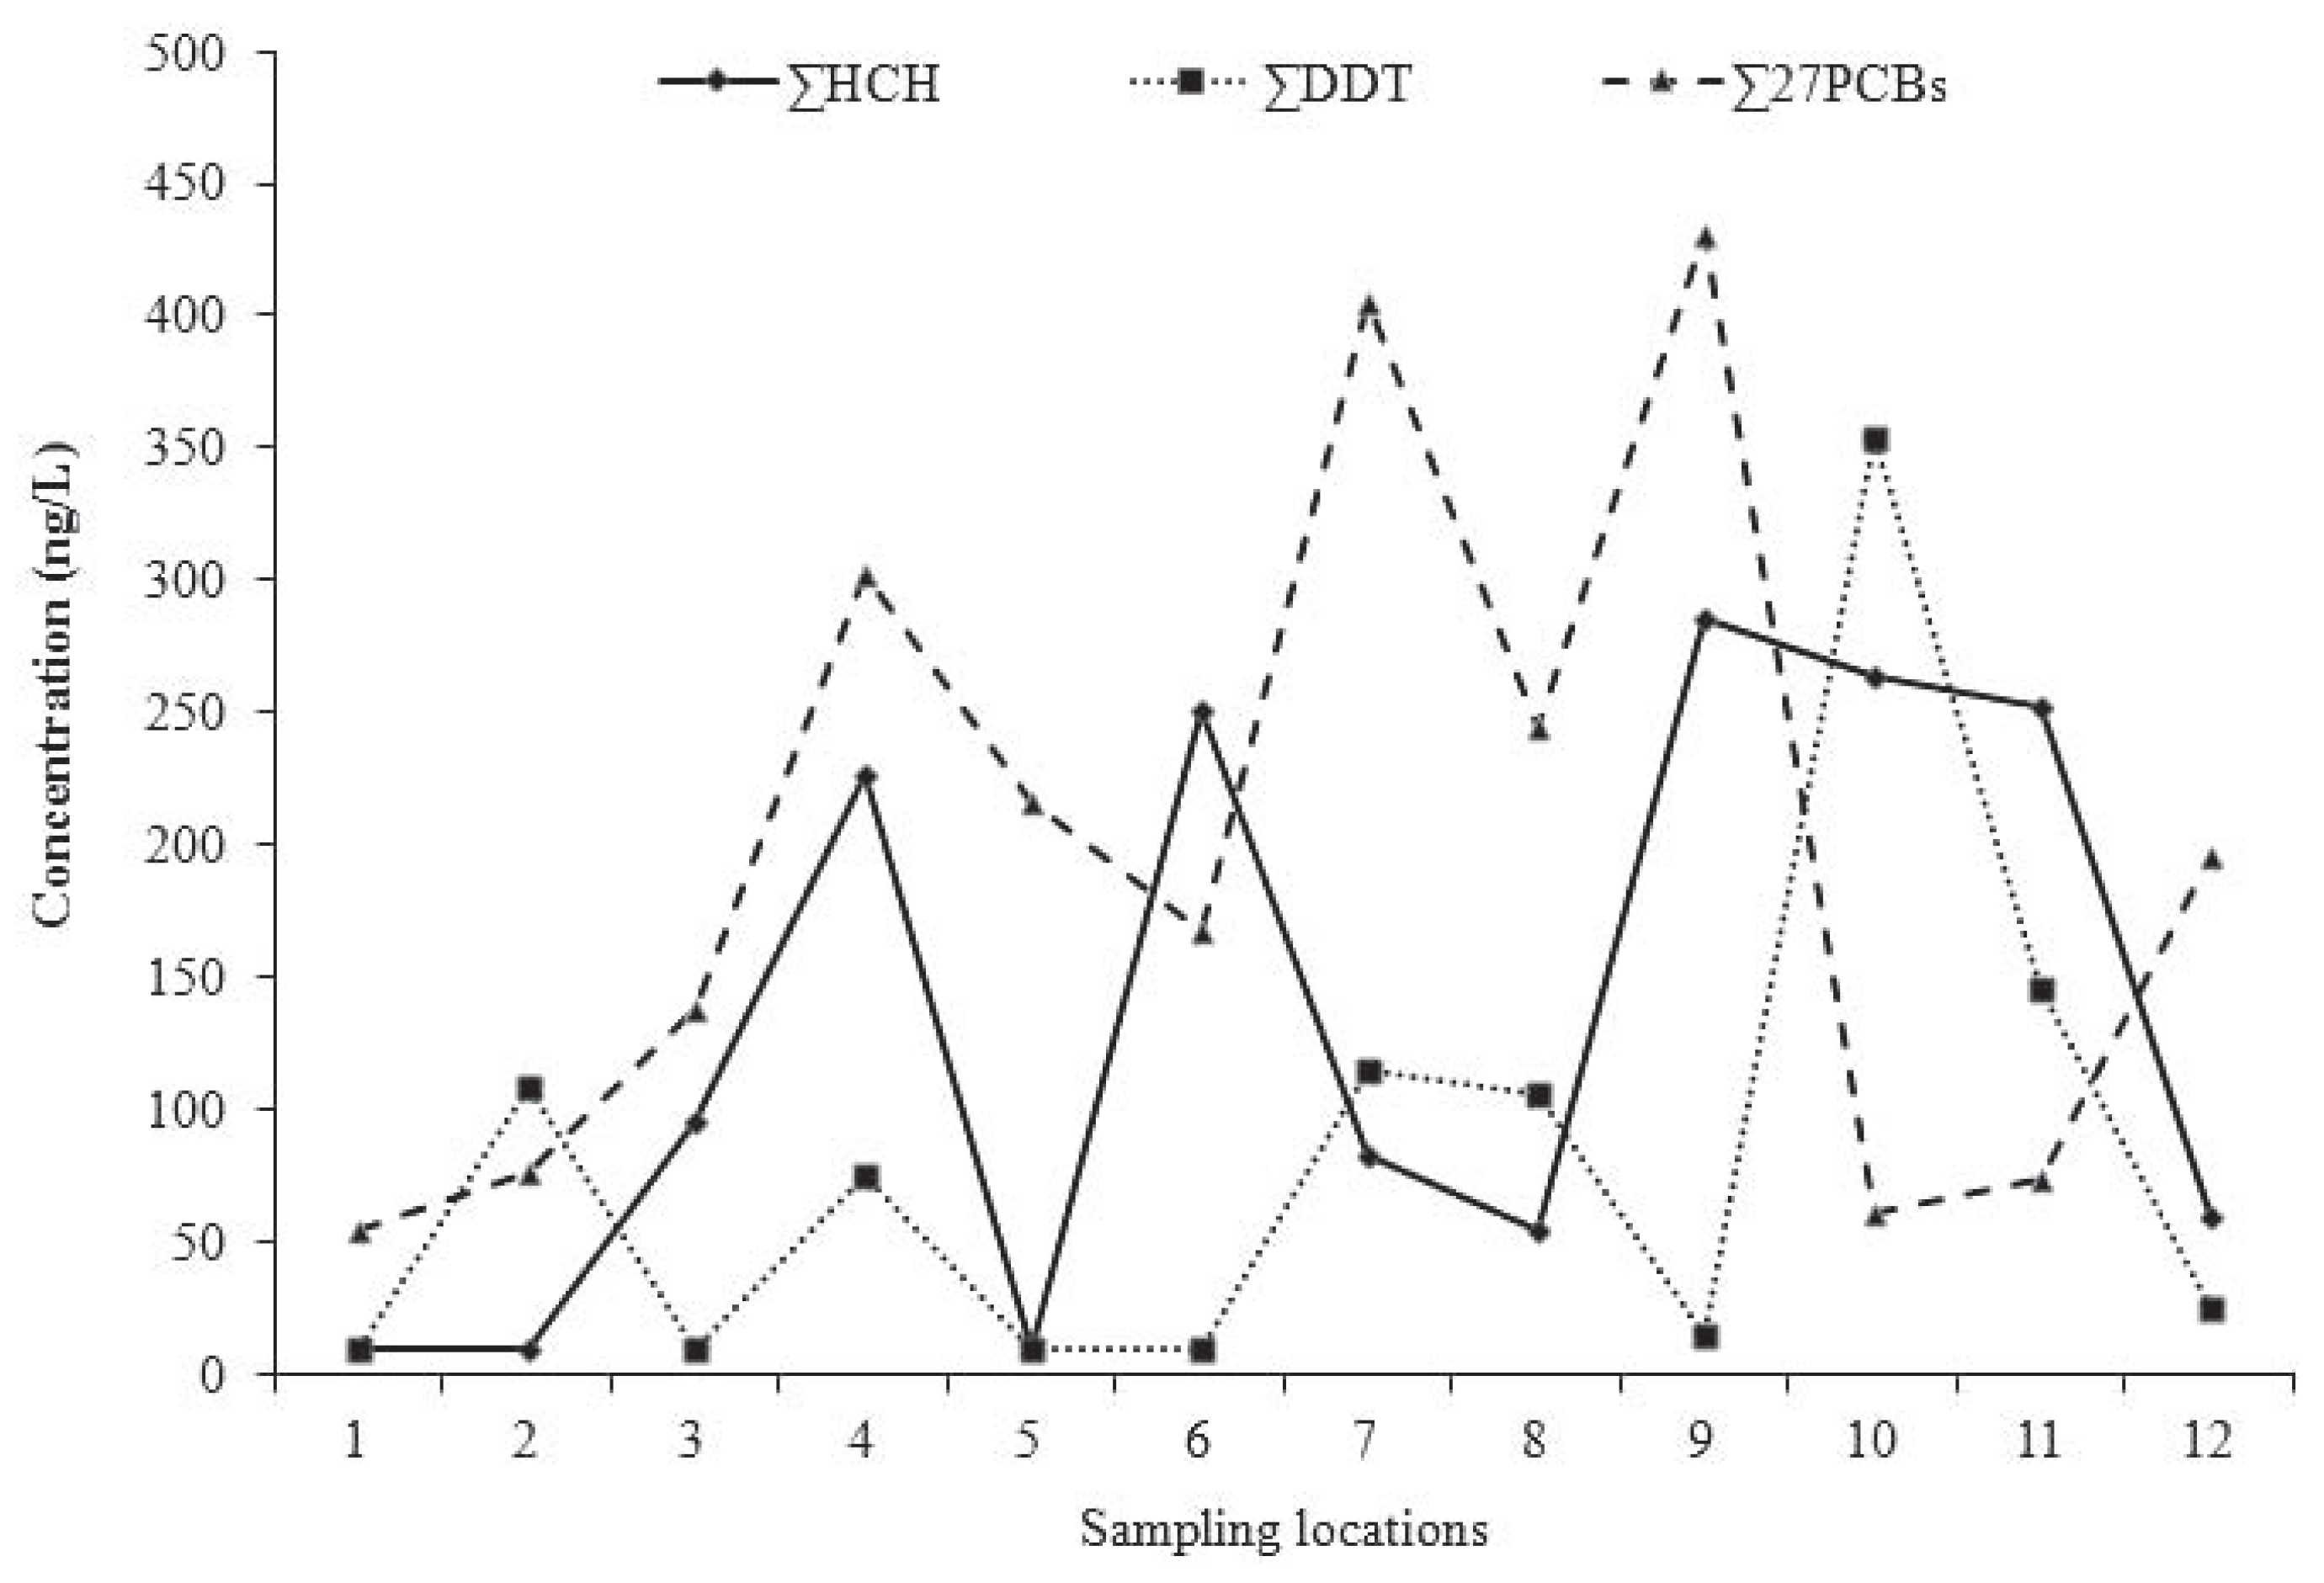
Comparatively high organochlorine concentrations were detected in water samples collected from locations receiving wastewater through municipal drains (i.e. location ns. 4, 6, 9, 10, 11 and 12; Figure 3). This indicates that these pollutants have been used in this area and the chemicals have found their way to the river ecosystem. DDT and HCH have been used for public health purposes in India and contamination of PCBs in the local environment is restricted to transformer oil rather than technical mixtures used for industries and electrical appliances. India’s production of electronic waste (e-waste) is growing at an exponential rate generating approximately 150,000 t/year, much of which is stockpiled or poorly managed. PCBs, which have been widely used in industrial production, may also be present in the electronic waste stream. Most of the ewaste generated in the country ends up in New Delhi for recycling purposes, though procedures are not regulated creating a possible source for PCBs. A statistically significant (P<0.05) positive linear correlation has been observed between the amount of e-waste generated in 2005 and the PCB concentration in the atmosphere of Indian cities.[20] The other sources of PCBs in the Delhi region were probably from open biomass burning and of emission depositions from wood processing, paint and dying chemicals, electrical and electronic waste recycling, and polyvinylchloride manufacturing units.

Conclusions

The concentration of PCBs, HCH and DDT in Yamuna River water are comparable with other tropical regions of the world. The lower chlorinated PCBs dominated the total PCBs and dl-PCBs accounted for only 10%. The concentrations of HCH and DDT were lower than US guidelines; however, levels of lindane were higher than the CMC indicating possible toxicological effects to aquatic biota. Wastewater coming from drains should undergo complete treatment for organic contaminants before entering the river. Further work is required to determine the bioaccumulation through tissues of aquatic biota (e.g. fish) to determine the contaminant levels in these living bodies.

Conflict of Interests

the authors declare no potential conflict of interests.

Author Contributions

BK, sample collection and processing; data processing and compilation, manuscript preparation and correspondence; SKS, instrument calibration, sample analysis with quality control for PCBs; MM, instrumental analysis with quality control for organochlorine pesticides; SK, technical guidance; CSS, overall planning and guidance to conduct the study.

Acknowledgments

the authors express their sincere gratitude to the Member Secretary and Chairman of Central Pollution Control Board, Ministry of Environment & Forest Government of India for encouragement and guidance to conduct the study.

References

  1. Atlas, E.; Giam, C.S. Ambient concentration and precipitation scavenging of atmospheric organic pollutants. Water Air Soil Pollut 1988, 38, 19–36. [Google Scholar] [CrossRef]
  2. Minh, N.H.; Minh, T.B.; Kajiwara, N.; Kunisue, T.; Subramanian, A.; Iwata, H.; et al. Contamination by persistent organic pollutants in dumping sites of Asian developing countries: implication of emerging pollution sources. Arch Environ Conta Toxicol 2006, 50, 474–81. [Google Scholar] [CrossRef]
  3. SC (Stockholm Convention). National Implementation Plan for POPs, India. www.pops.int/ Accessed: 30th January, 2012.
  4. Zhang, L.; Shi, S.; Dong, L.; Zhang, T.; Zhou, L.; Huang, Y. Concentrations and possible sources of polychlorinated biphenyls in the surface water of the Yangtze River Delta China. Chemosphere 2011, 85, 399–405. [Google Scholar] [CrossRef]
  5. Oehme, M. Further evidence for long-range air transport of polychlorinated aromates and pesticides: North America and Eurasia to the Arctic. Ambio 1991, 20, 293–7. [Google Scholar]
  6. George, J.L.; Frear, D.E.H. Pesticides in the Antarctic. J Appl Ecol 1966, 3, 155–67. [Google Scholar] [CrossRef]
  7. Hyun, P.; Lee, S.H.; Kim, M.; Kim, J.H.; Lim, H.S. Polychlorinated biphenyl congeners in soils and lichens from King George Island South Shetland Islands Antarctica. Antarctic Science 2010, 22, 31–8. [Google Scholar]
  8. Van den Berg, M.; Birnbaum, L.S.; Denison, M.; et al. The 2005 World Health Organization re-evaluation of human and mammalian toxic equivalency factors for dioxins and dioxin-like compounds. Toxicol Sci 2006, 93, 223–41. [Google Scholar] [CrossRef]
  9. Babu Rajendran, R.; Imagawa, T.; Taoa, H.; Ramesh, R. Distribution of PCBs HCHs and DDTs and their ecotoxicological implications in Bay of Bengal India. Environ International 2005, 31, 503–12. [Google Scholar] [CrossRef]
  10. Kumar, Sanjay; Kumar, B.; Sharma, C.S.; Makhijani, S.D.; Sengupta, B. Levels of polychlorinated biphenyl congeners in sea water and surface sediment of Alang ship breaking site Bhavnagar Gujrat India. Organohalogen Compounds 2008, 70, 19–22. [Google Scholar]
  11. Kumar, B.; Singh, S.K.; Kumar, S.; Sharma, C.S. Distribution of polychlorinated biphenyls in surface waters of various sources from national capital region Delhi India. J Nat Sci Res 2012, 2, 26–38. [Google Scholar]
  12. Kumar, B.; Gaur, R.; Goel, G.; Mishra, M.; Singh, S.K.; Prakash, D.; et al. Residues of pesticides and herbicides in soils from agriculture areas of Delhi Region India. J. Environ. Earth Sci 2011, 1, 1–8. [Google Scholar]
  13. Kumar, B.; Kumar, S.; Gaur, R.; Goel, G.; Mishra, M.; Singh, S.K.; et al. Persistent organochlorine pesticides and polychlorinated biphenyls in intensive agricultural soils from North India. Soil Water Res 2011, 6, 190–7. [Google Scholar] [CrossRef]
  14. Guzzella, L.; Roscioli, C.; Vigano, L.; Saha, M.; Sarkar, S.K.; Bhattacharyya, A. Evaluation of the concentration of HCH DDT HCB PCB and PAH in the sediments along the lower stretch of Hugli estuary West Bengal northeast India. Environ Int 2005, 31, 523–34. [Google Scholar] [CrossRef]
  15. Kumar, B.; Kumar, S.; Mishra, M.; Singh, S.K.; Sharma, C.S.; Makhijani, S.D.; et al. Distribution of pesticides herbicides synthetic pyrethroids and polychlorinated biphenyls in sediments from drains of Delhi India. Organohalogen Compounds 2008, 70, 1120–23. [Google Scholar]
  16. Kumar, B.; Mishra, M.; Goel, G.; et al. Distribution and ecotoxicological risk assessment of persistent organic pollutants (POPs) in river sediments from Delhi India. Adv Life Sci Technol 2011, 1, 1–8. [Google Scholar]
  17. Kumar, B.; Kumar, S.; Mishra, M.; Dev Prakash Singh, S.K.; Sharma, C.S.; et al. Persistent organochlorine pesticides in sediments from Haldi and Rupnarayan River in West Bengal India. Proc Indian Natl Sci Acad 2011, 77, 315–23. [Google Scholar]
  18. Zhang, G.; Chakraborty, P.; Li, J.; Sampathkumar, P.; Balasubramanian, T.; Kathiresan, K.; et al. Passive atmospheric sampling of organochlorine pesticides polychlorinated biphenyls and polybrominated diphenyl ethers in urban rural and wetland sites along the coastal length on India. Environ Sci Technol 2008, 42, 8218–23. [Google Scholar] [CrossRef]
  19. Chakraborty, P.; Zhang, G.; Li, J.; Xu, Y.; Liu, X.; Tanabe, S.; et al. Selected organochlorine pesticides in the atmosphere of major Indian cities: levels regional versus local variations and sources. Environ Sci Technol 2010, 44, 8038–43. [Google Scholar] [CrossRef]
  20. Pozo, K.; Harner, T.; Lee, S.C.; Sinha, R.K.; Sengupta, B.; Loewen, M.; et al. Assessing seasonal and spatial trends of persistent organic pollutants (POPs) in Indian agricultural regions using PUF disk passive air samplers. Environ Pollut 2011, 159, 646–53. [Google Scholar] [CrossRef]
  21. Devanathan, G.; Subramanian, A.; Someya, M.; Sundaryanto, A.; Isobe, T.; Takahashi, S.; et al. Persistent organochlorines in human breast milk from major metropolitan cities in India. Environ Pollut 2008, 157, 148–54. [Google Scholar] [CrossRef]
  22. Someya, M.; Ohtake, M.; Kunisue, T.; Subramanian, A.; Takahashi, S.; Chakraborty, P.; et al. Persistent organic pollutants in breast milk of mothers residing around an open dumpsite in Kolkata India: specific dioxin-like PCB levels and fish as a potential source. Environ Int 2009, 36, 27–35. [Google Scholar] [CrossRef]
  23. Sharma, M.P.; Singhal, S.K.; Patra, S. Water quality profile of Yamuna River India. Hydro Nepal 2008, 3, 1–6. [Google Scholar] [CrossRef]
  24. National Technical Information Service (NTIS) US Department of Commerce Port Royal Road Springfield VA 22161. Available from: http://wwwepagov/osw/hazard/testmethods/sw846/.
  25. You, H.; Ding, J.; Zhao, X.S.; Li, Y.F.; Liu, L.Y.; Ma, W.L.; et al. Spatial and seasonal variation of polychlorinated biphenyls in Songhua River China. Environ Geochem Health 2011, 33, 291–9. [Google Scholar] [CrossRef]
  26. Doong, R.A.; Peng, C.K.; Sun, Y.C.; Liao, P.L. Composition and distribution of organochlorine pesticide residues in surface sediments from the Wu-Shi River estuary Taiwan. Marine Pollut Bull 2002, 45, 246–53. [Google Scholar] [CrossRef]
  27. Zhou, R.; Zhu, L.; Yang, K.; Chen, Y. Distribution of organochlorine pesticides in surface water and sediments from Qiantang River East China. J Hazard Mater 2006, 137, 68–75. [Google Scholar] [CrossRef]
  28. Willet, K.L.; Ulrich, E.M.; Hites, H.A. Differential toxicity and environmental fates of Hexachlorocyclohexane isomers. Environ Sci Technol 1998, 32, 2197–207. [Google Scholar] [CrossRef]
  29. Guo, Y.; Yuh, Y.; Zheng, E.Y. Occurrence source diagnosis and biological effect assessment of DDT and its metabolites in various environmental compartments of the Pearl River Delta South China: A review. Environ Pollut 2009, 157, 1753–63. [Google Scholar] [CrossRef]
  30. Aislabie, J.M.; Richards, N.K.; Boul, H.L. Microbial degradation of DDT and its residues-a review. New Zeal J Agr Res 1997, 40, 269–82. [Google Scholar] [CrossRef]
  31. Tavares, T.M.; Beretta, M.; Costa, M.C. Ratio of DDT/DDE in the all Saints Bay Brazil and its use in environmental management. Chemosphere 1999, 38, 1445–52. [Google Scholar] [CrossRef]
  32. Li, Y.; Zhang, Q.; Ji, D.; Wang, T.; Wang, Y.; Wang, P.; et al. Levels and vertical distributions of PCBs PBDEs and OCPs in the atmosphere boundary layer: observation from the Beijing 325-m meteorological tower. Environ Sci Technol 2009, 43, 1030–5. [Google Scholar] [CrossRef]
  33. WHO (World Health Organization). DDT and its derivatives environmental aspects no. 83. Geneva: Environmental Health Criteria; 1989.
  34. Sulej, A.M.; Polkowska, Z.; Namiesnik, J. Contamination of runoff water at Gdansk airport (Poland) by polycyclic aromatic hydrocarbons (PAHs) and polychlorinated biphenyls (PCBs). Sensors 2011, 11, 11901–20. [Google Scholar] [CrossRef]
  35. Dai, G.; Liu, X.; Liang, G.; Han, X.; Shi, L.; Cheng, D.; et al. Distribution of organochlorine pesticides (OCPs) and polychlorinated biphenyls (PCBs) in surface water and sediments from Baiyangdian Lake in North China. J Environ Sci 2011, 23, 1640–9. [Google Scholar] [CrossRef]
  36. Chau, K.W. Characterization of transboundary POP contamination in aquatic ecosystems of Pearl River Delta. Marine Pollut Bulletin 2005, 51, 960–5. [Google Scholar] [CrossRef]
  37. Okeniyia, S.O.; Egwaikhideb, P.A.; Akporhonorc, E.E.; Obazed, I.E. Distribution of organochlorine and polychlorinated pesticide residue in water bodies of some rivers in Northern Nigeria. EJEAFChe 2009, 8, 1269–74. [Google Scholar]
  38. Ezemonye, L.I.N. Levels of polychlorinated biphenyls residues in Warri River Nigeria. Global J Environ Sci 2005, 4, 65–71. [Google Scholar] [CrossRef]
  39. Ezemonye, L.I.N. Polychlorinated biphenyls (PCBs) levels and distribution in Ethiope and Benin Rivers of the Niger Delta Nigeria: surface water and sediments. Int J Environ Stud 2005, 62, 491–504. [Google Scholar] [CrossRef]
  40. Aydin, M.E.; Sari, S.; Özcan, S.; Wichmann, H.; Bahadir, M. Polychlorinated biphenyls in waste water of Konya-Turkey. Fresenius Environ Bull 2004, 13, 1090–93. [Google Scholar]
  41. Zhang, Z.L.; Hong, H.S.; Zhou, J.L.; Huang, J.; Yu, G. Fate and assessment of persistent organic pollutants in water and sediment from Minjiang River Estuary Southeast China. Chemosphere 2003, 52, 1423–30. [Google Scholar] [CrossRef]
  42. He, H.; Hu, G.J.; Sun, C.; Chen, S.; Yang, M.; Li, J.; et al. Trace analysis of persistent toxic substances in the main stream of Jiangsu section of the Yangtze River China. Environ Sci Pollut Res 2011, 18, 638–48. [Google Scholar] [CrossRef]
  43. Wan, X.; Pan, X.; Wang, B.; Zhao, S.; Hu, P.; Li, F.; et al. Distributions historical trends and source investigation of polychlorinated biphenyls in Dianchi Lake China. Chemosphere 2011, 85, 361–7. [Google Scholar] [CrossRef]
  44. Lana, R.; Vavrova, M.; Caslavsky, J.; Skoumalova, M.; Bilkova, A.; Sucman, E. PCBs in samples from the environment of the southern Moravia region Czech Republic. Bull Environ Contam Toxicol 2008, 81, 574–7. [Google Scholar] [CrossRef]
  45. Imo, S.T.; Sheikh, M.A.; Hirosawa, E.; Oomori, T.; Tamaki, F. Contamination by organochlorine pesticides from rivers. Int J Environ Sci Tech 2007, 4, 1–9. [Google Scholar] [CrossRef]
  46. Essumang, D.K.; Togoh, G.K.; Chokky, L. Pesticide residues in the water and fish (lagoon tilapia) samples from lagoons in Ghana. Bull Chem Soc Ethiop 2009, 23, 19–27. [Google Scholar] [CrossRef]
  47. Ghose, N.C.; Saha, D.; Gupta, A. Synthetic Detergents (surfactants) and organochlorine pesticide signatures in surface water and groundwater of greater Kolkata India. J Water Res Prot 2009, 4, 290–8. [Google Scholar] [CrossRef]
  48. Sibali, L.S.; Okwonkwo, J.O.; McCrindle, R.I. Determination of selected organochlorine pesticide (OCP) compounds from the Jukskei River catchment area in Gauteng South Africa. Water 2008, 34, 611–21. [Google Scholar] [CrossRef]
  49. Kaushik, C.P.; Sharma, H.R.; Kaushik, A. Organochlorine pesticide residues in drinking water in the rural areas of Haryana India. Environ Monit Assess 2012, 184, 103–12. [Google Scholar] [CrossRef]
  50. El Bouraie, M.; El Barbary, A.; Yehia, M. Monitoring of chlorinated hydrocarbon compounds residues in surface water and bed sediment samples from ElRahawy drain, Egypt. Int J Environ Sci 2011, 1, 1931–47. [Google Scholar]
  51. Mutiyar, P.K.; Mittal, A.K.; Pekdeger, A. Status of organochlorine pesticides in the drinking water well-field located in the Delhi region of the flood plains of river Yamuna. Drink Water Eng Sci Discuss 2011, 4, 85–115. [Google Scholar] [CrossRef]
  52. Pandey, P.; Khillare, P.S.; Kumar, K. Assessment of organochlorine pesticide residues in the surface sediments of river Yamuna in Delhi India. J Environ Protect 2011, 2, 511–24. [Google Scholar] [CrossRef]
  53. National Oceanic and Atmospheric Administration (NOAA). NOAA screening quick reference tables (SQuiRTs). HAZMAT REPORT 1999-1. Seattle, Washington: National Oceanic and Atmospheric Administration; 2004.
  54. New Jersey Department of Environment. NJDEP Ecological Screening Criteria Table Updated 2009. Available from: http://www. nj.gov/dep/srp/guidance/ecoscreening.
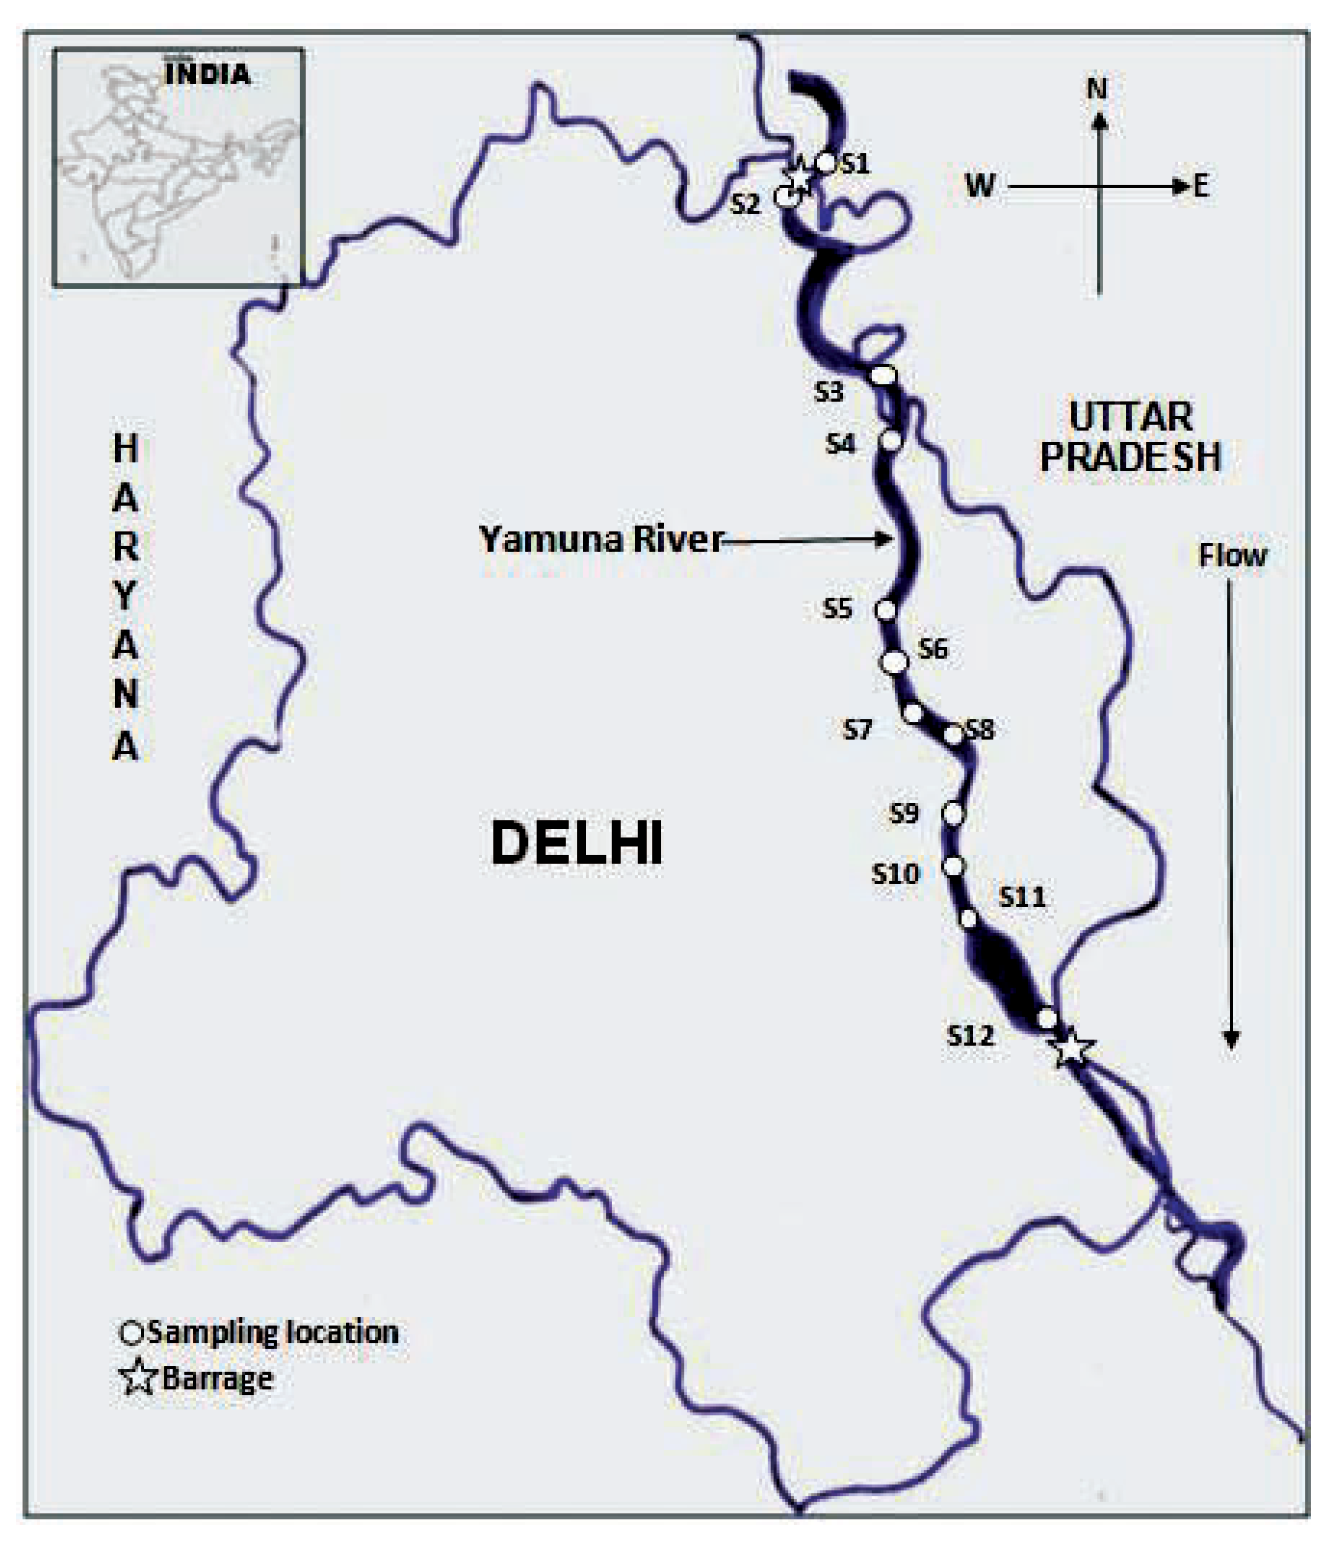
Figure 1. Map showing sampling locations on the Yamuna River in Delhi, India.
Jox 02 e6 g001
Figure 2. Station-wise distribution of total % of polychlorinated biphenyl homolog in Yamuna River water.
Jox 02 e6 g002
Figure 3. Station-wise distribution of total hexachlorocyclohexane, dichlorodiphenyltrichloroethane and polychlorinated biphenyls in Yamuna River water.
Jox 02 e6 g003
Table 1. Concentration of polychlorinated biphenyl congeners in Yamuna River water from Delhi, India.
Jox 02 e6 g004
Table 2. Concentration of polychlorinated biphenyl homolog and their percentage in Yamuna River water.
Jox 02 e6 g005
Table 3. Toxic equivalency of dioxin-like polychlorinated biphenyls in Yamuna River water (pg World Health Organization-toxic equivalent quantities L-1).
Jox 02 e6 g006
Table 4. Concentration of organochlorine pesticides in Yamuna River water.
Jox 02 e6 g007
Table 5. Ratio of hexachlorocyclohexane and dichlorodiphenyltrichloroethane isomers in Yamuna River water.
Jox 02 e6 g008
Table 6. Global comparison of concentration of organochlorines in surface water (ng/L).
Jox 02 e6 g009