


Abstract
The development of new corn varieties is necessary to meet the corn demand. Using full diallel crosses is a method for developing high-yielding hybrid corn. This development requires systematic selection methods that incorporate various approaches in developing selection indices. This study aimed to develop a selection index concept for two full diallel cross populations and select potential hybrid crosses for preliminary yield evaluation. The study involved two populations of 100 corn seed genotypes from full diallel crosses (90 F1 genotypes and 10 selfing elders) and five check varieties per population, planted using a Type II Augmented RCBD in eight blocks. Agronomic characteristics were analyzed using analysis of variance, heritability, factor analysis, and path analysis, with selection criteria aligned with heterotic potential, specific combining analysis, and heterobeltiosis. Analysis revealed significant genetic variation and moderate-to-high heritability for most traits. Correlation, factor, and path analyses identified cob diameter, number of rows per cob, and seeds per row as optimal selection criteria. Selection indices were developed by integrating standard heterosis, specific combining ability, and heterobeltiosis, with weights based on heritability and direct effects. Forty-four hybrid crosses showed potential for preliminary yield tests, with seven having the best final index compared to the reference variety. The p17 × p23 cross had the best potential for the final index. This study demonstrates the effectiveness of integrating multivariate analysis and selection indices in developing superior hybrid corn crosses. Further optimization is recommended through preliminary yield tests and molecular approaches.
1. Introduction
Corn (Zea mays L.) is one of the most important cereal crops worldwide, serving as a source of food, animal feed, and industrial raw material [1,2,3]. It ranks second among major carbohydrate sources worldwide, after wheat, and ahead of rice in Indonesia. It is even a staple food in several regions, such as Madura, Sulawesi, Bali, and East Nusa Tenggara [4]. In addition, corn has high economic and strategic value, as it supports food security and the development of the national agricultural sector.
The demand for corn in Indonesia continues to increase in line with population growth and the development of the food and feed industries. However, increasing production through the expansion of planting areas and improvement of cultivation technology has not been able to meet national demand. This condition has led Indonesia to continue importing corn, thereby increasing the country’s foreign exchange expenditure [5]. Based on data national [6], the yield of dry shelled corn (moisture content 14%) in the last five years (2020–2024) fluctuated between 5.53–5.98 t ha−1, or less than 50% of the potential yield of several superior varieties that can reach 12–13.7 t ha−1. Factors such as climate change (e.g., prolonged droughts due to El Niño) and the conversion of productive land have led to a decline in national yield [7]. Therefore, increasing corn yield through genetic approaches and plant breeding programs is a strategic step.
Plant breeding is one of the main approaches for producing superior varieties with higher yield, better yield quality, and broader environmental adaptation. Hybrid varieties can be produced that have superior performance compared to their parents through crossbreeding between parent crosses [8,9,10]. The effectiveness of breeding is largely determined by understanding genetic parameters, such as gene action, genetic diversity, and heritability, which play a role in determining trait inheritance patterns and selection responses [11]. Several achievements in the effectiveness of corn breeding development in Indonesia have been widely reported, such as by Ulya et al. [12] on early maturity; Priyanto et al. [13] on yield improvement; Amzeri et al. [14] on drought tolerance; and Efendi et al. [15] on low N tolerance. However, the effectiveness of developing hybrid crosses depends on the breeding method. One of the breeding methods widely used for corn is full diallel crossing.
Full diallel crossing is a crossing scheme that allows each parent line to be mated with all available combinations [16]. This approach enables the estimation of general combining ability (GCA) and specific combining ability (SCA), thereby helping breeders identify the best parent combinations for developing superior varieties [8,17,18]. In addition, heterosis and heterobeltiosis, namely, the improvement in F1 hybrid performance relative to the average or best parents, are important biological principles in the development of high-yielding hybrid corn varieties [19]. This method is useful for evaluating the combining ability of parents, understanding trait inheritance, and identifying potential parent combinations for genetic improvement.
The evaluation of crossbred performance is essential for assessing genetic potential, yield, environmental stress tolerance, and yield stability. Through this evaluation, superior agronomic traits, such as growth rate, heterosis value, nutrient absorption efficiency, and yield, can be identified [20,21,22]. The evaluation of crossbred results is an important part of the continuous process of developing superior varieties. In addition, evaluation can identify parents with the potential to be used in subsequent crosses.
Thus, more precise selection traits can be determined in full diallel cross corn populations. A cob-based selection approach supported by genetic, multivariate, and selection index analyses can be a more effective strategy for accelerating the breeding of high-yielding and adaptive corn varieties. The objective of this study was to evaluate the agronomic traits of several full diallel cross corn genotypes to obtain basic information for the development of high-yielding and widely adaptable superior varieties. This study hypothesizes that integrating multivariate genetic parameters from two populations can construct a screening system that is more effective under the tested conditions than a single-population selection index, while acknowledging that conclusions remain specific to these populations and this environment.
2. Materials and Methods
2.1. Experimental Design
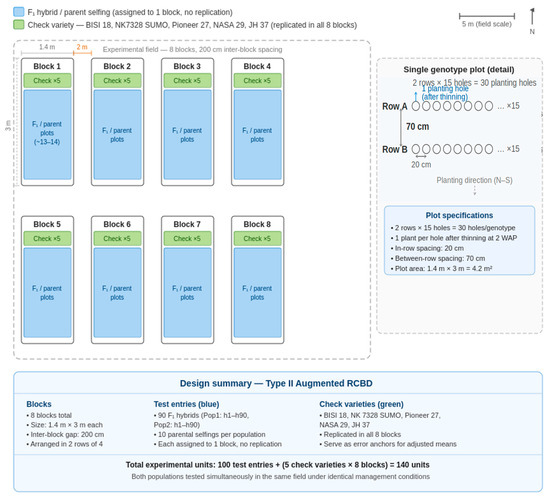
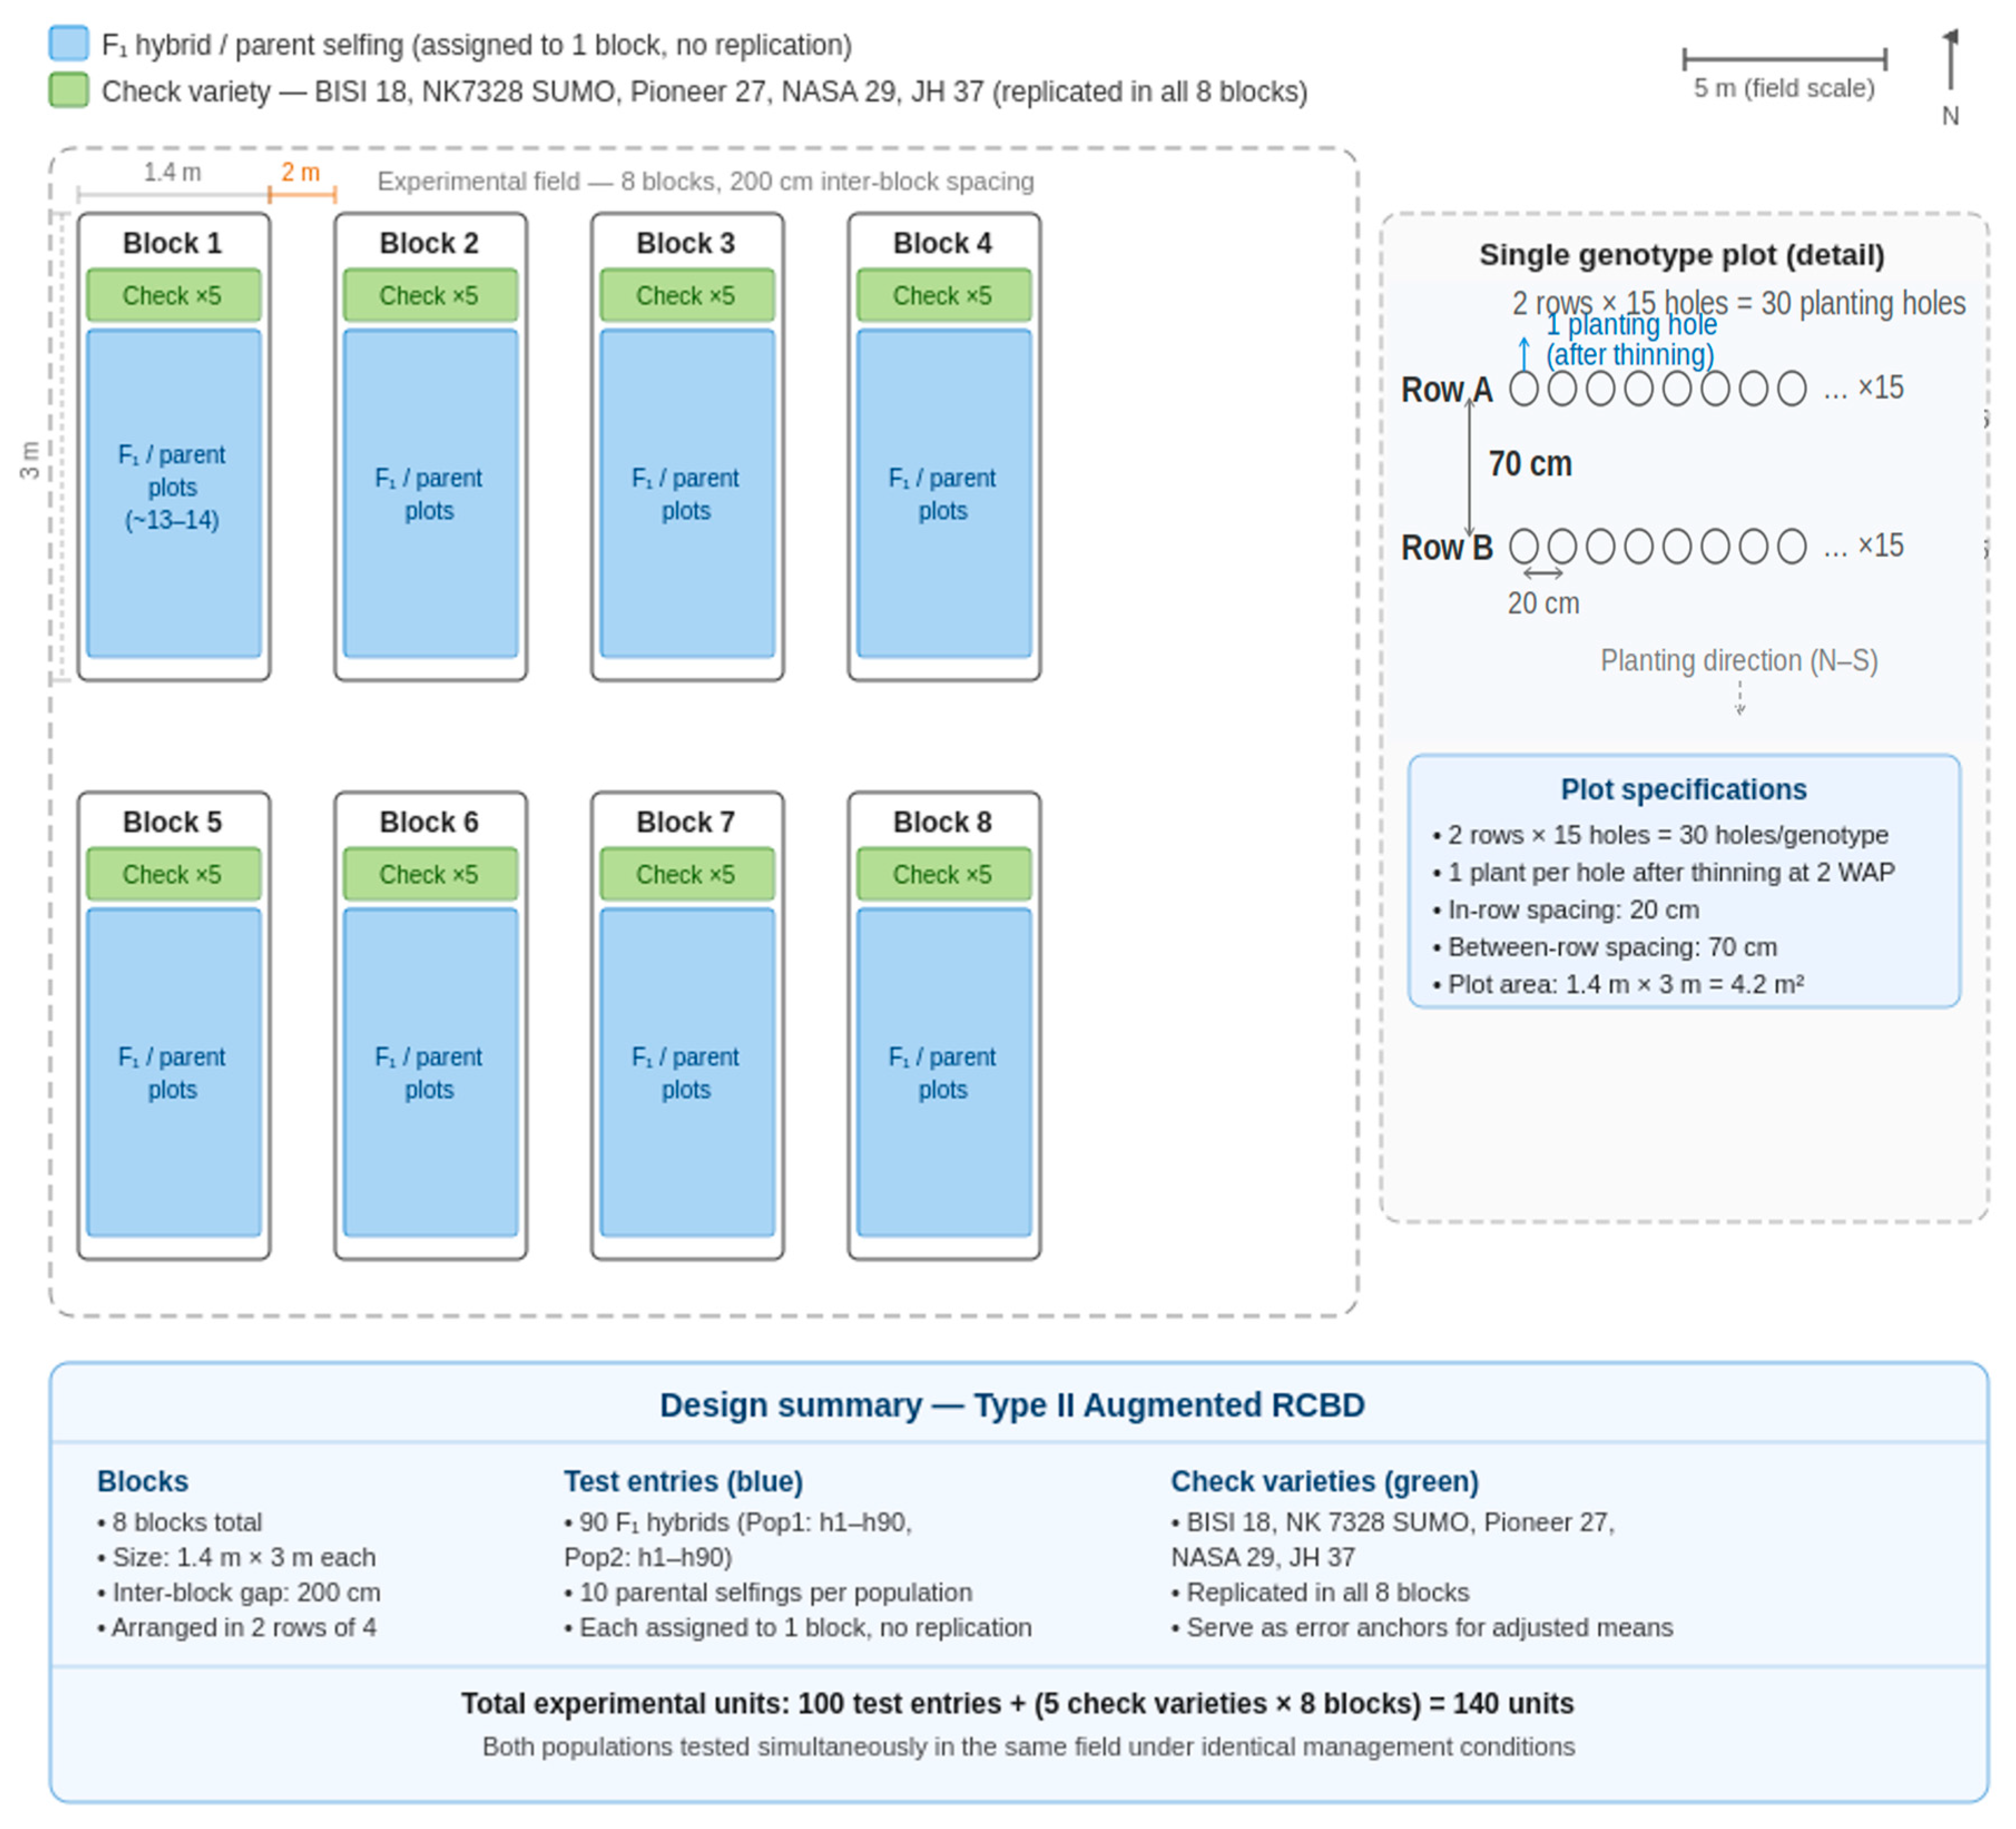
This study was conducted at the Cereal Crop Instrument Testing Center, Bajeng District, Gowa Regency, South Sulawesi, at an altitude of 27.2 m above sea level, with coordinates 5°18′21.5″ S, 119°28′38.6″ E. The study was conducted from July to November 2024. It involved testing 100 corn seed genotypes resulting from full diallel crosses consisting of 90 F1 genotypes, 10 selfing (progenitors), as presented in Table 1 and Table 2, and five corn varieties used as comparators: (BISI 18, NK 7328 SUMO, Pioneer 27, NASA 29, and JH 37). Table 1 and Table 2 have been restructured into the standard full diallel cross matrix format, with parental lines listed as both rows (♀) and columns (♂). Each cell contains the corresponding hybrid combination code or the selfing designation. All genotypes were planted using a Type II Augmented Design (Augmented RCBD) grouped into eight blocks. In this design, check varieties were replicated in all eight blocks to serve as error anchors, whereas the cross genotypes and parents were spread across eight blocks without replication. This resulted in 140 experimental units (Figure 1).
Table 1.
Genotype and parental population 1 results of full diallel cross.
Table 2.
Genotype and parental population 2 results of full diallel cross.
Figure 1.
Schematic layout of the Type II Augmented RCBD experimental field. Blue areas = test genotypes (F1 hybrids and parental selfings), each assigned to one block without replication. Green areas = check varieties (BISI 18, NK 7328 SUMO, Pioneer 27, NASA 29, JH 37), replicated across all eight blocks as error anchors. Each block measures 1.4 m × 3 m. Inter-block spacing = 200 cm. Detail panel (right): single genotype plot configuration showing 2 rows × 15 planting holes = 30 holes per genotype, spacing 20 cm × 70 cm, one plant per hole after thinning at 2 weeks after planting.
2.2. Procedural Design
Land preparation began with clearing the land of weeds and plowing. The land was then divided into eight blocks, each measuring 1.4 m × 3 m, with 200 cm between blocks. Each genotype was planted with 30 plants in two rows. Each planting hole was planted with two seeds, spaced 20 cm apart, 70 cm apart. After two weeks, thinning and replanting were conducted in each planting hole, leaving only one plant per hole.
The maintenance activities conducted in this study included fertilization, irrigation, weeding, hoeing, pest and disease control, and insect control. Fertilization was conducted twice using urea, SP36, and Phonska fertilizers at 7–10 days after planting (DAP) and 35–40 DAP. Watering was conducted every seven days until harvest, depending on weather conditions. Weeding was conducted at 10 DAP and 35 DAP by removing weeds around the corn plants. Hilling was conducted when the plants were 35 days old by raising the ridges and loosening the soil. Pest and disease control was conducted by spraying pesticides. Harvesting was conducted when the cobs had reached physiological maturity (black spots at the base of the seeds) or approximately 100 days after planting.
2.3. Observation Data
The observations were focused on quantitative characteristics. Data were recorded through field observations in each experimental subplot. The data observed consisted of several parameters, namely plant height (cm), number of leaves (leaves), stem diameter (mm), cob height (cm), male flowering age (DAP), female flowering age (DAP), anthesis silking interval (ASI) (days), harvest age (DAP), husk closure (score), cob diameter (mm), cob length (cm), seed cob length (cm), number of seeds per row (rows), number of seed rows (rows), weight of 1000 seeds (g), seed yield (%), and yield (t.ha−1) [23,24].
2.4. Data Analysis
Data obtained from all observation variables were analyzed using analysis of variance (ANOVA) in accordance with the augmented design to test for differences among genotypes. The mean square values from the ANOVA were used to calculate genetic variance, phenotypic variance, and broad-sense heritability to assess the influence of genetic factors on character expression. Spearman’s correlation analysis was used to identify relationships between characters, while path analysis was used to separate the direct and indirect effects of variables on the results. In addition, heterosis and heterobeltiosis analyses were performed to evaluate the superiority of hybrids compared with the mean of their parents and the best parents. All analyses were performed using SAS 9.0 software for ANOVA and STAR-R version 2.0.1 for correlation analysis and genetic parameter estimation [25,26].
In the augmented design, the additive formula model used for data analysis is expressed as follows:
In this augmented design, the treatment effect (τj) encompasses two structurally distinct genotype categories, which are handled differently in the analysis. Check varieties (five commercial hybrids: BISI 18, NK 7328 SUMO, Pioneer 27, NASA 29, and JH 37) were replicated across all eight blocks, allowing estimation of the experimental error variance directly from check performance. Test genotypes (90 F1 hybrids and 10 parental selfings) were each assigned to a single block without replication; their adjusted means were obtained by correcting observed block values against the check-derived block effects (βi). The specific additive model for the augmented RCBD design is now fully stated as: Yij = μ + βi + τj + εij (Equation (1)), with explicit explanation of how the treatment effect τj is partitioned between replicated check varieties and unreplicated test genotypes in the augmented design [27].
where:
Yij = μ + βi + τj + εij
Yij = observation value in block i and genotype/treatment j
μ = overall mean
βi = effect of block i
τj = effect of treatment/genotype j
εij = experimental error
Variance components were estimated using the ANOVA-based method (Method of Moments), which is appropriate for the augmented RCBD structure where check varieties provide replicated observations and test genotypes appear in only one block. Genetic variance (σ2g) and phenotypic variance (σ2p) were estimated from the expected mean squares (EMS) of the augmented ANOVA table as follows:
H2 = σ2g/σ2p × 100%, where σ2g = (MSgenotype − MSerror)/r and σ2p = σ2g + σ2e
Justification for using the ANOVA-based Method of Moments (rather than REML) is provided. This ANOVA-based approach was selected over REML because: (i) REML requires balanced replication or large datasets to achieve stable convergence, which is not guaranteed under an augmented design with unreplicated test entries; (ii) the ANOVA Method of Moments provides unbiased estimates of variance components under the fixed-effects framework appropriate for the augmented design; and (iii) all computations were performed in SAS 9.0 using PROC GLM with the augmented design syntax, consistent with Bančič et al. [27].
Correlation analysis was calculated using the Pearson product–moment correlation technique with the following formula:
where:
r: Pearson correlation coefficient
n: number of pairs of X and Y values
∑xy: sum of the products of X and Y values
∑x: sum of X values
∑y: sum of Y values
∑x2: sum of squares of X values
∑y2: sum of squares of Y values
The value of r is the linear strength. The correlation value is in the interval − 1 ≤ r ≤ 1. The + and − signs indicate the direction of the relationship. The critical values for significance were determined based on df = 138 (n = 140), derived from the standard two-tailed t-distribution table. The correlation value range is as follows: r < 0.166 (either + or −) indicates no significant correlation; 0.166 ≤ r ≤ 0.217 (either + or −) indicates significant correlation (p < 0.05); and r > 0.217 (either + or −) indicates very significant correlation (p < 0.01).
Prior to path analysis, all trait variables were standardized using Z-score transformation within each population independently (standardized value = (observed value − population mean)/population standard deviation, yielding mean = 0 and SD = 1 for each trait, applied independently within each population). This standardization was applied to: (i) eliminate the influence of differing measurement scales and units across traits (e.g., mm for cob diameter vs. rows for NSR); (ii) ensure that path coefficients (direct effects) are dimensionless and directly comparable in magnitude within each population; and (iii) facilitate cross-population comparison of relative trait importance without bias from scale differences. Because path analysis uses the Pearson correlation matrix as its input (Equation 4), which is itself derived from standardized variables, the resulting path coefficients are equivalent to standardized partial regression coefficients. Population-specific interpretation is therefore appropriate and intentional, as each population’s coefficients reflect standardized effects within its own variance structure.
Based on this equation, the value of C (direct effect) can be calculated using the following formula:
where:
Rx: correlation matrix between independent variables
: inverse of matrix Rx
C: vector of cross coefficients that show the direct effect of each independent variable on the dependent variable
Ry: correlation coefficient vector between the independent variable Xi and the dependent variable
Heterosis (%) and heterobeltiosis (%), calculated using the following formula:
where:
Ht (%): Heterosis to two parents
Hb (%): Heterobeltiosis to the best parent
F1: Average value of the first-generation hybrid
MP: Average value of the two parents
HP: Value of the best parent
µ: Population average
The final index (FI/fertility index) is calculated as the arithmetic mean of three standardized component scores (Equation (7)).
Each component score is computed by applying the population-specific linear selection index formula (derived in Section 3.5) to the raw values of each hybrid cross for the corresponding heterotic criterion, as follows:
Step 1—Compute I_Het_stand: For each hybrid, substitute its standard heterosis values (Het_yield, Het_CD, Het_NSpR, Het_NSR) into the population-specific formula. For Population 1: I_Het_stand = 0.65 × Het_yield + 0.16 × Het_CD + 0.29 × Het_NSpR + 0.11 × Het_NSR. For Population 2: I_Het_stand = 0.44 × Het_yield + 0.22 × Het_CD + 0.14 × Het_NSpR + 0.12 × Het_NSR.
Step 2—Compute I_SCA: Substitute SCA values (SCA_yield, SCA_CD, SCA_NSpR, SCA_NSR) for each hybrid into the same population-specific formula.
Step 3—Compute I_Heterobel: Substitute heterobeltiosis values (Hb_yield, Hb_CD, Hb_NSpR, Hb_NSR) for each hybrid into the same formula.
Step 4—Compute FI: FI = (I_Het_stand + I_SCA + I_Heterobel)/3.
For cross-population ranking, all hybrids from both populations are ranked on a single FI scale. Because each population’s formula is applied to its own hybrids using population-internal standardization, the resulting I values reflect relative performance within each population and are therefore comparable in magnitude when averaged into FI.
The weight assigned to each selection criterion was calculated as the product of the population-specific broad-sense heritability (H2) and the standardized direct effect from path analysis (C). This simplified approach was selected over the complete Smith–Hazel matrix method for the following reasons: (i) the Type II Augmented RCBD with unreplicated test entries does not provide sufficient degrees of freedom to estimate off-diagonal genetic covariance components (Cov(gi,gj)) reliably, as only check varieties contribute replicated observations for error estimation; (ii) inversion of an unstable G matrix would introduce substantial estimation error into the index weights, potentially reducing rather than improving selection accuracy; (iii) H2 × direct effect integrates both the reliability of trait measurement (heritability) and the magnitude of each trait’s contribution to yield (direct effect), providing a biologically meaningful and computationally stable weighting scheme appropriate for the current experimental stage. We acknowledge that this simplification may not account for redundant information between correlated traits (e.g., CD and NSpR, r = 0.68). However, because the path analysis already partitions direct and indirect effects through matrix inversion of the trait correlation matrix (Rx−1), the redundancy between predictors is partially resolved at the path coefficient stage before weighting is applied.
3. Results
3.1. Analysis of Variance
The results of the genetic variance and heritability analyses for the two full diallel populations are shown in Table 3. In general, both full diallel populations had moderate-to-high heritability patterns for all traits, except for stem diameter and ear height in the first full diallel population, and the number of leaves and harvest age in the second population. However, the two diallel populations had different heritability category patterns for each character. Plant height, anthesis slinking interval, and SCL showed moderate heritability in both populations. Male flowering age, female flowering age, PK, and yield were classified as highly heritable in both populations. Other traits showed differences in heritability categorization between the two full diallel cross populations. Traits with high heritability in the second diallel population were ear height, ear length, NSpR, B1000 S, and yield. Conversely, traits with independent high heritability in the second full diallel population were cob diameter and NSR.
Table 3.
Genotype variance (σ2g), phenotype variance (σ2p), and heritability (H2) in both full diallel populations.
3.2. Correlation Analysis
The results of the correlation analysis in the first and second diallel populations are shown in Table 4. The correlation was focused on yield. Based on these correlations, plant height, number of leaves, stem diameter, ear height, ear diameter, ear length, ear length with husks, number of rows per ear, and number of seeds per row were significantly positively correlated with yield. Conversely, ASI was significantly negatively correlated with yield. Based on the potential of the second full diallel population, the characteristics of the number of leaves, stem diameter, cob diameter, cob length, number of rows per cob, number of seeds per row, and seed yield were significantly positively correlated with yield. These characteristics were used as a reference in a more in-depth analysis in this study.
Table 4.
Correlation between growth characteristics and yield in both full diallel populations.
3.3. Factor Analysis Between Growth Traits
The results of the factor analysis for each population are shown in Table 5. Based on this table, four dimensional factors can represent the diversity in the full diallel populations of both populations. In the factor analysis of the first full diallel population, the highest yield diversity was found in the first factor dimension. The characteristics of cob diameter, number of rows per cob, and number of seeds per row showed diversity above 0.2 and were in line with the yield in factor dimension 1. Based on the second full diallel population, yield diversity was also centered on factor 1. The characteristics of cob diameter, number of rows per cob, and number of seeds per row also exhibit diversity above 0.2. They are directly proportional to yield in the first dimension.
Table 5.
Analysis of growth factors correlated with yield in both full diallel population.
3.4. Path Analysis of Selected Characters on Yield
The cross-analysis results are presented in Table 6 and Table 7. The table combines data from both full diallel populations. Based on the analysis results, the number of seeds per row (NSpR) was the characteristic with the highest direct effect (0.44), followed by cob diameter (CD; 0.34 and 0.35) and number of seed rows (NSR; 0.22 and 0.23). Among the secondary characteristics, cob diameter had the greatest indirect influence through its correlations with other yield components.
Table 6.
Path analysis of selected characters on yield in Population 1 (parents p1–p10).
Table 7.
Path analysis of selected characters on yield in Population 2 (parents p15–p31).
3.5. Selection Index
The results of the selection index analysis for standard heterosis, specific combining ability, and heterobeltiosis are shown in Table 8. The combination of these three indices adjusts for the weighting of the independent heritability potential in each population and its direct effect. r = 0.72 (p < 0.01), confirming that the final index is a significant predictor of yield performance. The imperfect correlation (r < 1.0) is expected and intentional—the FI incorporates SCA and heterobeltiosis components that measure hybrid-specific combining ability and parental superiority, not yield alone. This multi-trait nature is the index’s key advantage over a univariate yield ranking.
Table 8.
Heterosis standard, specific combining ability (SCA), heterobeltiosis, and fertility index (FI) values of 48 maize hybrid combinations.
Based on this weighting combination (weighting = heritability × direct effect), the index formulation obtained for each potential aspect is:
Population 1 = 0.65 heritability × 1 direct effect × yield + 0.48 heritability
× 0.34 direct effect × CD + 0.66 heritability × 0.44 direct effect NSpR
+ 0.49 heritability × 0.23 direct effect NSR
= 0.65 yield + 0.16 CD + 0.29 NSpR + 0.11 NSR
× 0.34 direct effect × CD + 0.66 heritability × 0.44 direct effect NSpR
+ 0.49 heritability × 0.23 direct effect NSR
= 0.65 yield + 0.16 CD + 0.29 NSpR + 0.11 NSR
Population 2 = 0.44 heritability × 1 direct effect × yield + 0.63 heritability
× 0.34 direct effect CD + 0.32 heritability × 0.44 direct effect NSpR
+ 0.52 heritability × 0.23 direct effect NSR
= 0.44 yield + 0.22 CD + 0.14 NSpR + 0.12 NSR
× 0.34 direct effect CD + 0.32 heritability × 0.44 direct effect NSpR
+ 0.52 heritability × 0.23 direct effect NSR
= 0.44 yield + 0.22 CD + 0.14 NSpR + 0.12 NSR
Weights are population-specific (weight = H2 × direct effect, where H2 reflects the genetic reliability of the trait and direct effect reflects its contribution to yield). For NSpR: Population 1 H2 = 66.45% × direct effect 0.44 = 0.29; Population 2 H2 = 32.08% × direct effect 0.44 = 0.14. The difference is biologically meaningful, reflecting lower genetic determination of NSpR in Population 2 parental lines.
The final index results show that P1 is the reference variety with the highest value and P5 with the lowest positive value. Conversely, the reference variety P4 has a negative index value. P4 (NASA 29) is excluded from this table as its final index value was negative (FI = −0.15), serving only as the lower reference boundary. Based on a comparison of the ranking of reference varieties, 44 hybrid crosses have positive values and are better than the reference variety P5. The top seven crosses are defined as those with FI exceeding the FI of the reference variety P1 (BISI 18, FI = 1.11): specifically, p17×p23 (FI = 1.55), p3×p1 (FI = 1.53), p16×p27 (FI = 1.45), p21×p16 (FI = 1.45), p17×p26 (FI = 1.43), p16×p24 (FI = 1.32), and p28×p16 (FI = 1.25). The p17×p23 cross had the best final index potential (FI = 1.55). A Mann–Whitney U test confirmed that the top seven crosses had significantly higher FI values than the bottom seven crosses (U = 49, p < 0.001), supporting the validity of the FI-based ranking. Bootstrapped 95% confidence intervals (n = 1000 iterations) for the top seven FI values are reported in Supplementary Table S3.
Crosses from Population 1 use the Population 1 formula; crosses from Population 2 use the Population 2 formula. FI is the arithmetic mean of the three standardized component indices.
4. Discussion
Analysis of variance and heritability provide initial indications of the effectiveness of a genetic population [27,28]. Accordingly, both full diallel populations exhibited significant genetic variation in the observed agronomic traits. In addition, most of the heritability in both populations fell in the moderate-to-high range. This indicates that most of the traits analyzed are sufficiently influenced by genetics, indicating that the selection response conducted on the full diallel hybrid populations is effective. However, the two populations had different patterns of diversity and heritability. This is realistic, considering that the two populations had different genetic compositions. The heritability of stem diameter in Population 1 (H2 = 40.4%) versus Population 2 (H2 = 8.34%) reflects the difference in genetic composition and diversity among parental lines used in each population. Population 1 parents were selected from a broader and more divergent germplasm base, generating greater genetic variance (σ2g = 0.31) for this trait. In contrast, Population 2 parents may share more similar genetic backgrounds for stem architecture, resulting in a narrow genetic variance (σ2g = 0.18) relative to environmental variance (σ2p = 2.18). According to Anshori et al. [25] and Rahimi and Hernandez [26], parental diversity directly determines the genetic variance of derived populations. The higher the diversity and heritability produced in agronomic traits, the more effective are the parents involved in the full diallel crossbreeding. Accordingly, the parents in population 1 were more effective at generating genetic diversity than those in population 2; therefore, the breeding strategy for both populations should account for their genetic potential. However, several traits, such as male and female flowering age and yield, exhibited stable, high heritability. Nevertheless, these three traits cannot yet be used as effective selection criteria because they must be directly related to the breeding objective, which in this case is yield. Therefore, the results of this analysis are part of the correction in determining the selection criteria, which are analyzed in depth using the multivariate concept.
The concept of multivariate analysis in determining breeding selection criteria has been widely reported to be effective, including for corn [29]. The selection concept at this stage focuses on three analyses: correlation analysis, factor analysis, and path analysis [30,31,32]. The combination of these three analyses has been widely reported to be effective, including for corn. However, its use in testing two full diallel populations has never been conducted. In contrast, the use of this concept is important for accurately predicting the potential selection criteria, especially when selection is carried out simultaneously on full diallel populations with different genetic constructs. This indicates that the potential diversity of the two populations must be integrated so that the selection criteria are modified by an intersection of factor analysis and the general integration of path analysis across the two populations [33,34]. Based on this modified concept, cob diameter, number of rows of kernels, and number of kernels per row became the optimal selection criteria for accompanying yield in selecting the best hybrids in both full diallel populations.
The effects of cob diameter, number of rows of kernels, and number of kernels per row have been widely reported as important components of yield. In general, cob diameter greatly affects cob volume, which is related to seed space capacity and the weight of a corn cob. In addition, several studies have shown that cob diameter is relatively stable as a selection criterion and is correlated with cob seed weight and yield [35,36]. This indicates that cob diameter is a suitable selection criterion. The number of rows per cob is a quantitative trait that is largely determined by genetic factors, making it effective for use in selection to improve selection response. In addition, this trait is also related to cob diameter potential, and several studies have reported its effectiveness as a corn selection criterion. Meanwhile, the number of kernels per row is also a series of yield components related to cob diameter. This trait determines the effective row length and the total number of kernels per cob, thereby directly affecting cob weight. In addition, this trait reflects pollination efficiency and the plant’s ability to fill kernels; therefore, many studies have used it as a selection criterion. Based on the above explanation, the three characters are interrelated criteria that directly affect yield. The integration of these three characters will provide an efficient and effective basis for selection in high-yielding corn breeding programs [8,21,23]. Therefore, using these three traits, along with yield, will further strengthen the selection of corn hybrid crosses from both full diallel populations.
Cob diameter, number of kernel rows, and number of kernels per row are the main selection criteria because these three aspects are the key determinants of a corn cob’s size and sink capacity. These criteria determine the potential for kernel formation and the number of kernels realized, making them the chief factors influencing yield variance across different genotypes and environments. Physiologically, cob diameter integrates early growth of the female inflorescence, vascular capacity, and hormonal control (auxin/ABA), which collectively establish the tissue growth rate and storage capacity of the cob. This makes it a strong indicator for assimilate accommodation during and after pollination, such that relatively larger cobs can harbor more florets and reduce ovary abortion under source fluctuations (e.g., N or light stress) [37,38,39]. The number of kernel rows is also considered a selection criterion because it sets the upper limit for the number of kernels per cob. This trait determines the number of spikelet bundles, the determinacy of meristems regulated by conserved inflorescence regulators (e.g., the FEA/CLV module, SBP/SPL factors), and newly mapped QTL/haplotypes. Hence, increasing the number of kernel rows expands the potential sink size, provided that source capacity and phloem import can keep pace [40,41]. Meanwhile, the number of kernels per row optimally reflects the realized success of floret survival and fertilization along the cob’s axis. This criterion is highly sensitive to the source–sink balance during flowering and early kernel formation, reflecting carbon and nitrogen status, hormonal signaling (IAA, ABA, ZR), and local metabolite supply (malate, phosphoinositides) that stabilize endosperm initiation [42,43,44]. Based on this, these three traits consistently show a positive relationship with cob weight and yield. Progress in breeding has largely been due to increasing the kernel number per unit area, achieved by improving cob sink capacity while maintaining adequate resources (such as stay-green, increased N uptake/allocation, and tolerance to density) [40,45]. Thus, selection for cob diameter (sink capacity), KRN (potential sink size), and KPR (actualized sink) provides a mechanistic, sink-driven pathway for yield formation. This aligns with the contemporary understanding of source–sink physiology in maize and ear developmental genetics [37,39].
The selection criteria obtained were weighted to refine the selection index. Index weighting is an important factor in determining the priority of a criterion [46,47,48]. In general, several approaches have been used in the development of selection indices, one of which is to consider direct effects and heritability. Akfindarwan et al. [49] and Makmur et al. [50] have reported the utilization of these two aspects. This approach was chosen to integrate the general and specific potential of the two full diallel populations. The general potential is reflected in the direct effect of integrating the two populations, and the specific potential is reflected in their heritabilities. The combination of the two is considered to make the weighting more relevant in the selection process for each population [51,52,53]. Meanwhile, the eigenvalues from factor analysis were not used because the dimension composition differed between the two populations; therefore, specific potential was more optimally assessed using heritability values. The index formulation developed for both populations was used as the standard formulation for standard heterosis and SCA approaches.
The development of the selection index has always focused on the standard heterosis potential of a population. However, the assessment of hybrid crosses needs to be optimized by combining specific combining ability and heterobeltiosis [18,53]. This is because the potential of hybrids depends not only on the general potential of the entire population but also on the specific potential of the combination of the two parents. In general, SCA indicates the potential deviation of crossbreeding results from the expected value based on the overall effect of the parents [17]. Heterobelitosis is a phenomenon in which the performance of a hybrid exceeds that of its best parent [54]. These two aspects are closely related and support a comprehensive assessment of a hybrid’s potential, making them both considerations in this evaluation. Careful consideration of the three approaches is reflected in the final index, which is the average of the overall potential. Based on the final index, 44 hybrid crosses were identified as candidates for further evaluation in preliminary yield tests. In addition, seven of them had the best final index potential compared to the P1 comparison variety; therefore, these seven varieties are highly recommended for testing their GxE potential.
Based on the overall analysis and considerations, this concept serves as the basis for understanding plant breeding, particularly in the context of full diallel utilization. Variations in heritability, correlations between characters, direct effects on yield, and the integration of selection indices form a strong foundation for accelerating the development of superior hybrid corn crosses with optimal yield. The concept of this index represents a new approach compared to existing indices, such as Smith–Hazel, WAAS, or MSTI. These three indices focus only on a single aspect of variance and overall performance potential [54,55]. Although Smith–Hazel also relates to genetic potential, this potential is limited to comparisons between genetic and phenotypic variance matrices [56,57,58,59]. A linear combination of traits using genetic (G) and phenotypic (P) variance–covariance matrices is optimized to maximize the correlation between the index and the breeding goal (H = Σaigi). It is statistically optimal under multivariate normality and known G/P matrices. Application to switchgrass and tomato lines has been reported [32,57]. This differs from the concept developed in this study, as it also emphasizes the potential performance of hybrids relative to their parents through heterobeltiosis and SCA in terms of their combining ability potential.
The development of this concept is subject to several limitations. Three primary interrelated constraints affect the ability to draw conclusions and generalizations: (i) Experiments conducted within a single environment offer only a limited sample from the target environmental population, which can inflate heritability and obscure or underestimate genotype × environment (G × E) and genotype × year (G × Y) interactions; consequently, parameter estimates and stability conclusions must be interpreted contextually because they may shift under different management, planting densities, or seasons (Our weights derive from H2 × direct effect, avoiding G matrix inversion that requires large replication particularly appropriate for augmented designs). A formal cross-validation or held-out validation set was not implemented in this study due to the single-site, single-season augmented design where each test genotype appeared in only one block without replication, making it statistically impossible to partition observations into training and validation subsets without severely reducing statistical power. Under the Type II Augmented RCBD, the replication structure is provided exclusively by check varieties, and test genotypes are evaluated as single observations adjusted by block effects. Cross-validation in such a design would require either multi-site data or a replicated follow-up trial with selected crosses—the latter is precisely the function served by the preliminary yield test recommended for the top 44 candidates [60,61]. (ii) The proposed composite index (FI) differs fundamentally from the classical Smith–Hazel (SH) index [55,56] in its construction and scope. The SH index maximizes the correlation between the linear index and a defined breeding goal by solving the system b = P−1Ga, where P and G are phenotypic and genetic variance–covariance matrices and a is the vector of economic weights. While statistically optimal under multivariate normality and known G and P matrices, the SH approach requires sufficient replication to estimate off-diagonal covariance components reliably a prerequisite that is not met under the Type II Augmented RCBD with unreplicated test entries. In contrast, our composite FI integrates three dimensions of hybrid performance (heterosis, SCA, heterobeltiosis) that the SH index does not address. Simulation studies by Jahufer and Casler [57] and Kumar et al. [58] have demonstrated that Smith–Hazel indices achieve superior prediction accuracy only when full covariance structures are estimable; when G matrix inversion is unstable (as in our design), simplified indices based on direct effects and heritability perform comparably in early-generation screening. Our approach is therefore methodologically appropriate for this experimental stage (iii) The annual stability of the selection index is constrained by temporal environmental variability and G × Y, which necessitates periodic recalibration of index weights and covariance structures using multi-year historical data and the reporting of both year-specific and across-year accuracies (our approach accommodates two populations with independent formulations) [62,63,64,65,66,67]. (iv) Additionally, phenotypic selection should be enhanced through molecular integration—expanding genome-wide association studies (GWAS)/quantitative trait loci (QTL) mapping, multi-omics, and candidate gene validation for cob traits (cob diameter, kernel row number, kernels per row)—to elucidate genetic architecture and strengthen marker–physiology links that justify these traits as key selection targets [41,44]. Notwithstanding these constraints, the proposed concept remains effective for the preliminary selection of multiple hybrids under limited resources and is therefore recommended for the initial-stage-evaluation in maize breeding programs (synthesis on design/limitations and index stability). To verify the stability and generalizability of the proposed selection index and the performance of the top 44 candidate hybrids across environments, we recommend a multi-environment trial (MET) designed as follows: (i) a minimum of three geographically distinct locations representing the major target environments for corn production in South Sulawesi (e.g., lowland irrigated, lowland rainfed, and upland transitional zones); (ii) a minimum of two consecutive cropping seasons (wet and dry seasons) to capture G × Y interaction effects; (iii) an alpha-lattice incomplete block design with three replications per environment, allowing both inter-environment error control and reliable estimation of G × E components through REML-based mixed models; and (iv) inclusion of all five check varieties used in the current study to allow direct comparison of candidate FI rankings with commercial benchmarks across environments. Stability of FI rankings across environments can be assessed using AMMI (Additive Main Effects and Multiplicative Interaction) or GGE biplot analysis [63,64], and index weights may require recalibration using multi-environment heritabilities and covariance components as additional data accumulate.
5. Conclusions
Research on two full-diallelic corn populations concluded that most agronomic traits have moderate-to-high heritability, enabling effective selection responses. Multivariate analysis integrating correlation, factor analysis, and path analysis confirmed that cob diameter, number of seeds per row, and number of seed rows were the main morphological traits that directly affected yield and consistently appeared as key yield components in both populations. The selection index formulation was developed based on the direct influence and heritability of each population, as follows:
Population 1 = 0.65 yield + 0.34 CD + 0.44 NSpR + 0.22 NSR
Population 2 = 0.44 yield + 0.35 CD + 0.44 NSpR + 0.23 NSR
Population 2 = 0.44 yield + 0.35 CD + 0.44 NSpR + 0.23 NSR
The formulation of these indices forms the basis for the creation of standard heterosis indices, specific combining ability, and heterobeltiosis. These three indices are combined into a final index to improve the comprehensiveness of identifying potential high-yield hybrid crosses. Based on this index, 44 potential hybrid cultivars were subjected to preliminary testing, seven of which showed strong potential as superior crosses. Their agronomic traits are shown in Supplementary Tables S1 and S2. Thus, a selection approach based on cob characteristics, supported by multivariate analysis and comprehensive selection indices, provides an efficient and effective basis for developing superior corn hybrids. Further integration with molecular analysis is recommended to improve the accuracy of genetic selection and accelerate the achievement of breeding goals for high-yielding corn adapted to diverse environments.
Supplementary Materials
The following supporting information can be downloaded at: https://www.mdpi.com/article/10.3390/ijpb17060045/s1, Table S1: Agronomic trait means of 16 hybrid candidates and 5 check varieties from Full Diallel Population 1; Table S2: Agronomic trait means of 28 hybrid candidates and 5 check varieties from Full Diallel Population 2; Table S3: Bootstrapped 95% Confidence Intervals for Final Index (FI) values of top-7 hybrid crosses.
Author Contributions
Conceptualization: M.F. (Muhammad Fikri) and M.F. (Muh Farid). Methodology: M.F. (Muhammad Fikri) and M.F. (Muh Farid). Software: M.F.A. and N.A. Validation: M.F. (Muh Farid) and A.N. Formal analysis: M.F.A., A.N., and N.A. Investigation: N.A. and S.A.H. Resources: M.F. (Muhammad Fikri) and M.F. (Muh Farid). Data curation: M.F. (Muhammad Fikri) and N.A. Writing—original draft: All authors. Visualization: M.F.A., M.F. (Muh Farid) and S.A.H. Funding acquisition: M.F. (Muhammad Fikri) and M.F. (Muh Farid). All authors have read and agreed to the published version of the manuscript.
Funding
This study was funded by the Ministry of Education, Culture, Research, and Technology of the Republic of Indonesia through the Collaborative Fundamental Research scheme with the Institute for Research and Community Service under grant number 02209/UN4.22/PT.01.03/2025.
Data Availability Statement
The raw data supporting the findings of this study are available from the corresponding author (M. Farid; farid_deni@yahoo.co.id) upon request. The experimental data were collected from a field trial conducted at the Cereal Crop Instrument Testing Center, Bajeng District, Gowa Regency, South Sulawesi, Indonesia (July–November 2024). Statistical analysis scripts used in SAS 9.0 and STAR-R v2.0.1 are available upon request.
Acknowledgments
We are grateful to the Ministry of Education, Culture, Research, and Technology of the Republic of Indonesia for the Collaborative Fundamental Research Scheme with the Institute for Research and Community Service.
Conflicts of Interest
The authors declare no conflicts of interest, and the funders had no role in the study design, data collection, analyses, or interpretation, manuscript writing, or publication decision.
Abbreviations
The following abbreviations are used in this manuscript:
| GCA | General Combining Ability |
| SCA | Specific Combining Ability |
References
- Fromme, D.D.; Spivey, T.A.; Grichar, W.J. Agronomic Response of Corn (Zea mays L.) Hybrids to Plant Populations. Int. J. Agron. 2019, 2019, 3589768. [Google Scholar] [CrossRef] [Scilit]
- United States Department of Agriculture Foreign Agricultural Service. Indonesia Grain and Feed Update 2024. 2024. Available online: https://www.tridge.com/news/growing-demand-for-corn-in-indonesia-driven--lhbysc (accessed on 16 September 2025).
- Singh, R.P.; Juliana, P.; Huerta-Espino, J.; Govindan, V.; Crespo-Herrera, L.A.; Mondal, S.; Bhavani, S.; Singh, P.K.; He, X.; Ibba, M.S.; et al. Achieving genetic gains in practice. In Wheat Improvement: Food Security in a Changing Climate; Springer International Publishing: Cham, Switzerland, 2022. [Google Scholar] [CrossRef] [Scilit]
- Bahtiar. Maize (Corn) Seed Market—Growth, Trends, COVID-19 Impact, and Forecasts (2023–2028). 2023. Available online: https://www.mordorintelligence.com/industry-reports/maize-corn-seed-market (accessed on 12 March 2026).
- FAO. World Food and Agriculture—Statistical Yearbook 2024, Rome, 2024. Available online: https://openknowledge.fao.org/handle/20.500.14283/cd2971en (accessed on 16 April 2025).
- Statistics Indonesia. Statistical Yearbook of Indonesia; Statistics Indonesia: Jakarta, Indonesia, 2024; p. 790.
- Badr, A.; El-shazly, H.H.; Tarawneh, R.A.; Börner, A. Screening for Drought Tolerance in Maize (Zea mays L.) Germplasm Using Germination and Seedling Traits under Simulated Drought Conditions. Plants 2020, 9, 565. [Google Scholar] [CrossRef] [Scilit]
- Santos, R.D.O.; Gorgulho, B.M.; De Castro, M.A.; Fisberg, R.M.; Marchioni, D.M.; Baltar, V.T. Principal component analysis and factor analysis: Differences and similarities in nutritional epidemiology application. Rev. Bras. Epidemiol. 2019, 22, e190041. [Google Scholar] [CrossRef] [Scilit]
- Boyles, R.E.; Brenton, Z.W.; Kresovich, S. Genetic and genomic resources of sorghum to connect genotype with phenotype in contrasting environments. Plant J. 2019, 97, 19–39. [Google Scholar] [CrossRef] [Scilit]
- Kayad, A.; Sozzi, M.; Gatto, S.; Whelan, B.; Sartori, L.; Marinello, F. Ten years of corn yield dynamics at field scale under digital agriculture solutions: A case study from North Italy. Comput. Electron. Agric. 2021, 185, 106126. [Google Scholar] [CrossRef] [Scilit]
- Habyarimana, E.; Lopez-Cruz, M.; Baloch, F.S. Genomic selection for optimum index with dry biomass yield, dry mass fraction of fresh material, and plant height in biomass sorghum. Genes 2020, 11, 61. [Google Scholar] [CrossRef] [Scilit]
- A’yuninal Ulya, Q.; Amzeri, A.; Suhartono; Chan, C. Yield test of hybrid maize candidates with character of early maturity and high production. EPJ Web Conf. 2025, 344, 01031. [Google Scholar] [CrossRef] [Scilit]
- Priyanto, S.B.; Iriany, R.N.; Makkulawu, A.T.; Jumadi, O. A comprehensive evaluation of the adaptability and stability of promising maize hybrids in Indonesia using different stability approaches. Chil. J. Agric. Res. 2024, 84, 338–348. [Google Scholar] [CrossRef] [Scilit]
- Amzeri, A.; Suhartono; Fatimah, S.; Pawana, G.; Sukma, K.P.W. Combining Ability Analysis in Maize Diallel Hybrid Populations Under Optimum and Drought Stress Conditions. SABRAO J. Breed. Genet. 2024, 56, 476–492. [Google Scholar] [CrossRef] [Scilit]
- Efendi, R.; Ismayanti, R.; Suwarti; Priyanto, S.B.; Andayani, N.N.; Muliadi, A.; Azrai, M. Evaluating agronomic traits and selection of low N-tolerant maize hybrids in Indonesia. AIMS Agric. Food 2024, 9, 856–871. [Google Scholar] [CrossRef] [Scilit]
- Syukur, M.; Maharijaya, A.; Nurcholis, W.; Ritonga, A.W.; Istiqlal, M.R.A.; Hakim, A.; Sulassih, S.; Perdani, A.Y.; Pangestu, A.Y.; Hatta, A.N.N.L.; et al. Biochemical and Yield Component of Hybrid Chili (Capsicum annuum L.) Resulting from Full Diallel Crosses. Horticulturae 2023, 9, 620. [Google Scholar] [CrossRef] [Scilit]
- Sang, Z.-q.; Zhang, Z.-q.; Yang, Y.-x.; Li, Z.-w.; Liu, X.-g.; Xu, Y.-b.; Li, W.-h. Heterosis and heterotic patterns of maize germplasm revealed by a multiple-hybrid population under well-watered and drought-stressed conditions. J. Integr. Agric. 2022, 21, 2477–2491. [Google Scholar] [CrossRef] [Scilit]
- Gaswanto, R.; Kirana, R.; Gunaeni, N. Utilization of local cayenne pure lines for F-1 hybrid breeding program. IOP Conf. Ser. Earth Environ. Sci. 2021, 752, 012042. [Google Scholar] [CrossRef] [Scilit]
- Yu, K.; Wang, H.; Liu, X.; Xu, C.; Li, Z.; Xu, X. Large-Scale Analysis of Combining Ability and Heterosis for Development of Hybrid Maize Breeding Strategies Using Diverse Germplasm Resources. Front. Plant Sci. 2020, 11, 660. [Google Scholar] [CrossRef] [Scilit] [PubMed]
- Amier, N.; Farid, M.; Fuad, M.; Dermawan, R.; Hendra, J. Reproduction and Breeding Yield assessment of F6 generation tomato lines under irrigated and drought environments based on stress tolerance index. Reprod. Breed. 2025, 5, 214–221. [Google Scholar] [CrossRef] [Scilit]
- Padjung, R.; Farid, M.; Musa, Y.; Nasaruddin, N.; Nurfaida, N.; Anshori, M.; Achmad, M.F.; Arinong, A.R.; Amier, N. Yield and vegetation index of different maize varieties and nitrogen doses under normal irrigation. Open Agric. 2025, 10, 20250410. [Google Scholar] [CrossRef] [Scilit]
- Farid, M.; Djufry, F.; Yassi, A.; Anshori, M.F.; Musa, Y.; Nasaruddin; Aqil, M.; Adzima, A.F.; Iswoyo, H.; Jamil, M.H.; et al. Integrated Corn Cultivation Technology Based on Morphology, Drone Imaging, and Participatory Plant Breeding. Sabrao J. Breed. Genet. 2022, 54, 267–279. [Google Scholar] [CrossRef] [Scilit]
- Fikri, M.; Farid, M.; Musa, Y.; Anshori, M.F.; Padjung, R.; Nur, A. Multivariate analysis in the development of technology packages for corn cultivation by adding fertilizer to compost. Chil. J. Agric. Res. 2023, 83, 471–483. [Google Scholar] [CrossRef] [Scilit]
- Abduh, A.D.M.; Padjung, R.; Farid, M.; Bahrun, A.H.; Anshori, M.F.; Nasaruddin; Ridwan, I.; Nur, A.; Taufik, M. Interaction of genetic and cultivation technology in maize prolific and productivity increase. Pak. J. Biol. Sci. 2021, 24, 716–723. [Google Scholar] [CrossRef] [Scilit]
- Anshori, M.F.; Purwoko, B.S.; Dewi, I.S.; Ardie, S.W.; Suwarno, W.B. Selection index based on multivariate analysis for selecting doubled-haploid rice lines in lowland saline prone area. SABRAO J. Breed. Genet. 2019, 51, 161–174. [Google Scholar]
- Rahimi, M.; Hernandez, M.V. A SAS code to estimate phenotypic- genotypic covariance and correlation matrices based on expected value of statistical designs to use in plant breeding. An. Acad. Bras. Cienc. 2022, 94, e20200001. [Google Scholar] [CrossRef] [Scilit]
- Bančič, J.; Gorjanc, G.; Tolhurst, D.J. A framework for simulating genotype by environment interaction using multiplicative models. Theor. Appl. Genet. 2024, 137, 197. [Google Scholar] [CrossRef] [Scilit]
- Oladosu, Y.; Rafii, M.Y.; Abdullah, N.; Magaji, U.; Miah, G.; Hussin, G.; Ramli, A. Genotype × Environment interaction and stability analyses of yield and yield components of established and mutant rice genotypes tested in multiple locations in Malaysia. Acta Agric. Scand. Sect. B Soil Plant Sci. 2017, 67, 590–606. [Google Scholar] [CrossRef] [Scilit]
- Koide, Y.; Sakaguchi, S.; Uchiyama, T.; Ota, Y.; Tezuka, A.; Nagano, A.J.; Ishiguro, S.; Takamure, I.; Kishima, Y. Genetic Properties Responsible for the Transgressive Segregation of Days to Heading in Rice. G3 Genes Genomes Genet. 2019, 9, 1655–1662. [Google Scholar] [CrossRef] [Scilit]
- Fadhli, N.; Farid, M.; Rafiuddin; Efendi, R.; Azrai, M.; Anshori, M.F. Multivariate analysis to determine secondary characters in selecting adaptive hybrid corn lines under drought stress. Biodiversitas 2020, 21, 3617–3624. [Google Scholar] [CrossRef] [Scilit]
- Musdir, A.Y.; Farid, M.; Ulfa, F.; Anshori, M.F. Mapping of qualitative traits and inheritance patterns on cayenne F 4 lines derived multiple crosses based on frequency and multivariate analysis. Chil. J. Agric. Res. 2024, 84, 513–526. Available online: https://www.scielo.cl/scielo.php?script=sci_arttext&pid=S0718-58392024000400513 (accessed on 6 May 2025).
- Farid, M.; Anshori, M.F.; Mantja, K.; Ridwan, I.; Adnan, A.; Subroto, G. Selection of Lowland Tomato Advanced Lines Using Selection Indices Based on Pca, Path Analysis, and the Smith-Hazel Index. SABRAO J. Breed. Genet. 2024, 56, 708–718. [Google Scholar] [CrossRef] [Scilit]
- Fadhli, N.; Farid, M.; Azrai, M.; Nur, A.; Efendi, R.; Priyanto, S.B.; Nasruddin, A.D.; Novianti, F. Morphological parameters, heritability, yield component correlation, and multivariate analysis to determine secondary characters in selecting hybrid maize. Biodiversitas 2023, 24, 3750–3757. [Google Scholar] [CrossRef] [Scilit]
- Ceccarelli, S.; Grando, S. Diversity as a Plant Breeding Objective. Agronomy 2024, 14, 550. [Google Scholar] [CrossRef] [Scilit]
- Lopez-Cruz, M.; de los Campos, G. Optimal breeding-value prediction using a sparse selection index. Genetics 2021, 218, iyab030. [Google Scholar] [CrossRef] [Scilit]
- Ferdous, T.; Nur, I.J.; Romel, M.H.; Bhuiyan, S.R. The Study on Genetic Variability and Heritability in F4 Population of Rain-fed Rice (Oryza sativa L.). Int. J. Appl. Sci. Biotechnol. 2023, 11, 99–105. [Google Scholar] [CrossRef] [Scilit]
- Mengesha, W.; Menkir, A.; Meseka, S.; Bossey, B.; Afolabi, A.; Burgueno, J.; Crossa, J. Factor analysis to investigate genotype and genotype × environment interaction effects on pro-vitamin A content and yield in maize synthetics. Euphytica 2019, 215, 180. [Google Scholar] [CrossRef] [Scilit]
- Ma, C.; Li, B.; Wang, L.; Wang, Z.; Ye, J.R. Characterization of phytohormone and transcriptome reprogramming profiles during maize early kernel development. BMC Plant Biol. 2019, 19, 197. [Google Scholar] [CrossRef] [Scilit]
- Bernardi, J.; Battaglia, R.; Bagnaresi, P.; Lucini, L.; Marocco, A. Transcriptomic and metabolomic analysis of ZmYUC1 mutant reveals the role of auxin during early endosperm formation in maize. Plant Sci. 2019, 281, 133–145. [Google Scholar] [CrossRef] [Scilit]
- Liu, Z.; Sha, Y.; Huang, Y.; Yuan, L.; Mi, G. Efficient nitrogen allocation and reallocation into the ear in relation to the superior vascular system in low nitrogen tolerant maize hybrid. Field Crops Res. 2022, 284, 108580. [Google Scholar] [CrossRef] [Scilit]
- Lee, E.A.; Tollenaar, M. Physiological basis of successful breeding strategies for maize grain yield. Crop Sci. 2007, 47, S202–S215. [Google Scholar] [CrossRef] [Scilit]
- Zhang, X.; Sun, J.; Zhang, Y.; Jiang, F.; Fan, X. Hotspot regions of QTL and candidate genes for ear related traits in maize: A literature review. Genes 2024, 15, 15. [Google Scholar] [CrossRef] [Scilit]
- Gambín, B.L.; Borrás, L.; Otegui, M.E. Source–sink relations and kernel weight differences in maize temperate hybrids. Field Crops Res. 2006, 95, 316–326. [Google Scholar] [CrossRef] [Scilit]
- Pei, Y.; Deng, Y.; Zhang, H.; Liu, J.; Chen, H. EAR APICAL DEGENERATION1 regulates maize ear development by maintaining malate supply for apical inflorescence. Plant Cell 2022, 34, 2222–2241. [Google Scholar] [CrossRef] [Scilit]
- Shen, X.; Liu, L.; Tran, T.; Zhang, Z.; Zhao, H. KRN5b regulates maize kernel row number through mediating phosphoinositol signalling. Plant Biotechnol. J. 2024, 22, 3427–3441. [Google Scholar] [CrossRef] [Scilit]
- Ciampitti, I.A.; Vyn, T.J. Physiological perspectives of changes over time in maize yield dependency on nitrogen uptake and associated nitrogen efficiencies: A review. Field Crops Res. 2012, 133, 48–67. [Google Scholar] [CrossRef] [Scilit]
- Olivoto, T.; Lúcio, A.D.C.; da Silva, J.A.G.; Sari, B.G.; Diel, M.I. Mean performance and stability in multi-environment trials II: Selection based on multiple traits. Agron. J. 2019, 111, 2961–2969. [Google Scholar] [CrossRef] [Scilit]
- Anshori, M.F.; Musa, Y.; Farid, M.; Jayadi, M.; Padjung, R.; Kaimuddin, K.; Huang, Y.C.; Casimero, M.; Bogayong, I.; Suwarno, W.B.; et al. A comprehensive multivariate approach for GxE interaction analysis in early maturing rice varieties. Front. Plant Sci. 2024, 15, 1462981. [Google Scholar] [CrossRef] [Scilit]
- Akfindarwan, A.K.; Farid, M.; Syaiful, S.A.; Anshori, M.F.; Nur, A. Selection criteria and index analysis for the S2 maize lines of double-crosses. Biodiversitas 2023, 24, 192–199. [Google Scholar] [CrossRef] [Scilit]
- Makmur; Farid, M.; Ala, A.; Mandja, K.; Anshori, M.F.; Fadhilah, A.N. The selection index of S3 corn convergent breeding population based on multivariate analysis. Biodiversitas 2024, 25, 1097–1103. [Google Scholar] [CrossRef] [Scilit]
- Hernández-Leal, E.; Lobato-Ortiz, R.; García-Zavala, J.J.; Hernández-Bautista, A.; Reyes-López, D.; Bonilla-Barrientos, O. Stability and breeding potential of tomato hybrids. Chil. J. Agric. Res. 2019, 79, 181–189. [Google Scholar] [CrossRef] [Scilit]
- Bartaula, S.; Panthi, U.; Timilsena, K.; Acharya, S.S.; Shrestha, J. Variability, heritability and genetic advance of maize (Zea mays L.) genotypes. Res. Agric. Livest. Fish. 2019, 6, 163–169. [Google Scholar] [CrossRef] [Scilit]
- Adewale, S.A.; Akinwale, R.O.; Fakorede, M.A.B.; Badu-Apraku, B. Genetic analysis of drought-adaptive traits at seedling stage in early-maturing maize inbred lines and field performance under stress conditions. Euphytica 2018, 214, 145. [Google Scholar] [CrossRef] [Scilit]
- Avdikos, I.D.; Nteve, G.M.; Apostolopoulou, A.; Tagiakas, R.; Mylonas, I.; Xynias, I.N.; Papathanasiou, F.; Kalaitzis, P.; Mavromatis, A.G. Analysis of re-heterosis for yield and fruit quality in restructured hybrids, generated from crossings among tomato recombinant lines. Agronomy 2021, 11, 822. [Google Scholar] [CrossRef] [Scilit]
- Aboughadareh, A.P.; Khalili, M.; Poczai, P.; Olivoto, T. Stability indices to deciphering the genotype by environment interaction (GEI) effect: An applicable review for use in plant breeding programs. Plants 2022, 11, 414. [Google Scholar] [CrossRef] [Scilit]
- Ambrósio, M.; Daher, R.F.; Santos, R.M.; Santana, J.G.S.; Vidal, A.K.F.; Nascimento, M.R.; Leite, C.L.; de Souza, A.G.; Freitas, R.S.; Stida, W.F.; et al. Multi trait index: Selection and recommendation of superior black bean genotypes as new improved varieties. BMC Plant Biol. 2024, 24, 525. [Google Scholar] [CrossRef] [Scilit]
- Jahufer, M.Z.; Casler, M.D. Application of the Smith–Hazel selection index for improving biomass yield and quality of switchgrass. Crop Sci. 2015, 55, 1212–1222. [Google Scholar] [CrossRef] [Scilit]
- Kumar, R.; Kumar, M.; Gangwar, L.K.; Kumar, V.; Singh, S.; Edhigalla, P.; Rahimi, M. Association and reliability analysis of multi trait selection methods and selection of superior genotypes across the traits in Indian mustard. Sci. Rep. 2025, 15, 23405. [Google Scholar] [CrossRef] [Scilit]
- Werner, C.R.; Gaynor, R.C.; Gorjanc, G.; Hickey, J.M.; Kox, T.; Abbadi, A.; Leckband, G.; Snowdon, R.J.; Stahl, A. How population structure impacts genomic selection accuracy in cross validation: Implications for practical breeding. Front. Plant Sci. 2020, 11, 592977. [Google Scholar] [CrossRef] [Scilit]
- You, F.M.; Song, Q.; Jia, G.; Cheng, Y.; Duguid, S.; Booker, H.; Cloutier, S. Estimation of genetic parameters and their sampling variances for quantitative traits in the type 2 modified augmented design. Crop J. 2016, 4, 107–118. [Google Scholar] [CrossRef] [Scilit]
- Morales, N.; Anche, M.T.; Kaczmar, N.S.; Lepak, N.; Ni, P.; Romay, M.C.; Santantonio, N.; Buckler, E.S.; Gore, M.A.; Mueller, L.A.; et al. Spatio temporal modeling of high throughput multispectral aerial images improves agronomic trait genomic prediction in hybrid maize. Genetics 2024, 227, iyae037. [Google Scholar] [CrossRef] [Scilit]
- Gonçalves, E.; Carrasquinho, I.; Martins, A. Fully and Partially Replicated Experimental Designs for Evaluating Intravarietal Variability in Grapevine. Aust. J. Grape Wine Res. 2022, 2022, 293298. [Google Scholar] [CrossRef] [Scilit]
- Resende, R.T.; Piepho, H.P.; Rosa, G.J.M.; Silva-Junior, O.B.; Silva, F.F.E.; de Resende, M.D.V.; Grattapaglia, D. Enviromics in breeding: Applications and perspectives on envirotypic-assisted selection. Theor. Appl. Genet. 2021, 134, 95–112. [Google Scholar] [CrossRef] [Scilit]
- Smith, A.; Ganesalingam, A.; Lisle, C.; Kadkol, G.; Hobson, K.; Cullis, B. Use of Contemporary Groups in the Construction of Multi-Environment Trial Datasets for Selection in Plant Breeding Programs. Front. Plant Sci. 2021, 11, 623586. [Google Scholar] [CrossRef] [Scilit]
- Vinaykumar, L.N.; Varghese, C.; Harun, M.; Karmakar, S.; Varghese, E.; Jaggi, S. Efficient partially replicated designs for multi-environment early-generation breeding trials. Sugar Tech 2025, 28, 874–884. [Google Scholar] [CrossRef] [Scilit]
- Yang, X.; Shaw, R.K.; Jiang, F.; Wang, G.; Fan, X. Unraveling the genetic basis of maize ear diameter in a multi parent RIL population derived from tropical and temperate germplasms. Theor. Appl. Genet. 2025, 138, 181. [Google Scholar] [CrossRef] [Scilit] [PubMed]
- Liu, J.; Yang, T.; Gao, Z.; Li, J.; Li, T.; Ou, J.; Li, Y.; Zhang, S.; Wang, Y.; Xie, H.; et al. Multi-omics analysis of the maize ear diameter mutant3 (zmed3) provides insights into female inflorescence development. BMC Plant Biol. 2025, 25, 1372. [Google Scholar] [CrossRef] [Scilit] [PubMed]

Disclaimer/Publisher’s Note: The statements, opinions and data contained in all publications are solely those of the individual author(s) and contributor(s) and not of MDPI and/or the editor(s). MDPI and/or the editor(s) disclaim responsibility for any injury to people or property resulting from any ideas, methods, instructions or products referred to in the content. |
© 2026 by the authors. Licensee MDPI, Basel, Switzerland. This article is an open access article distributed under the terms and conditions of the Creative Commons Attribution (CC BY) license.