1. Introduction
Plant mapping refers to characterizing plant structure, distribution, and retention of fruiting structures [
1]. This concept was developed initially for cotton in the early 1900s and evolved into data mapping programs such as COTMAN (COTton MANagement software) [
2] and PMAP (Plant Map Analysis Program) [
3]. Development of similar programs for soybean production would greatly assist with soybean crop management decisions. Earlier studies utilized reporting on vertical fruit distribution [
4], branch versus mainstem fruiting positions [
5,
6,
7], and further inclusion of secondary branches [
8]. Another approach was built upon these methods by developing subsequent analysis solutions [
9], but did not account for the critical facts and tendencies of soybean morphology under stress over time.
From previous physiology studies, it is known that location influences the order of flower development from nodes on the main raceme to those on secondary, tertiary, and sub-branches [
10]. Pods from early flowers, starting on lower nodes, are sinks that consume most of the assimilate supply [
11], leaving limited resources for late flowers developing simultaneously at the top of the mainstem [
10]. Consequently, late-developing pods also have a decreased chance of survival [
11] because of inadequate assimilate supply [
12]. This dynamic impact on fruiting position occurs throughout soybean reproduction, particularly in indeterminate varieties [
13,
14]. Under abiotic or biotic stress, plants may ultimately experience flower or pod abscission at a given location on the plant [
15]. Soybean tolerance to stressors at a given growth stage and duration directly influences seed set retention and reduction [
16]. Understanding the potential underlying mechanisms of yield loss by stress is important when considering the final commodity.
Our methodology provides a composite assessment of plant structure and the overall pattern of growth under moisture stress. This could, in turn, be related to management practices preventing a crop’s negative stress response. A clear understanding of soybean growth and development response in moisture-limited production systems is essential for the efforts of producing soybean efficiently and profitably. Our objective is to present a consistent method for tracking soybean pod positions to quantify yield response to stress.
2. Experimental Procedures
The study was conducted in a controlled environment growth chamber (Percival Modular Control Systems, Boone, IA, USA) to evaluate the physiological effect of moisture-limiting stress on soybeans. The climate was adjusted to only experience variation occurring in correlation with temperatures and lengths during the night at a minimum of 20.0 °C, with an otherwise static environment of 27.8 °C. Day length was set with light range initiating the growing season with 14 h of sunlight and concluding maturity to 11 h. Humidity and carbon dioxide levels fluctuated as humidity ranged between 20 and 40% and CO2 levels varying from 500 to 700 ppm. The soil medium was extracted from a field in Stillwater, OK (36°8′2.67″ N, 97°6′22.158″ W). The soil type was silty loam, with a bulk density of 1.21 g cm−3.
Soybean variety (Pioneer P48A6OX; Pioneer Hi Bred International Johnston, IA, USA) was selected from group IV to represent the major maturity group of southern soybean production. Decagon soil moisture sensors (5TE) were inserted horizontally, two inches from the bottom and edge of a 37 L pot in five pots representing different treatment levels, out of the total sixteen pots used in the experiment. These sensors allowed volumetric water content to be monitored and recorded throughout the duration of the experiment (
Figure A1). After sensors were added, pots were filled with the soil (
Table 1) and watered in layers to reduce the loss of soil structure, and two soybean seeds were planted per pot. At the VC, or the cotyledonary stage, when the unifoliate leaves begin unrolling, the soybean plants were thinned to one plant. Plants remained well watered from VC-R5, or from the stages of unrolled unifoliate leaves to pod-fill, or until a specific plant was at the optimal maturity for a moisture stress treatment.
Treatments included three water-limiting periods and two lengths of moisture stress. The three periods included R2 (Full bloom, when flowers were present in the top four nodes of the plant), R3 (Beginning pod, when a fully developed pod was found on the top four nodes), and R5 (Beginning seed, when seeds touched in inner member of the pods in the top four nodes) (
Table 2). During each of these growth stages (stage), moisture was limited for either 7 or 14 days (duration). Thus, the treatment structure was by stage, and duration was R2:7 days, R2:14 days, R3:7 days, R3:14 days, R5:7 days, and R5:14 days. Additionally, a well-watered control was used, which maintained adequate soil moisture throughout the evaluation period.
Each treatment was replicated four times. Due to space limitations, the experiment had two spatial replications (two replications each evaluation period) and two temporal replications (two replications during two distinct evaluation periods). At the initiation of R5 (beginning seed), pod measurements were taken using digital calipers on each bean from the pod proximal to distal end, pod length, and pod width. These measurements were taken 10 times over the period of thirty days, approximately 3 days apart. Mainstem node, branch number, node on branch, and pod within the node cluster were labeled to create a single plant coordinate system for identification of individual pods for measurements. At the conclusion of each treatment, plants were irrigated to maintain soil moisture between field capacity and saturation until maturity (
Figure 1). The number of pods per mainstem node and branch was recorded for each plant at the beginning of maturity (R7), which did not include shriveled pods (<15 mm width). A pod was denoted as shriveled if it was twisted and small and contained no mature seeds. Thereafter, plants at full maturity (R8) were harvested by removing pods and taking final digital caliper measurements. Seeds were manually shelled, their location classified as individual branches or the mainstem, counted, and air-dried at room temperature.
Statistical analysis was performed using SAS v9.4 (SAS Institute Inc., Cary, NC, USA) to determine the effect of drought stress timing and duration on soybean growth. Drought stress timing and duration were designated as fixed variables, while replication and run were treated as random effects. Two trial runs were conducted for this experiment, and later, the data from both trials were combined to be analyzed together. Four replications represented experimental treatments of stress timing and duration. A one-way ANOVA was conducted using Procedure Mixed, with Fisher’s Protected LSD used to estimate means separation. All analyses were conducted with α ≤ 0.05.
3. Pod Mapping as a Visualization Tool
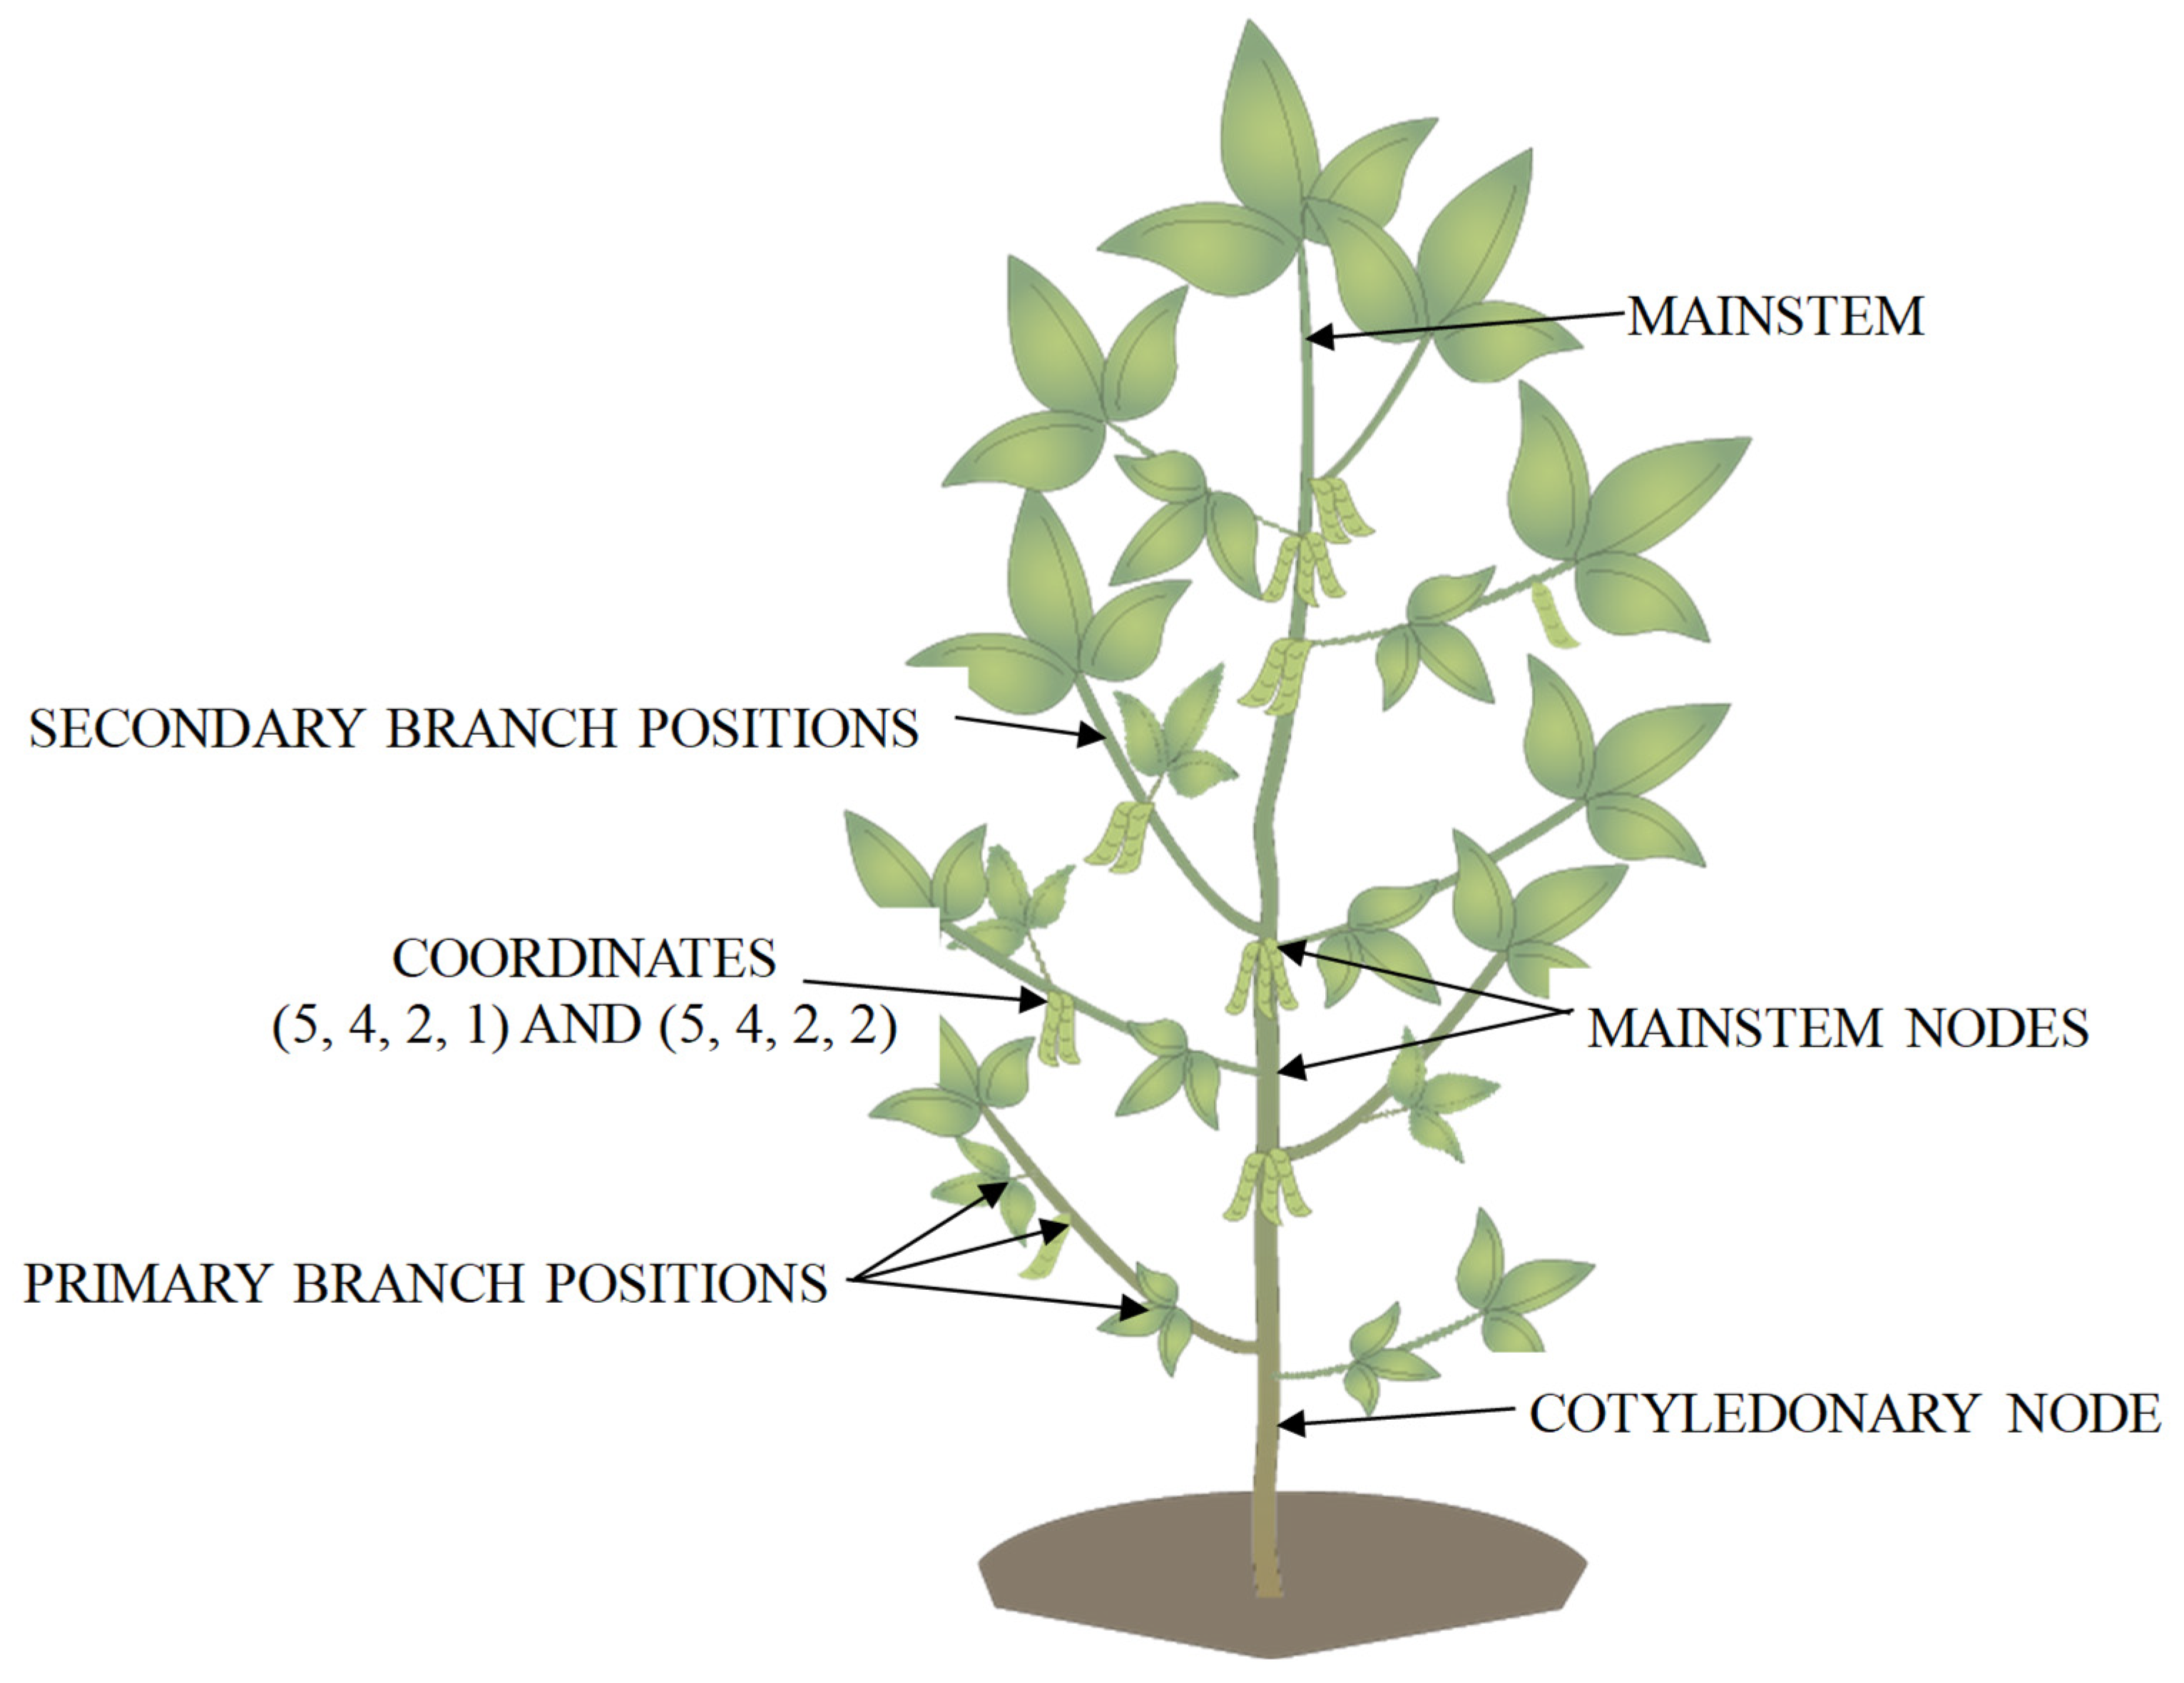
We chose to use procedures following the Cartesian coordinate principle in a three-dimensional space. A coordinate system specifies each unique point on the soybean plant by a set of numerical coordinates (
Figure 2). Here, the unique point is the location of a single pod on the plant. The Cartesian coordinates of a point, or pod, are written in parentheses and separated by commas, as in (w, x, y, z). This is based on the reference point of the origin. In our system, we classified the origin as the soil surface, essentially the base position of the plant. To move to any position from the cotyledonary node, or position 1, the number of nodes along the mainstem is counted. For example, if you desire to track a pod on the mainstem, on the fifth node, its position will simply be that corresponding mainstem node number as the first position in the coordinate (5, x, y, z). When extending to a primary branch, the mainstem node will remain in the first position in the coordinate, while the branch will correspond with the order it appears from the mainstem. For example, if you are interested in a pod located on the fourth branch of a soybean plant and that branch originates from the fifth mainstem node, the coordinate will be (5, 4, y, z). Many times, when pods are located on further nodes distally on the primary branch or on a secondary branch node, the branch nodes will be counted from the mainstem out until the pod position is indicated to account for this third position. To build upon the previous example, if the pod is on the second branch node, the coordinate position will be (5, 4, 2, z). Lastly, the final position in the coordinate system indicates a given pod within that position on the soybean plant. As pods and individual beans within each pod compete for sink resources, it’s critical to understand the dynamics of all pods on the same node. If there are two pods located at our node of interest, the first and second pods will be denoted as (5, 4, 2, 1) and (5, 4, 2, 2), respectively. This encoding system allows to complete reconstruction of the soybean’s structure, and their stress responses can be quickly and accurately assessed on the whole plant. Moreover, the complete positional distribution of individual pods allows for tracking of morphological responses throughout reproduction and impacts final yield.
In this study, the impact of simulated moisture stress by stage, duration of treatments on yield and the location of pods on the mainstem or branches, was of interest and will be discussed. When moisture stress was experienced at R2:7, yield did not significantly differ from the non-treated check (NTC) at 10.8 g plant
−1 but did exhibit higher yields at 16.5 g plant
−1 (
Table 3). Treatment R3:7 compared to the NTC was significantly different, with a yield of 6.7 g plant
−1 and 10.8 g plant
−1, respectively (
Table 3). When moisture stress duration was extended an additional seven days for R3:14, yield decreased to 1.0 g plant
−1 (
Table 3). Yield of the R5:7 treatment was 4.9 g plant
−1 and was significantly different from the NTC of 10.8 g plant
−1 (
Table 3). These findings are in agreement with Kranz and Specht [
14] that soybean sensitivity to moisture stress is minimal during flowering, increases at pod development, and is most sensitive at seed fill.
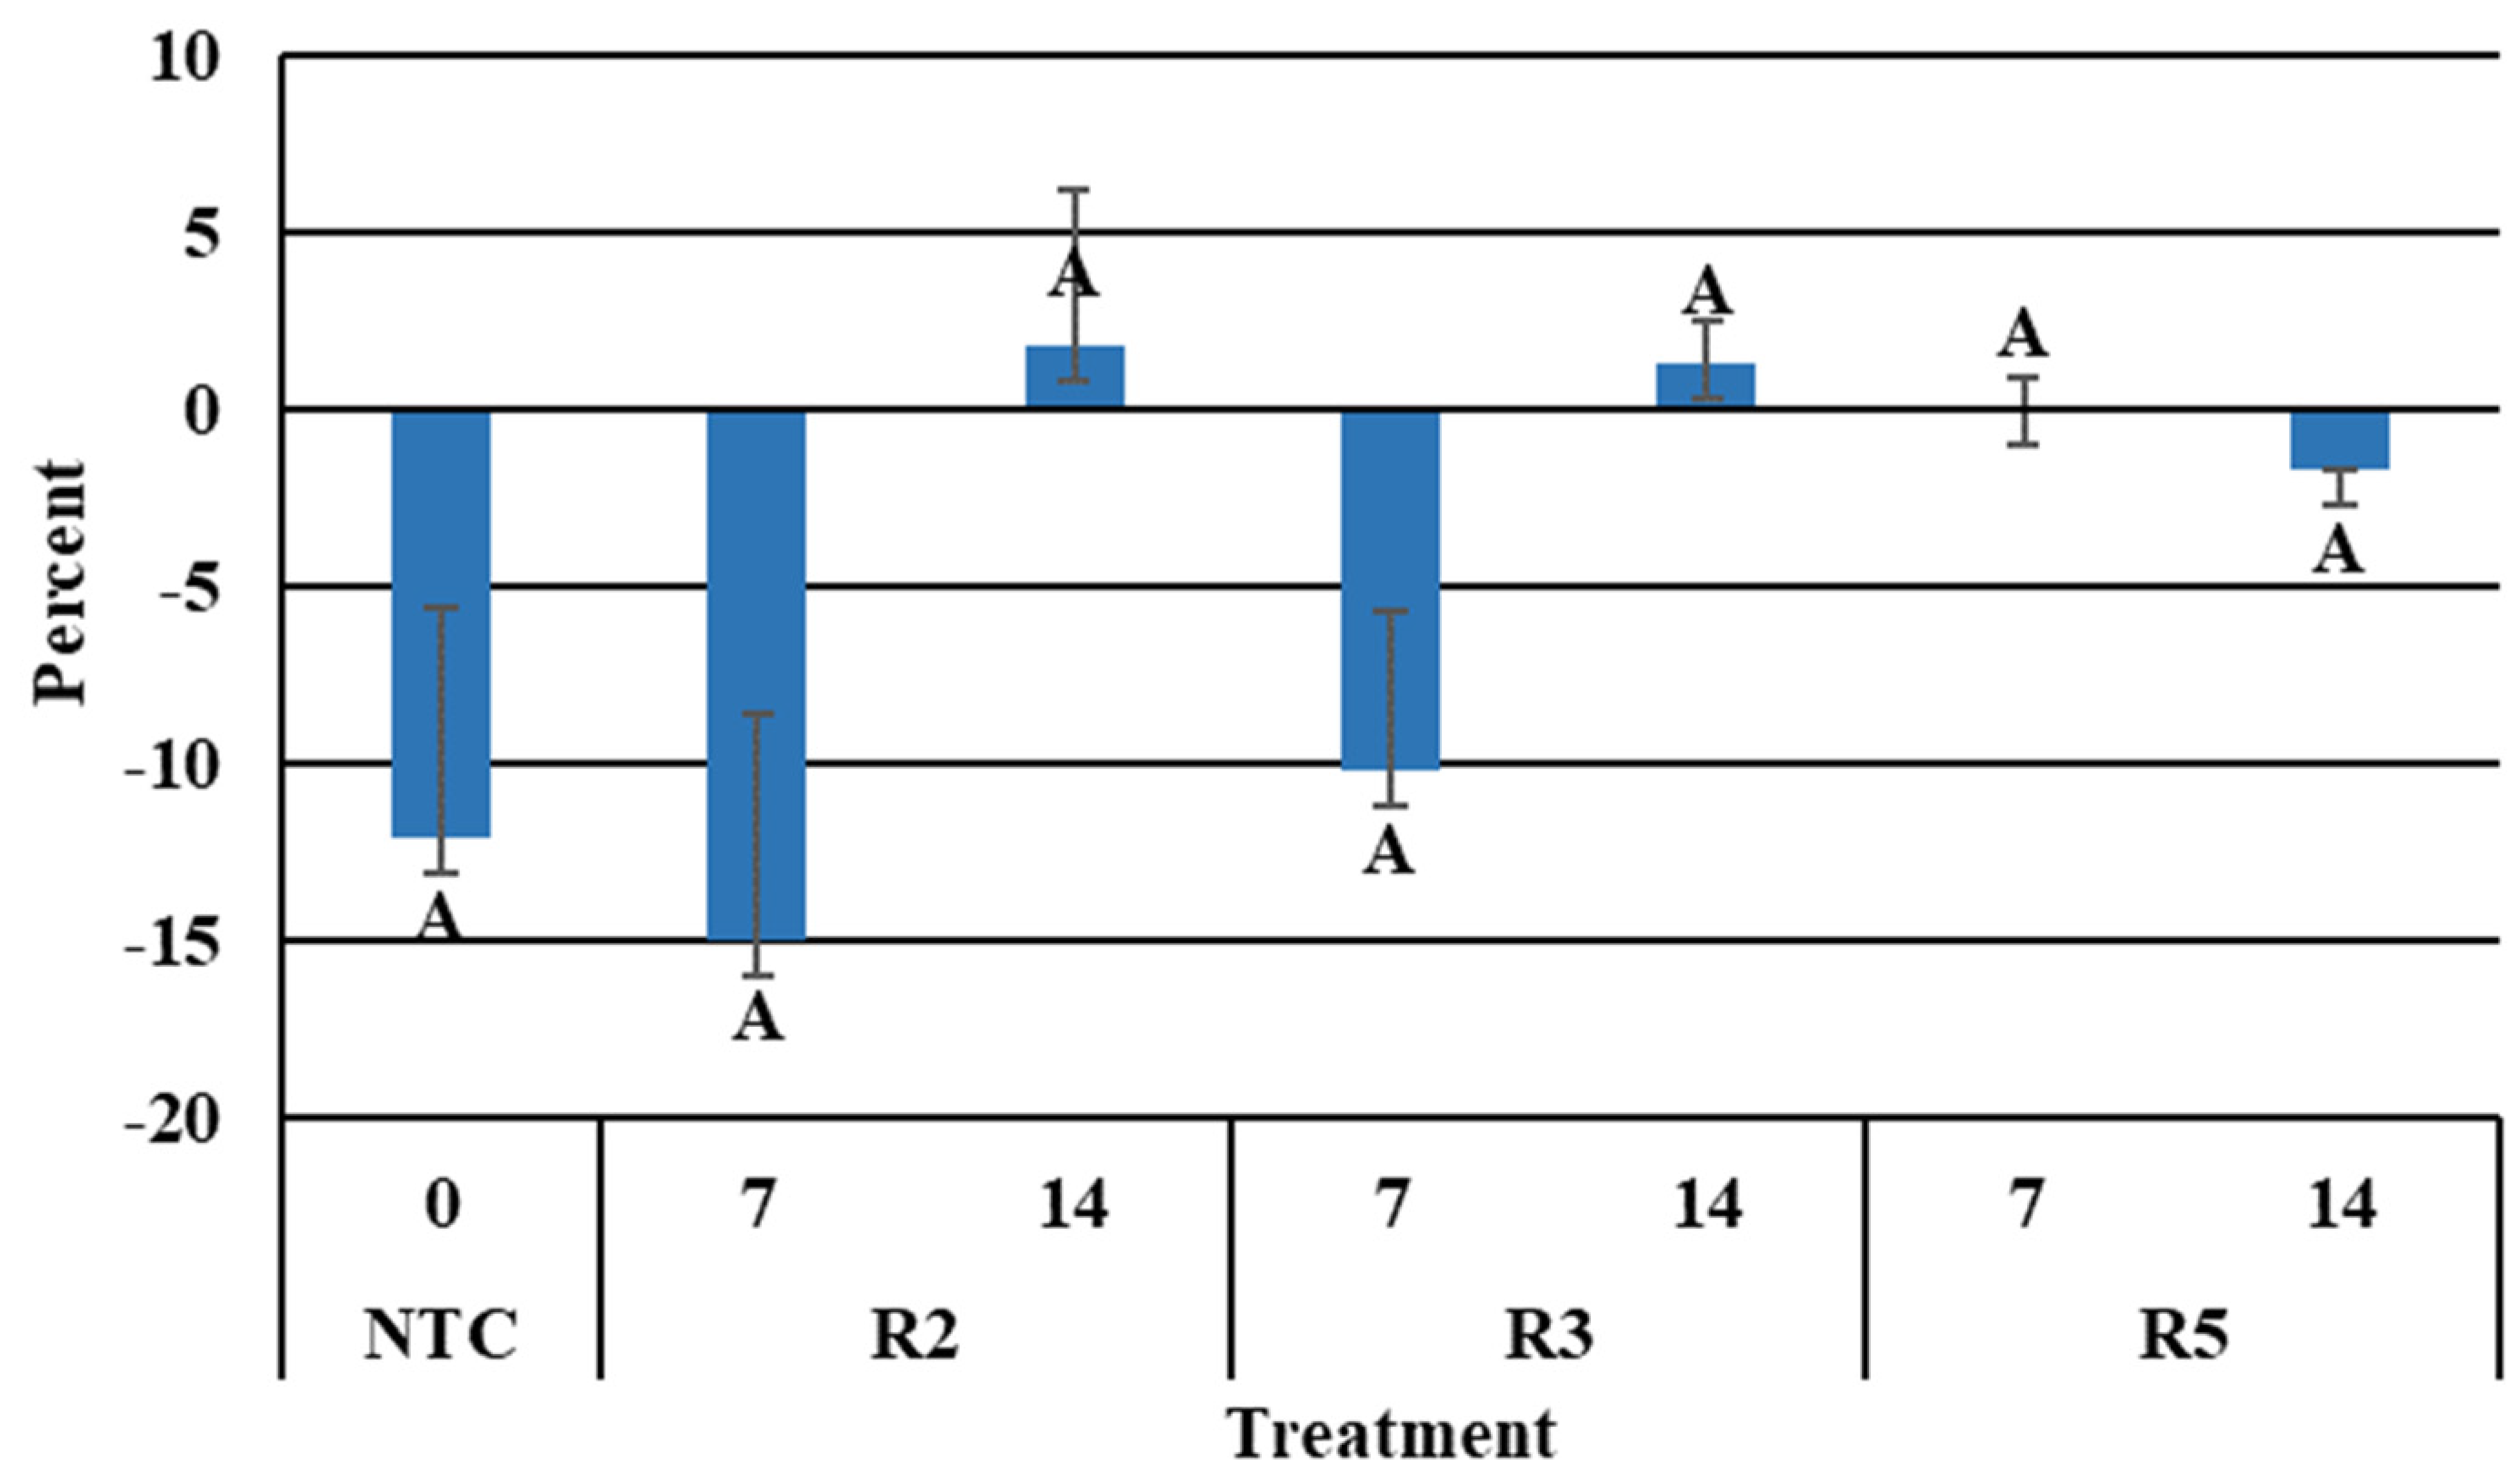
The number of pods located on the branches was subtracted from the mainstem to compare and analyze this physiological impact. A positive number indicated a higher number of pods on the mainstem, which contributed to the yield, while a negative number signified that pods were concentrated on the branches. A near-even number signifies equality of the two. The internal maintenance of a soybean plant to recover pods was illustrated when moisture stress was experienced for a short period at R3. Treatment R3:7 was able to maintain an average of 10 additional pods on the branches than the mainstem, compared to the NTC with 12 additional branch pods (
Figure 3). However, this did not hold true when an additional seven days of moisture stress was imposed. The potential of branch-located pods greatly decreased as more pods on the mainstem of R3:14 plants contributed to the yield (
Figure 3). Seven additional days decreased available plant moisture and thus, mobilization of assimilates to supply these pods on secondary and tertiary locations. Because of this, assimilates were directed to the larger sink of pods developing on the mainstem [
17]. When moisture stress is experienced at R3, biomass production is limited along with the potential of additional nodes to supply yield [
18]. At the same time, the survival of late-developing flowers on upper nodes is at a resource disadvantage compared to developing pods, which are a larger sink for the limited assimilates [
17]. Due to this, a shift in more pods produced on branches to the mainstem began to decline at R3, and branch pod capacity was greatly reduced at R5 (
Figure 3). With the R5:7 plants producing an even number of pods on the mainstem and branches, coupled with a diminished overall yield, it can be concluded that yield was impacted by moisture stress on the mainstem and the branches to the same magnitude (
Figure 3).
5. Implementation of Pod Mapping in the Field
Understanding the significance of the underlying mechanisms behind yield loss due to water stress is crucial. Crop yield correlates directly with evapotranspiration efficiency during periods of limited water supply, with the degree of yield loss depending on both the timing and duration of moisture stress. Tools like pod mapping help illustrate where moisture stress occurs on the soybean plant. Observing responses at the whole-plant level will not reveal where stress is experienced or where yield can be recovered.
Further evaluation of this method would be warranted across different agronomic changes. This could include differences in cultivars, growth patterns (indeterminate vs. determinate), and planting practices (i.e., row spacing and populations). This information would be a great potential value for breeding programs and impact the interpretation of information similar to that found in this study, which evaluated moisture stress on reproductive growth.


