Article

Molecular and Phylogenetic Identification of Fungal Taxa Associated with Soybean Anomaly in Brazil


by
Lucas Guimarães Ramos
1,
Solange Maria Bonaldo
2,
Gustavo Farias
2,
Carlos Guilherme Theodoro dos Santos
2,
Jeferson Gonçalves de Jesus
2,
Marcio Roggia Zanuzo
2 and
Thiago Alexandre Santana Gilio
2,3,*
1
Graduate Program in Genetics and Plant Breeding, Universidade do Estado do Mato Grosso, Cáceres 78216-060, Mato Grosso, Brazil
2
Graduate Program in Agronomy, Institute of Agricultural and Environmental Sciences, Universidade Federal de Mato Grosso, Sinop 78556-267, Mato Grosso, Brazil
3
Graduate Program in Biotechnology and Biodiversity, Institute of Natural and Human Sciences, Universidade Federal de Mato Grosso, Sinop 78556-267, Mato Grosso, Brazil
*
Author to whom correspondence should be addressed.
Microbiol. Res. 2026, 17(8), 159; https://doi.org/10.3390/microbiolres17080159
Submission received: 16 June 2026 / Revised: 28 July 2026 / Accepted: 3 August 2026 / Published: 18 August 2026
(This article belongs to the Section Food and Agricultural Microbiology)

Abstract

Soybean anomaly, characterized by immature pod and grain rot, has been reported in Brazilian soybean production fields, but the fungal taxa associated with symptomatic tissues remain poorly characterized. This study aimed to identify fungi associated with soybean plants showing anomaly symptoms using molecular and phylogenetic approaches. Symptomatic samples were collected from production fields in Mato Grosso and Rondônia, Brazil. Fungal isolates were obtained from pods, seeds, stems, and leaves, and DNA was extracted for amplification of the ITS and LSU rDNA regions. Sequences were compared with GenBank reference data using BLAST, and phylogenetic analyses were performed using Maximum Likelihood. The analyses revealed isolates belonging to Colletotrichum, Corynespora, Diaporthe, Fusarium, Moniliophthora, Neurospora, Roseograndinia, and Xylaria. Among these, Colletotrichum, Diaporthe, and Fusarium are well-documented soybean pathogens, whereas Corynespora, Moniliophthora, Neurospora, Roseograndinia, and Xylaria remain poorly documented in this host and may represent secondary or opportunistic colonizers. The findings expand molecular information on fungi associated with soybean anomaly in Brazil. However, because pathogenicity tests were not performed, the results should be interpreted as evidence of fungal association with symptomatic tissues rather than confirmation of causality.

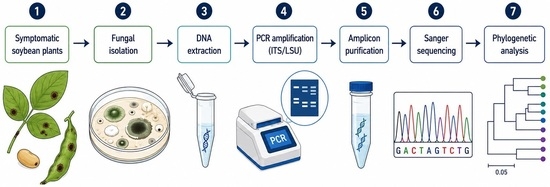
Graphical Abstract

1. Introduction

Soybean (Glycine max (L.) Merr.) is one of the world’s leading agricultural crops, playing an essential role in global food and energy security. Brazil stands out as the largest producer and exporter of soybean grains, also leading the export of its by-products, such as soybean meal and oil [1,2]. Among Brazilian producing states, Mato Grosso is the national leader, despite facing climatic challenges such as the water deficit observed during the 2023/2024 crop season (i.e., the soybean cycle spanning the 2023 and 2024 calendar years) [3,4].
Despite technological advances and increasing productivity, soybean cultivation faces significant phytosanitary challenges, including the recent emergence of an anomaly that has not yet been fully elucidated. This condition, reported in several fields in the Mid-North region of Mato Grosso and also in areas of Rondônia, is characterized by symptoms such as pod and seed rot, premature maturation, in situ seed germination, and stem breakage, especially from the reproductive stage R5.1 onwards [5,6]. Yield losses are estimated between 16% and 30%, with an economic impact exceeding R$9.6 billion in the 2021/2022 season [7].
There is still no consensus regarding the origin of this anomaly, with hypotheses ranging from abiotic causes, such as water deficit, to biotic factors, such as infections caused by phytopathogens, as well as the possibility of interactions between both [5,6]. Several fungi have been isolated from symptomatic plants, including species from the genera Colletotrichum Corda, Diaporthe Nitschke, Fusarium Link, Moniliophthora H.C. Evans, Stalpers, Samson & Benny, and Phoma Sacc., some of which are recognized as phytopathogens while others behave as saprophytes or endophytes [8,9,10].
However, the evidence linking these genera to the anomaly remains largely circumstantial. Most reports rely on isolation frequency or morphological identification, and few have applied molecular tools or fulfilled pathogenicity criteria; consequently, it remains unclear whether these fungi act as primary pathogens, secondary invaders of predisposed tissue, or incidental saprophytes [5,6,8,9,10]. This knowledge gap, combined with the difficulty of distinguishing closely related species by morphology alone, justifies a molecular approach based on the ITS and LSU rDNA regions to characterize the fungal taxa consistently associated with symptomatic tissues.
Morphological identification of these microorganisms, although traditionally employed, has limitations in differentiating closely related species, particularly within genera such as Moniliophthora, which exhibit subtle morphological variations [11,12]. Thus, molecular characterization emerges as an essential tool to overcome these barriers, providing greater accuracy and reliability in the identification of the fungal agents involved.
Among molecular markers, the ITS (Internal Transcribed Spacer) and LSU (Large Subunit) regions of ribosomal DNA have been widely used in fungal identification and phylogenetic inference, as they combine conserved and variable regions [13,14]. PCR amplification of these regions, followed by sequencing and comparison with databases such as GenBank, has enabled significant advances in fungal taxonomy, even in samples containing plant DNA [15].
Given the economic importance of soybean and the complexity involved in determining the cause of the anomaly, the present study aimed to identify, through molecular techniques, the fungal genera present in soybean plants showing anomaly symptoms from fields in the states of Mato Grosso and Rondônia.

2. Materials and Methods

2.1. Fungal Isolates

The isolates used in this study were obtained through direct and indirect isolation from symptomatic soybean samples collected during the 2022/2023 crop season (soybean sown in 2022 and harvested in 2023) at the Plant Disease Diagnostic Clinic of the Laboratory of Phytopathology and Microbiology, Federal University of Mato Grosso (UFMT), Sinop Campus, Brazil (Table 1).
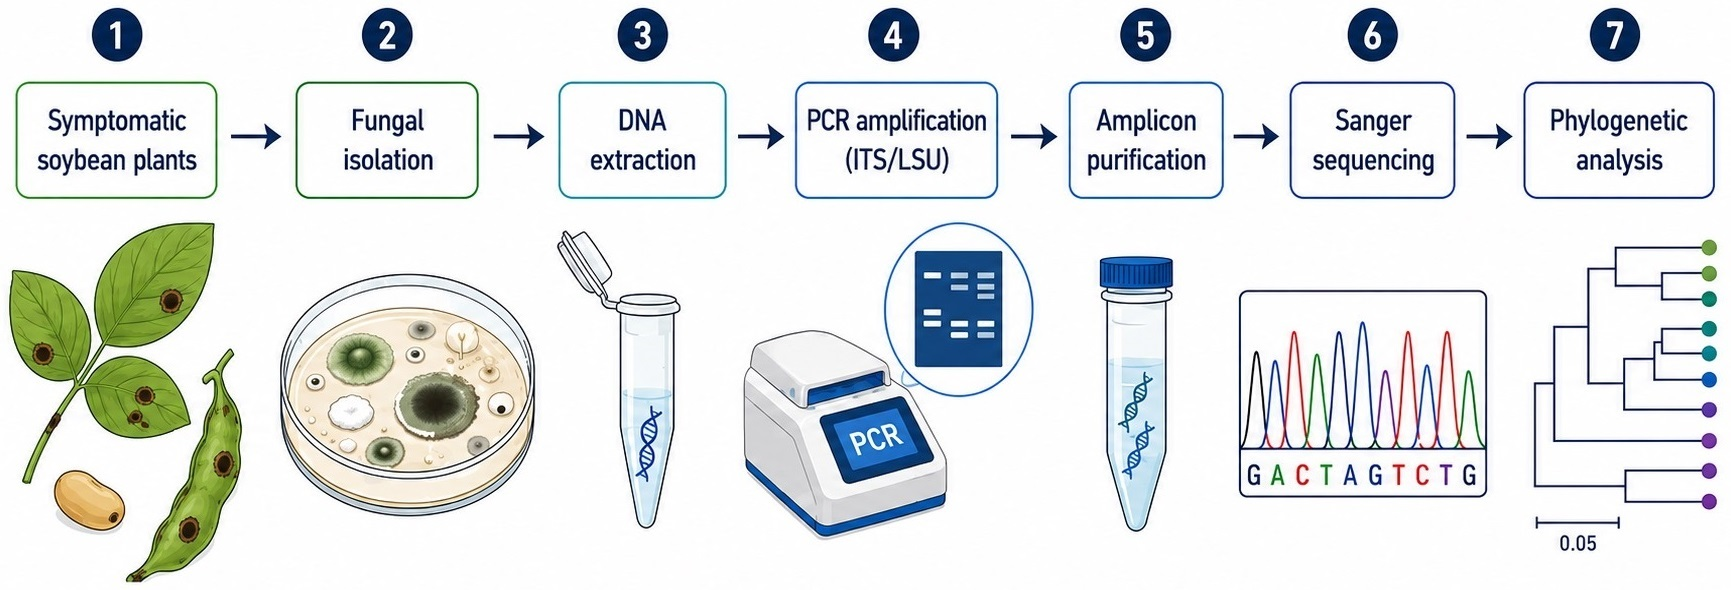
Direct and indirect isolation were performed following [16]. In direct isolation, fungal structures visible on symptomatic tissues were aseptically transferred to Petri dishes containing commercial potato dextrose agar (PDA; Neogen Corporation, Lansing, MI, USA) using a previously flamed needle or scalpel.
In indirect isolation, symptomatic plant material was first washed with water and detergent and dried on sterilized filter paper. Small fragments were then excised from the transition zone between symptomatic and apparently healthy tissue.
The fragments were immersed in 70% ethanol for 30–60 s and subsequently transferred to a sodium hypochlorite solution containing 1000 ppm active chlorine (equivalent to 0.1% Cl2) for approximately 1 min. Excess disinfectant was removed by gently blotting the fragments on sterilized filter paper. Three or four fragments were placed equidistantly on each PDA plate and incubated at 25 °C in continuous darkness until fungal growth was observed. Selected colonies were subsequently subcultured to obtain pure cultures.
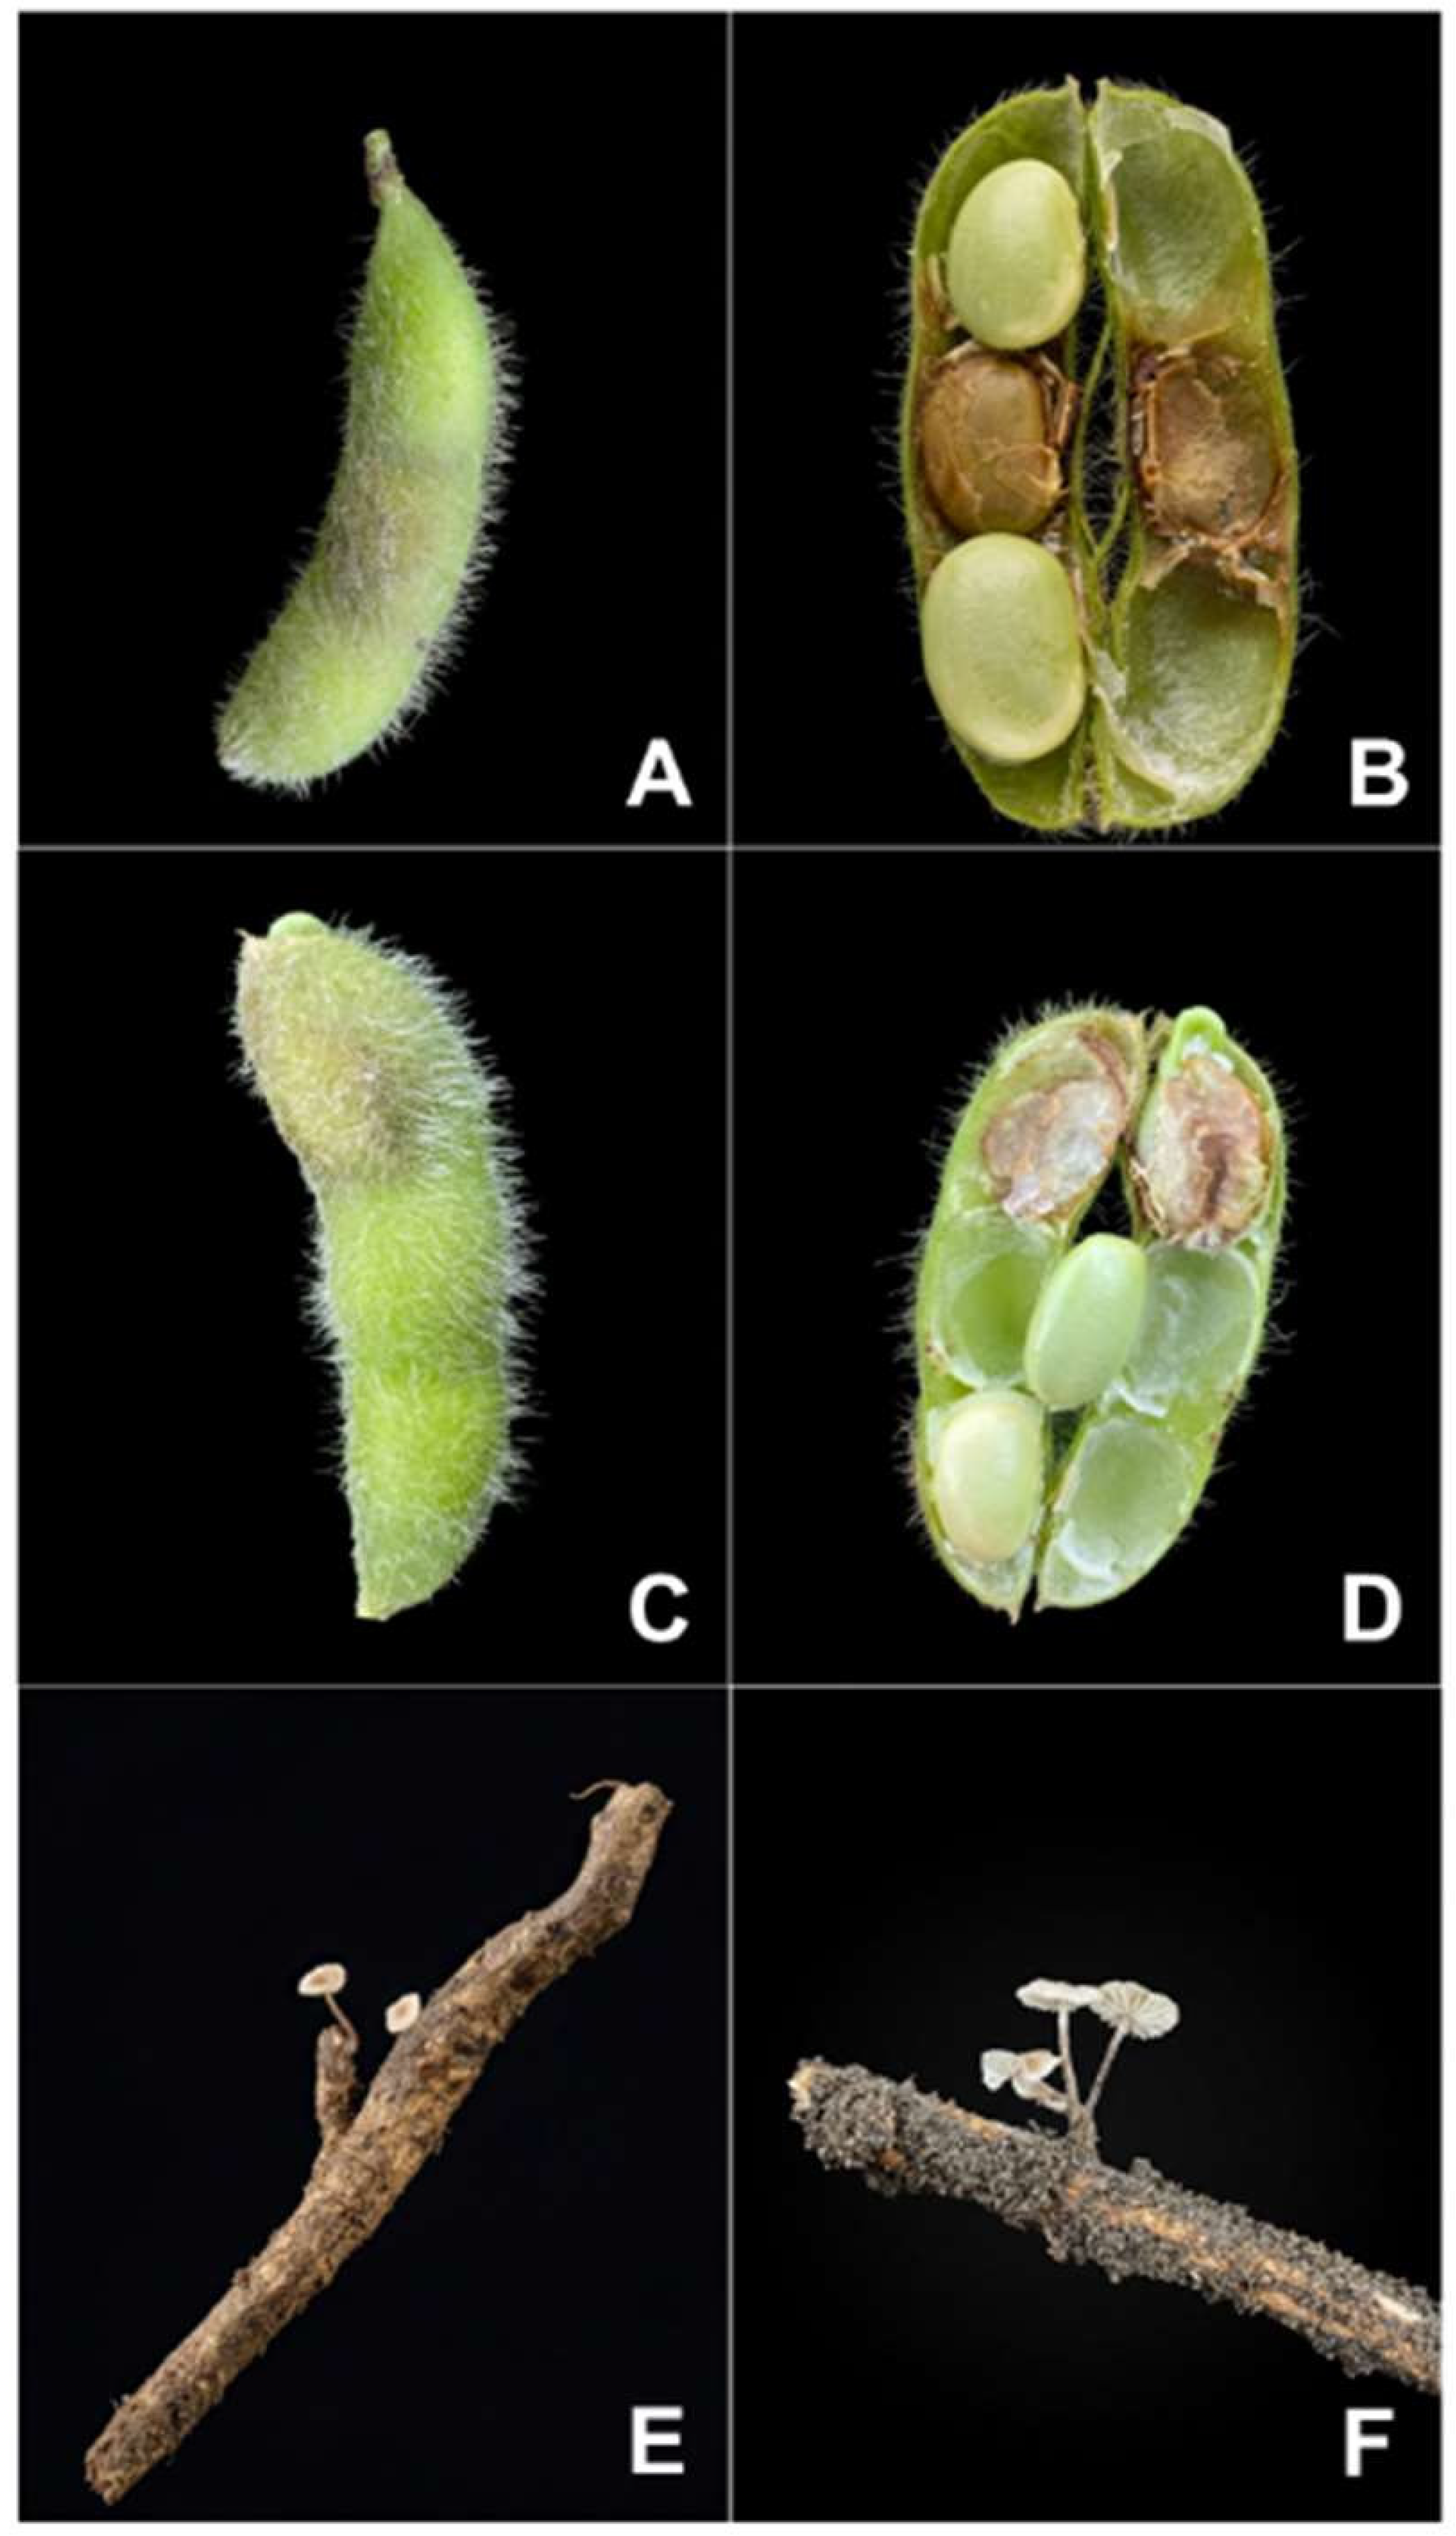
Pods and plants were selected based on symptoms associated with the soybean anomaly, predominantly from the R5.1 growth stage onward, which included pods and seeds showing signs of deterioration and in situ germination, as well as stem fragments collected from symptomatic plants (Figure 1).
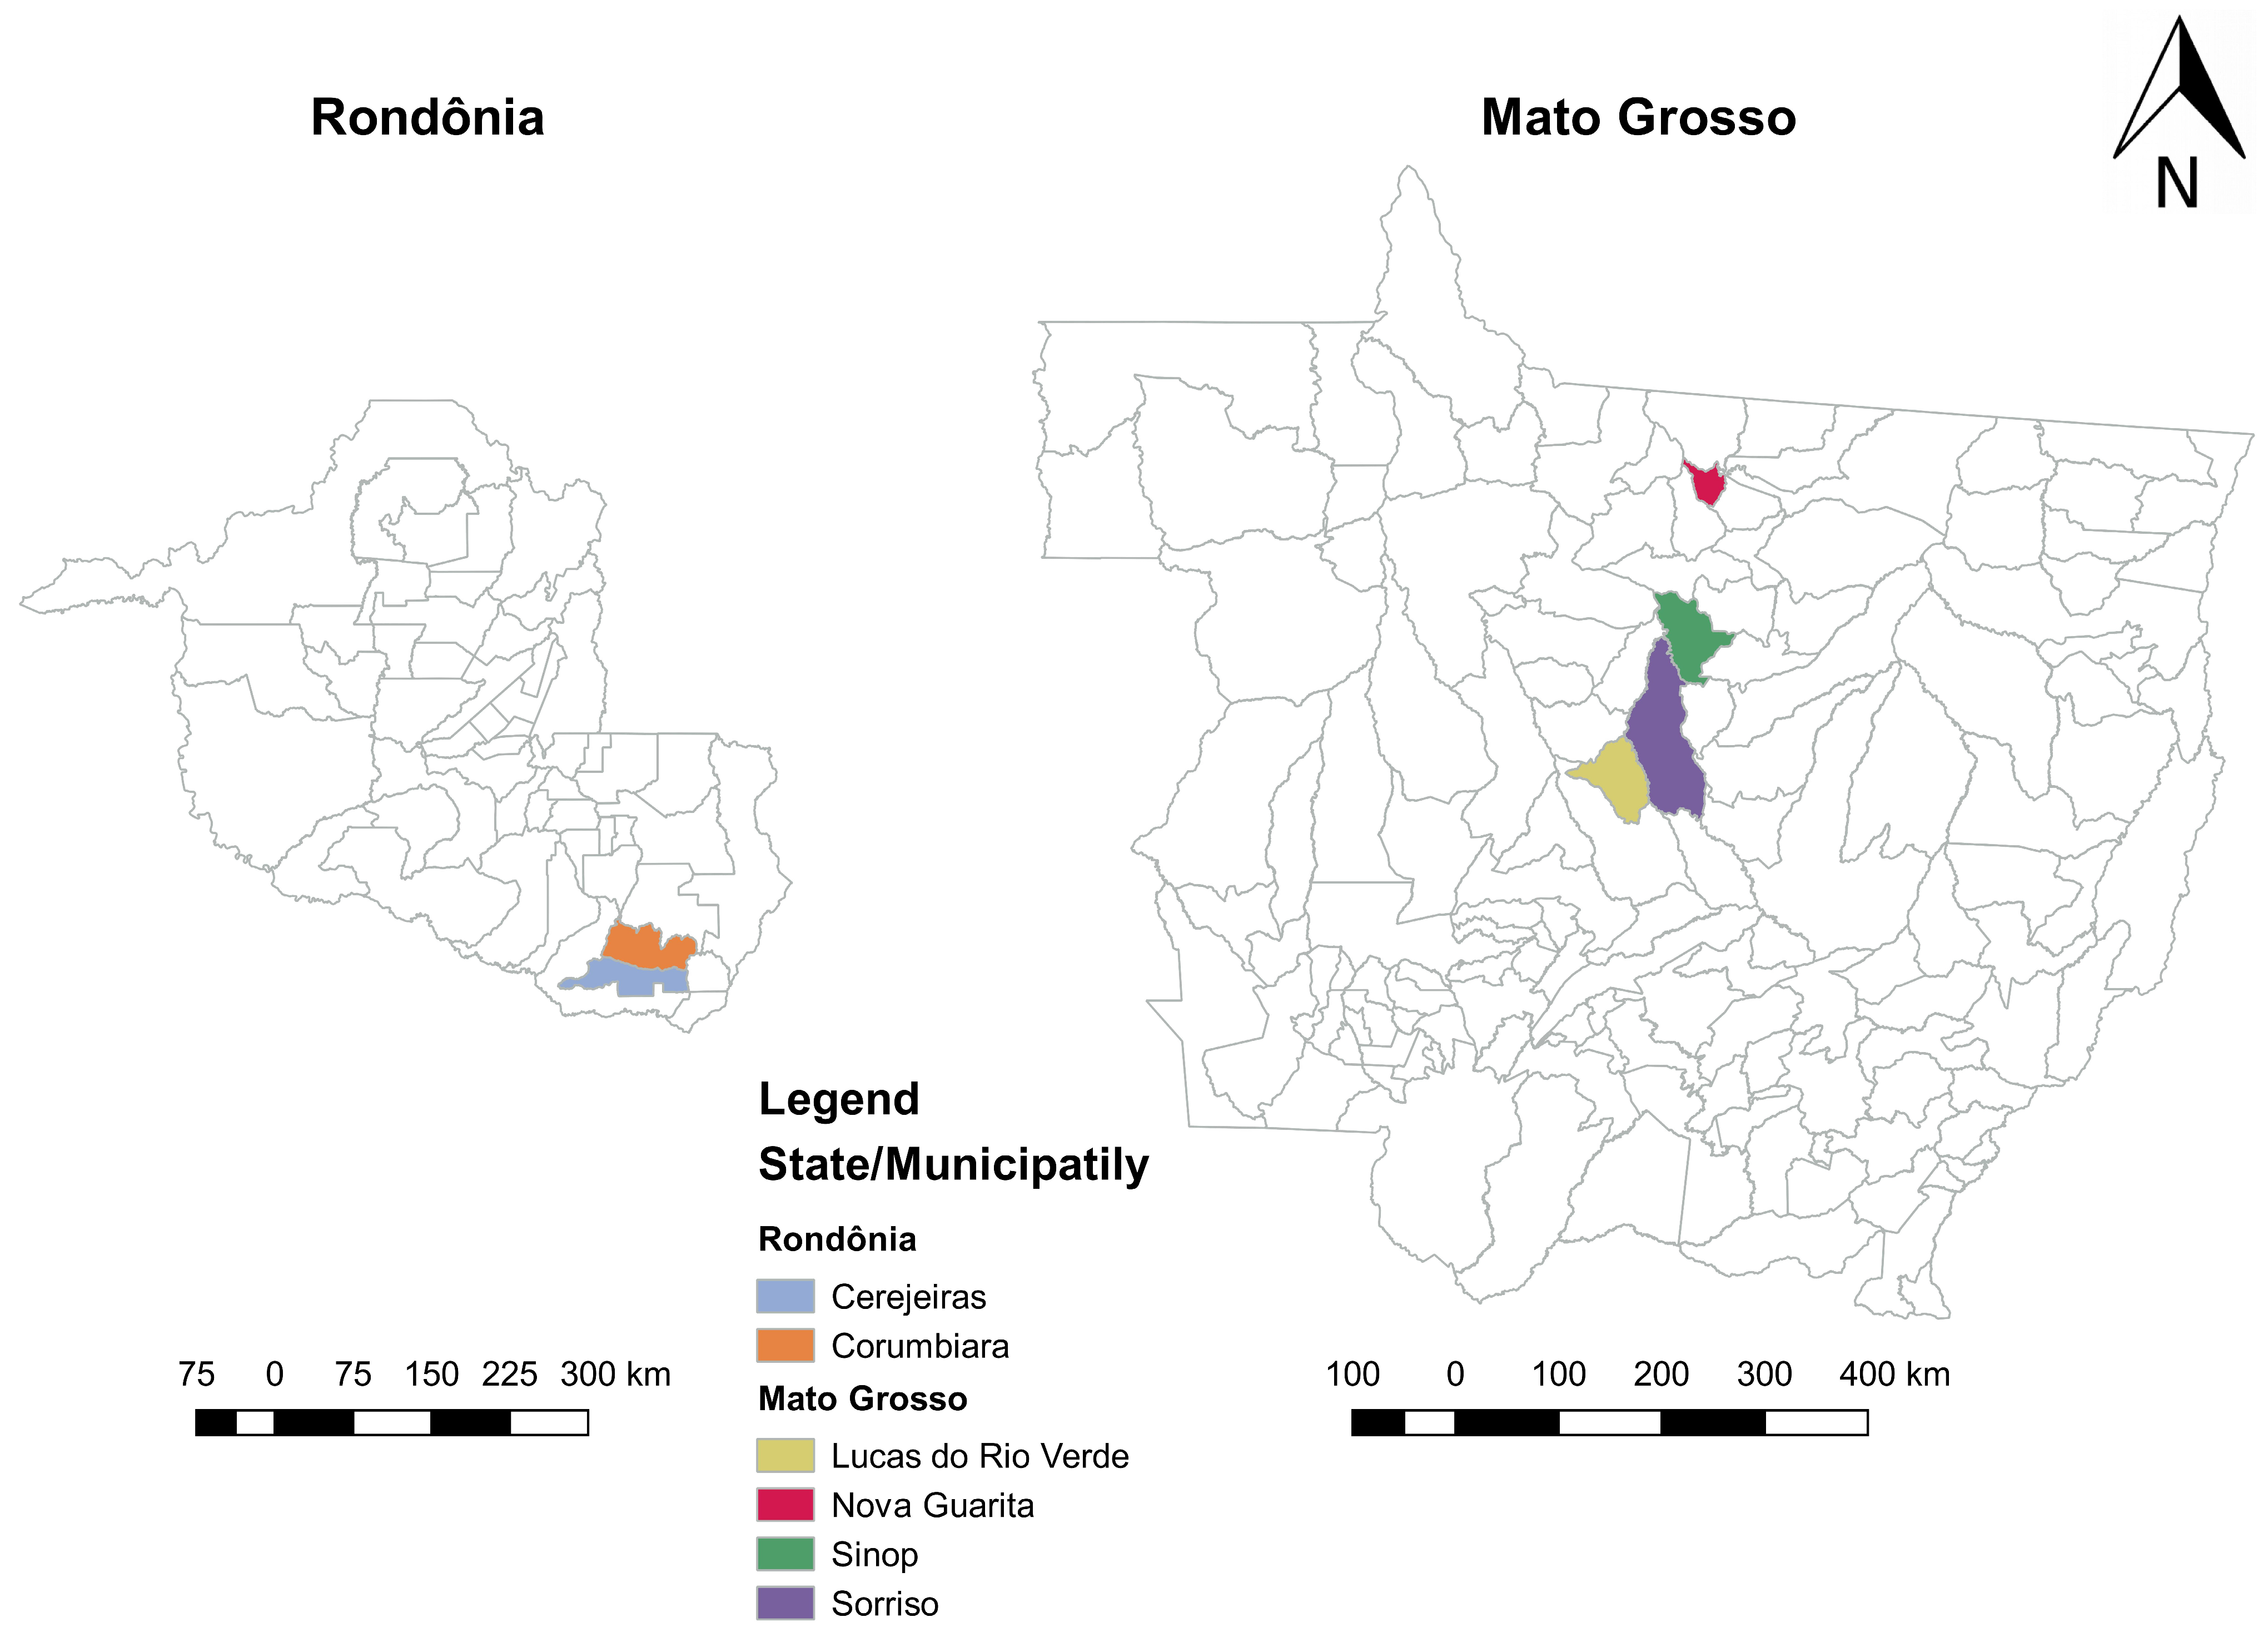
The isolates were obtained from a wide geographic area (Figure 2), encompassing the Mid-North region of Mato Grosso and the southern region of Rondônia, Brazil. In Mato Grosso, samples were collected from Sinop (18 isolates), Nova Guarita (5), Lucas do Rio Verde (2), and Sorriso (3). In Rondônia, samples originated from Cerejeiras (6) and Corumbiara (2), where similar symptoms were also observed.
In total, the 36 isolates listed in Table 1 were recovered from 35 symptomatic plant samples collected across the two states. Each sample yielded one isolate, except for the sample where isolates 130-2-0123A and 130-2-0123C were obteined.

2.2. Mycelial Biomass Production for DNA Extraction

After isolation and purification on commercial potato dextrose agar (PDA; Neogen), cultures were incubated at 25 °C in the dark for approximately seven days, or until sufficient mycelial growth was obtained to provide mycelial plugs. Plugs taken from the margin of actively growing colonies were aseptically transferred to Erlenmeyer flasks containing potato dextrose (PD) broth for biomass production. The PD broth was prepared with 200 g of peeled and chopped potato boiled in 1000 mL of distilled water to obtain the infusion. The broth was filtered, supplemented with 18 g of dextrose, and autoclaved without adjusting the final volume. The Erlenmeyer flasks were incubated at 25 °C in the dark under continuous orbital shaking for 3–5 days. Mycelial biomass was recovered from the liquid cultures with sterilized forceps and transferred to 2.0 mL microcentrifuge tubes. Approximately 350 mg of mycelial biomass was collected per isolate and stored at −20 °C until DNA extraction.

2.3. DNA Extraction

Genomic DNA was extracted using the DNeasy® Plant Mini Kit (QIAGEN®, Hilden, Germany) following the manufacturer’s instructions, with modifications for fungal tissue lysis using metallic beads in a sample homogenizer. DNA quality was verified by electrophoresis in 1% agarose gel at 80 V in TBE buffer (Tris-borate-EDTA), stained with Safer dye, and visualized with the L-Pix HE 2.61 SX110 Image software integrated into the Loccus photodocumentation system. Bands with clear resolution and intensity were considered suitable for PCR amplification.

2.4. PCR Amplification

PCR reactions targeted the ITS (ITS1/ITS2) and LSU (D1/D2) ribosomal DNA regions. Each reaction was performed in a final volume of 50 µL containing 1× reaction buffer, 0.8 mM of each dNTP, 0.25 µM of each primer, 2.4 mM MgCl2, 5.04% (v/v) glycerol, 5.2% (v/v) dimethyl sulfoxide (DMSO), 5 U of Easy Taq DNA polymerase, 8 µL of template DNA previously diluted 1:20, and 15.6 µL of nuclease-free water. Amplifications were carried out in 0.5 mL DNase/RNase-free polypropylene tubes. Primers ITS1 (TCCGTAGGTGAACCTGCGG) and ITS4 (TCCTCCGCTTATTGATATGCR) [14] were used for the ITS region, and primers LR5 (TCCTGAGGGAAACTTCG) and LR0 (ACCCGCTGAACTTAAGC) [17] for LSU. Thermocycler parameters were as follows: (1) For ITS: initial denaturation at 95 °C for 3 min; 40 cycles of 95 °C for 50 s, 53 °C for 45 s, 72 °C for 1 min; and a final extension at 72 °C for 5 min. (2) For LSU: initial denaturation at 95 °C for 3 min; 40 cycles of 95 °C for 50 s, 52 °C for 45 s, 72 °C for 1 min; and a final extension at 72 °C for 5 min. PCR products were analyzed by electrophoresis on 1.5% agarose gels in TBE buffer stained with Safer dye, run at 80 V. Amplicons were considered suitable for purification when clear bands of expected size were observed: 500–800 bp for ITS [14] and ~1000 bp for LSU [17].

2.5. Amplicon Purification and Sequencing

Amplicons were purified using the Purification Kit (Cellco Biotec do Brasil, São Carlos, SP, Brazil) PCR Purification Kit, following the protocol for fragments between 200 bp and 5 kb. Integrity was verified in 1.5% agarose gels, and quantification was performed using a NanoDrop™ spectrophotometer (Thermo Fisher Scientific, Wilmington, DE, USA). Quality criteria included an A260/A280 ratio between 1.8 and 2.0, and smooth absorbance spectra without irregular peaks.
High-quality samples were submitted to ACTGene Molecular Analyses Ltd. (Alvorada, RS, Brazil) and GoGenetic (Curitiba, PR, Brazil) for Sanger sequencing of the ITS and LSU regions. The fungal isolates, collection locations, plant organs, and GenBank accession numbers for the ITS and LSU sequences are presented in Table 1.

2.6. Sequence Editing and Similarity Analysis

Sequences were edited using BioEdit v.7.2.5 [18] and aligned with MAFFT version 7 [19]. Similarity searches were performed against the GenBank database [20] using BLASTn (Basic Local Alignment Search Tool) [21] available at NCBI (National Center for Biotechnology Information). Query coverage, percentage identity, E-value, taxonomic identification, and GenBank accession number of the closest matching sequences were recorded. BLASTn results were used as an initial guide for the selection of reference taxa and were not considered sufficient for species-level identification independently of the phylogenetic analyses.

2.7. Phylogenetic Analysis

Separate genus-level datasets were constructed for Colletotrichum, Corynespora Güssow, Diaporthe, Fusarium, Moniliophthora, Neurospora Shear & B.O. Dodge, Roseograndinia Hjortstam & Ryvarden, and Xylaria Hill ex Schrank. Each dataset included the isolates obtained in this study, phylogenetically close sequences identified through BLASTn searches, representative taxa of the corresponding phylogenetic groups, and sequences derived from nomenclatural reference material when available. Reference sequences were retrieved from GenBank, and only ITS and LSU sequences from the same strain or voucher were paired in the combined analyses. Within each genus, the same terminal taxa were kept across the ITS, LSU, and combined ITS–LSU datasets.
The ITS and LSU sequences were aligned separately using MAFFT version 7 [19] and subsequently concatenated to build the combined ITS–LSU datasets. Maximum-likelihood analyses were performed using W-IQ-TREE [22]. The best-fit nucleotide substitution model was selected independently for each alignment using ModelFinder [23] based on the Bayesian information criterion. Branch support was assessed with 1000 replicates of the Shimodaira–Hasegawa-like approximate likelihood-ratio test (SH-aLRT) [24] and 10,000 ultrafast bootstrap (UFBoot) replicates [25]. Branch lengths were proportional to the expected number of nucleotide substitutions per site. The trees were rooted with taxa external to the respective ingroups. The resulting phylogenetic trees were visualized and annotated using Geneious Prime version [2026.1.2] (Biomatters Ltd., Auckland, New Zealand). The combined ITS–LSU phylogenies were used as the main analyses, whereas the individual ITS and LSU trees were used to assess topological congruence between loci and are presented as Supplementary Figures S1–S16.

3. Results

Sequencing of the ITS and LSU regions, followed by preliminary BLASTn comparisons and genus-level phylogenetic analyses, supported the genus-level placement of the 36 fungal isolates within eight genera (Table 1). Moniliophthora was represented by 19 isolates; Colletotrichum and Fusarium by five isolates each; Corynespora and Diaporthe by two isolates each; and Neurospora, Roseograndinia, and Xylaria by one isolate each. Detailed BLASTn results, including the closest matches recovered from the standard search and from searches restricted to sequences from type material, together with strain/voucher information, query coverage, percentage identity, E-values, and GenBank accession numbers, are provided in Supplementary Table S9.

3.1. Colletotrichum

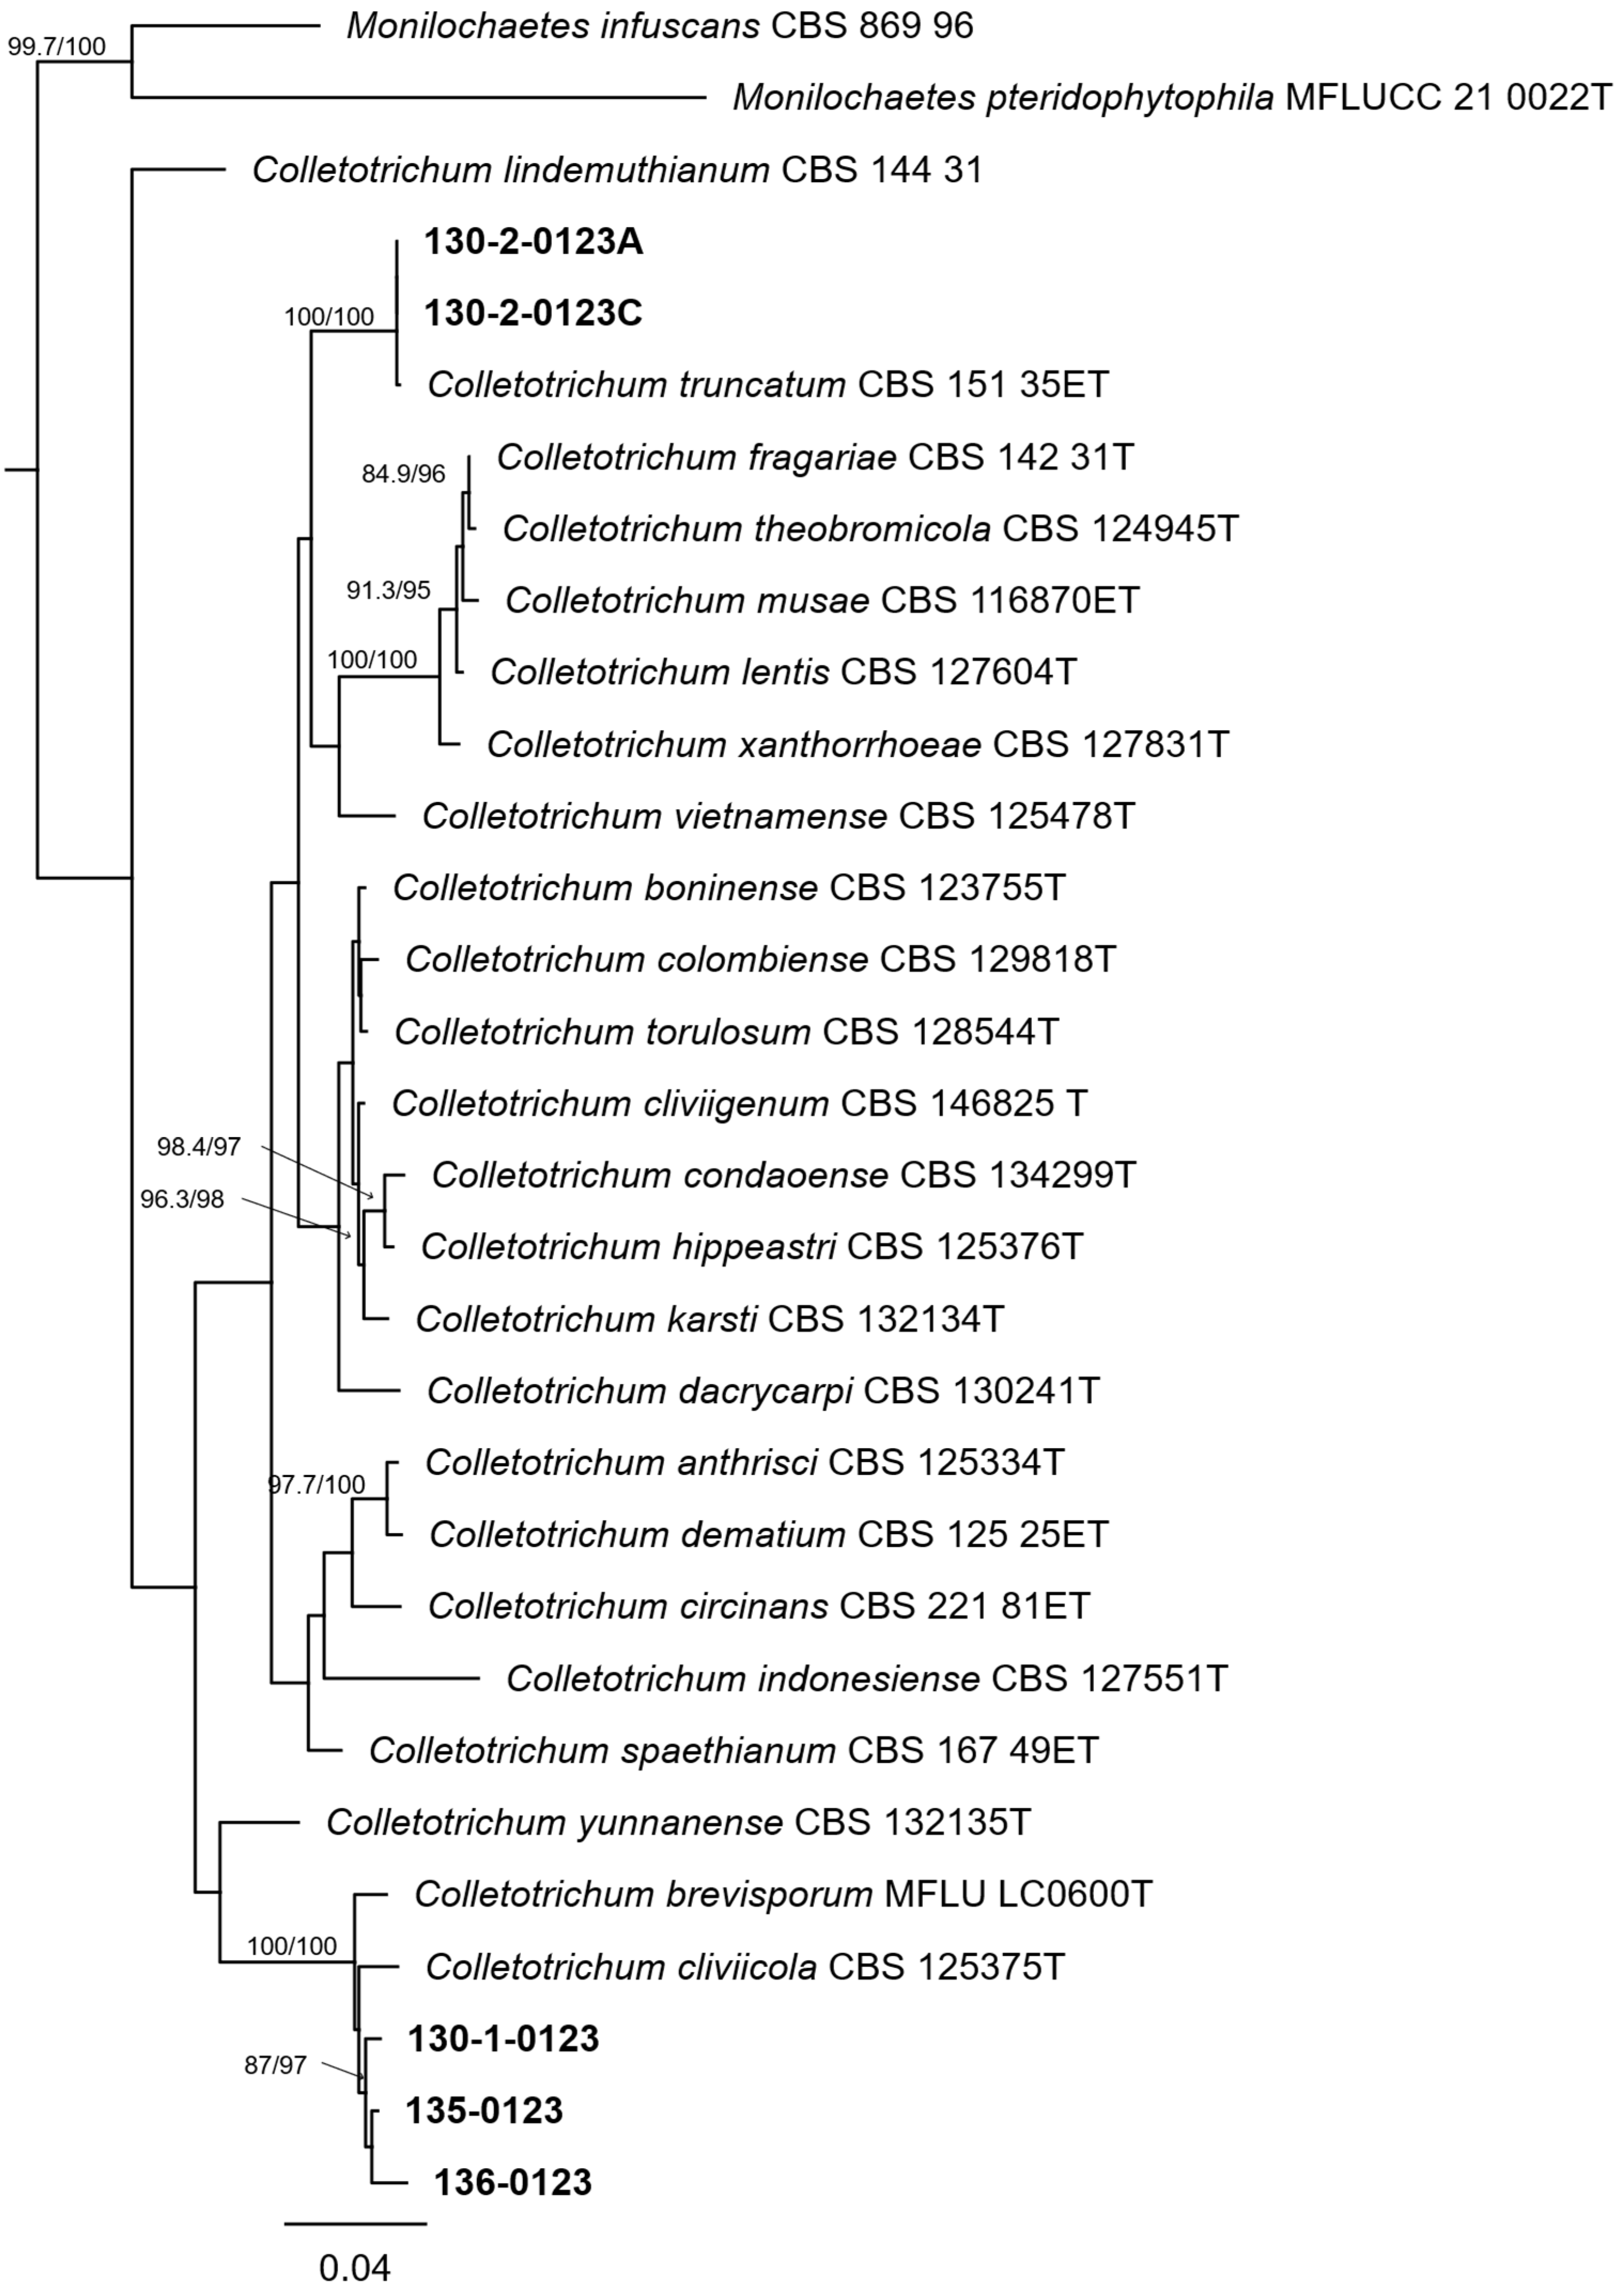
Maximum likelihood analyses of the ITS, LSU, and combined ITS–LSU datasets included 31 terminal taxa, of which five isolates were generated in the present study. The ITS alignment comprised 591 nucleotide positions and was analyzed under the TIM3e+R3 substitution model. The LSU alignment consisted of 841 nucleotide positions and was analyzed using the TNe+I+G4 model, whereas the combined ITS–LSU dataset comprised 1432 nucleotide positions and was analyzed under the HKY+F+R3 model.
Isolates 130-2-0123A and 130-2-0123C were consistently placed with the ex-epitype strain of Colletotrichum truncatum (Schwein.) Andrus & W.D. Moore, CBS 151.35. This lineage of three terminal taxa received SH-aLRT/UFBoot support of 99.6/100 in the ITS analysis, 94.5/95 in the LSU analysis, and 100/100 in the combined analysis. The support values applied to the lineage containing the two isolates and the ex-epitype strain; the immediate relationship between the two isolates from this study did not receive independent support.
Isolates 130-1-0123, 135-0123, and 136-0123 formed a distinct group in the LSU analysis, with support of 86.6/96. In the ITS phylogeny, these isolates were placed in a lineage containing Colletotrichum cliviicola Damm & Crous CBS 125375 and Colletotrichum brevisporum S. Phoulivong, P. Noireung, L. Cai & K.D. Hyde MFLU LC0600 MFLU LC0600, supported by 100/100, although the immediate relationships between the isolates from this study and the reference strains showed low support.
The combined analysis recovered isolates 130-1-0123, 135-0123, and 136-0123 as a lineage with support of 87/97. This lineage grouped with C. cliviicola CBS 125375 and C. brevisporum MFLU LC0600, with support of 100/100. However, none of the three isolates was consistently resolved as sister to the type material of a single species in the individual and combined analyses.
Consequently, the five isolates were retained as Colletotrichum sp. Isolates 130-2-0123A and 130-2-0123C showed consistent phylogenetic affinity with the C. truncatum lineage, whereas the species-level placement of isolates 130-1-0123, 135-0123, and 136-0123 remained unresolved.

3.2. Corynespora

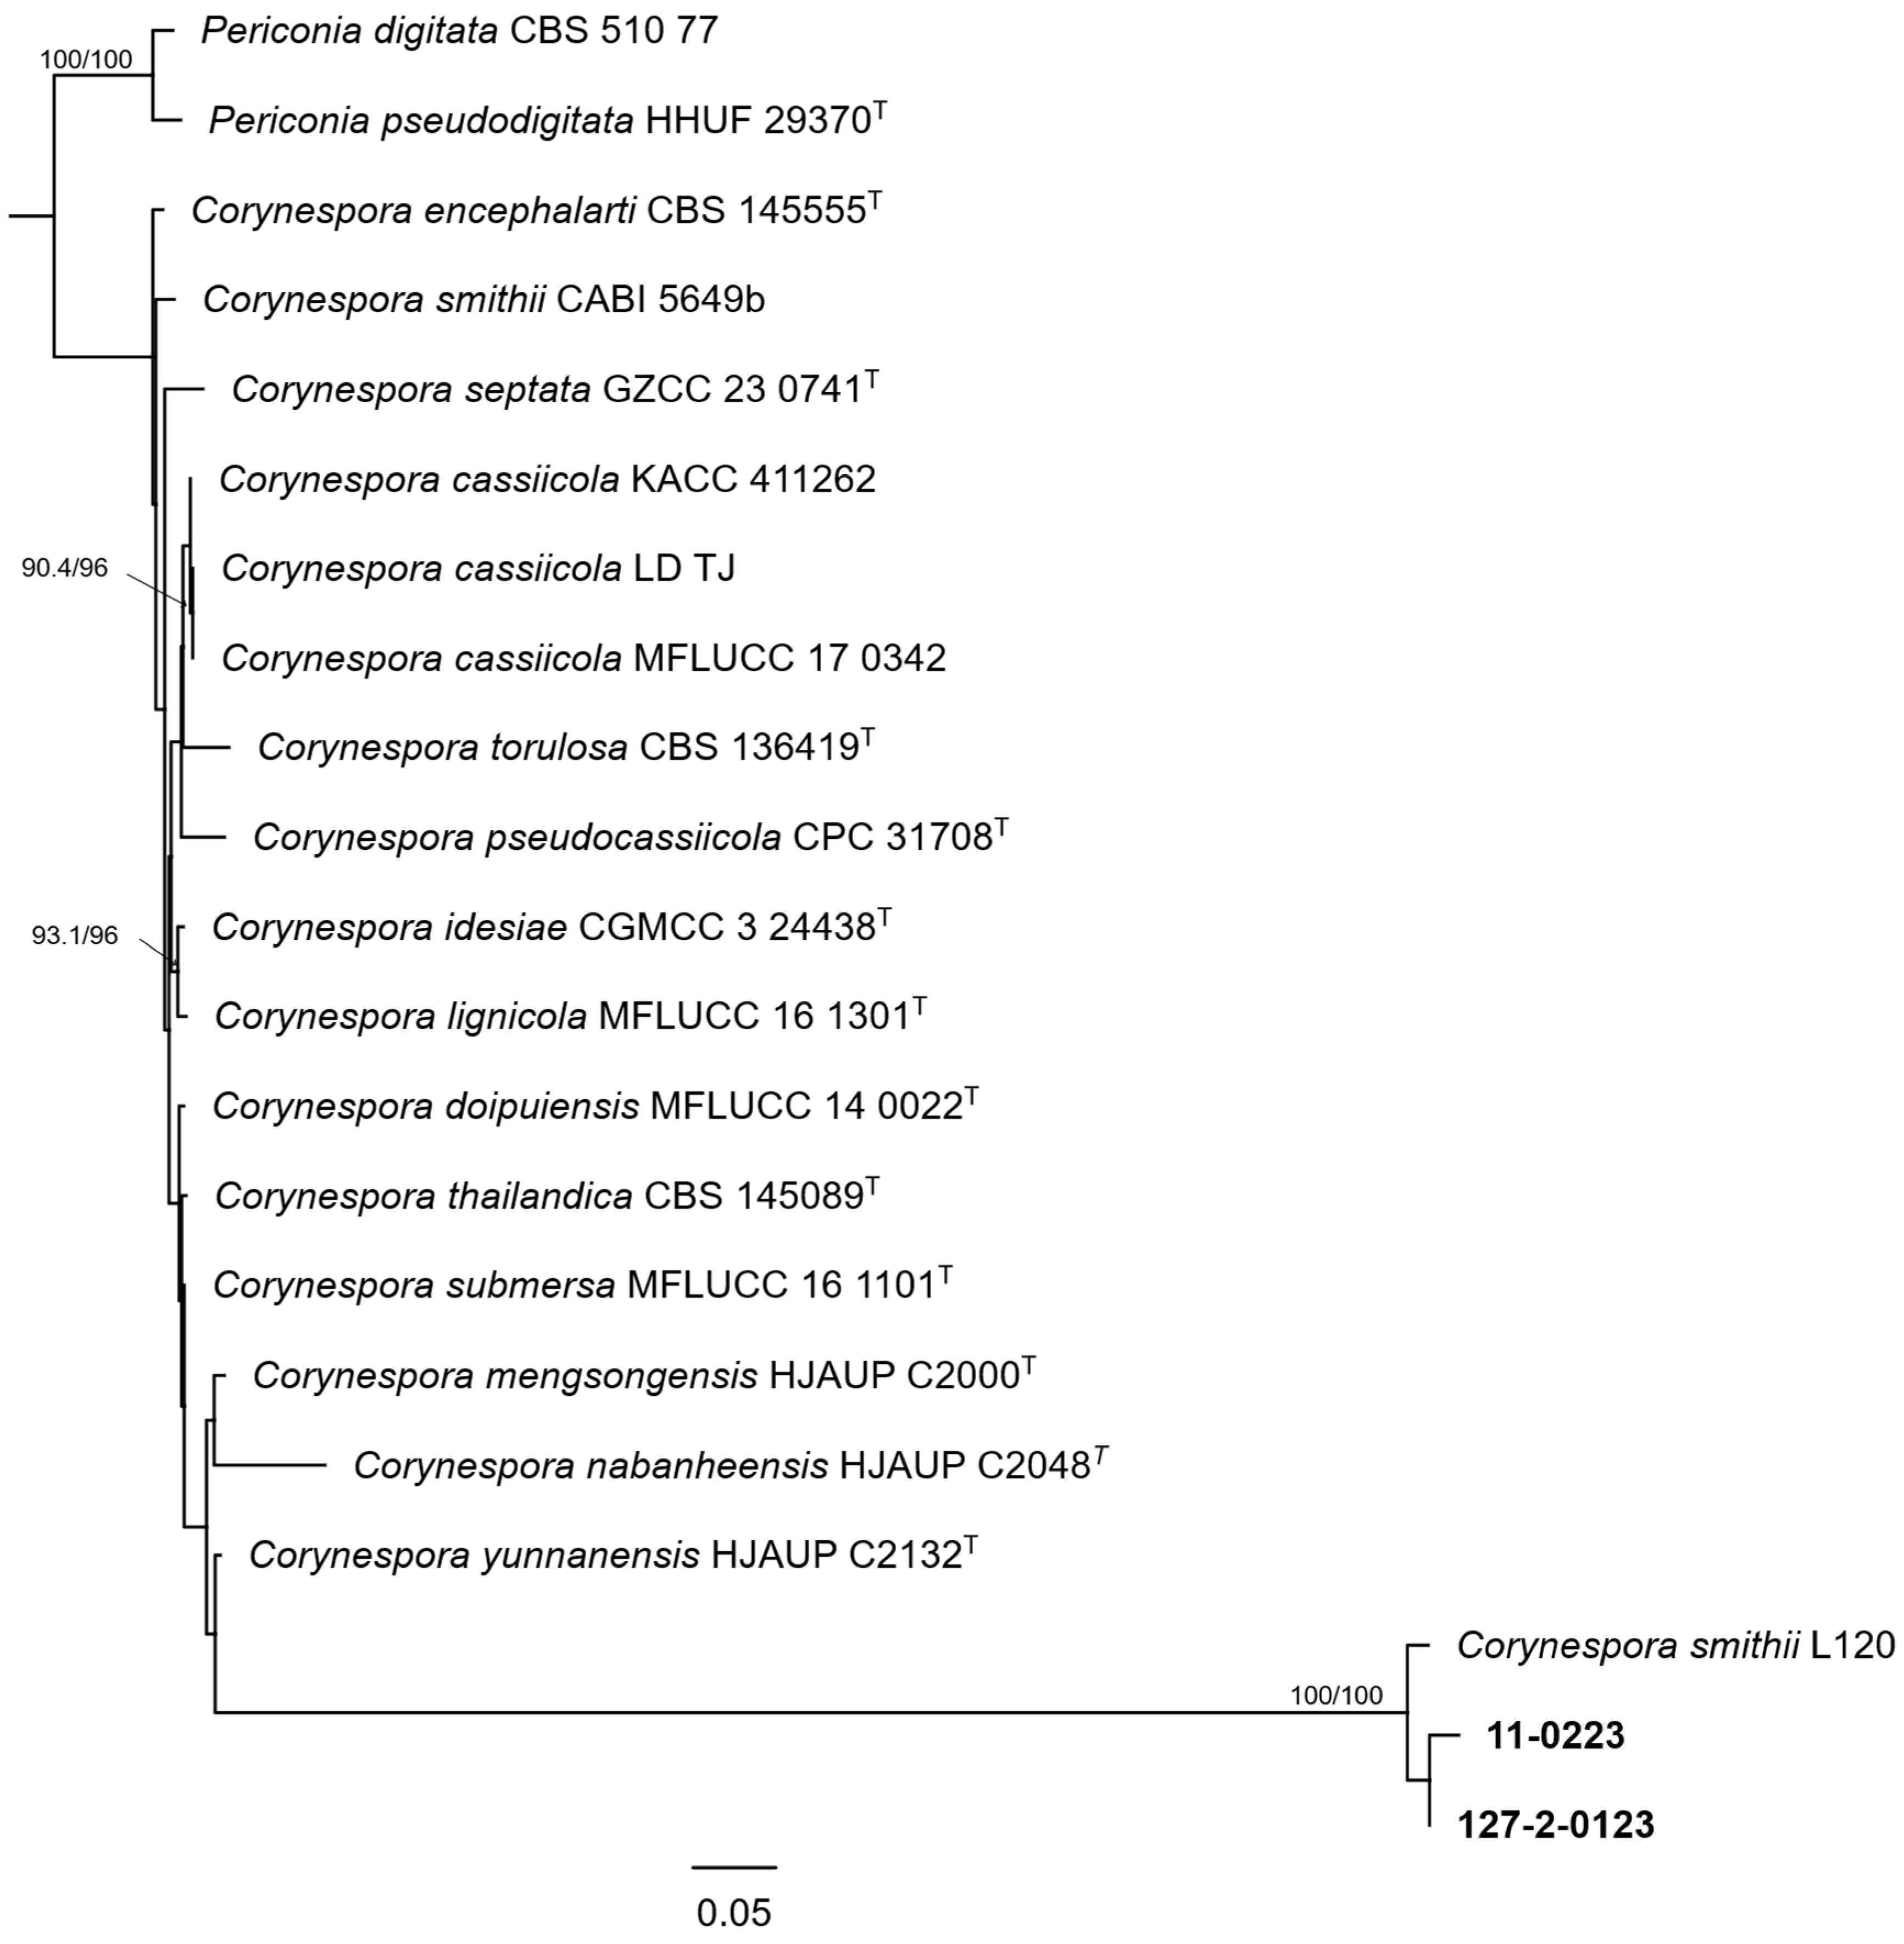
The maximum-likelihood analyses of the ITS, LSU, and combined ITS–LSU datasets included 21 terminal taxa, among them two isolates obtained in this study. The ITS alignment comprised 580 positions and was analyzed under the SYM+G4 model. The LSU alignment comprised 910 positions and was analyzed under the K2P+R2 model, whereas the combined dataset comprised 1490 positions and was analyzed under the SYM+R2 model.
In the ITS phylogeny, isolates 11-0223 and 127-2-0123 were placed in a clade containing the three reference strains of Corynespora cassiicola (Berk. & M.A. Curtis) C.T. Wei: LD-TJ, KACC 411262, and MFLUCC 17-0342. This lineage of five terminal taxa received SH-aLRT/UFBoot support of 95.3/95. However, the immediate relationship between the two isolates was unsupported, preventing a more precise placement within this lineage.
In the LSU analysis, isolate 127-2-0123 was placed close to Corynespora smithii (Berk. & Broome) M.B. Ellis L120, but this relationship had low branch support. Both taxa, together with isolate 11-0223, formed a strongly supported lineage (100/100). The same lineage of three terminal taxa was recovered in the combined analysis, also with 100/100 support, although the internal relationship between isolates 11-0223 and 127-2-0123 was not supported.

3.3. Diaporthe

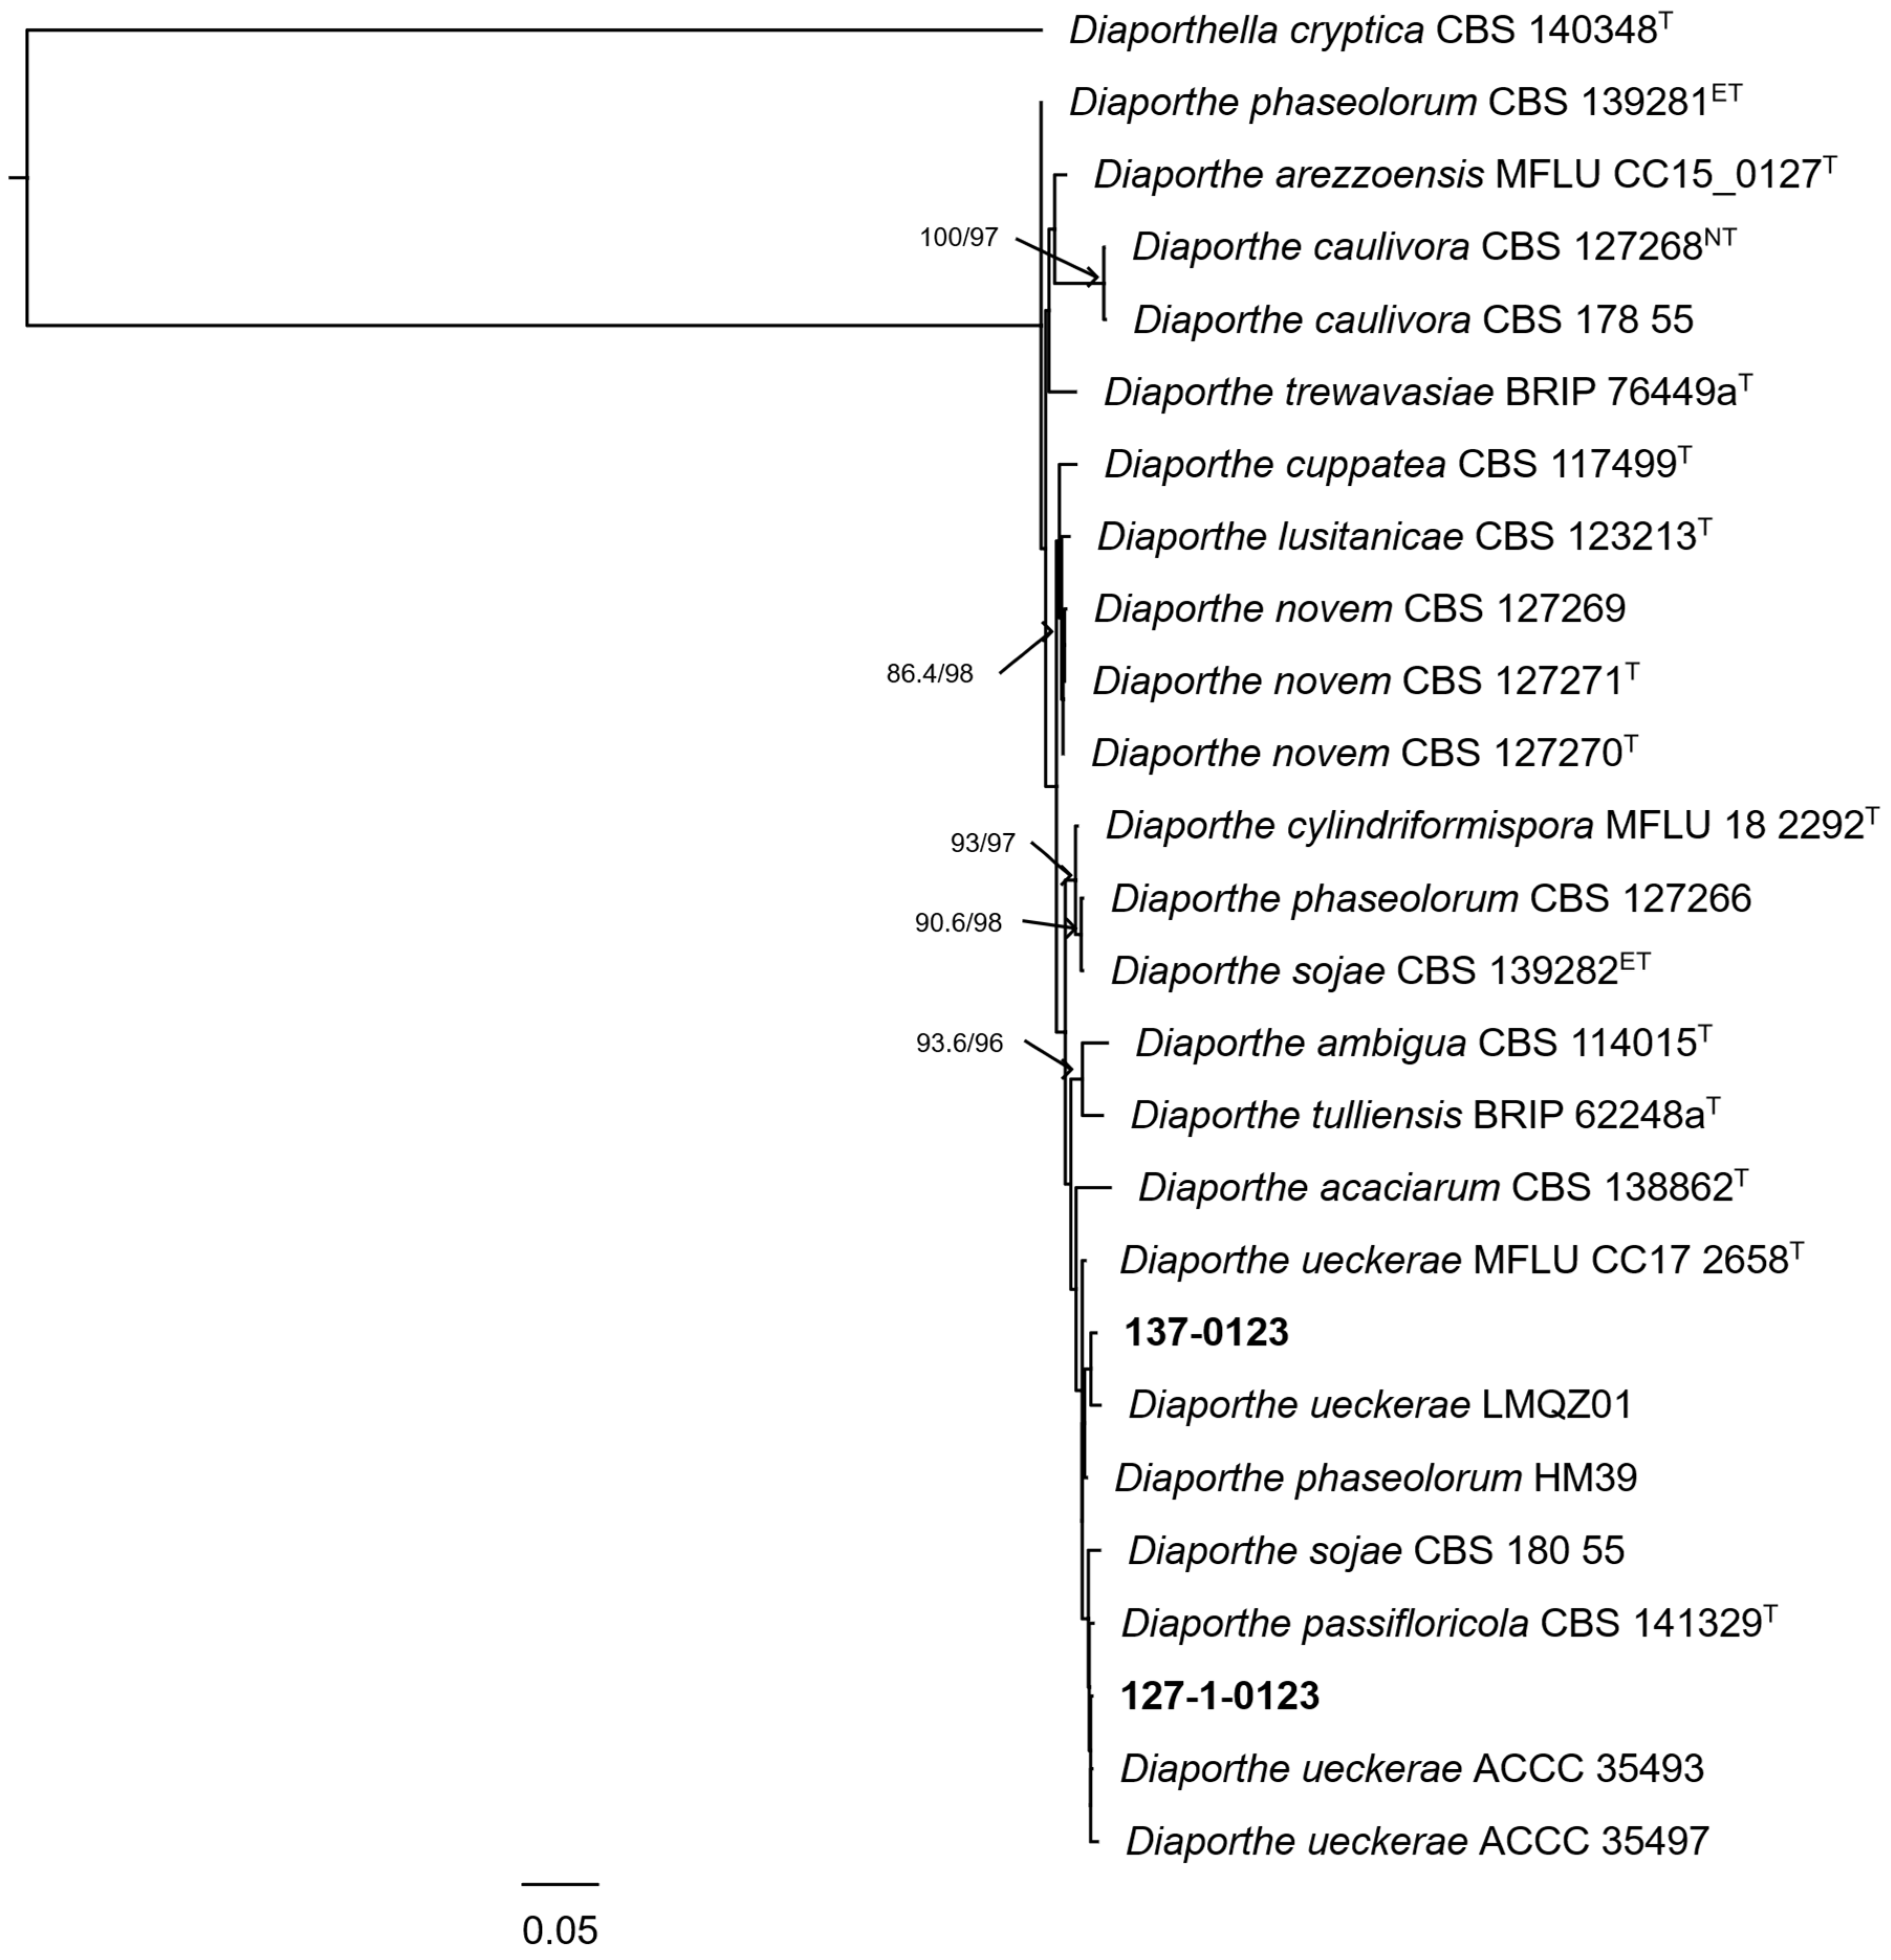
The maximum-likelihood analyses of the ITS, LSU, and combined ITS–LSU datasets included 26 terminal taxa, among them two isolates obtained in this study. The ITS alignment comprised 620 positions, whereas the LSU and combined datasets comprised 807 and 1427 positions, respectively.
In the ITS analysis, isolate 137-0123 was recovered as sister to Diaporthe ueckerae Udayanga & Castl. LMQZ01, although this relationship was not strongly supported. The same association was recovered in the combined ITS–LSU analysis, but support remained inconsistent between the two branch-support tests. The LSU analysis did not recover this relationship independently and placed isolate 137-0123 in an unresolved lineage containing D. ueckerae LMQZ01 and D. ueckerae MFLUCC 17-2658. Therefore, the analyses suggest phylogenetic affinity between isolate 137-0123 and D. ueckerae, but do not consistently support its assignment to that species.
Isolate 127-1-0123 was placed in a broader lineage containing D. ueckerae, Diaporthe passifloricola Crous & M.J. Wingf., Diaporthe sojae Lehman, and Diaporthe phaseolorum (Cooke & Ellis) Sacc., but its immediate phylogenetic position remained unresolved. In the ITS analysis, the isolate occurred with D. ueckerae ACCC 35493 and the ex-type strain of D. passifloricola in a weakly supported grouping. In the combined analysis, it was associated with D. ueckerae ACCC 35493 and ACCC 35497, D. passifloricola CBS 141329, and D. sojae CBS 180.55, but this relationship was also not strongly supported. Thus, the available data support its placement in Diaporthe, but not its assignment to a specific species.
None of the isolates formed a strongly supported lineage with the nomenclatural reference of a single species across the three analyses. Therefore, isolates 127-1-0123 and 137-0123 were retained as Diaporthe sp.

3.4. Fusarium

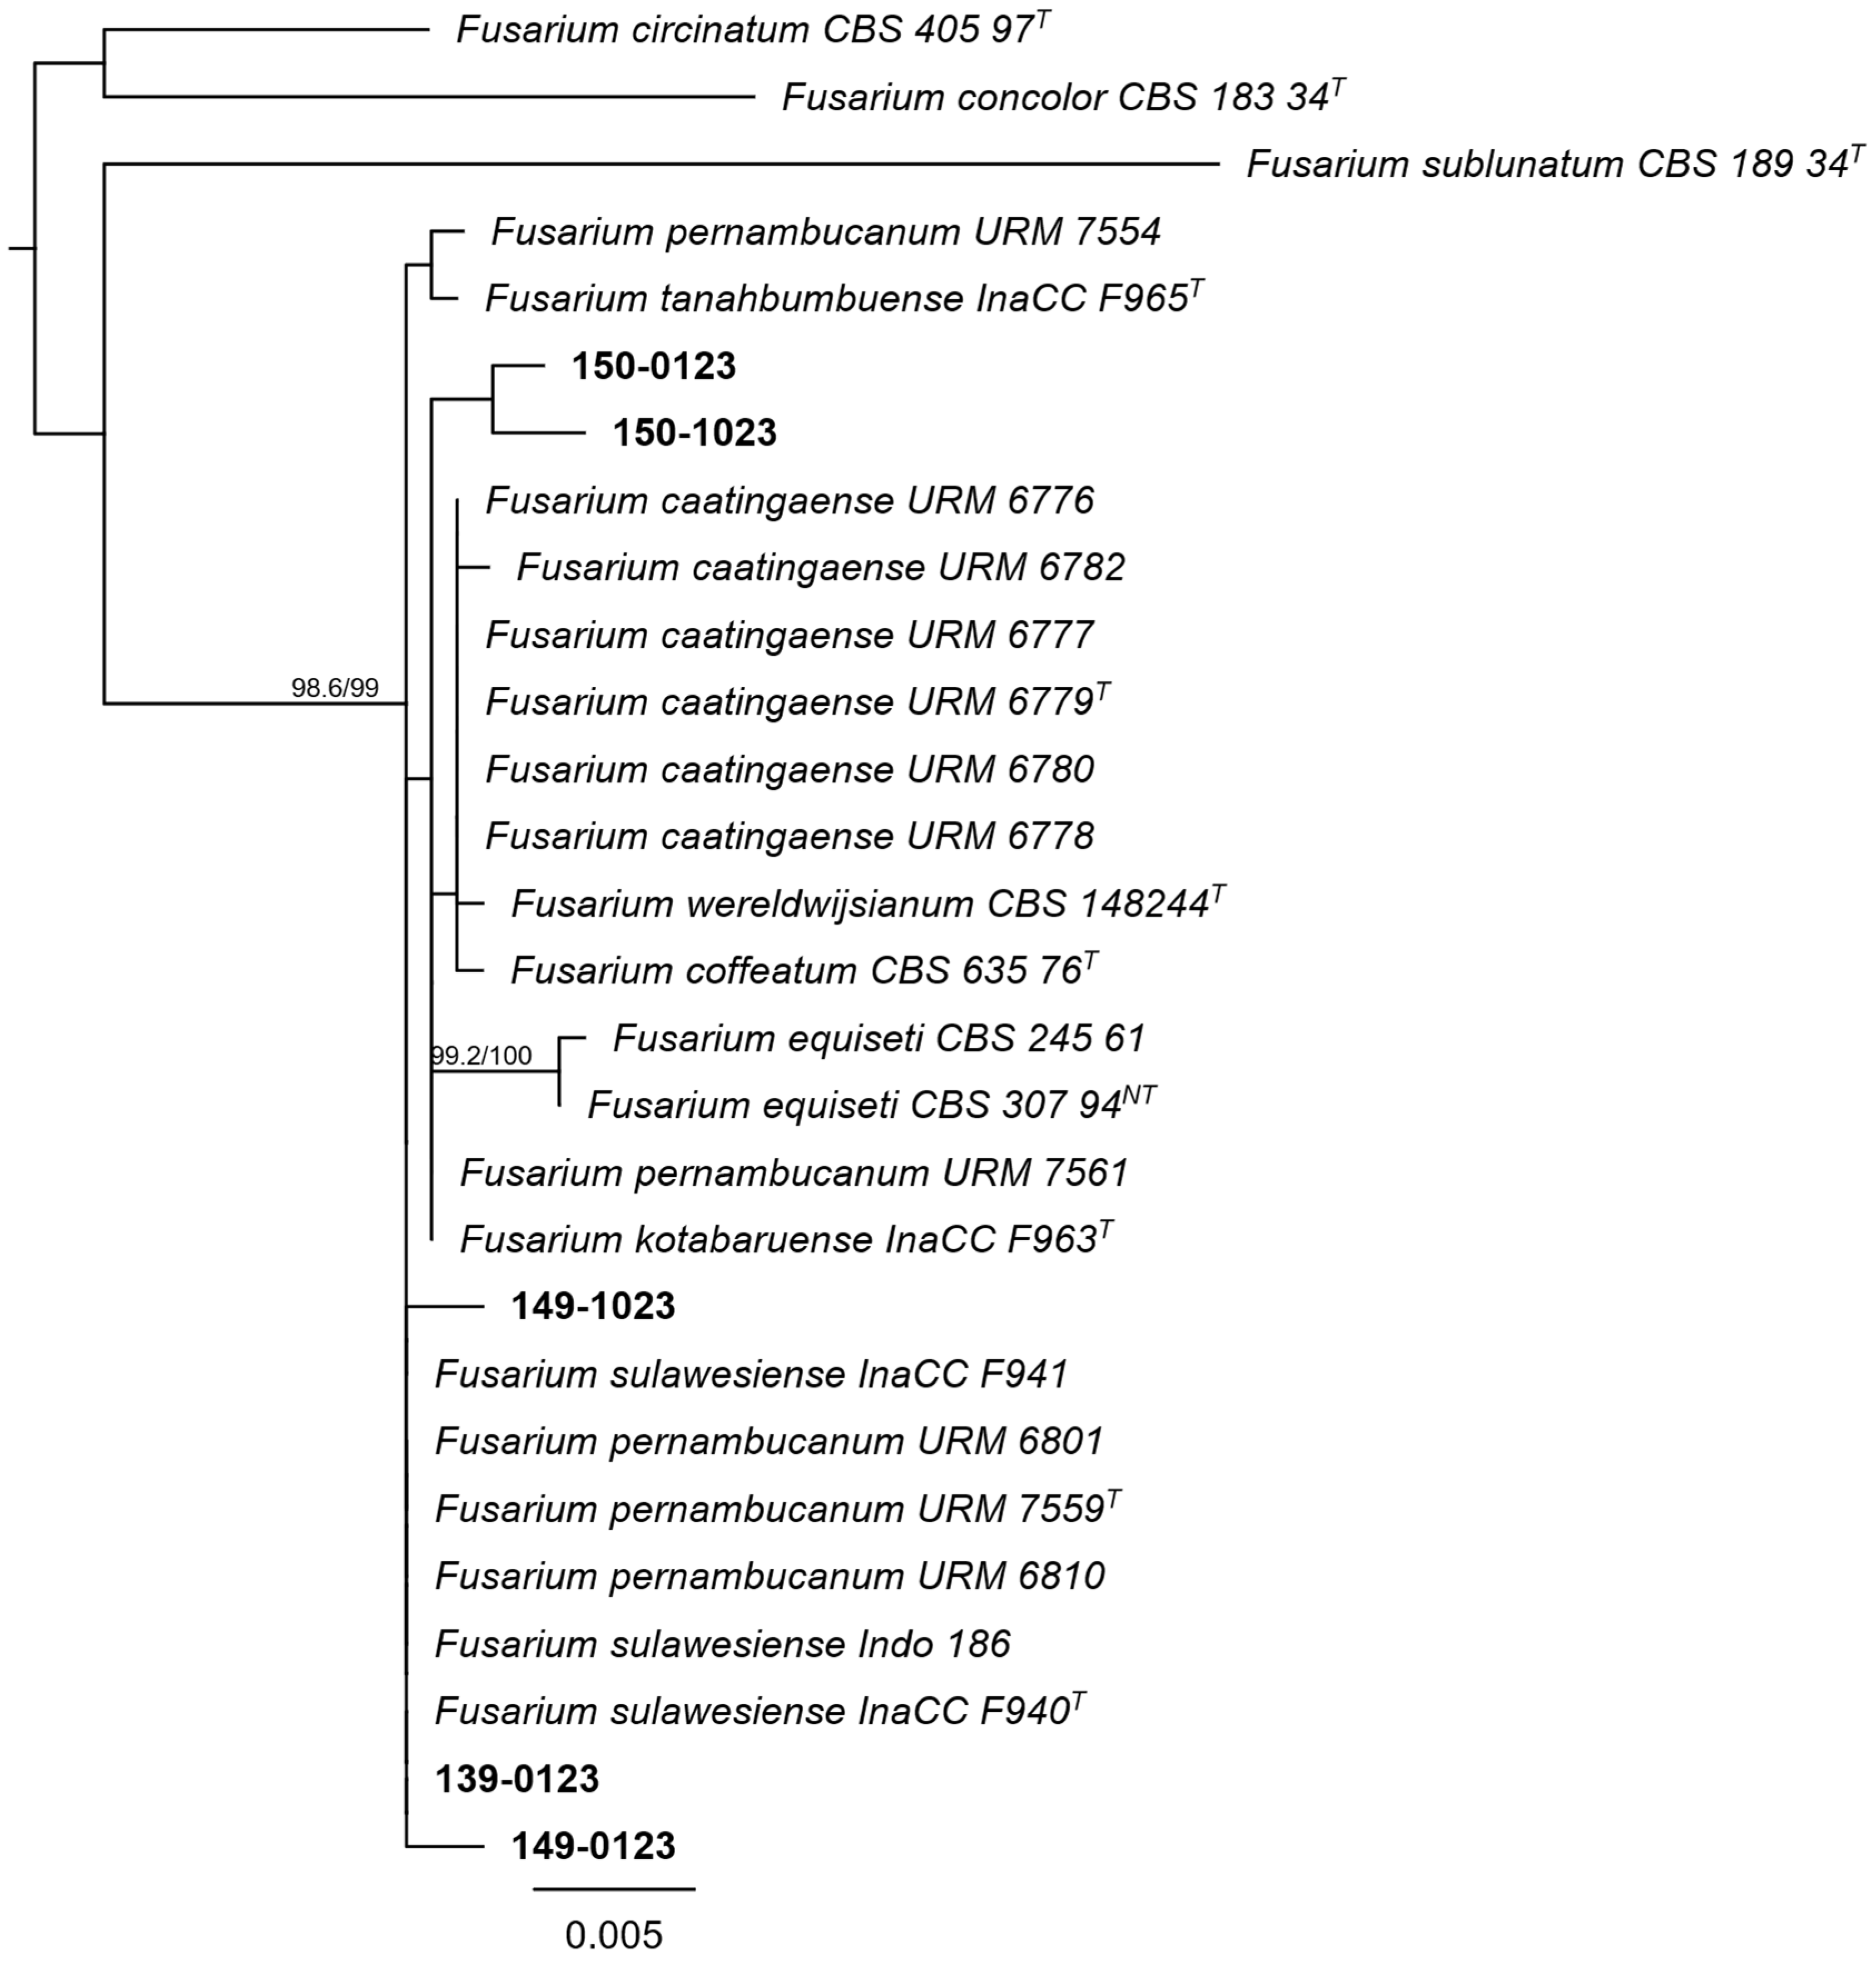
The maximum-likelihood analyses of the ITS, LSU, and combined ITS–LSU datasets included 28 terminal taxa, among them five isolates obtained in this study. The ITS alignment comprised 560 positions and was analyzed under the JC+I model. The LSU alignment comprised 775 positions and was analyzed under the K2P model, whereas the unpartitioned combined dataset comprised 1335 positions and was analyzed under the K2P+I model.
All five isolates were placed in the main lineage containing the sampled representatives of the Fusarium incarnatum-equiseti species complex (FIESC). In the combined ITS–LSU analysis, this lineage received strong SH-aLRT/UFBoot support (98.6/99). The corresponding grouping was also recovered in the ITS and LSU analyses, although support did not simultaneously reach the thresholds adopted for strong branch support.
Isolates 150-0123 and 150-1023 formed a pair in the ITS and combined analyses, but this relationship was not strongly supported and was not recovered in the LSU analysis. Isolates 139-0123 and 149-0123 were placed adjacently in the ITS and combined topologies, although this relationship was unsupported and was likewise not recovered in the LSU analysis.
Isolate 149-1023 showed an unstable position among the datasets. It was placed close to isolates 150-0123 and 150-1023 in the ITS analysis, close to isolate 150-0123 in the LSU analysis, and adjacent to Fusarium sulawesiense Maryani, Sand.-Den., L. Lombard, Kema & Crous, InaCC F941 in the combined topology. None of these relationships showed strong branch support.
No isolate formed a consistent, strongly supported sister relationship with a sequence derived from type material or with the nomenclatural reference of a single species. Therefore, the five isolates were retained as Fusarium sp., with phylogenetic affinity to the FIESC.

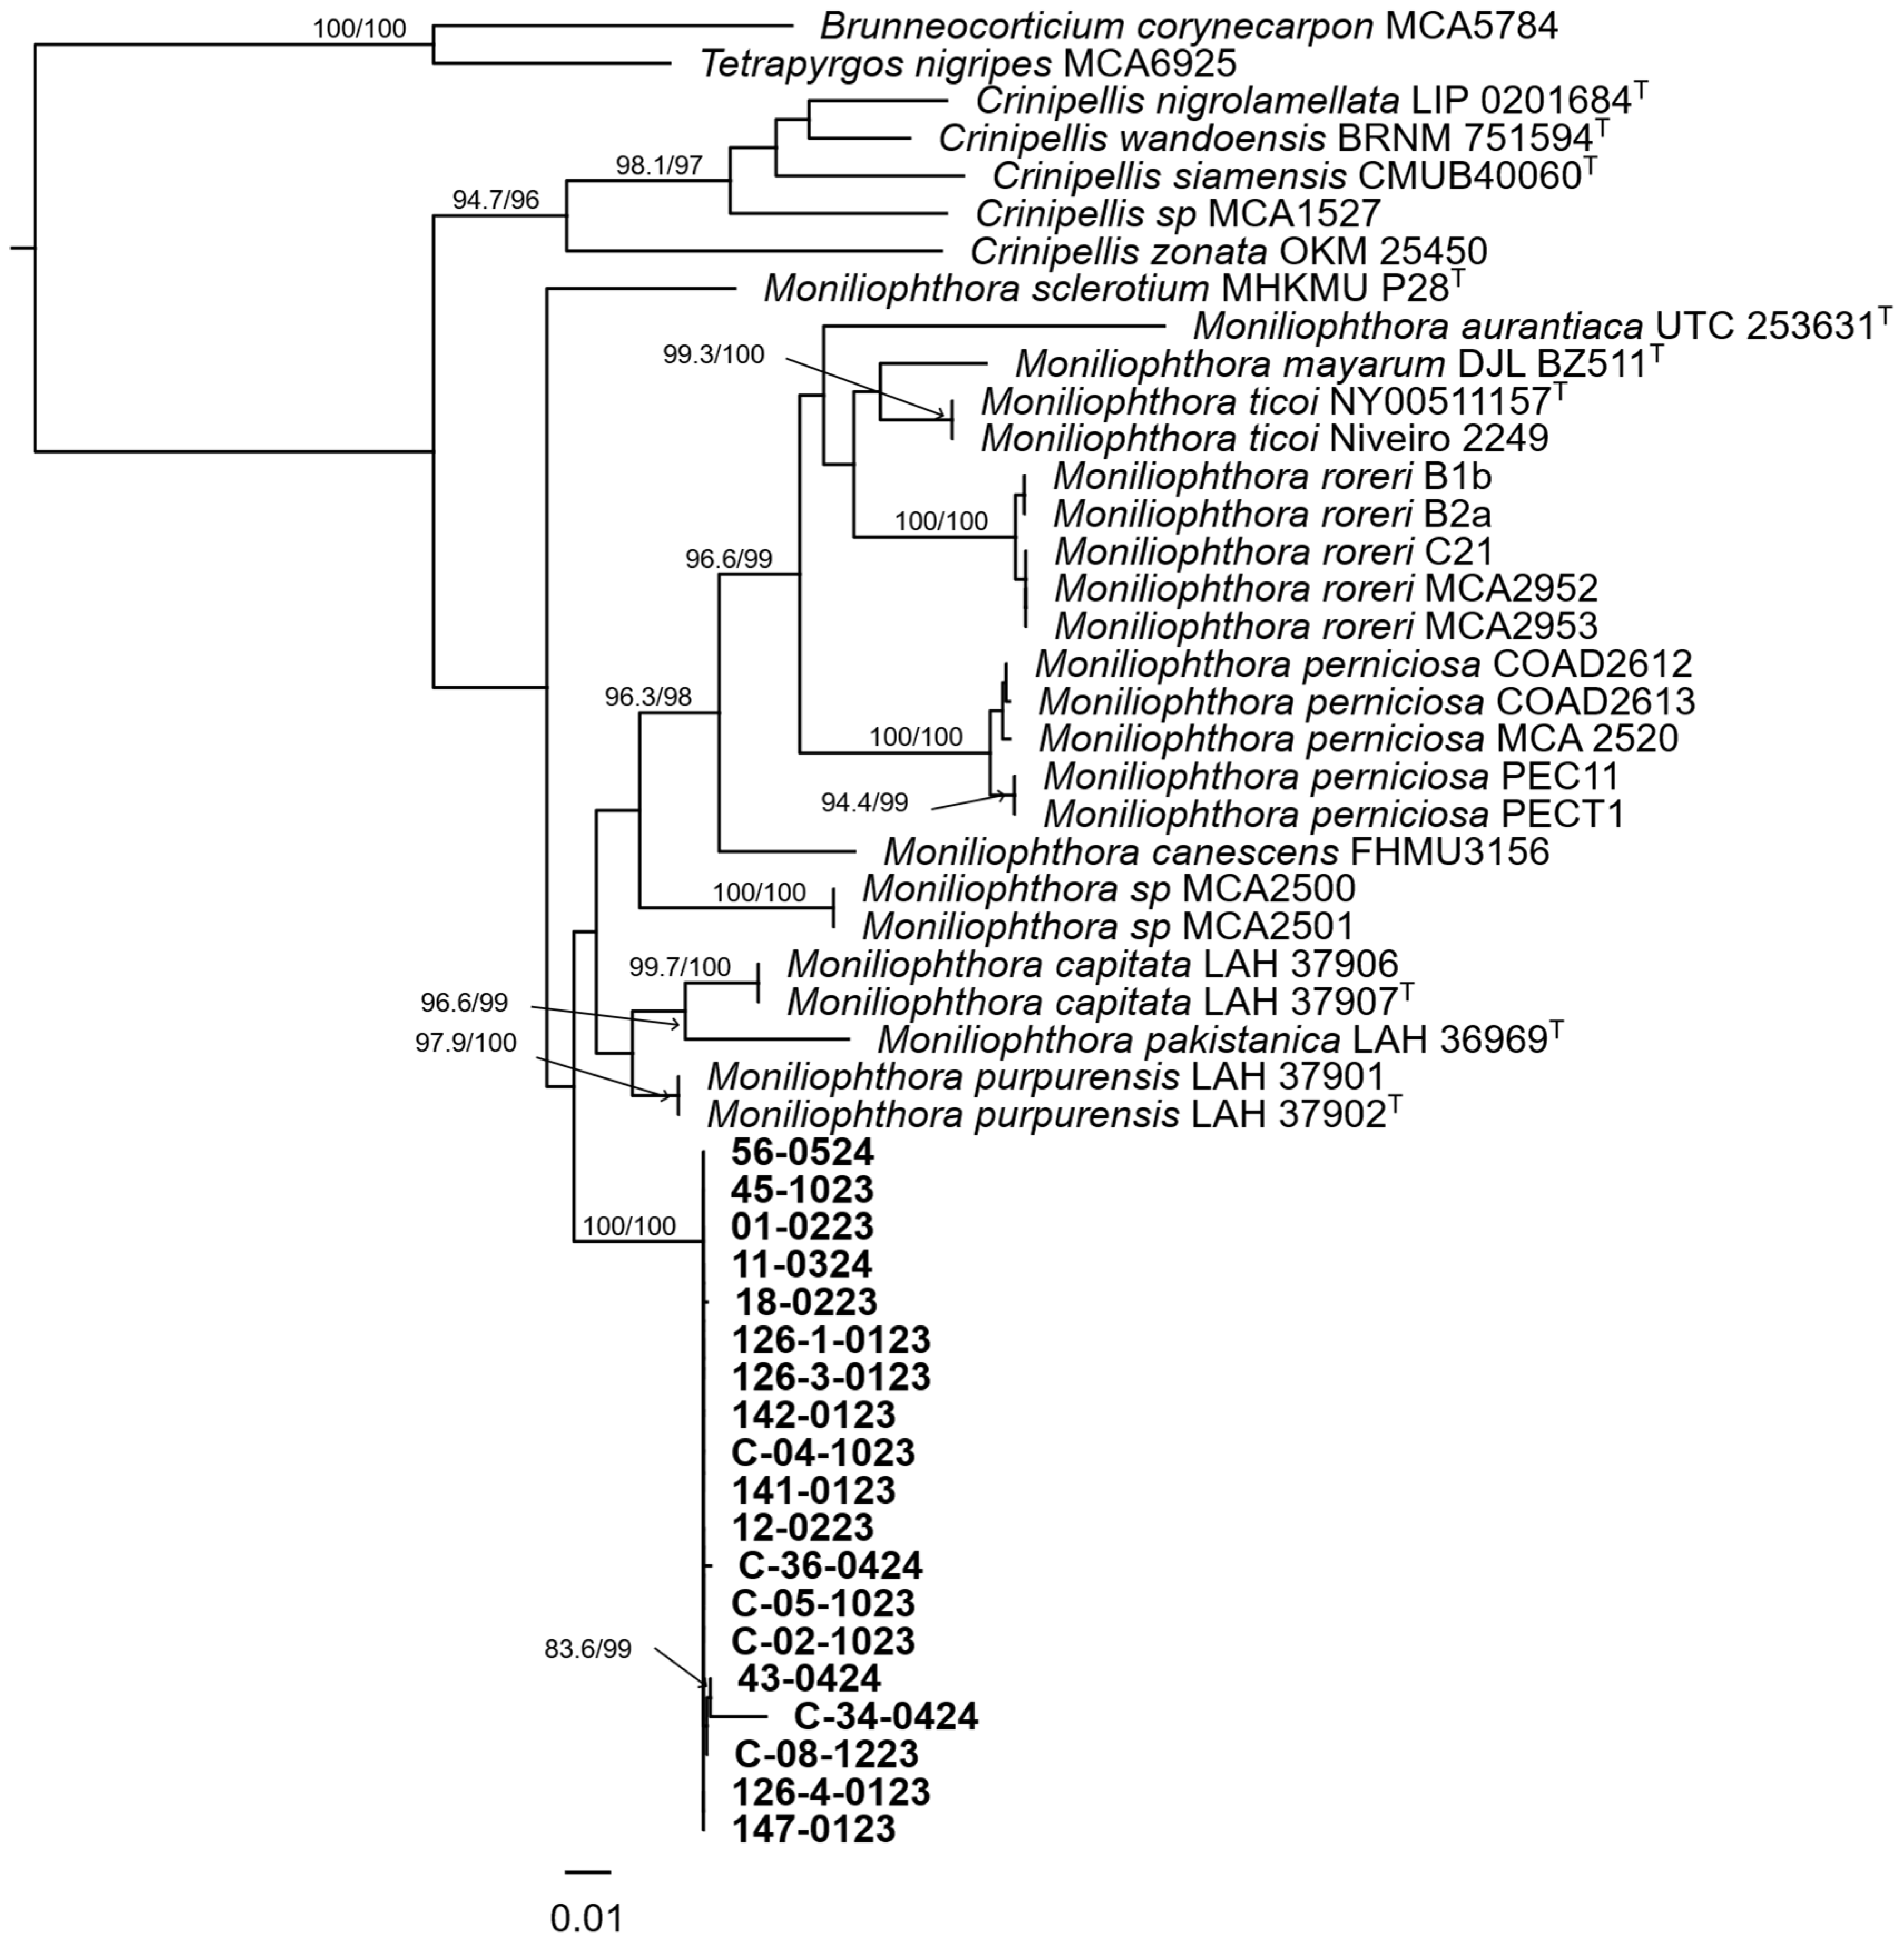
3.5. Moniliophthora

The maximum-likelihood analyses of the ITS, LSU, and combined ITS–LSU datasets included 49 terminal taxa, comprising 19 isolates obtained in this study, 28 ingroup reference sequences, and two outgroups. The ITS alignment comprised 755 positions and was analyzed under the TPM2u+F+G4 substitution model. The LSU alignment comprised 875 positions and was analyzed under the TIM2e+R2 model, whereas the unpartitioned combined dataset comprised 1630 positions and was analyzed under the GTR+F+R3 model.
The 19 isolates obtained from soybean tissues formed a strongly supported monophyletic lineage in the ITS, LSU, and combined ITS–LSU analyses. This lineage received SH-aLRT/UFBoot support of 99.8/100 in the ITS analysis, 90.6/98 in the LSU analysis, and 100/100 in the combined analysis. No identified reference sequence or sequence derived from type material was included in the lineage formed by the isolates from this study.
The position of this lineage relative to the reference taxa varied among the individual loci. In the LSU analysis, the soybean isolates were placed close to Moniliophthora pakistanica A. Izhar, M. Asif, Niazi & Khalid, LAH 36969 and to the unidentified strains Moniliophthora sp. MCA 2500 and MCA 2501. However, none of these reference lineages was consistently recovered as the immediate sister lineage of the soybean isolates across the ITS, LSU, and combined analyses.
The internal relationships among the soybean isolates remained mostly unresolved, and several isolates had identical or nearly identical ribosomal sequences. Because this lineage was not consistently associated with type-derived material of any identified species, the 19 isolates were retained as Moniliophthora sp.

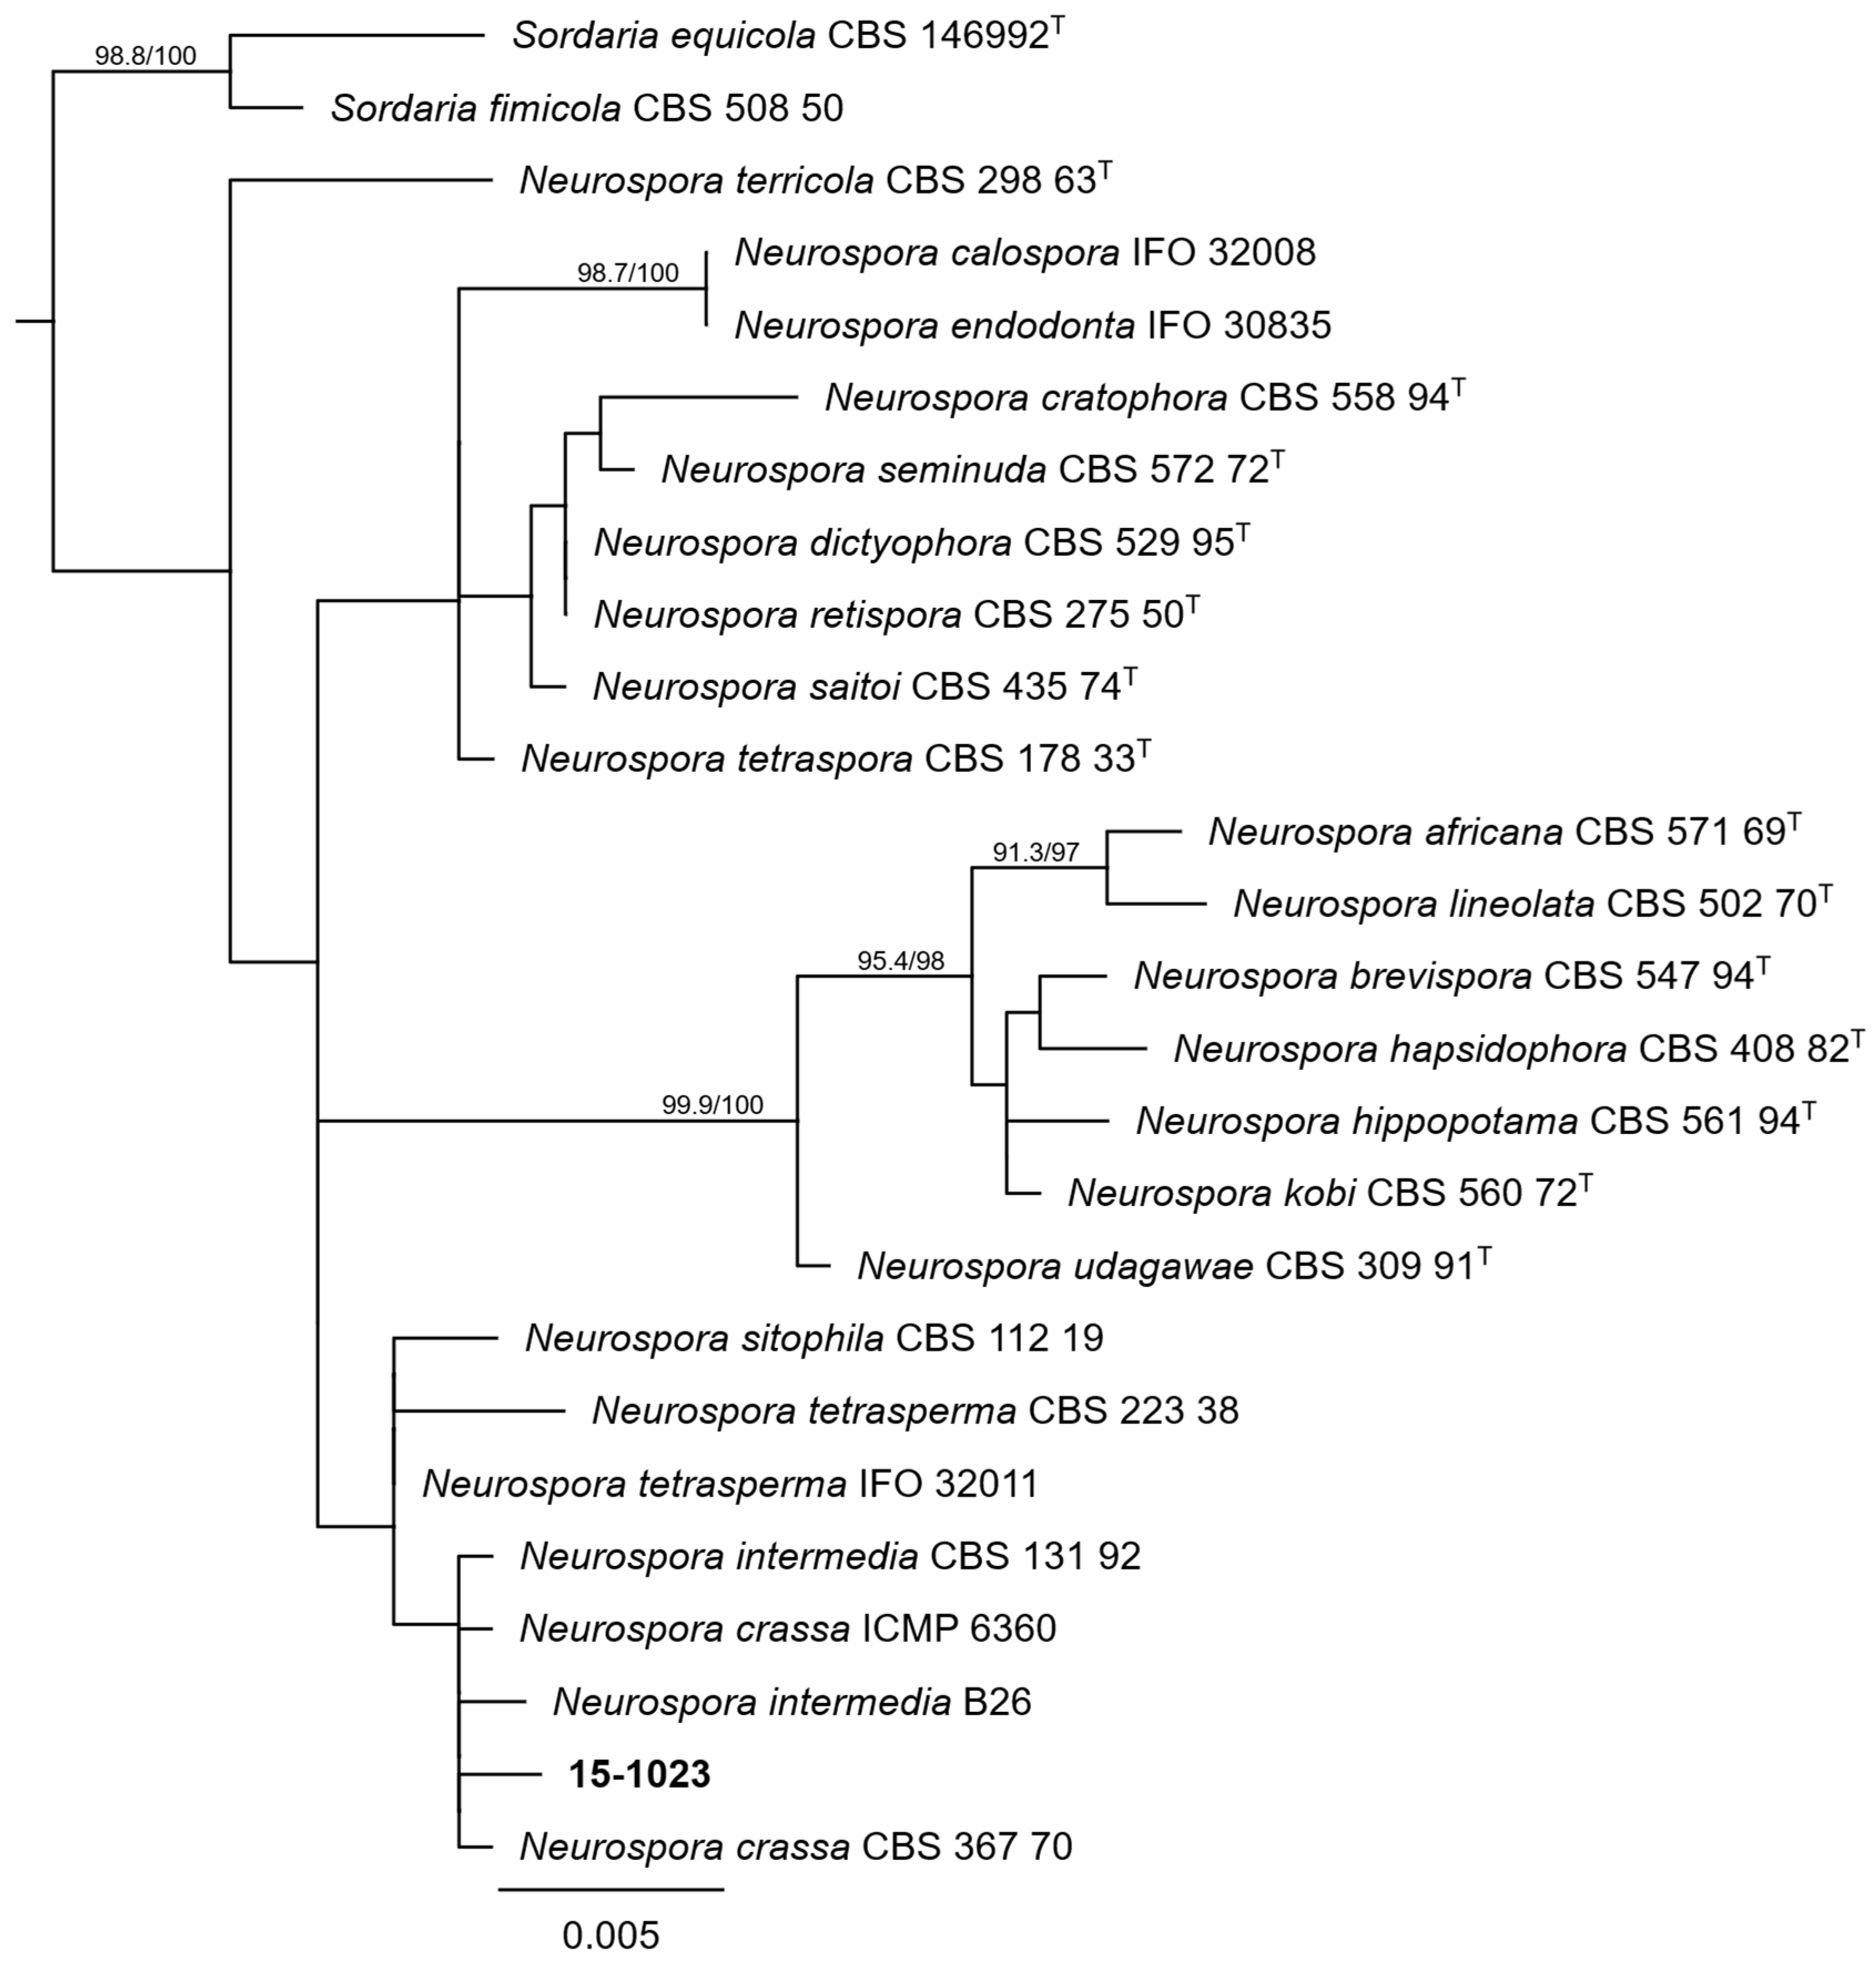
3.6. Neurospora

The maximum-likelihood analyses of the ITS, LSU, and combined ITS–LSU datasets included 26 terminal taxa, comprising one isolate obtained in this study, 23 Neurospora reference strains, and two outgroups. The ITS alignment comprised 591 positions and was analyzed under the TNe+I model. The LSU alignment comprised 820 positions and was analyzed under the TN+F+R2 model, whereas the unpartitioned combined dataset comprised 1411 positions and was analyzed under the K2P+R2 model.
Isolate 15-1023 was placed within a lineage containing Neurospora crassa Shear & B.O. Dodge, N. intermedia F.L. Tai, N. sitophila Shear & B.O. Dodge, and N. tetrasperma Shear & B.O. Dodge in the ITS, LSU, and combined ITS–LSU analyses. Its closest topological association varied among the datasets, including N. crassa CBS 367.70 and N. crassa ICMP 6360, but none of these immediate relationships received branch support. Therefore, the available phylogenetic evidence supports the placement of isolate 15-1023 in Neurospora, but not its assignment to a specific species. Consequently, the isolate was retained as Neurospora sp.

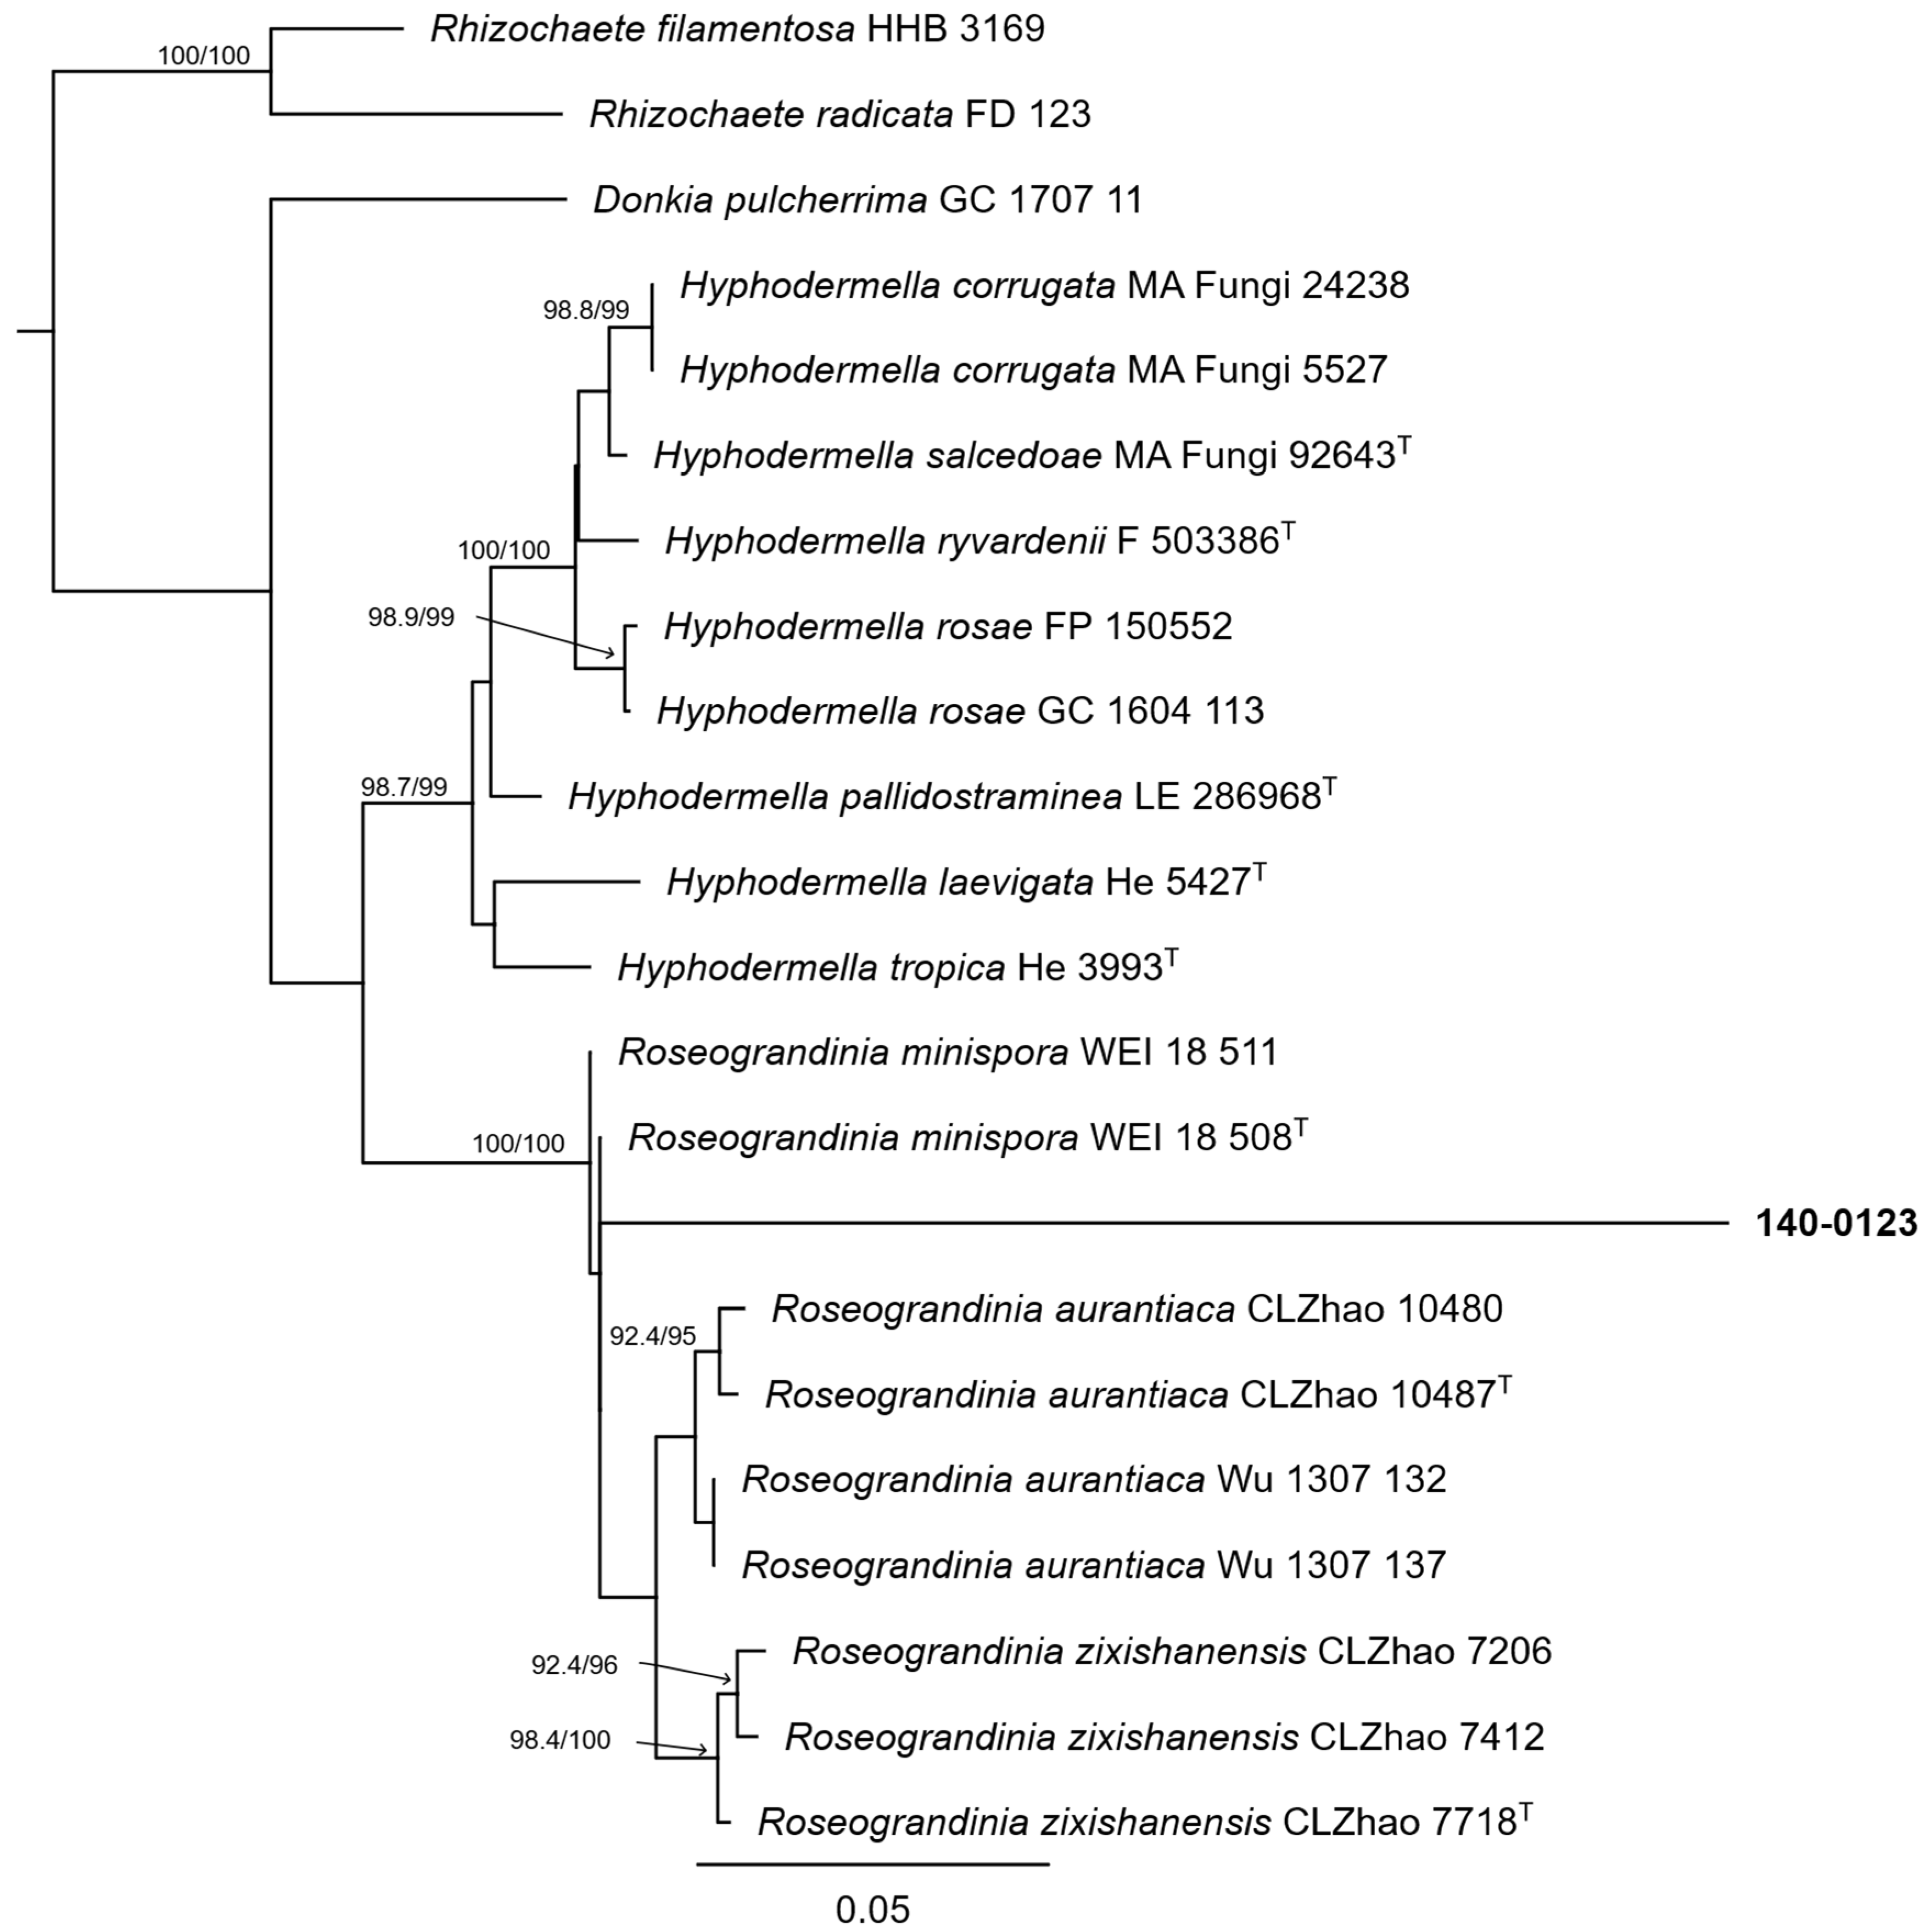
3.7. Roseograndinia

The maximum-likelihood analyses of the ITS, LSU, and combined ITS–LSU datasets included 22 terminal taxa, comprising one isolate obtained in this study, 19 ingroup reference sequences, and two outgroups. The ITS alignment comprised 726 positions and was analyzed under the TPM2u+F+G4 substitution model. The LSU alignment comprised 865 positions and was analyzed under the TNe+I model, whereas the unpartitioned combined dataset comprised 1591 positions and was analyzed under the K2P+R2 model.
Isolate 140-0123 was placed in the lineage containing the sampled Roseograndinia species in the ITS, LSU, and combined ITS–LSU analyses. In the LSU analysis, the isolate was placed close to R. minispora WEI 18-508, whereas its immediate relationships varied between the ITS and combined topologies. None of these relationships showed strong branch support.
Therefore, the available phylogenetic evidence supports the placement of isolate 140-0123 in Roseograndinia, but not its assignment to a specific species. Consequently, the isolate was retained as Roseograndinia sp.

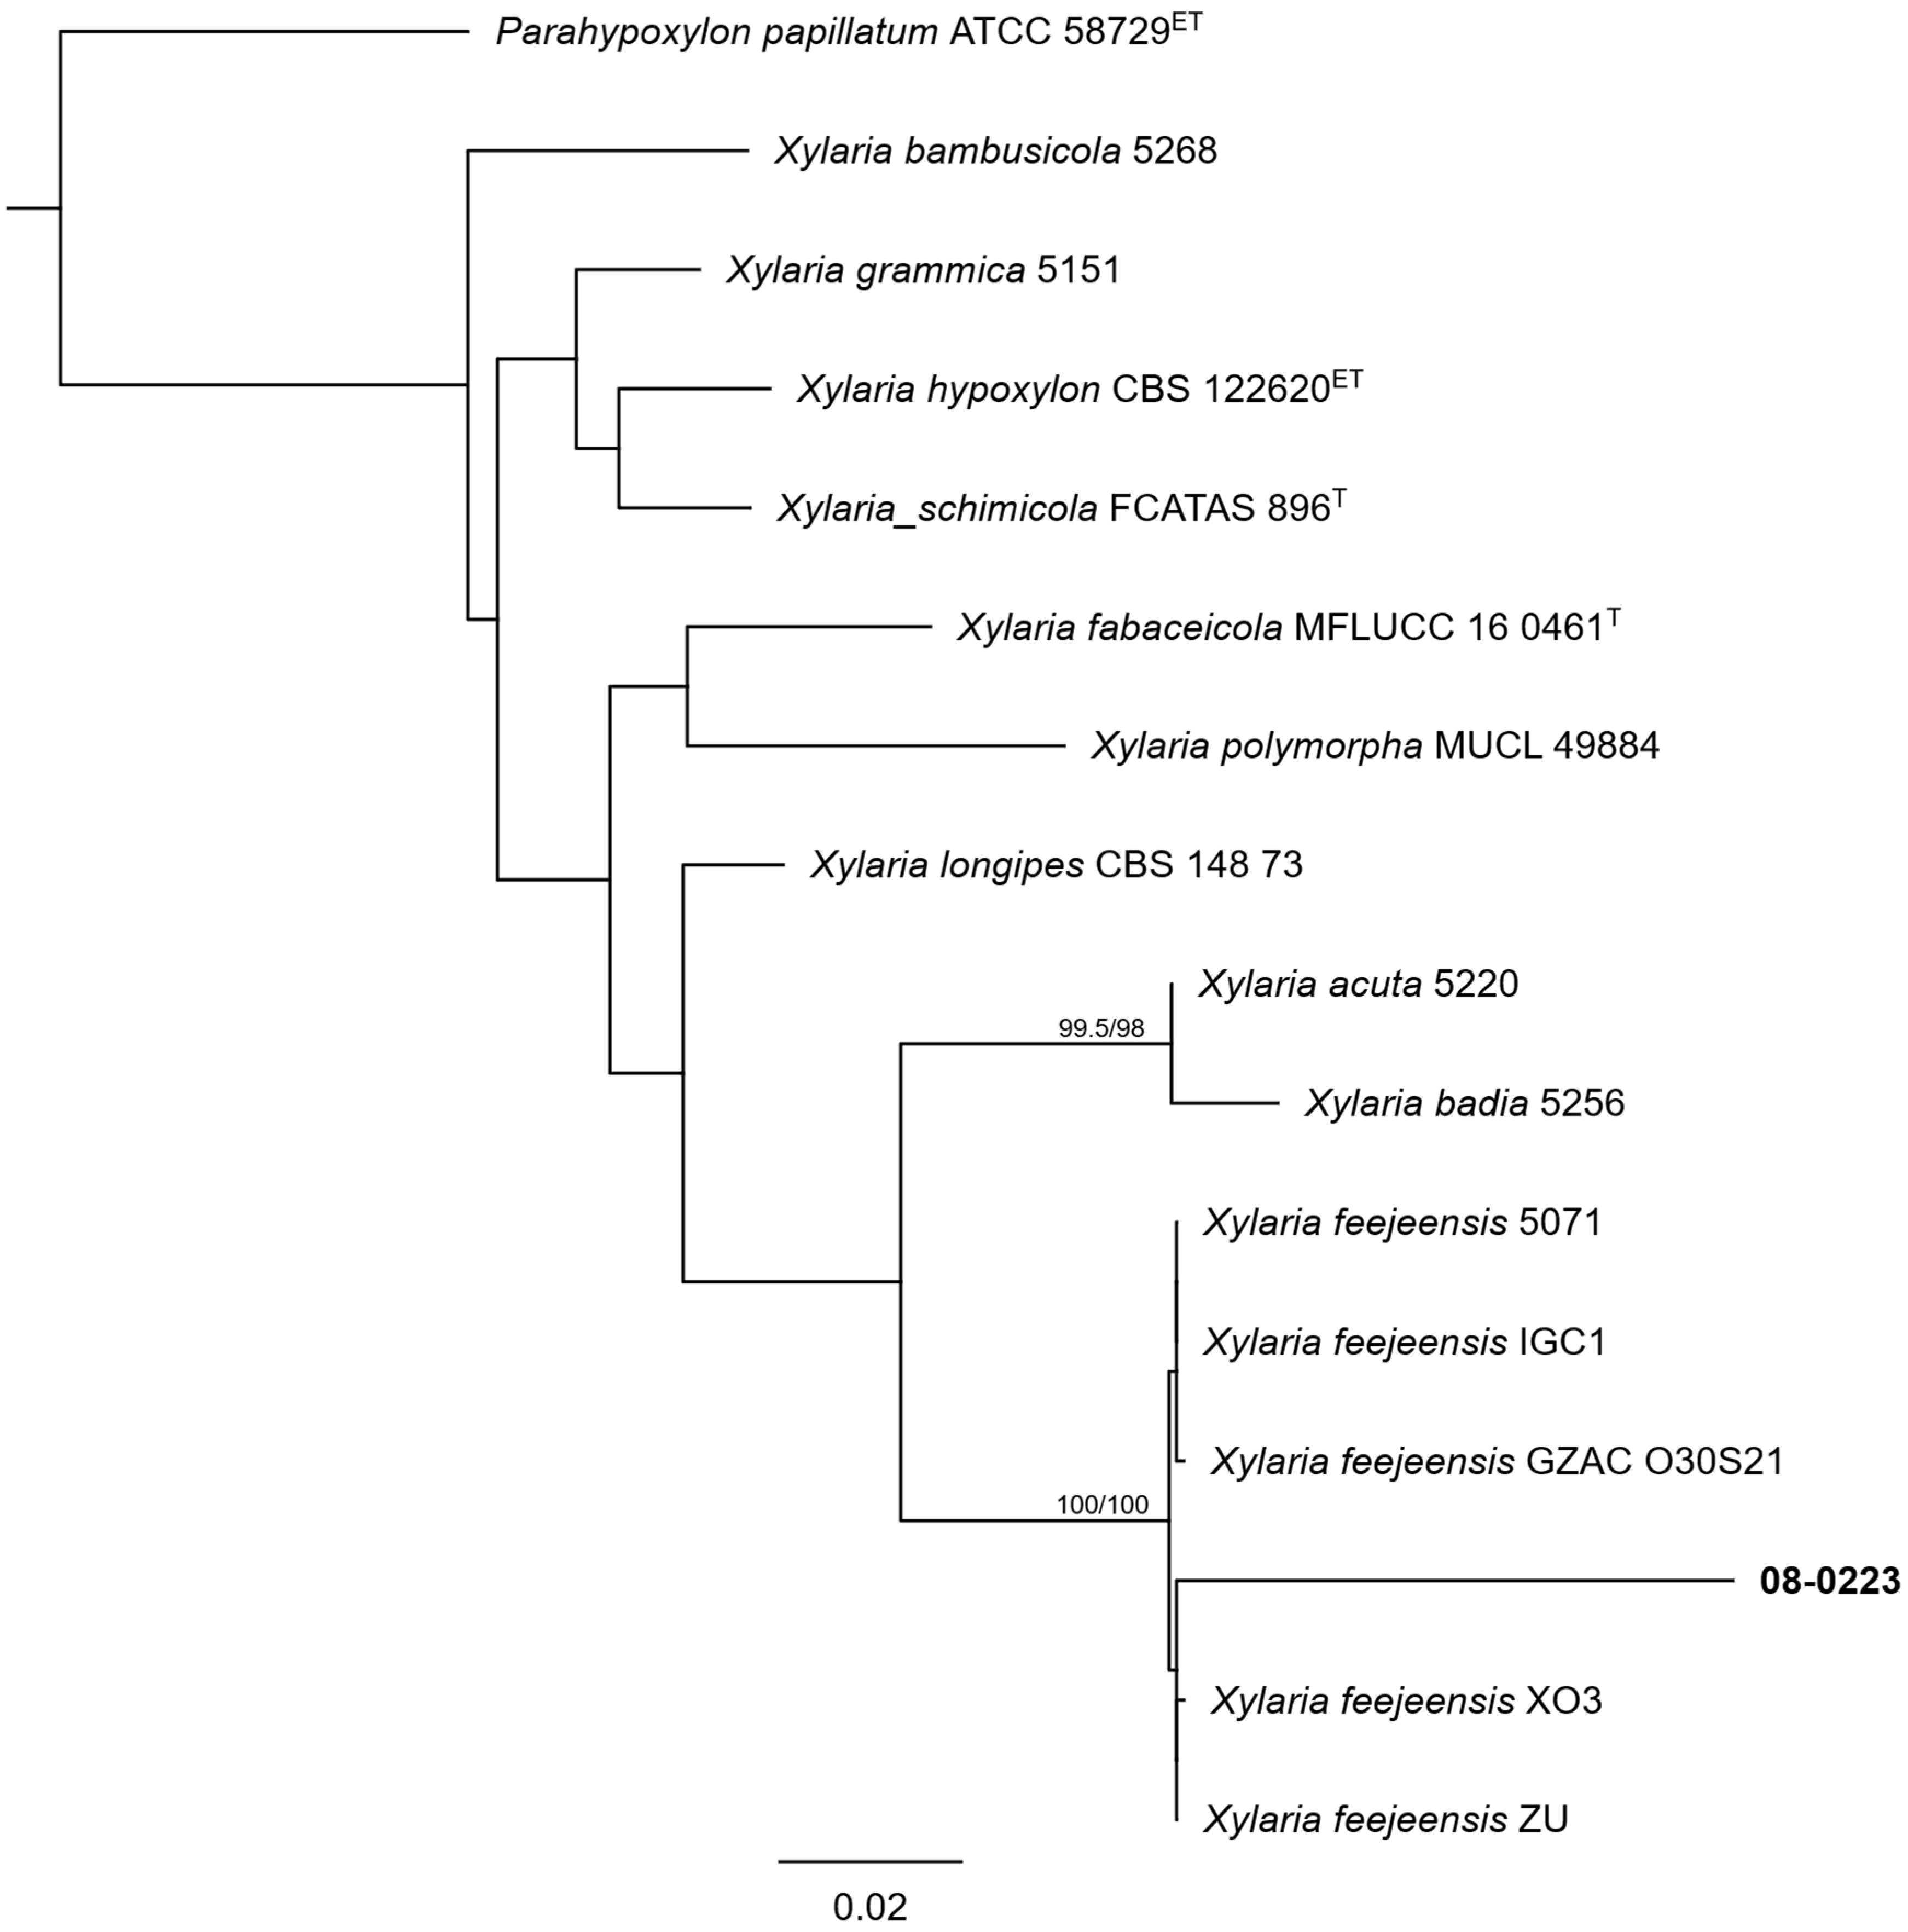
3.8. Xylaria

The maximum-likelihood analyses of the ITS, LSU, and combined ITS–LSU datasets included 16 terminal taxa, comprising one isolate obtained in this study, 14 ingroup reference sequences, and one outgroup. The ITS alignment comprised 498 positions and was analyzed under the TNe+R2 substitution model. The LSU alignment comprised 841 positions and was analyzed under the TNe+I model, whereas the unpartitioned combined dataset comprised 1339 positions and was analyzed under the K2P+R2 model.
Isolate 08-0223 was consistently placed close to the sampled reference strains of Xylaria feejeensis (Berk.) Fr. In the ITS analysis, the isolate and the five X. feejeensis references formed a strongly supported lineage (100/100), although the immediate position of isolate 08-0223 within this grouping remained unresolved.
In the LSU analysis, isolate 08-0223 was placed close to X. feejeensis GZAC O30S21, but this immediate relationship was not strongly supported. The broader lineage comprising the isolate, the sampled X. feejeensis references, and Xylaria acuta Peck 5220 received strong support (99/100).
The combined ITS–LSU analysis also recovered isolate 08-0223 and the five X. feejeensis references in a strongly supported lineage (100/100). However, the internal relationship between isolate 08-0223 and the reference strains X. feejeensis XO3 and ZU was not strongly supported.
Thus, the analyses consistently indicated phylogenetic affinity between isolate 08-0223 and the sampled X. feejeensis lineage. However, because its immediate relationships remained unresolved and no sequence derived from type material of X. feejeensis was included, the isolate was retained as Xylaria sp., with affinity to X. feejeensis.
Symptomatic samples analyzed in this study were predominantly obtained from plants at the R5.1 reproductive stage onward and exhibited alterations mainly concentrated in pods and seeds. Externally, water-soaked areas associated with brown to olive-brown discoloration of the pericarp were observed, consistent with the onset of pod deterioration.
Internal examination revealed that these external water-soaked regions corresponded to immature seeds undergoing deterioration, characterized by darkening, tissue disorganization, and collapse, consistent with seed rot within the pod. In some samples, precocious in situ germination of seeds still undergoing filling was recorded, frequently occurring in the same regions associated with water-soaking. This process was accompanied by degradation and darkening of the seed coat and protrusion of the embryonic axis.
Additionally, crop residues from symptomatic plants exhibited stem fragments with fungal colonization on senescent or necrotic tissues, along with the presence of fruiting structures (Figure 1E,F).

4. Discussion

The recovery of 36 fungal isolates assigned to eight genera demonstrates the taxonomic diversity of fungi associated with soybean tissues showing anomaly symptoms. The phylogenetic analyses supported the placement of the isolates within Colletotrichum, Corynespora, Diaporthe, Fusarium, Moniliophthora, Neurospora, Roseograndinia, and Xylaria, although species-level resolution was not consistently achieved using the ITS and LSU regions. Therefore, the findings should be interpreted as evidence of fungal association with symptomatic soybean tissues rather than confirmation of etiological involvement.

4.1. Colletotrichum

The consistent placement of isolates 130-2-0123A and 130-2-0123C with the ex-epitype lineage of Colletotrichum truncatum CBS 151.35 indicates close phylogenetic affinity with this species. The same grouping was independently supported by the ITS and LSU analyses and received maximum SH-aLRT/UFBoot support in the combined ITS–LSU analysis. Colletotrichum truncatum has historically been regarded as the main causal agent of soybean anthracnose in Brazil and Argentina [26], although other species and phylogenetic lineages of Colletotrichum have also been associated with this disease [27]. However, the phylogenetic affinity observed in the present study does not demonstrate that these isolates caused anthracnose or contributed to the symptoms of the soybean anomaly.
Although ITS and LSU supported the same general phylogenetic placement, these two ribosomal markers alone do not provide the discriminatory power usually required for species delimitation within the Colletotrichum complexes. Recent taxonomic assessments of the genus have emphasized the use of multilocus and phylogenomic evidence, with additional loci selected according to the species complex under investigation [28,29]. Therefore, isolates 130-2-0123A and 130-2-0123C will be conservatively retained as Colletotrichum sp. with phylogenetic affinity to C. truncatum until additional loci are analyzed.
The phylogenetic placement of isolates 130-1-0123, 135-0123, and 136-0123 showed lower resolution. In the ITS analysis (Figure S1) and in the combined ITS–LSU analysis (Figure 3), these isolates were placed in a broader lineage containing C. cliviicola CBS 125375 and C. brevisporum MFLU LC0600, whereas the LSU analysis (Figure S2) supported the three isolates as a distinct lineage. Because no single reference species was consistently indicated across the three datasets, these relationships represent a broader phylogenetic affinity rather than species-level identity. Current taxonomic approaches for Colletotrichum generally integrate ITS with protein-coding loci such as gapdh, chs-1, his3, act, and tub2, with marker selection adjusted to the species complex under investigation [29]. Therefore, isolates 130-1-0123, 135-0123, and 136-0123 were retained as Colletotrichum sp. until additional informative loci are analyzed.

4.2. Corynespora

The phylogenetic analyses supported the placement of isolates 11-0223 and 127-2-0123 in Corynespora, but did not provide consistent species-level resolution. In the ITS analysis (Figure S3), both isolates were placed in a lineage containing three reference strains of C. cassiicola. In contrast, the LSU analysis (Figure S4) and the combined ITS–LSU analysis (Figure 4) grouped the isolates in a lineage containing C. smithii L120. This incongruence indicates a locus-dependent phylogenetic placement rather than consistent evidence for assignment to either species.
Species delimitation in Corynespora remains limited by the reduced availability of molecular data for several accepted species. Recent taxonomic studies have combined morphological characterization with multilocus phylogenetic analyses based on its, lsu, ssu, and tef1-α to improve species resolution in the genus [30]. Thus, the ITS and LSU data generated in the present study support the identification of isolates 11-0223 and 127-2-0123 as Corynespora sp., but are insufficient to distinguish them among C. cassiicola, C. smithii, or another related lineage. Additional sequence data and detailed morphological examination will be required for a defensible species-level identification.

4.3. Diaporthe

The phylogenetic analyses supported the placement of isolates 127-1-0123 and 137-0123 in Diaporthe, but did not provide consistent species-level resolution. Isolate 137-0123 was associated with D. ueckerae LMQZ01 in the ITS analysis (Figure S5) and in the combined ITS–LSU analysis (Figure 5), whereas the LSU analysis placed it in an unresolved lineage containing D. ueckerae and D. rosae (Figure S6). Isolate 127-1-0123 was placed in a broader lineage containing D. ueckerae, D. passifloricola, D. sojae, and D. phaseolorum, without consistent support for its assignment to a single species. Therefore, both isolates were retained as Diaporthe sp.
Species delimitation in Diaporthe generally requires morphological characterization combined with multilocus analyses incorporating ITS and protein-coding loci such as tef1-α, tub2, cal, and his3 [31]. Thus, the ITS and LSU data generated in the present study support genus-level identification but are insufficient for a definitive species-level assignment.
Regarding its etiological relevance, the work of Nascimento et al. [32] attributed soybean pod and grain rot to D. ueckerae and Diaporthe longicolla (Hobbs) J.M. Santos, Vrandečić & A.J.L. Phillips based on the symptoms reproduced under the experimental conditions adopted. However, these symptoms did not correspond to the symptom complex associated with the soybean anomaly described by Santos et al. [6], nor to the phenotype documented in the present study (Figure 1). The study by Reis et al. [33] reproduced the characteristic symptoms and signs of stem and pod blight after inoculation with D. longicolla and, because this phenotype differed from that observed in fields affected by the soybean anomaly, inferred that the anomaly might have an abiotic origin or be caused by another fungus. In the present study, Diaporthe accounted for only two of the 36 isolates. Although isolation frequency alone does not establish causality, the limited recovery of this genus and the absence of pathogenicity evidence do not support a causal involvement of isolates 127-1-0123 and 137-0123 in the soybean anomaly.

4.4. Fusarium

The ITS, LSU, and combined ITS–LSU analyses consistently placed the five isolates in the sampled lineage of the Fusarium incarnatum-equiseti species complex (FIESC) (Figure 6, Figures S7 and S8). However, their internal relationships and their positions relative to the reference strains varied among the datasets and were generally not strongly supported. Isolates 150-0123 and 150-1023 were grouped in the ITS and combined analyses, but this relationship was not supported by LSU. Likewise, the placements of isolates 139-0123, 149-0123, and 149-1023 were not consistent across the three phylogenies. Therefore, the analyses support affinity with the F. incarnatum-equiseti species complex, but not identification as a single species.
Retaining the isolates at the genus level is consistent with current molecular criteria for Fusarium identification. Although ITS and LSU can support placement within species complexes, species-level identification generally requires more informative protein-coding loci, especially tef1 and rpb2, with rpb1 providing additional resolution when necessary [34,35]. Therefore, the five isolates were retained as Fusarium sp., with phylogenetic affinity to the FIESC, until additional molecular and morphological evidence is available.
Members of the FIESC have already been recovered from soybean and may show toxigenic potential, indicating that their occurrence in plant tissues warrants attention [36]. In the present study, the five isolates were obtained from one pod, three stem samples, and one seed. However, because pathogenicity and mycotoxin production were not assessed, their detection supports only an association with soybean tissues showing anomaly symptoms, without establishing their contribution to symptom development.

4.5. Moniliophthora

The 19 isolates assigned to Moniliophthora formed a strongly supported monophyletic lineage in the ITS, LSU, and combined ITS–LSU analyses (Figure 7, Figures S9 and S10), with no identified reference lineage or sequence derived from type material included in this grouping. Their placement relative to M. pakistanica LAH 36969 and to the unidentified strains Moniliophthora sp. MCA 2500 and MCA 2501 varied among the datasets; therefore, the isolates were retained as Moniliophthora sp.
Isolates C-02-1023, C-04-1023, C-05-1023, C-08-1223, C-34-0424, and C-36-0424 were obtained directly from macroscopic fruiting structures consistent with basidiomata present on symptomatic soybean stems, including green stems and senescent or necrotic stems. Figure 1E,F shows examples from senescent or necrotic tissues. The remaining isolates were obtained as mycelial cultures from stems, pods, and seeds.
The occurrence of fruiting structures on green stems indicates that their development was not restricted to fully senescent crop residues. In Moniliophthora perniciosa (Stahel) Aime & Phillips-Mora, living tissues are initially colonized during a biotrophic phase, followed by necrotrophic growth and basidiomata formation on previously colonized dead tissues [37,38]. This biological model cannot be directly extrapolated to the unidentified soybean lineage, but it provides a basis for investigating whether fruiting on green stems originated from locally necrotic tissues or involved a similar trophic transition. Histological analyses and sequential inoculation studies are required to determine the colonization pattern and reproductive development of these isolates in soybean.
Silva [10] reported a probable new species of Moniliophthora associated with soybean and demonstrated that pathogenic isolates caused internal stem necrosis, wilting, and plant death. However, those assays evaluated a stem disease and did not reproduce the full set of soybean anomaly symptoms investigated in the present study. Thus, the frequent recovery of this lineage from different soybean organs and from both fruiting structures and mycelial cultures indicates Moniliophthora as a priority taxon for targeted pathogenicity studies.

4.6. Neurospora

The ITS, LSU, and combined ITS–LSU analyses supported the placement of isolate 15-1023 in Neurospora, but did not resolve its species-level identity (Figure 8, Figures S11 and S12). The isolate was placed in a lineage containing Neurospora crassa Shear & B.O. Dodge, Neurospora intermedia F.L. Tai, Neurospora sitophila Shear & B.O. Dodge, and Neurospora tetrasperma Shear & B.O. Dodge. Its closest topological association varied between N. crassa CBS 367.70 and ICMP 6360 across the datasets, and none of these relationships received branch support. Therefore, the similarity to N. crassa was insufficient for species-level identification, and isolate 15-1023 was retained as Neurospora sp.
Although Neurospora is generally associated with saprotrophic growth on plant-derived substrates, recent evidence has shown that N. crassa can also colonize living plant tissues as an endophyte, indicating that its ecological behavior may vary according to the host and environmental conditions [39,40]. However, these observations cannot be directly extrapolated to the unidentified lineage recovered in this study. Because only one isolate was obtained from a symptomatic pod and no pathogenicity assays were performed, its occurrence may represent secondary colonization or another ecological association rather than causal involvement.

4.7. Roseograndinia

The ITS, LSU, and combined ITS–LSU analyses supported the placement of isolate 140-0123 in Roseograndinia (Figure 9, Figures S13 and S14). In the LSU analysis, the isolate was placed close to the type-derived lineage of R. minispora WEI 18-508, in agreement with the high LSU sequence similarity observed between them. However, its relationships with the sampled Roseograndinia species were not consistently resolved across the three datasets. Therefore, isolate 140-0123 was retained as Roseograndinia sp., because the available ribosomal markers supported genus-level identification but were insufficient for its assignment to a species.
Species of Roseograndinia are known mainly as wood-inhabiting corticioid basidiomycetes, found on branches and other lignified substrates [41,42]. Isolate 140-0123 was obtained from a symptomatic soybean stem, which is consistent with the colonization of lignified plant tissue. However, because only one isolate was obtained and no pathogenicity assays were performed, its presence may represent saprotrophic or opportunistic colonization of damaged tissue rather than causal involvement in the soybean anomaly. Additional sampling and inoculation studies are required to determine its ecological role in the crop.

4.8. Xylaria

The ITS and combined ITS–LSU analyses placed isolate 08-0223 in a strongly supported lineage containing the five sampled reference strains identified as X. feejeensis (Figure 10 and Figure S15). In the LSU analysis, the isolate was included in a broader supported lineage comprising X. feejeensis and X. acuta (Figure S16). However, its immediate relationships within these lineages were not strongly supported, and no sequence derived from type material of X. feejeensis was represented in the datasets. Therefore, isolate 08-0223 was retained as Xylaria sp., with phylogenetic affinity to X. feejeensis.
The occurrence of Xylaria in soybean has already been documented in Brazil. De Souza Leite et al. [43] obtained representatives of the genus as endophytes of apparently healthy soybean leaves, showing that its presence in the crop tissues does not necessarily indicate pathogenicity. In contrast, Xylaria necrophora Garcia-Aroca, P.P. Price, T. Allen, M. Tomaso-Peterson & V.P. Doyle is a confirmed root pathogen of soybean in the southern United States and causes taproot decline, characterized by root deterioration and the subsequent development of interveinal chlorosis and foliar necrosis [44]. Secondary metabolites produced by this species in association with soybean roots also contribute to systemic foliar symptoms [45].
Isolate 08-0223 was obtained from a symptomatic soybean leaf, whereas X. necrophora is mainly associated with roots and basal stem tissues. In addition, X. necrophora was not represented in the phylogenetic datasets of the present study; consequently, its relationship with isolate 08-0223 could not be directly assessed. The present results support the association of Xylaria with symptomatic soybean tissue, but do not establish that the isolate represents X. necrophora, causes the soybean anomaly, or constitutes the first report of taproot decline in Brazil. A targeted assessment, including confirmed isolates of X. necrophora and the ITS, act, tub2, and rpb2 loci, together with morphological characterization and pathogenicity assays, would be required to evaluate this hypothesis [44].
This study demonstrated the association of 36 fungal isolates belonging to eight genera with soybean tissues showing anomaly symptoms in Brazil. The combined ITS–LSU analyses supported their placement in Colletotrichum, Corynespora, Diaporthe, Fusarium, Moniliophthora, Neurospora, Roseograndinia, and Xylaria, although species-level resolution was not consistently achieved. The results expand the available information on the fungal diversity associated with symptomatic soybean tissues, especially for genera still poorly investigated in this crop.
Among the taxa obtained, Moniliophthora warrants targeted investigation because it was represented by 19 isolates, occurred in different plant organs, and included cultures obtained directly from fruiting structures present on symptomatic stems. However, none of the genera identified in the present study can be assigned a causal role in the soybean anomaly without experimental evidence. Future studies should integrate additional molecular markers, morphological analyses, controlled inoculation and re-isolation, histological assessment, and broader field sampling to clarify the ecological and etiological roles of these fungi.

5. Conclusions

This study identified diverse fungal taxa associated with soybean tissues showing anomaly symptoms in Brazilian production fields, including Colletotrichum, Corynespora, Diaporthe, Fusarium, Moniliophthora, Neurospora, Roseograndinia, and Xylaria. Molecular and phylogenetic analyses based on ITS and LSU markers supported the placement of isolates in major fungal clades and revealed poorly documented fungal associations with symptomatic soybean tissues. These findings expand the current knowledge of fungal diversity associated with soybean anomaly and provide a molecular basis for future pathogenicity, ecological, and epidemiological studies.

Supplementary Materials

The following supporting information can be downloaded at: https://www.mdpi.com/article/10.3390/microbiolres17080159/s1, Figure S1: Maximum-likelihood phylogram inferred from the ITS dataset of Colletotrichum; Figure S2: Maximum-likelihood phylogram inferred from the LSU dataset of Colletotrichum; Figure S3: Maximum-likelihood phylogram inferred from the ITS dataset of Corynespora; Figure S4: Maximum-likelihood phylogram inferred from the LSU dataset of Corynespora; Figure S5: Maximum-likelihood phylogram inferred from the ITS dataset of Diaporthe; Figure S6: Maximum-likelihood phylogram inferred from the LSU dataset of Diaporthe; Figure S7: Maximum-likelihood phylogram inferred from the ITS dataset of Fusarium; Figure S8: Maximum-likelihood phylogram inferred from the LSU dataset of Fusarium; Figure S9: Maximum-likelihood phylogram inferred from the ITS dataset of Moniliophthora and related taxa; Figure S10: Maximum-likelihood phylogram inferred from the LSU dataset of Moniliophthora and related taxa; Figure S11: Maximum-likelihood phylogram inferred from the ITS dataset of Neurospora; Figure S12: Maximum-likelihood phylogram inferred from the LSU dataset of Neurospora; Figure S13: Maximum-likelihood phylogram inferred from the ITS dataset of Roseograndinia and related taxa; Figure S14: Maximum-likelihood phylogram inferred from the LSU dataset of Roseograndinia and related taxa; Figure S15: Maximum-likelihood phylogram inferred from the ITS dataset of Xylaria; Figure S16: Maximum-likelihood phylogram inferred from the LSU dataset of Xylaria; Table S1: Fungal isolates and reference sequences included in the ITS, LSU, and combined ITS–LSU phylogenetic analyses of Colletotrichum, with corresponding strain/voucher information and GenBank accession numbers; Table S2: Fungal isolates and reference sequences included in the ITS, LSU, and combined ITS–LSU phylogenetic analyses of Diaporthe, with corresponding strain/voucher information and GenBank accession numbers; Table S3: Fungal isolates and reference sequences included in the ITS, LSU, and combined ITS–LSU phylogenetic analyses of Corynespora, with corresponding strain/voucher information and GenBank accession numbers; Table S4: Fungal isolates and reference sequences included in the ITS, LSU, and combined ITS–LSU phylogenetic analyses of Fusarium, with corresponding strain/voucher information and GenBank accession numbers; Table S5: Fungal isolates and reference sequences included in the ITS, LSU, and combined ITS–LSU phylogenetic analyses of Moniliophthora, with corresponding strain/voucher information and GenBank accession numbers; Table S6: Fungal isolates and reference sequences included in the ITS, LSU, and combined ITS–LSU phylogenetic analyses of Neurospora, with corresponding strain/voucher information and GenBank accession numbers; Table S7: Fungal isolates and reference sequences included in the ITS, LSU, and combined ITS–LSU phylogenetic analyses of Roseograndinia, with corresponding strain/voucher information and GenBank accession numbers; Table S8: Fungal isolates and reference sequences included in the ITS, LSU, and combined ITS–LSU phylogenetic analyses of Xylaria, with corresponding strain/voucher information and GenBank accession numbers; Table S9: BLASTn similarity results for ITS and LSU sequences of fungal isolates obtained from soybean tissues showing soybean anomaly symptoms in Brazil.

Author Contributions

Conceptualization, L.G.R., S.M.B. and T.A.S.G.; methodology, L.G.R. and T.A.S.G.; investigation, L.G.R., G.F. and C.G.T.d.S.; formal analysis, L.G.R. and J.G.d.J.; data curation, L.G.R.; visualization, L.G.R.; resources, G.F., C.G.T.d.S., M.R.Z., S.M.B. and T.A.S.G.; writing—original draft preparation, L.G.R.; writing—review and editing, L.G.R., G.F., C.G.T.d.S., J.G.d.J., M.R.Z., S.M.B. and T.A.S.G.; supervision, M.R.Z., S.M.B. and T.A.S.G.; project administration, M.R.Z. and T.A.S.G.; funding acquisition, S.M.B. and T.A.S.G. All authors have read and agreed to the published version of the manuscript.

Funding

This study was financed in part by the Coordination for the Improvement of Higher Education Personnel (CAPES), Brazil [Grant No. 88887.858388/2023-00]. The authors also acknowledge SICOOB for support.

Institutional Review Board Statement

Not applicable.

Informed Consent Statement

Not applicable.

Data Availability Statement

The ITS and LSU sequences generated in this study are available in the GenBank database under the accession numbers listed in Table 1.

Acknowledgments

The authors acknowledge the Universidade Federal de Mato Grosso for institutional support.

Conflicts of Interest

The authors declare no conflicts of interest. The funders had no role in the design of the study; in the collection, analyses, or interpretation of data; in the writing of the manuscript; or in the decision to publish the results.

References

  1. United States Department of Agriculture, Foreign Agricultural Service. Brazil: Oilseeds and Products Update; Report BR2024-0032; USDA: Washington, DC, USA, 2024.
  2. Banco do Nordeste do Brasil. Caderno Setorial ETENE: Soja; Caderno Setorial ETENE: Fortaleza, Brazil, 2024; Volume 9.
  3. Companhia Nacional de Abastecimento. Boletim Da Safra de Grãos 2023/24: 5o Levantamento; Companhia Nacional de Abastecimento: Brasília, Brazil, 2024.
  4. Companhia Nacional de Abastecimento. Comunicado Técnico Sobre Apodrecimento de Vagens Na Safra 2021/2022: Região Do Médio-Norte/MT; Companhia Nacional de Abastecimento: Brasília, Brazil, 2024.
  5. Embrapa Agrossilvipastoril; Embrapa Soja. Comunicado Sobre Apodrecimento de Grãos e Vagens de Soja Na Safra 2021/2022 Na Região Do Médio-Norte de Mato Grosso; Embrapa: Brasília, Brazil, 2022. [Google Scholar]
  6. Santos, C.G.T.D.; Verçosa, A.G.A.; Araújo, D.S.D.; Fachinello, M.C.; Bonaldo, S.M. Anomalia ou Podridão de Vagens e Grãos em Soja? Eis a Questão. Nativa 2024, 12, 339–346. [Google Scholar] [CrossRef] [Scilit]
  7. Instituto Mato-Grossense de Economia Agropecuária. Indicadores de Produtividade Da Soja Em Mato Grosso: Série Histórica; Perdas Por Anomalia de Grãos/Vagens; Safra 2021/2022; Instituto Mato-Grossense de Economia Agropecuária: Cuiabá, Brazil, 2022. [Google Scholar]
  8. Bonaldo, S.M.; Pereira, K.G.S. Tombamento e Apodrecimento de Vagens de Soja; ECR Soja MT 2021/2022; Fundação Pró Sementes: Passo Fundo, Brazil, 2022. [Google Scholar]
  9. Nazario, R.A.C. Anomalia em Grãos de Soja: Efeito Sobre a Massa Específica Aparente; Universidade Federal de Mato Grosso, Instituto de Ciências Agrárias e Ambientais: Sinop, Brazil, 2023. [Google Scholar]
  10. Silva, A.D.A. Taxonomy and Pathogenicity of Fungi Associated with Stem, Pod and Seed Diseases of Soybean; Universidade Federal de Viçosa: Viçosa, MG, Brazil, 2021. [Google Scholar]
  11. Cuervo-Parra, J.A.; Sanchez-Lopez, V.; Ramirez-Suero, M.; Ramirez-Lepe, M. Morphological and Molecular Characterization of Moniliophthora Roreri Causal Agent of Frosty Pod Rot of Cocoa Tree in Tabasco, Mexico. Plant Pathol. J. 2011, 10, 122–127. [Google Scholar] [CrossRef] [Scilit]
  12. Niveiro, N.; Ramírez, N.A.; Michlig, A.; Lodge, D.J.; Aime, M.C. Studies of Neotropical Tree Pathogens in Moniliophthora: A New Species, M. Mayarum, and New Combinations for Crinipellis ticoi and C. brasiliensis. MycoKeys 2020, 66, 39–54. [Google Scholar] [CrossRef] [Scilit] [PubMed]
  13. Schoch, C.L. Nuclear Ribosomal Internal Transcribed Spacer (ITS) Region as a Universal DNA Barcode Marker for Fungi. Proc. Natl. Acad. Sci. USA 2012, 109, 6241–6246. [Google Scholar] [CrossRef] [Scilit] [PubMed]
  14. White, T.J.; Bruns, T.; Lee, S.; Taylor, J. Amplification and Direct Sequencing of Fungal Ribosomal RNA Genes for Phylogenetics. In PCR Protocols; Elsevier: Amsterdam, The Netherlands, 1990; pp. 315–322. [Google Scholar]
  15. Gardes, M.; Bruns, T.D. ITS Primers with Enhanced Specificity for Basidiomycetes—Application to the Identification of Mycorrhizae and Rusts. Mol. Ecol. 1993, 2, 113–118. [Google Scholar] [CrossRef] [Scilit] [PubMed]
  16. Alfenas, A.C.; Ferreira, F.A.; Mafia, R.G.; Gonçalves, R.C. Isolamento de fungos fitopatogênicos. In Métodos em Fitopatologia; Editora UFV: Viçosa, MG, Brazil, 2016; pp. 55–92. [Google Scholar]
  17. Vilgalys, R.; Hester, M. Rapid Genetic Identification and Mapping of Enzymatically Amplified Ribosomal DNA from Several Cryptococcus Species. J. Bacteriol. 1990, 172, 4238–4246. [Google Scholar] [CrossRef] [Scilit] [PubMed]
  18. Hall, T.A. BioEdit: A User-Friendly Biological Sequence Alignment Editor and Analysis Program for Windows 95/98/NT. Nucleic Acids Symp. Ser. 1999, 41, 95–98. [Google Scholar]
  19. Katoh, K.; Rozewicki, J.; Yamada, K.D. MAFFT Online Service: Multiple Sequence Alignment, Interactive Sequence Choice and Visualization. Brief. Bioinform. 2019, 20, 1160–1166. [Google Scholar] [CrossRef] [Scilit] [PubMed]
  20. Benson, D.A.; Cavanaugh, M.; Clark, K.; Karsch-Mizrachi, I.; Lipman, D.J.; Ostell, J.; Sayers, E.W. GenBank. Nucleic Acids Res. 2013, 41, D36–D42. [Google Scholar] [CrossRef] [Scilit] [PubMed]
  21. Altschul, S.F.; Gish, W.; Miller, W.; Myers, E.W.; Lipman, D.J. Basic Local Alignment Search Tool. J. Mol. Biol. 1990, 215, 403–410. [Google Scholar] [CrossRef] [PubMed]
  22. Trifinopoulos, J.; Nguyen, L.-T.; von Haeseler, A.; Minh, B.Q. W-IQ-TREE: A Fast Online Phylogenetic Tool for Maximum Likelihood Analysis. Nucleic Acids Res. 2016, 44, W232–W235. [Google Scholar] [CrossRef] [Scilit] [PubMed]
  23. Kalyaanamoorthy, S.; Minh, B.Q.; Wong, T.K.F.; von Haeseler, A.; Jermiin, L.S. ModelFinder: Fast Model Selection for Accurate Phylogenetic Estimates. Nat. Methods 2017, 14, 587–589. [Google Scholar] [CrossRef] [Scilit] [PubMed]
  24. Guindon, S.; Dufayard, J.-F.; Lefort, V.; Anisimova, M.; Hordijk, W.; Gascuel, O. New Algorithms and Methods to Estimate Maximum-Likelihood Phylogenies: Assessing the Performance of PhyML 3.0. Syst. Biol. 2010, 59, 307–321. [Google Scholar] [CrossRef] [Scilit] [PubMed]
  25. Hoang, D.T.; Chernomor, O.; von Haeseler, A.; Minh, B.Q.; Vinh, L.S. UFBoot2: Improving the Ultrafast Bootstrap Approximation. Mol. Biol. Evol. 2018, 35, 518–522. [Google Scholar] [CrossRef] [Scilit] [PubMed]
  26. Dias, M.D.; Dias-Neto, J.J.; Santos, M.D.M.; Formento, A.N.; Bizerra, L.V.A.S.; Fonseca, M.E.N.; Boiteux, L.S.; Café-Filho, A.C. Current Status of Soybean Anthracnose Associated with Colletotrichum Truncatum in Brazil and Argentina. Plants 2019, 8, 459. [Google Scholar] [CrossRef] [Scilit] [PubMed]
  27. Boufleur, T.R.; Ciampi-Guillardi, M.; Tikami, Í.; Rogério, F.; Thon, M.R.; Sukno, S.A.; Massola Júnior, N.S.; Baroncelli, R. Soybean Anthracnose Caused by Colletotrichum Species: Current Status and Future Prospects. Mol. Plant Pathol. 2021, 22, 393–409. [Google Scholar] [CrossRef] [Scilit] [PubMed]
  28. Bhunjun, C.S.; Phukhamsakda, C.; Jayawardena, R.S.; Jeewon, R.; Promputtha, I.; Hyde, K.D. Investigating Species Boundaries in Colletotrichum. Fungal Divers. 2021, 107, 107–127. [Google Scholar] [CrossRef] [Scilit]
  29. Liu, F.; Ma, Z.Y.; Hou, L.W.; Diao, Y.Z.; Wu, W.P.; Damm, U.; Song, S.; Cai, L. Updating Species Diversity of Colletotrichum, with a Phylogenomic Overview. Stud. Mycol. 2022, 101, 1–56. [Google Scholar] [CrossRef] [Scilit] [PubMed]
  30. Liu, J.; Hu, Y.; Luo, X.; Castañeda-Ruíz, R.F.; Xia, J.; Xu, Z.; Cui, R.; Shi, X.; Zhang, L.; Ma, J. Molecular Phylogeny and Morphology Reveal Four Novel Species of Corynespora and Kirschsteiniothelia (Dothideomycetes, Ascomycota) from China: A Checklist for Corynespora Reported Worldwide. J. Fungi 2023, 9, 107. [Google Scholar] [CrossRef] [Scilit] [PubMed]
  31. Dissanayake, A.J.; Zhu, J.-T.; Chen, Y.-Y.; Maharachchikumbura, S.S.N.; Hyde, K.D.; Liu, J.-K. A Re-Evaluation of Diaporthe: Refining the Boundaries of Species and Species Complexes. Fungal Divers. 2024, 126, 1–125. [Google Scholar] [CrossRef] [Scilit]
  32. Nascimento, C.R.B.; Anjos, R.S.; Rosa, R.B.; Silva, H.A.O.; Leite, I.C.H.L.; Sousa, D.Y.X.; Lehner, M.S.; Diniz, J.M.; Mizubuti, E.S.G. First Report of Diaporthe ueckeri and D. longicolla as the Causal Agents of Pod and Grain Rot of Soybean in Brazil. Plant Dis. 2025, 109, 506. [Google Scholar] [CrossRef] [Scilit]
  33. Reis, E.M.; Guerra, W.D.; Reis, A.C. Diaporthe longicolla, agente causal da queima da haste e da vagem, pode causar também a anomalia podridão de vagens e de grãos da soja? Summa Phytopathol. 2026, 52, e297872. [Google Scholar] [CrossRef] [Scilit]
  34. O’Donnell, K.; Whitaker, B.K.; Laraba, I.; Proctor, R.H.; Brown, D.W.; Broders, K.; Kim, H.-S.; McCormick, S.P.; Busman, M.; Aoki, T.; et al. DNA Sequence-Based Identification of Fusarium: A Work in Progress. Plant Dis. 2022, 106, 1597–1609. [Google Scholar] [CrossRef] [Scilit] [PubMed]
  35. Torres-Cruz, T.J.; Whitaker, B.K.; Proctor, R.H.; Broders, K.; Laraba, I.; Kim, H.-S.; Brown, D.W.; O’Donnell, K.; Estrada-Rodríguez, T.L.; Lee, Y.-H.; et al. FUSARIUM-ID v.3.0: An Updated, Downloadable Resource for Fusarium Species Identification. Plant Dis. 2022, 106, 1610–1616. [Google Scholar] [CrossRef] [Scilit] [PubMed]
  36. Lu, Y.; Qiu, J.; Wang, S.; Xu, J.; Ma, G.; Shi, J.; Bao, Z. Species Diversity and Toxigenic Potential of Fusarium Incarnatum-Equiseti Species Complex Isolates from Rice and Soybean in China. Plant Dis. 2021, 105, 2628–2636. [Google Scholar] [CrossRef] [Scilit] [PubMed]
  37. Thomazella, D.P.T.; Teixeira, P.J.P.L.; Oliveira, H.C.; Saviani, E.E.; Rincones, J.; Toni, I.M.; Reis, O.; Garcia, O.; Meinhardt, L.W.; Salgado, I.; et al. The Hemibiotrophic Cacao Pathogen Moniliophthora perniciosa Depends on a Mitochondrial Alternative Oxidase for Biotrophic Development. New Phytol. 2012, 194, 1025–1034. [Google Scholar] [CrossRef] [Scilit] [PubMed]
  38. Santos, A.S.; Mora-Ocampo, I.Y.; De Novais, D.P.S.; Aguiar, E.R.G.R.; Pirovani, C.P. State of the Art of the Molecular Biology of the Interaction between Cocoa and Witches’ Broom Disease: A Systematic Review. Int. J. Mol. Sci. 2023, 24, 5684. [Google Scholar] [CrossRef] [Scilit] [PubMed]
  39. Kollath-Leiß, K.; Repnik, U.; Winter, H.; Winkelmann, H.; Freund, A.S.; Kempken, F. The First Observation of the Filamentous Fungus Neurospora Crassa Growing in the Roots of the Grass Brachypodium Distachyon. J. Fungi 2024, 10, 487. [Google Scholar] [CrossRef] [Scilit] [PubMed]
  40. Simpson, H.J.; Schilling, J.S. Saprotrophic Capabilities of Neurospora Crassa on Charred Plant Biomass. Environ. Microbiol. 2025, 27, e70132. [Google Scholar] [CrossRef] [Scilit] [PubMed]
  41. Chen, C.-C.; Chen, C.-Y.; Wu, S.-H. Species Diversity, Taxonomy and Multi-Gene Phylogeny of Phlebioid Clade (Phanerochaetaceae, Irpicaceae, Meruliaceae) of Polyporales. Fungal Divers. 2021, 111, 337–442. [Google Scholar] [CrossRef] [Scilit]
  42. Li, Y.; Chen, C.-C.; He, S.-H. New Corticioid Taxa in Phanerochaetaceae (Polyporales, Basidiomycota) from East Asia. Front. Microbiol. 2023, 14, 1093096. [Google Scholar] [CrossRef] [Scilit] [PubMed]
  43. De Souza Leite, T.; Cnossen-Fassoni, A.; Pereira, O.L.; Mizubuti, E.S.G.; De Araújo, E.F.; De Queiroz, M.V. Novel and Highly Diverse Fungal Endophytes in Soybean Revealed by the Consortium of Two Different Techniques. J. Microbiol. 2013, 51, 56–69. [Google Scholar] [CrossRef] [Scilit] [PubMed]
  44. Garcia-Aroca, T.; Price, P.P.; Tomaso-Peterson, M.; Allen, T.W.; Wilkerson, T.H.; Spurlock, T.N.; Faske, T.R.; Bluhm, B.; Conner, K.; Sikora, E.; et al. Xylaria Necrophora, Sp. Nov., Is an Emerging Root-Associated Pathogen Responsible for Taproot Decline of Soybean in the Southern United States. Mycologia 2021, 113, 326–347. [Google Scholar] [CrossRef] [Scilit] [PubMed]
  45. Garcia-Aroca, T.; Price, P.T.; Solórzano, J.E.; Galo, D.; Sheffield, S.B.; Doyle, V.P. Secondary Metabolites Produced by Xylaria Necrophora Are Responsible for Foliar Symptoms Associated with Taproot Decline of Soybean. Plant Health Prog. 2022, 23, 388–398. [Google Scholar] [CrossRef] [Scilit]
Figure 1. Symptoms associated with soybean anomaly. (A) Pod at the R5.1 reproductive stage (beginning of seed filling) showing external water-soaked areas and brown to olive-brown discoloration of the pericarp, consistent with early pod deterioration. (B) Longitudinal section of the same pod showing that the water-soaked region corresponds to internal deterioration of immature seeds, characterized by darkening, tissue disorganization, and collapse, consistent with seed rot within the pod. (C) Pod at the R5.1 stage, positioned vertically with the distal apex facing downward, showing a water-soaked area at the distal end associated with early signs of precocious in situ germination of an immature seed still undergoing filling. (D) Opened pod showing that the water-soaked region corresponds to the site of germination of the immature seed, with seed coat degradation/darkening and protrusion of the embryonic axis, characterizing in situ germination associated with localized tissue deterioration. (E) Stem fragment from soybean crop residues derived from symptomatic plants, showing fungal colonization and the presence of fruiting structures on senescent/necrotic tissue. (F) A second distinct stem fragment from crop residues, also showing fungal colonization and fruiting structures on degraded tissue.
Microbiolres 17 00159 g001
Figure 2. Geographic origin of fungal isolates obtained from soybean plants with stem breakage and pod rot symptoms in the Brazilian states of Rondônia and Mato Grosso. Colored polygons indicate the municipalities where isolates were collected (Cerejeiras and Corumbiara, Rondônia; Lucas do Rio Verde, Nova Guarita, Sinop and Sorriso, Mato Grosso).
Microbiolres 17 00159 g002
Figure 3. Maximum-likelihood phylogram inferred from the combined ITS-LSU dataset of Colletotrichum. The analysis included 31 terminal taxa and 1432 aligned positions and was performed in IQ-TREE using the HKY+F+R3 substitution model selected by ModelFinder according to the Bayesian information criterion. Branch-support values are presented as SH-aLRT/UFBoot percentages based on 1000 SH-aLRT replicates and 10,000 ultrafast bootstrap replicates, respectively. Only nodes with SH-aLRT ≥ 80% and UFBoot ≥ 95% are labeled. Isolates obtained in the present study are shown in bold. T, type or type-derived strain; ET, ex-epitype strain. The tree was rooted with Monilochaetes infuscans Ellis & Halst. ex Harter CBS 869.96 and Monilochaetes pteridophytophila J.Y. Zhang, K.D. Hyde & Y.Z. Lu MFLUCC 21-0022. The scale bar indicates the expected number of nucleotide substitutions per site.
Microbiolres 17 00159 g003
Figure 4. Maximum-likelihood phylogram inferred from the combined ITS-LSU dataset of Corynespora. The analysis included 21 terminal taxa and 1490 aligned positions and was performed in IQ-TREE using the SYM+R2 substitution model selected by ModelFinder according to the Bayesian information criterion. Branch-support values are presented as SH-aLRT/UFBoot percentages based on 1000 SH-aLRT replicates and 10,000 ultrafast bootstrap replicates, respectively. Only nodes with SH-aLRT ≥ 80% and UFBoot ≥ 95% are labeled. Isolates obtained in the present study are shown in bold. T, type or type-derived strain; The tree was rooted with Periconia digitata (Cooke) Sacc. CBS 510.77 and Periconia pseudodigitata Kaz. Tanaka & K. Hiray. HHUF 29370. The scale bar indicates the expected number of nucleotide substitutions per site.
Microbiolres 17 00159 g004
Figure 5. Maximum-likelihood phylogram inferred from the combined ITS-LSU dataset of Diaporthe. The analysis included 26 terminal taxa and 1427 aligned positions and was performed in IQ-TREE using the K2P+I+G4 substitution model selected by ModelFinder according to the Bayesian information criterion. Branch-support values are presented as SH-aLRT/UFBoot percentages based on 1000 SH-aLRT replicates and 10,000 ultrafast bootstrap replicates, respectively. Only nodes with SH-aLRT ≥ 80% and UFBoot ≥ 95% are labeled. Isolates obtained in the present study are shown in bold. T, type or type-derived strain; ET, ex-epitype strain; NT, ex-neotype strain. The tree was rooted with Diaporthella cryptica Linald., Deidda & Scanu CBS 140348. The scale bar indicates the expected number of nucleotide substitutions per site.
Microbiolres 17 00159 g005
Figure 6. Maximum-likelihood phylogram inferred from the combined, unpartitioned ITS-LSU dataset of Fusarium. The analysis included 28 terminal taxa and 1335 aligned positions and was performed in IQ-TREE using the K2P+I substitution model selected by ModelFinder according to the Bayesian information criterion. Branch-support values are presented as SH-aLRT/UFBoot percentages based on 1000 SH-aLRT replicates and 10,000 ultrafast bootstrap replicates, respectively. Only nodes with SH-aLRT ≥ 80% and UFBoot ≥ 95% are labeled. Isolates obtained in the present study are shown in bold. T, type or type-derived strain; NT, ex-neotype strain. The tree was rooted with Fusarium concolor Reinking CBS 183.34 and Fusarium circinatum Nirenberg & O’Donnell CBS 405.97. The scale bar indicates the expected number of nucleotide substitutions per site.
Microbiolres 17 00159 g006
Figure 7. Maximum-likelihood phylogram inferred from the combined, unpartitioned ITS-LSU dataset of Moniliophthora and related taxa. The analysis included 49 terminal taxa and 1630 aligned positions and was performed in IQ-TREE using the GTR+F+R3 substitution model selected by ModelFinder according to the Bayesian information criterion. Branch-support values are presented as SH-aLRT/UFBoot percentages based on 1000 SH-aLRT replicates and 10,000 ultrafast bootstrap replicates, respectively. Only nodes with SH-aLRT ≥ 80% and UFBoot ≥ 95% are labeled. Isolates obtained in the present study are shown in bold. T, type or type-derived strain. The tree was rooted with Brunneocorticium corynecarpon (Kunze) R.A. Koch, Lodge, Nakasone & Aime MCA 5784 and Tetrapyrgos nigripes (Fr.) E. Horak MCA 6925. The scale bar indicates the expected number of nucleotide substitutions per site.
Microbiolres 17 00159 g007
Figure 8. Maximum-likelihood phylogram inferred from the combined, unpartitioned ITS-LSU dataset of Neurospora. The analysis included 26 terminal taxa and 1411 aligned positions and was performed in IQ-TREE using the K2P+R2 substitution model selected by ModelFinder according to the Bayesian information criterion. Branch-support values are presented as SH-aLRT/UFBoot percentages based on 1000 SH-aLRT replicates and 10,000 ultrafast bootstrap replicates, respectively. Only nodes with SH-aLRT ≥ 80% and UFBoot ≥ 95% are labeled. The isolate obtained in the present study is shown in bold. T, type or type-derived strain. The tree was rooted with Sordaria fimicola (Roberge ex Desm.) Ces. & De Not. CBS 508.50 and Sordaria equicola Crous CBS 146992. The scale bar indicates the expected number of nucleotide substitutions per site.
Microbiolres 17 00159 g008
Figure 9. Maximum-likelihood phylogram inferred from the combined, unpartitioned ITS-LSU dataset of Roseograndinia and related taxa. The analysis included 22 terminal taxa and 1591 aligned positions and was performed in IQ-TREE using the K2P+R2 substitution model selected by ModelFinder according to the Bayesian information criterion. Branch-support values are presented as SH-aLRT/UFBoot percentages based on 1000 SH-aLRT replicates and 10,000 ultrafast bootstrap replicates, respectively. Only nodes with SH-aLRT ≥ 80% and UFBoot ≥ 95% are labeled. The isolate obtained in the present study is shown in bold. T, type material or type-derived sequence. The tree was rooted with Rhizochaete radicata (Henn.) Gresl., Nakasone & Rajchenb. FD-123 and Rhizochaete filamentosa (Berk. & M.A. Curtis) Gresl., Nakasone & Rajchenb. HHB-3169. The scale bar indicates the expected number of nucleotide substitutions per site.
Microbiolres 17 00159 g009
Figure 10. Maximum-likelihood phylogram inferred from the combined, unpartitioned ITS-LSU dataset of Xylaria. The analysis included 16 terminal taxa and 1339 aligned positions and was performed in IQ-TREE using the K2P+R2 substitution model selected by ModelFinder according to the Bayesian information criterion. Branch-support values are presented as SH-aLRT/UFBoot percentages based on 1000 SH-aLRT replicates and 10,000 ultrafast bootstrap replicates, respectively. Only nodes with SH-aLRT ≥ 80% and UFBoot ≥ 95% are labeled. The isolate obtained in the present study is shown in bold. T, type or type-derived strain; ET, ex-epitype strain. The tree was rooted with Parahypoxylon papillatum (Ellis & Everh.) M. Cedeño-Sanchez, E. Charria-Girón & M. Stadler ATCC 58729. The scale bar indicates the expected number of nucleotide substitutions per site.
Microbiolres 17 00159 g010
Table 1. Fungal isolates obtained from soybean tissues showing anomaly symptoms, their geographic origin, plant organ, molecular identification, and GenBank accession numbers for the ITS and LSU regions.
IsolatesLocationPlant OrganMolecular IdentificationITS AccessionLSU Accession
130-1-0123Sorriso-MTStemColletotrichum sp.PX649965PV749132
130-2-0123ASorriso-MTPodColletotrichum sp.PX649966PV749133
130-2-0123CSorriso-MTPodColletotrichum sp.PX649967PV749134
135-0123Sinop-MTStemColletotrichum sp.PX649968PV749135
136-0123Sinop-MTPodColletotrichum sp.PX649969PV749136
11-0223Corumbiara-ROPodCorynespora sp.PX649962PV749125
127-2-0123Nova Guarita-MTPodCorynespora sp.PX649964PV749131
127-1-0123Nova Guarita-MTPodDiaporthe sp.PX649963PV749130
137-0123Sinop-MTPodDiaporthe sp.PX649970PV749137
139-0123Sinop-MTPodFusarium sp.PX649971PV749138
149-0123Sinop-MTStemFusarium sp.PX649973PV749143
149-1023Sinop-MTStemFusarium sp.PX649974PV749144
150-0123Sinop-MTSeedFusarium sp.PX649975PV749146
150-1023Sinop-MTStemFusarium sp.PX649976PV749145
C-02-1023Sinop-MTStemMoniliophthora sp.PV688320PV749119
C-04-1023Sinop-MTStemMoniliophthora sp.PV688321PV749120
C-05-1023Sinop-MTStemMoniliophthora sp.PV688322PV749121
C-08-1223Sinop-MTStemMoniliophthora sp.PV688323PV749122
01-0223Corumbiara-ROPodMoniliophthora sp.PV688324PV749123
12-0223Cerejeiras-ROStemMoniliophthora sp.PV688325PV749126
126-1-0123Nova Guarita-MTPodMoniliophthora sp.PV688326PV749127
126-3-0123Nova Guarita-MTSeedMoniliophthora sp.PV688327PV749128
126-4-0123Nova Guarita-MTPodMoniliophthora sp.PV688328PV749129
141-0123Sinop-MTSeedMoniliophthora sp.PV688329PV749140
142-0123Sinop-MTStemMoniliophthora sp.PV688330PV749141
147-0123Sinop-MTStemMoniliophthora sp.PV688331PV749142
18-0223Cerejeiras-ROPodMoniliophthora sp.PV688332PV749148
45-1023Lucas do Rio Verde-MTStemMoniliophthora sp.PV688333PV749149
C-34-0424Cerejeiras-ROStemMoniliophthora sp.PV688334PV749150
C-36-0424Cerejeiras-ROStemMoniliophthora sp.PV688335PV749151
11-0324Sinop-MTSeedMoniliophthora sp.PV688336PV749152
56-0524Sinop-MTSeedMoniliophthora sp.PV688337PV749153
43-0424Lucas do Rio Verde-MTSeedMoniliophthora sp.PV688338PV749154
15-1023Cerejeiras-ROPodNeurospora sp.PX649977PV749147
140-0123Sinop-MTStemRoseograndinia sp.PX649972PV749139
08-0223Cerejeiras-ROLeafXylaria sp.PX649961PV749124
Disclaimer/Publisher’s Note: The statements, opinions and data contained in all publications are solely those of the individual author(s) and contributor(s) and not of MDPI and/or the editor(s). MDPI and/or the editor(s) disclaim responsibility for any injury to people or property resulting from any ideas, methods, instructions or products referred to in the content.