1. Introduction
The transition from combustion-engine powertrains to electrified propulsion has changed both the excitation environment and the perceptual importance of transmission noise. Electric machines generate substantially less broadband masking than combustion engines, while electric-drive gearboxes frequently operate at high rotational speeds and over wide torque ranges. As a result, narrowband gear, motor, and structural components that were previously masked can become dominant contributors to the perceived vehicle sound quality. Gearbox noise, vibration, and harshness (NVH) must therefore be treated as a coupled excitation–transfer–response–radiation problem rather than as a gear-pair problem alone [
1].
Tonal behavior is particularly sensitive to small periodic or spatially coherent deviations. Intentional or unintentional tooth-to-tooth microgeometry variation may redistribute excitation energy and change the concentration of individual mesh-related components [
2]. At the same time, electric-machine torque ripple, electromagnetic force harmonics, rotor eccentricity, and control-dependent excitation can propagate through the same shafts, bearings, and housing structure as gear-generated forces [
3,
4,
5]. Source attribution is consequently difficult when gear, motor, shaft, and structural orders overlap within the same operating range.
Gear transmission error, time-varying mesh stiffness, contact-ratio variation, and load-dependent tooth deformation remain central source quantities in geared-system dynamics [
6,
7]. Modern loaded tooth contact analysis (LTCA) and time-domain gear models can represent nominal macrogeometry, intentional flank modification, misalignment, and selected manufacturing deviations. Multibody dynamic (MBD) models can transfer the resulting excitation through flexible shafts, bearings, splines, couplings, and rotor systems, while finite-element and acoustic methods can predict housing vibration and radiated sound [
8,
9].
Despite this numerical capability, many models continue to describe the designed gearbox rather than the manufactured and assembled gearbox. Nominal computer-aided-design geometry, intended microgeometry, ideal shaft positions, catalogue bearing properties, assumed damping, and one prescribed temperature state are commonly used even when the measured unit differs from these assumptions. The resulting model may be sufficiently accurate for mechanism screening or relative design comparisons, but it cannot automatically support as-built correlations, root-cause identification, or production-scatter prediction.
The gap is especially important because several influential parameters are generated or modified after the nominal gear design has been completed. Profile and lead deviations, pitch error, runout, deterministic flank waviness, gear-to-shaft mounting, bore alignment, shim selection, bearing fits, preload, internal clearance, and housing-wall variation can alter both excitation and its transfer path. Bearings are particularly important because they affect gear alignment, shaft guidance, system modes, and the dynamic forces transmitted to the housing [
10,
11,
12]. Misalignment and manufacturing variation can also generate significant dispersion in the gearbox dynamic response even when the nominal design is unchanged [
13].
The availability of manufacturing and test data does not solve this problem by itself. A measured quantity becomes useful for simulation only when its physical definition, coordinate system, reference state, uncertainty, and numerical representation are specified. A scalar gear-quality value, for example, may not preserve the spatial phase or tooth sequence required to reproduce modulation. A nominal bearing preload may not equal the preload established after fits, shim dimensions, structural compliance, and thermal expansion have been considered. Similarly, a measured housing response does not uniquely identify whether the discrepancy originated from the source model, the bearing-force path, structural damping, or acoustic radiation.
Standardized terminology provides an essential basis for describing gear-flank deviations and damage states [
14,
15], but standards developed primarily for geometry acceptance, load capacity, or damage classification do not by themselves define which data must be transferred into an NVH model. The literature is therefore extensive but fragmented. Gear-design studies emphasize transmission error and microgeometry; manufacturing studies emphasize quality metrics and process signatures, bearing studies emphasize nonlinear support behavior, structural studies emphasize the modal response, acoustic studies emphasize radiation, and data-driven studies emphasize predictive relationships. These bodies of evidence are rarely organized according to one consistent measurement-to-model and validation logic.
Three recurring conceptual problems follow. First, numerical fidelity is often confused with physical readiness: a detailed nonlinear or flexible model may still be nominal when its inputs are assumed and its intermediate quantities are not validated. Second, agreement at the final receiver is often interpreted too broadly: a matched microphone level does not independently validate the transmission error, bearing force, housing dynamics, and radiation because errors at different stages may compensate for one another. Third, population prediction is sometimes inferred from tolerance sampling alone, although assumed independent distributions do not establish production variability unless the magnitudes, correlations, batch effects, and output consequences are supported by multi-unit measurements.
Which measured physical parameters, numerical representations, and validation evidence are required before an EV gearbox NVH model can credibly represent an as-built unit or a production population?
The working proposition is that simulation readiness is determined jointly by the physical origin of the input, its function in the excitation–transfer–response–radiation chain, its numerical representation, the traceability of its data source, and the experimental evidence used to challenge the modeled effect.
The review makes four principal contributions:
A dual classification organizes gearbox parameters by both physical origin and NVH function, preventing the framework from becoming either a conventional component catalogue or an indiscriminate list of available production variables.
Four simulation-readiness levels—nominal, tolerance-based, measurement-based, and variability-aware—are defined together with explicit entry criteria, validation requirements, and limits on supported claims.
Design, manufacturing, assembly, operating, and degradation information is mapped to LTCA, MBD, structural finite-element, vibroacoustic, and hybrid data-driven representations. Parameters are assigned conditional baseline, recommended, or advanced priorities using causal relevance, sensitivity evidence, measurability, identifiability, and application dependence.
A stage-specific validation route is proposed. Contact quantities challenge the excitation model; shaft motion and bearing forces challenge the rotating system; modal and operational responses challenge the structural model; and equivalent radiated power, sound pressure, acoustic intensity, and sound power challenge different aspects of radiation.
The framework is complemented by literature-grounded quantitative evidence. The examples demonstrate that model-form selection can materially affect simulation-to-measurement agreement and that measured manufacturing variables can support the nonlinear prediction of gear-whine responses. The evidence is interpreted conservatively: no single reviewed study establishes complete validation of the full manufacturing–contact–system–structural–acoustic–population chain.
The remainder of the paper first describes the review and framework-development method. It then introduces the dual classification and readiness levels, examines the principal physical parameter domains, defines the physical-to-numerical workflow and validation matrix, evaluates quantitative evidence, and discusses limitations and future research needs.
2. Review Method and Framework Development
2.1. Review Design and Scope
This study was conducted as a structured narrative review combined with a framework-development procedure. Its objective was not to calculate pooled effect sizes or to claim exhaustive systematic coverage of all gearbox-NVH publications. Instead, it aimed to identify physical parameters that can be transferred from design, manufacturing, assembly, inspection, testing, or durability activities into numerical models of the EV gearbox excitation, force transmission, structural response, and acoustic radiation.
The unit of analysis was the parameter–representation–validation relationship rather than the publication alone. A source was considered relevant when it contributed a measurable or specified physical input, a numerical representation, quantitative sensitivity or uncertainty evidence, a measurement-to-simulation relationship, an experimental validation quantity, or a production- or data-driven linkage with physically interpretable variables. The principal numerical domains were LTCA, MBD, structural finite-element analysis, vibroacoustic simulation, and hybrid physical-data-driven modeling.
2.2. Information Sources and Search Structure
The literature search covered Scopus, Web of Science Core Collection, ScienceDirect, SpringerLink, IEEE Xplore, the ASME Digital Collection, SAE Mobilus, and Google Scholar. Relevant ISO standards, technical monographs, and technically detailed conference proceedings were also considered. Google Scholar was used primarily for supplementary searching, citation tracking, and locating foundational publications or standards not consistently indexed in the other databases.
The search was organized into seven mechanism-oriented blocks: (1) gear excitation, transmission error, mesh stiffness, and microgeometry; (2) manufacturing deviations, flank topography, waviness, and ghost orders; (3) assembly alignment, backlash, bearings, preload, and support stiffness; (4) shafts, rotors, splines, couplings, and electromechanical excitation; (5) housing dynamics, joints, transfer paths, and acoustic radiation; (6) operating state, temperature, lubrication, running-in, wear, and degradation; and (7) sensitivity, uncertainty, production variability, model updating, digital twins, and hybrid modeling.
Terms within these blocks were combined with expressions including gearbox, transmission, electric drive, electric vehicle, gear whine, and geared drivetrain. Backward citation tracking was used to locate foundational sources, while forward and targeted searches were used to identify later applications. The searches were last updated during the final revision stage and covered relevant publications available up to December 2025. Earlier sources were retained when they established terminology, physical mechanisms, measurement methods, or validation principles that remain applicable.
2.3. Eligibility and Source Selection
Sources were retained when sufficient technical detail was available to determine the physical parameter, model input, or validation output concerned. Peer-reviewed journal articles were prioritized. Conference papers were retained selectively when they contained unique experimental, numerical, or industrial evidence not available in a more complete journal publication. Standards and books were used primarily for terminology, established theory, and measurement definitions.
Sources were excluded when they addressed general vehicle NVH without transferable information for geared electric drivetrains, described a numerical method without defining relevant physical inputs, provided only qualitative claims without sufficient parameter or validation detail, concerned unrelated applications without a transferable NVH mechanism, or duplicated a later and more complete publication. Preprints were not retained when a peer-reviewed version or a suitable peer-reviewed source was available.
Because the review was not prospectively registered and retrospective database hit counts were not available consistently for every iterative search, no PRISMA-style numerical screening claim is made. Reproducibility is instead provided through the documented information sources, search blocks, eligibility rules, extraction fields, and framework-development audit trail.
2.4. Data Extraction
For each retained parameter or parameter group, the following information was extracted:
physical origin, definition, unit, and data format;
intended or measured source and associated operating or degradation state;
role in the excitation–transfer–response–radiation chain;
applicable numerical domain and numerical representation;
measurable validation output, quantitative evidence, uncertainty, and principal limitations.
The physical measurement and its numerical implementation were recorded separately. Measured runout, for example, was mapped to possible representations such as eccentricity, periodic center-distance variation, or rotational modulation. Bearing preload was linked to the assembly operation that generated it, the resulting equilibrium state, its stiffness representation, and the measurements capable of challenging that state.
Evidence was interpreted according to whether it provided conceptual or definitional support, mechanism-based support, quantitative sensitivity evidence, direct experimental validation, or multi-unit and population-level evidence. This distinction prevented a parameter supported only conceptually from being assigned the same evidential status as one validated quantitatively.
2.5. Framework Construction and Prioritization
Framework development proceeded through five stages. First, parameters were grouped by physical origin: nominal gear geometry, intentional microgeometry, manufacturing deviations, assembly, bearing and support state, shafts and rotors, housing and joints, operating conditions, and degradation. Second, each parameter was mapped to one or more NVH functions: excitation generation, force transmission, structural response, acoustic radiation, operating boundary condition, degradation modifier, or validation quantity. Third, the required numerical representation was identified for LTCA, MBD, finite-element, vibroacoustic, or hybrid modeling. Fourth, four simulation-readiness levels were defined according to input traceability, numerical mapping, validation evidence, and supported claim. Fifth, parameters were assigned a conditional baseline, recommended, or advanced priority.
Prioritization considered causal proximity to the target mechanism, consistency of sensitivity or validation evidence, practical measurability or availability, identifiability from the selected measurements, and dependence on the architecture, operating condition, frequency range, and model objective. The ranking is qualitative and application-dependent. It is intended as an initial data-request and model-planning guide rather than a replacement for system-specific sensitivity analysis.
The complete review and framework-development audit trail is summarized in
Table 1.
3. Conceptual Framework and Simulation-Readiness Levels
A gearbox NVH model should be defined not only by its solver architecture, but also by the physical system and evidential state it represents. The framework is organized around four connected questions: where a parameter originates physically, what function it performs in the NVH chain, how it is represented numerically, and what experimental evidence is required to support the resulting claim. A parameter is not simulation-ready merely because it can be measured or stored in a manufacturing database. It must also be linked to a physically plausible mechanism, transferred into a defined numerical representation, and challenged using an output sensitive to its modeled influence.
3.1. Excitation–Transfer–Response–Radiation Chain
The measured sound of a gearbox results from a coupled chain rather than one isolated excitation source. At the tooth contact, load-dependent deformation, intentional microgeometry, manufacturing deviations, misalignment, and time-varying contact conditions generate geometric, loaded, and dynamic transmission error. Together with time-varying mesh stiffness, these quantities form the principal gear-related excitation mechanisms [
6,
7,
16].
The excitation is transmitted through gears, shafts, splines, couplings, and bearings. These components modify dynamic forces according to their stiffness, damping, clearance, preload, inertia, and alignment. Bearings also influence the contact state by controlling shaft guidance and transmit dynamic forces and moments into the housing [
10,
11,
12,
13].
The housing responds according to its geometry, material properties, wall thickness, joints, damping, mounts, and boundary conditions. The resulting surface motion produces acoustic radiation. Structural acceleration, surface-normal velocity, equivalent radiated power (ERP), sound pressure, acoustic intensity, and sound power describe related but distinct parts of this response [
17,
18,
19,
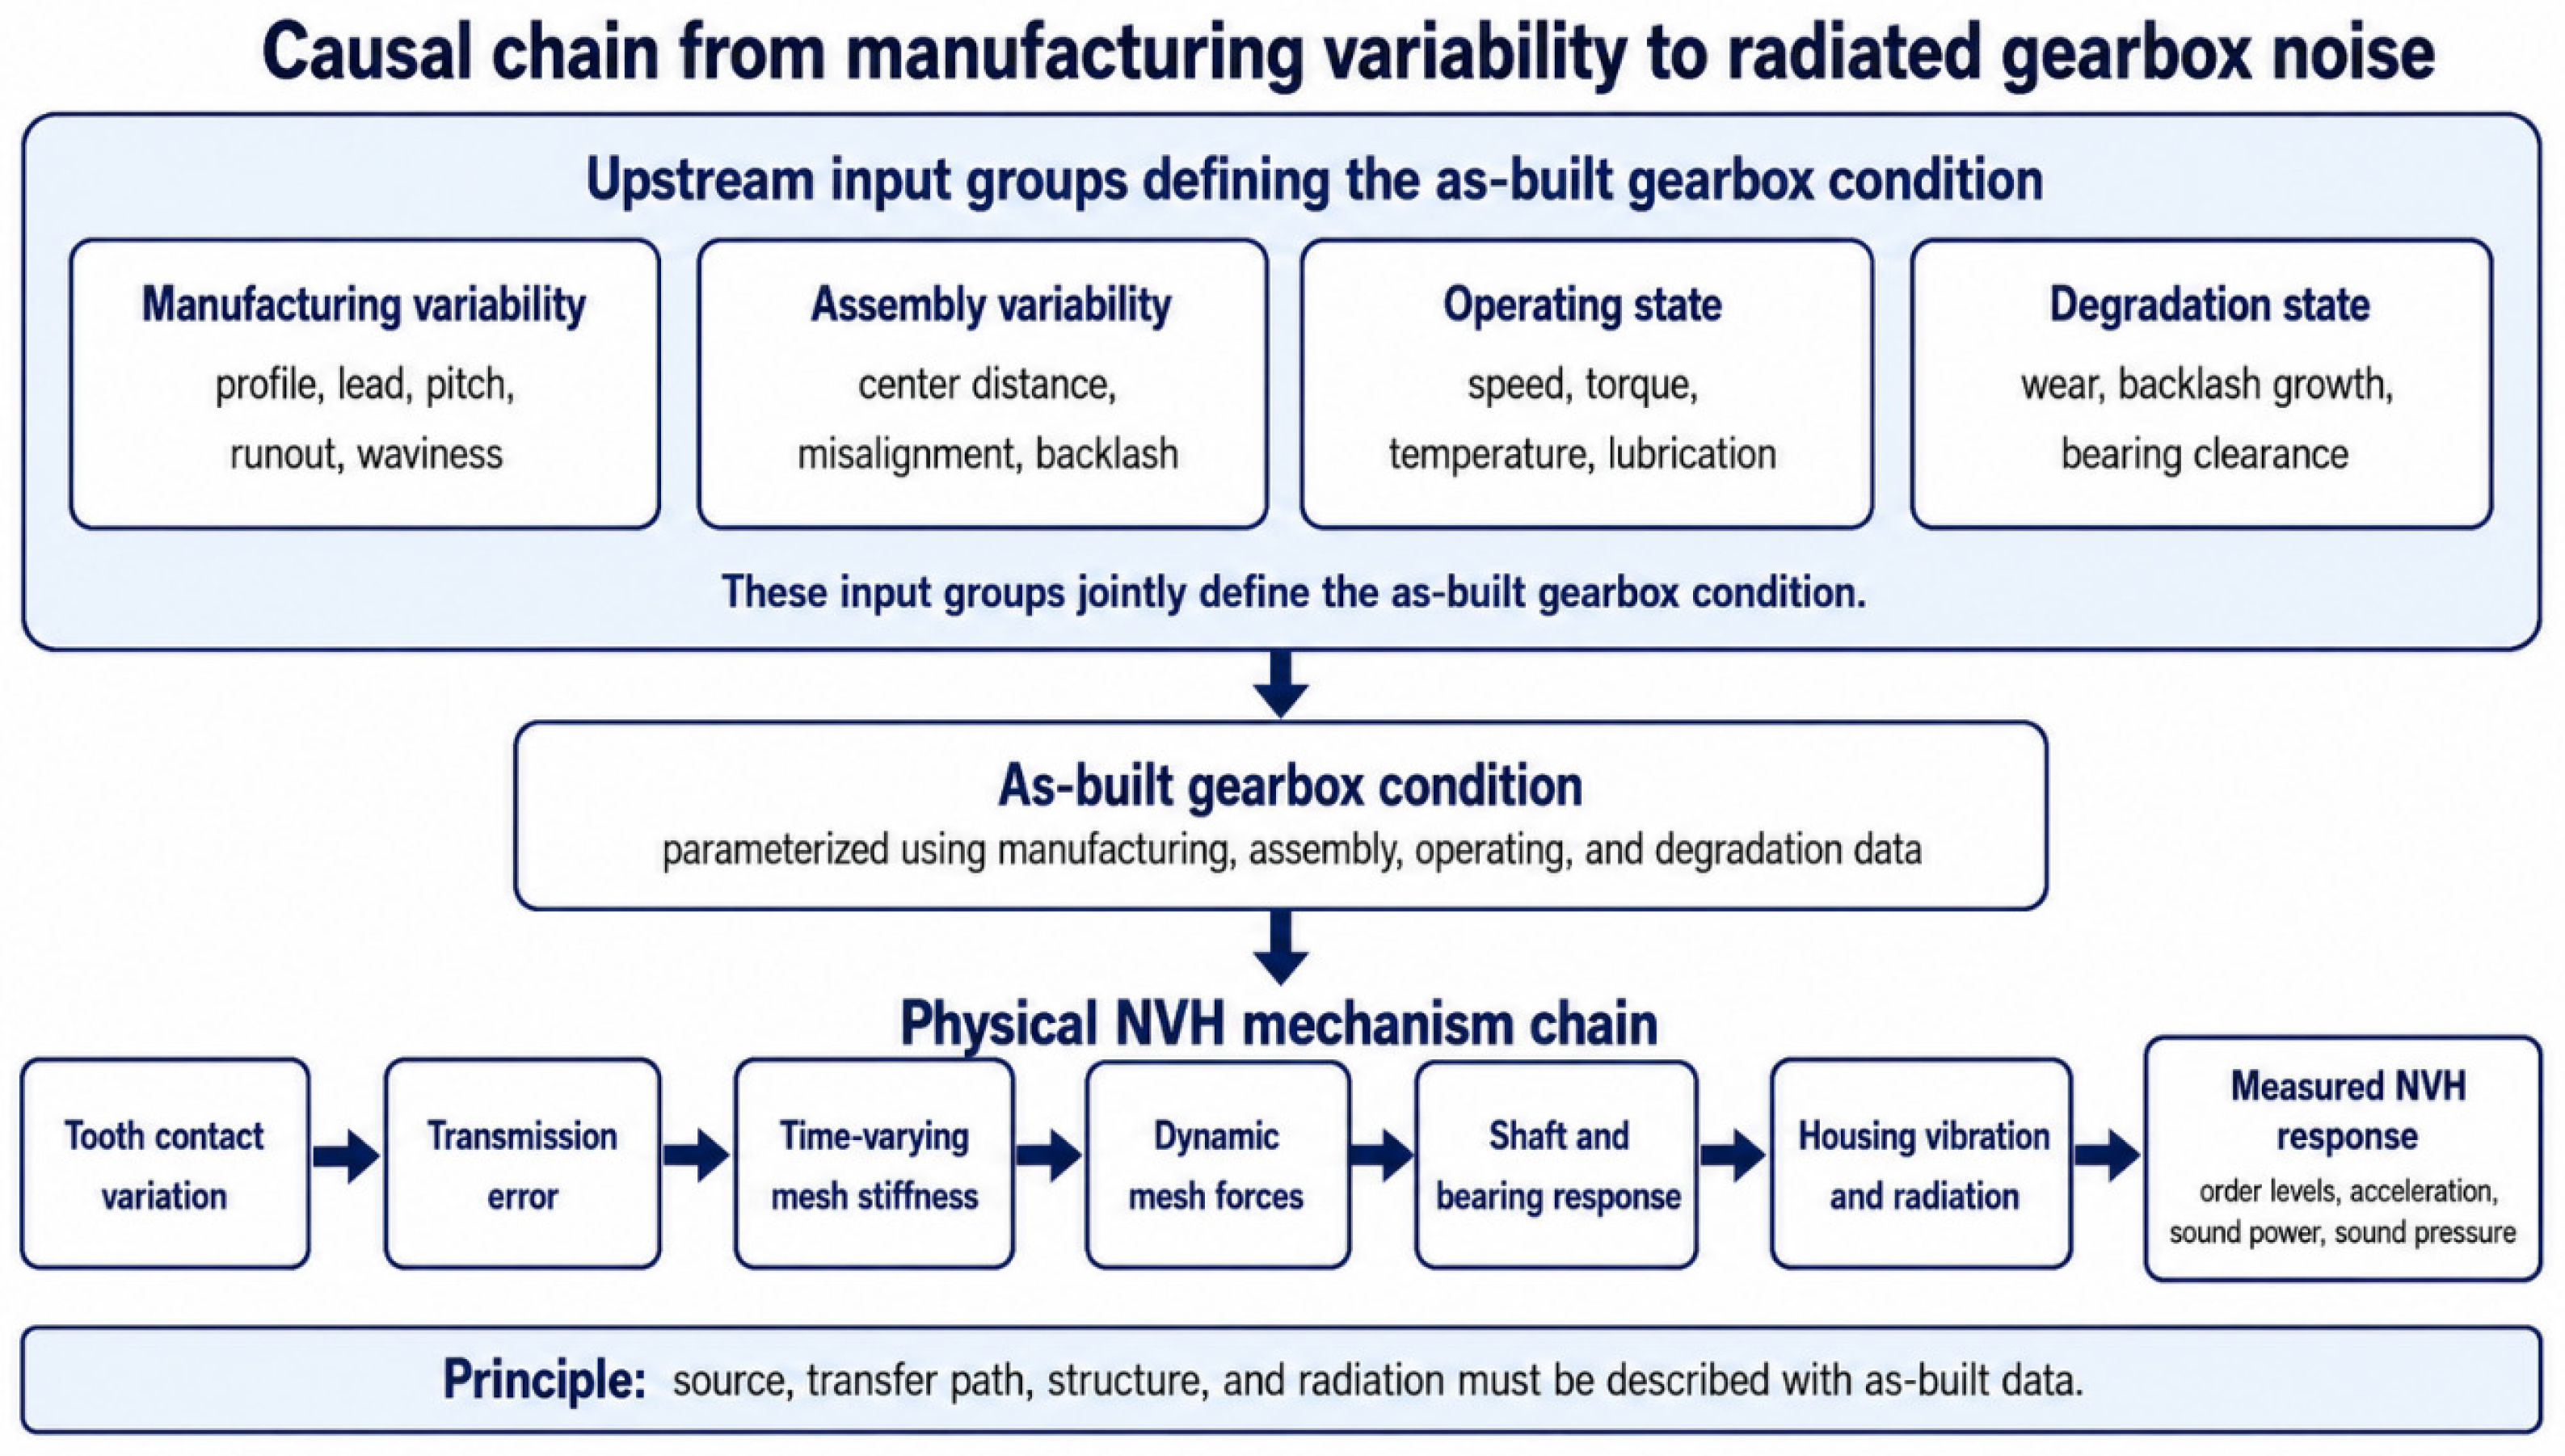
20]. The complete physical chain can therefore be written as manufacturing and assembly state -> contact excitation -> rotating-system dynamics -> interface forces -> housing response -> acoustic radiation. Operating conditions and degradation may modify every stage. The complete causal chain considered in this framework is summarized in
Figure 1.
3.2. Dual Classification
The first classification axis describes the physical origin: nominal gear geometry, intentional microgeometry, manufacturing deviations and flank topography, assembly alignment and mounting state, bearing and support state, shafts and rotors, housing and joints, operating and thermal conditions, and lubrication and degradation state. This axis reflects when and where a parameter enters the gearbox lifecycle. Standardized terminology for flank deviations and damage remains important for maintaining a consistent physical description [
14,
15,
21].
The second axis describes NVH function: excitation generation, force transmission, structural response, acoustic radiation, operating boundary condition, degradation modifier, and validation quantity. One parameter may perform several functions. Bearing preload originates from the bearing arrangement and assembly procedure, but it affects the shaft alignment, gear contact, support stiffness, interface forces, and housing excitation. Runout originates from manufacturing or mounting but appears dynamically as rotational modulation of the mesh condition.
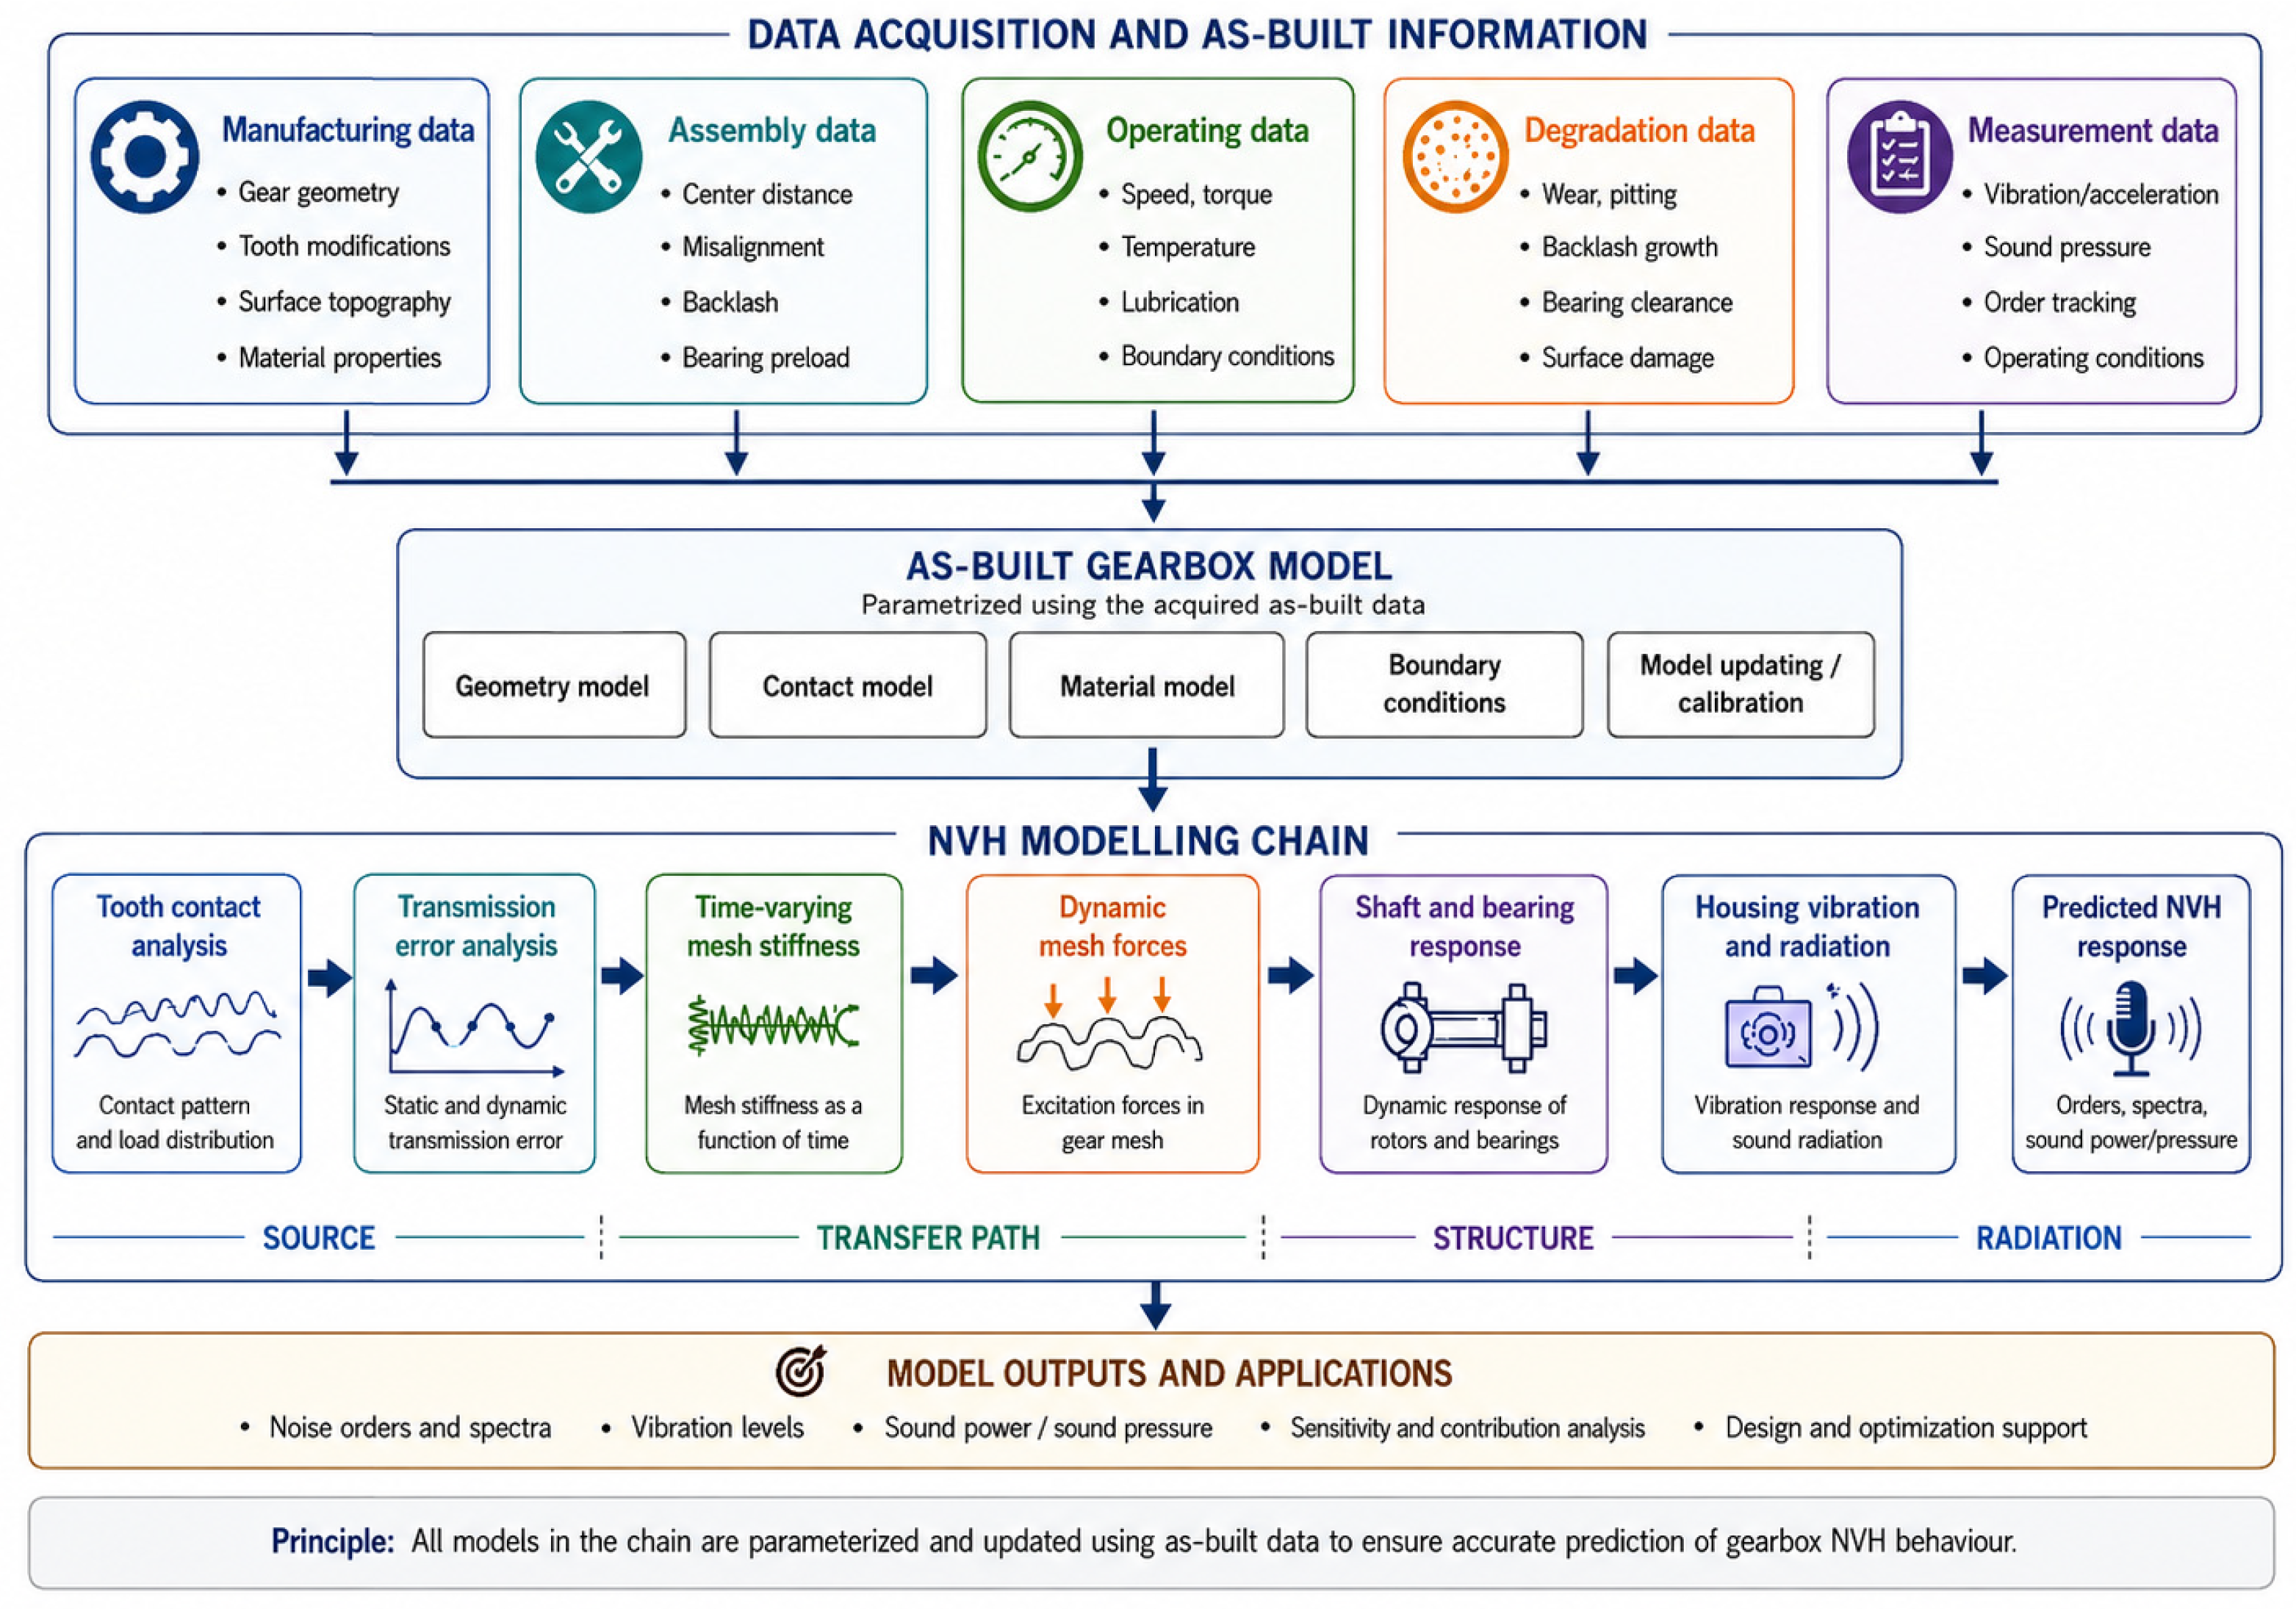
The dual classification prevents all available production variables from being treated as equally important model inputs and prevents parameters from being assigned only to their component of origin when their principal NVH influence occurs elsewhere in the system. The relationship between the physical origin and NVH function is illustrated in
Figure 2.
3.3. Physical-to-Numerical Translation
A measured physical quantity becomes a numerical model input only after its representation has been defined. Typical transformations include the measured profile and lead deviations into flank-surface correction fields; tooth-indexed pitch errors into angular or linear tooth-position vectors; runout into an eccentricity vector or periodic center-distance variation; shaft-axis misalignment into coordinate translations and rotations; backlash into a nonlinear dead band; bearing preload into an imposed displacement, initial force, or equilibrium state; directional bearing behavior into radial, axial, and tilting stiffness or a coupled matrix; housing-wall variation into a spatial finite-element thickness field; torque ripple into an operating-point-dependent harmonic torque input; and housing surface velocity into an acoustic boundary condition.
The transformation must preserve the measurement feature that drives the investigated mechanism. A scalar gear-quality grade may be adequate for acceptance control but cannot reproduce tooth-specific phase, spatial waviness, or deterministic modulation. One catalogue bearing stiffness may not represent the assembled preload, load, temperature, and surrounding structural compliance. Each transferred quantity should therefore retain units, coordinate system, sign and rotation convention, datum, component identity, operating state, filtering and interpolation, uncertainty, target solver, and expected validation output.
3.4. Simulation-Readiness Levels
3.4.1. Level 0: Nominal Model
A Level 0 model represents the intended design using the nominal geometry, intended microgeometry, ideal assembly, simplified support properties, and prescribed operating conditions. It supports order-location prediction, concept comparison, mechanism screening, and relative design ranking, but it does not support as-built or production-population claims.
3.4.2. Level 1: Tolerance-Based Model
A Level 1 model introduces specified tolerance ranges, bounded deviations, worst-case combinations, design-of-experiments cases, or assumed input distributions. It supports sensitivity analysis, robustness assessment, tolerance allocation, and conditional response envelopes. It does not represent a particular manufactured unit unless the selected deviations correspond to that unit, and assumed distributions alone do not establish production scatter.
3.4.3. Level 2: Measurement-Based Model
A Level 2 model represents a specific manufactured and tested unit. Influential inputs are derived from traceable measurements, assembly records, supplier-supported properties, or experimentally identified parameters. Transition requires unit-specific information, traceable numerical mapping, matched operating and thermal conditions, and stage-appropriate validation. Supported claims include as-built correlation, model updating, and unit-specific root-cause investigation within the validated domain.
3.4.4. Level 3: Variability-Aware Model
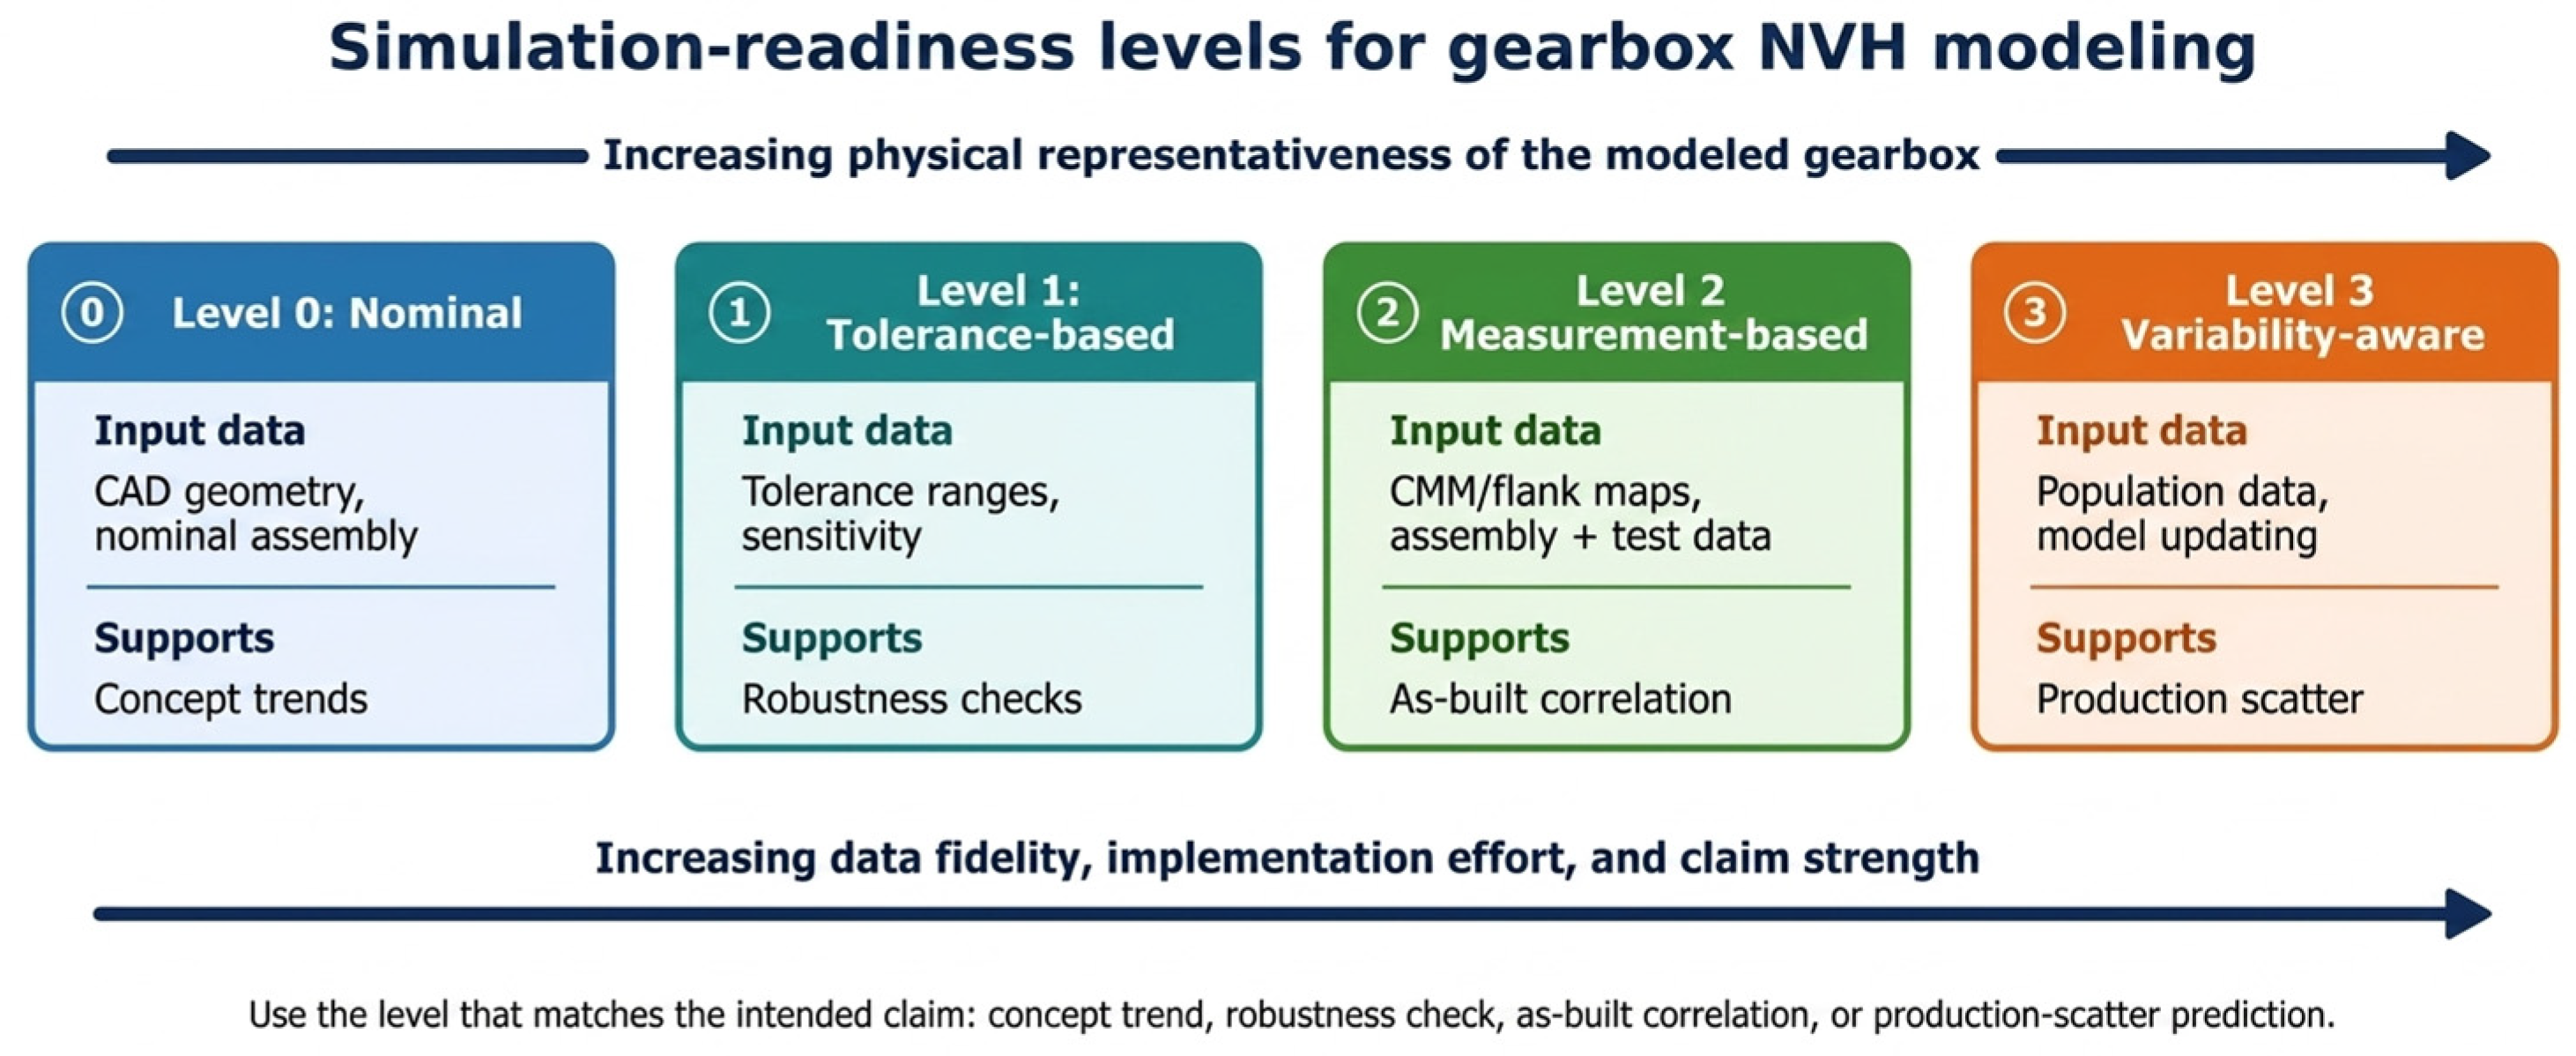
A Level 3 model extends the measurement-based logic to multiple units or a statistically defined population. It requires measured or defensible input distributions, relevant covariance, the separation of physical and measurement variation, held-out units or lots, and a comparison of predicted and measured output distributions. It supports conditional production-scatter and risk estimates within the calibrated design, process, population, and operating domain. The four readiness levels and their increasing evidential requirements are summarized in
Figure 3.
3.5. Transition Gates and Permitted Claims
A model progresses from Level 0 to Level 1 when influential deviations and operating ranges are represented explicitly rather than assumed to be nominal. A transition from Level 1 to Level 2 requires unit-specific measured or identified inputs, traceable numerical implementation, and comparison with matched experimental outputs. A transition from Level 2 to Level 3 requires the same traceability across multiple units, statistically supported input dependencies, and population validation based on units or lots excluded from calibration. A solver upgrade alone does not constitute a transition, and agreement with one final SPL value does not establish a transition when upstream source and transfer-path representations remain unchallenged.
The entry criteria, minimum evidence, supported claims, and claim boundaries for all four readiness levels are summarized in
Table 2.
3.6. Baseline, Recommended, and Advanced Priorities
The baseline, recommended, and advanced labels describe practical data and modeling priorities rather than universal rankings of physical importance. Each parameter is assessed according to causal proximity to the target mechanism, the consistency of sensitivity or validation evidence, practical measurability or availability, identifiability using available validation outputs, and dependence on the architecture, frequency range, operating state, and objective. Baseline parameters normally define the principal causal chain and are commonly available. Recommended parameters improve the correlation, robustness, or physical interpretation but may be configuration-dependent. Advanced parameters require specialized measurements or detailed modeling and are normally justified for targeted root-cause, high-frequency, or population-level investigations. The classification remains conditional and should be updated by system-specific sensitivity and evidence.
The resulting condensed, tiered parameter framework is presented in
Table 3.
4. Simulation-Relevant Parameter Domains
4.1. Gear Geometry, Microgeometry, and Manufacturing Deviations
Gear geometry should be separated into nominal macrogeometry, intentional microgeometry, and unintentional manufacturing deviation. Although these categories may be evaluated using the same inspection system, they have different physical roles and should not be combined into one generic flank-error input.
4.1.1. Nominal Geometry and Intentional Microgeometry
Nominal macrogeometry includes the tooth count, module, pressure angle, helix angle, face width, reference diameter, center distance, and profile shift. These quantities define the transmission ratio, mesh order, nominal contact geometry, contact ratio, force directions, and fundamental load sharing. They are baseline inputs for all readiness levels, but complete nominal geometry does not make the model representative of a manufactured gear pair.
Intentional microgeometry includes profile relief, lead crowning, end relief, barreling, bias, and twist. These modifications compensate for tooth and shaft deflection, bearing compliance, housing deformation, and assembly misalignment. Their NVH influence is primarily exerted through loaded transmission error, load entry and exit, time-varying mesh stiffness, face-load distribution, and alignment sensitivity. Performance is operating-point-dependent; a modification optimized at one torque may be ineffective at another and should be evaluated together with the stress, edge loading, efficiency, and durability [
6,
7,
16]. For Level 2 studies, the manufactured flank should be compared with the intended modification because process deviations can alter slope, form, crowning, or twist.
4.1.2. Profile and Lead Deviations
Profile and lead deviations describe departures from the intended flank in the profile and face-width directions. Standard quality parameters provide consistent terminology [
14,
15], but scalar values do not always preserve the spatial information required for NVH analysis. A total profile-deviation value does not identify whether the error is dominated by slope, low-order form, local waviness, or a shift relative to intended relief; similarly, one helix-deviation value does not fully describe where load is redistributed across the face width.
A practical representation hierarchy is as follows: scalar descriptors for early sensitivity analysis, profile and lead traces for directional shape, two-dimensional flank fields for coupled profile-lead behavior, and tooth-specific maps for individual-unit or population studies. Imported data should specify whether they represent the total manufactured flank or only residual deviation, together with the coordinate definition, filtering, evaluated region, tooth identity, and interpolation. A Level 2 claim requires geometry from the simulated gear; Level 3 should preserve relevant part-to-part, tooth-to-tooth, flank-to-flank, and batch-level dependencies.
4.1.3. Pitch Error, Runout, and Tooth-to-Tooth Variation
Pitch error describes departure from ideal tooth spacing. Tooth-indexed and cumulative pitch data preserve circumferential patterns lost in one maximum or quality-class value. These patterns may produce engagement-to-engagement variation, shaft-order modulation around mesh frequency, sideband families, and deterministic low-order circumferential excitation. Their effect depends on spatial sequence and phase rather than maximum amplitude alone [
22,
23,
24,
25].
For Level 1 studies, pitch errors may be represented by bounded deterministic or statistically generated tooth-indexed vectors. For Level 2, the measured per-tooth sequence and reference tooth should be retained. Independent sampling may be inappropriate at Level 3 when tool indexing, machine periodicity, fixture behavior, or process drift creates correlated structures.
Runout and eccentricity introduce periodic variation in the effective mesh condition. Possible representations include eccentricity vectors, the rotational-position-dependent center distance, shaft-order kinematic excitation, and tooth-position corrections derived from composite measurements. Gear-manufacturing runout, gear-shaft mounting eccentricity, shaft-journal eccentricity, and assembled runout should be distinguished because they imply different corrective actions.
Tooth-specific geometry is valuable when stable modulation is observed, one or several teeth are suspected, similar quality grades produce different order patterns, or production scatter is investigated. Full tooth-resolved maps provide high fidelity but create excessive dimensionality. Reduced spatial harmonics, principal components, or physically selected descriptors may be used when they preserve relevant transmission-error, force, or order behavior.
4.1.4. Readiness Implications for Gear Geometry and Manufacturing Deviations
A detailed nominal flank remains Level 0 when it contains no manufactured information. Level 1 introduces bounded deviations. Level 2 uses measured geometry from the investigated unit and validates its contact or NVH effect. Level 3 represents measured distributions and dependencies across multiple gears. Nominal geometry and intended microgeometry are baseline; the measured profile and lead deviations are baseline for Level 2 as-built contact modeling; pitch, cumulative pitch, and runout are generally recommended; and tooth-specific maps and population covariance are advanced or conditional. Detailed inputs are reported in
Supplementary Table S1.
4.2. Flank Waviness and Surface Topography
Conventional profile, lead, pitch, and runout quantities are essential for manufacturing control, but they may not preserve all spatial features relevant to narrowband tonal excitation. Flank waviness is a periodic or quasi-periodic deviation superimposed on the intended tooth surface. It may originate from grinding-wheel or dressing behavior, machine-tool vibration, feed and kinematic relationships, workpiece or fixture dynamics, honing processes, and thermal or process drift.
Its NVH significance depends on the wavelength or spatial frequency, amplitude, phase, direction relative to the profile and lead axes, orientation relative to the moving contact line, tooth-to-tooth repetition, and superposition of components. As the contact line traverses the pattern, spatial periodicity may be converted into temporal excitation. Depending on gear kinematics and phase progression, this may appear as an unconventional tonal order or concentrated sideband structure.
Such a component is often described as a ghost order. However, an unexplained tone should not automatically be attributed to flank waviness. Pitch error, runout, bearing excitation, rotor eccentricity, torque ripple, electromagnetic forces, and structural resonances should also be evaluated. Intentional tooth-specific microgeometry variation may redistribute concentrated excitation, but the benefit remains configuration-dependent and does not establish a universal rule that additional variation improves NVH [
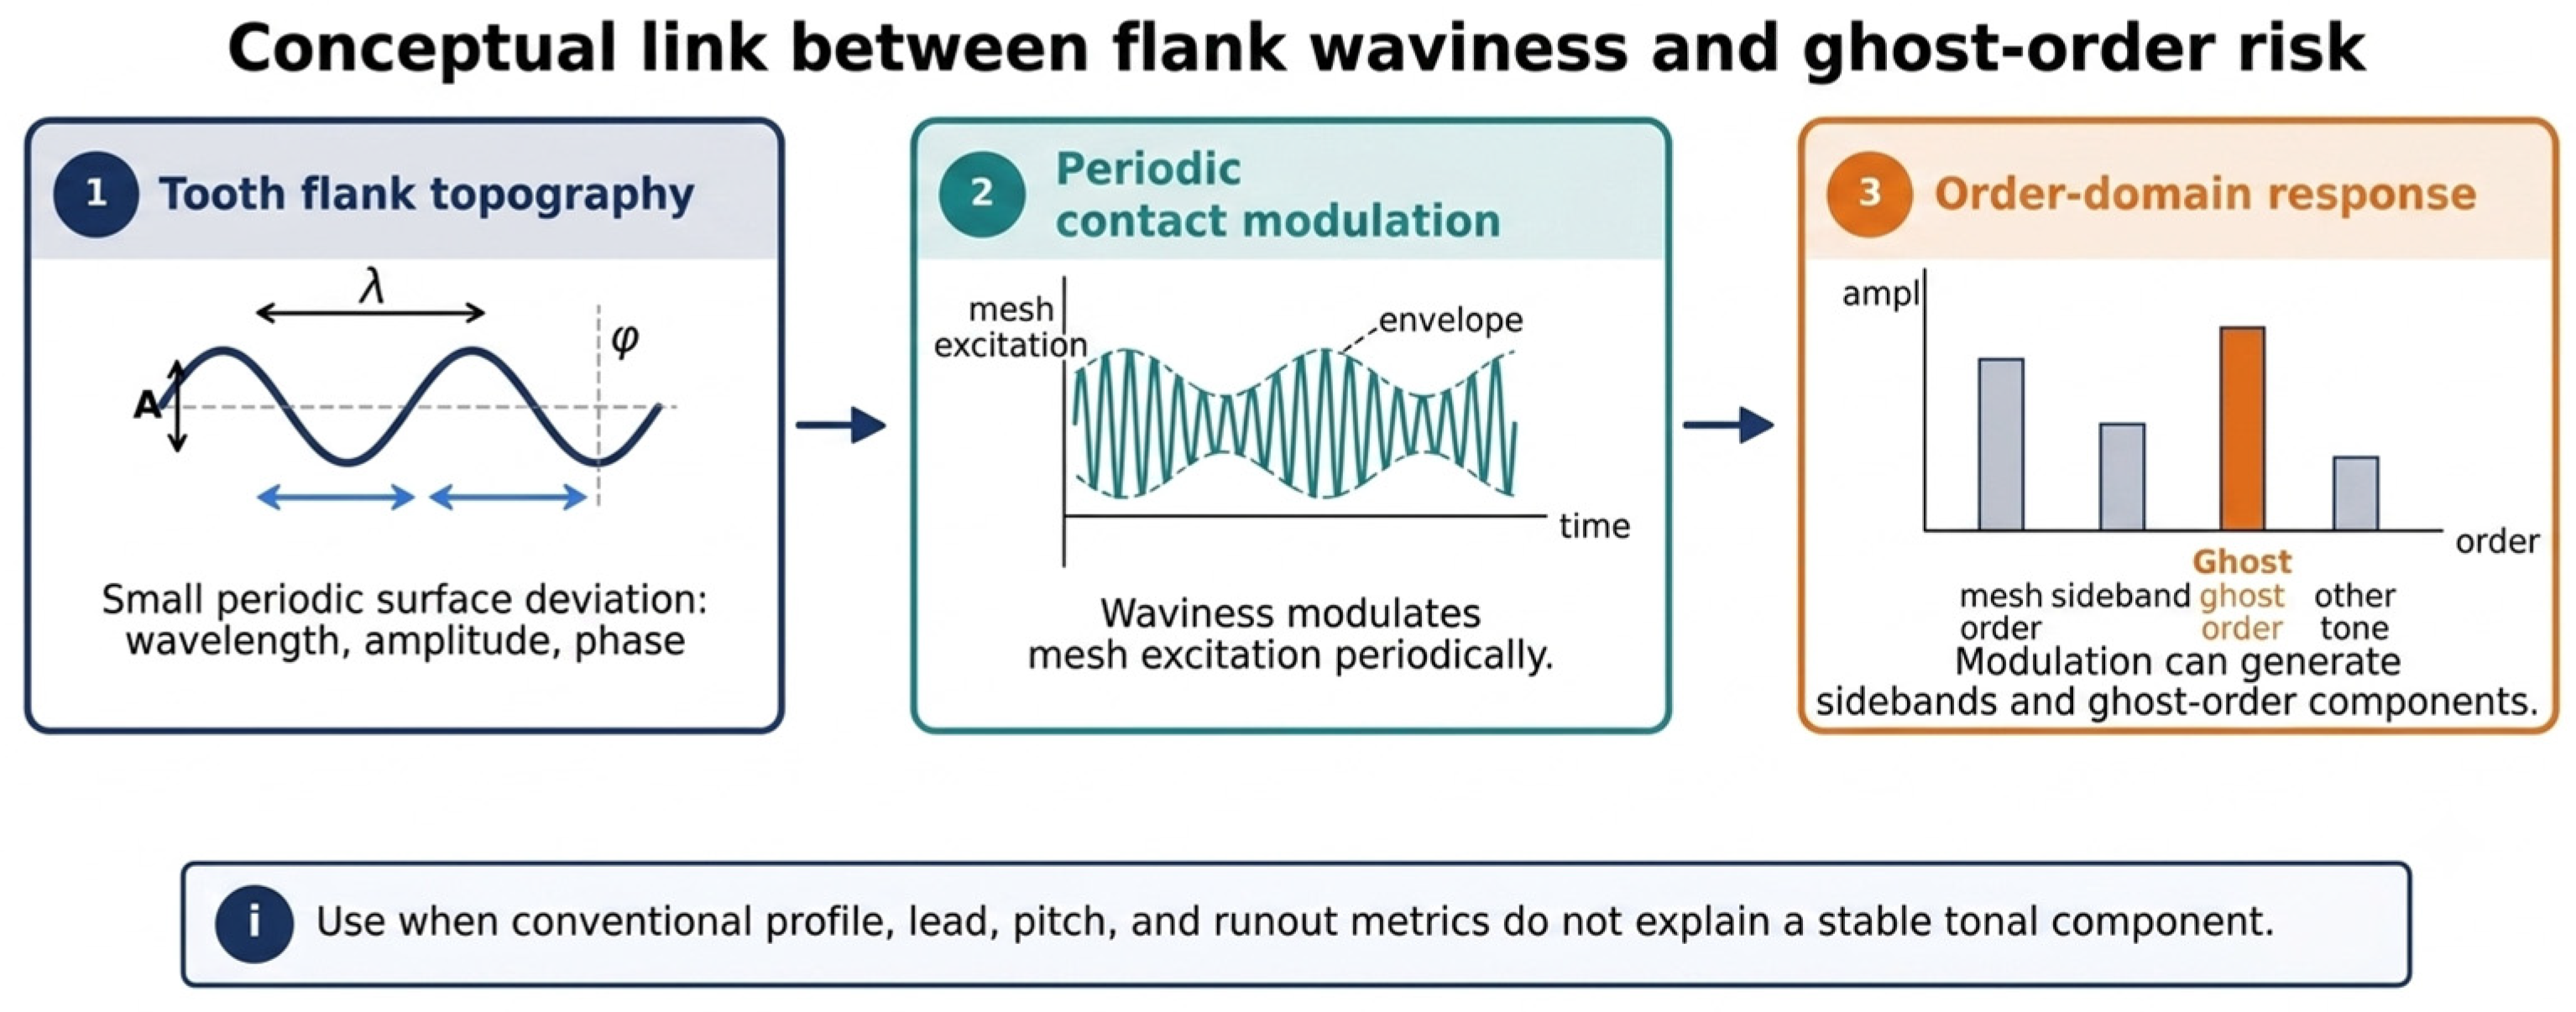
2]. The pathway from flank waviness to tonal response is illustrated in
Figure 4.
4.2.1. Measurement and Representation
Possible measurements include dense flank scans, high-resolution profile and lead measurements, optical topography, confocal measurements, and interferometric methods. The dataset should retain the spatial resolution, evaluated area, coordinate system, datum and alignment, filter and cut-off definitions, treatment of nominal form and intended microgeometry, tooth and flank identity, phase reference, repeatability, and uncertainty.
Filtering is critical. Removing the intended microgeometry incorrectly can produce a residual field that does not represent the physical surface, whereas importing the total measured surface and then adding the design modification again can duplicate the intended geometry. Numerical representations may include equivalent harmonic excitation, spatial harmonics, reduced topography descriptors, full measured flank maps, or tooth-specific surfaces. The least complex representation that preserves the target mechanism should be used, and reduced descriptors should be checked against the reconstructed transmission error, mesh force, or order response rather than geometry reconstruction error alone.
4.2.2. Readiness Implications for Flank Waviness and Surface Topography
Waviness is normally advanced in a general-purpose gearbox model. It becomes recommended when a repeatable process-related or narrowband tone is observed and may become baseline for a specific root-cause investigation when conventional geometry, runout, motor orders, and structural modes cannot explain the response. A Level 2 representation requires topography from the investigated gear and matched transmission-error or response validation. Level 3 should distinguish tooth-to-tooth, part-to-part, and measurement-system variability. Detailed parameters are retained in
Supplementary Table S2.
4.3. Assembly Alignment and Bearing Support State
The operating contact state is determined not only by manufactured gear geometry, but also by the assembled positions and compliance of the shaft-bearing-housing system. The center distance, shaft-axis alignment, backlash, bearing-seat geometry, shim dimensions, fits, preload, clearance, and structural compliance jointly determine the as-built support condition. Assembly defines the initial positions and preload generation, while bearings determine how these positions change under load and temperature [
10,
11,
12,
13].
4.3.1. Alignment, Backlash, and Mounting State
Relevant as-built quantities include the actual center distance, parallel and angular shaft-axis error, skew and axial offset, bore and bearing-seat coordinates, gear mounting tilt or eccentricity, shim and spacer dimensions, backlash and endplay, and bearing fits and ring displacement. Center-distance deviation affects the operating pressure angle, contact ratio, and backlash. Angular misalignment changes the face-load distribution and may promote edge contact. Axial displacement is especially relevant for helical gears because it changes the utilized contact region.
The model should use a consistent datum system. Relative axis translation and rotation are generally preferable to disconnected scalar tolerance values when three-dimensional misalignment is important. Backlash is both an assembly parameter and a nonlinear dynamic state. A constant value may be sufficient for a continuously loaded point, whereas low-load operation, regenerative braking, or torque reversal may require a nonlinear dead band and contact-side switching [
25,
26]. Backlash data should be associated with the temperature, rotational position, measurement load, drive or coast flank, axial position, and assembly state.
4.3.2. Bearing Preload, Clearance, and Stiffness
Bearings guide shafts, influence tooth alignment, react radial and axial mesh forces, transmit forces and moments to the housing, and modify system modes. Their state depends on bearing type and arrangement, internal clearance, preload, shaft and housing fits, applied loads, temperature, and support compliance.
Preload should not be represented only as one nominal force. The model should distinguish the assembly operation generating preload, imposed displacement or interference, effective stiffness of the complete assembly loop, bearing force after equilibrium, and temperature-dependent change. A no-load equilibrium calculation is therefore recommended before operational torque and speed are applied.
Possible representations include the scalar radial stiffness, directional radial/axial/tilting stiffness, stiffness-damping elements, nonlinear force-displacement laws, coupled matrices, and detailed rolling-element models. Bearing behavior is generally nonlinear and load-dependent [
27,
28,
29,
30], but complexity should remain proportional to the investigated mechanism and available data. For helical stages, axial and tilting behavior may be as important as radial stiffness.
4.3.3. Thermal and Structural Coupling
Temperature alters the shaft, bearing, housing, cover, and spacer dimensions and may increase or decrease preload. The relevant chain is temperature -> clearance or preload -> bearing stiffness -> shaft alignment and force transmission -> gear contact -> NVH response. The minimum requirement is to state the temperature associated with the bearing properties and assembly state. More advanced models may use temperature-dependent clearance and stiffness tables or coupled thermal-structural equilibrium. Bearing-seat and surrounding housing compliance also contribute to effective support; interface nodes, coordinate systems, force-transfer points, and ring-support regions should correspond between MBD and structural models.
4.3.4. Validation and Readiness Implications for Assembly and Bearing Support
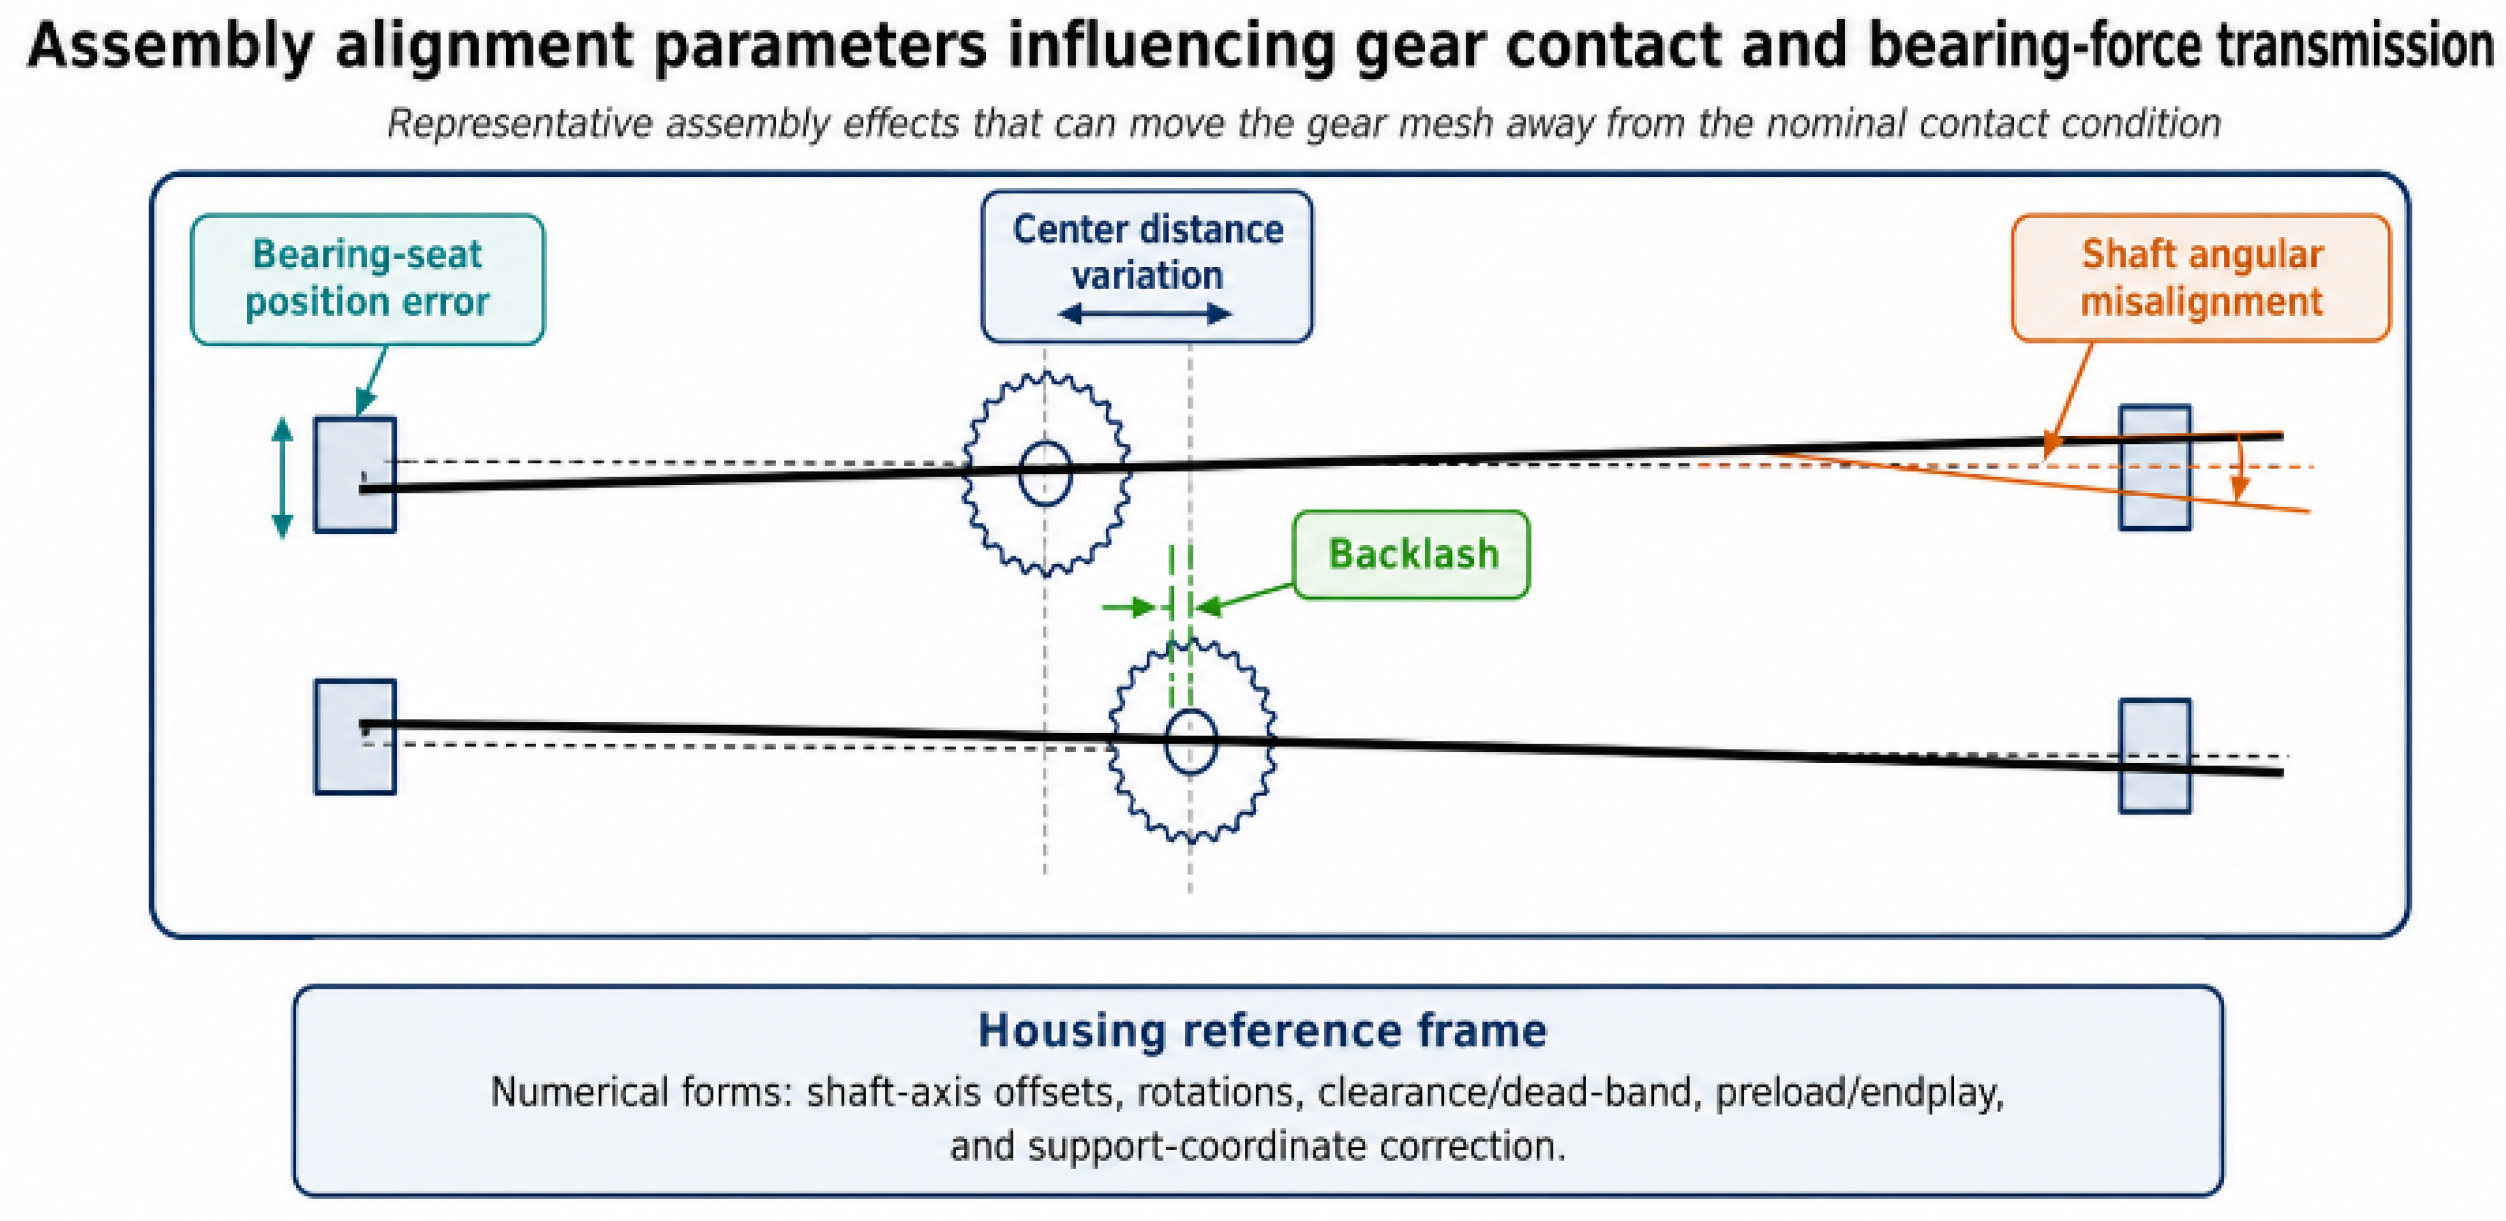
Relevant validation outputs include the contact pattern, loaded transmission error, shaft displacement or tilt, bearing force, bearing-seat acceleration, local frequency-response functions, and warm-state response. The center distance, principal alignment, backlash, bearing arrangement, and preload or clearance are baseline. Axial and tilting stiffness, fits, shim data, effective assembly stiffness, and thermal dependence are recommended. Nonlinear laws, coupled matrices, and detailed internal bearing geometry are advanced or conditional. Detailed assembly and bearing inputs are retained in
Supplementary Tables S3 and S4. A schematic summary of the recommended bearing data package and its role in the NVH transfer path is provided in
Supplementary Figure S1. The principal assembly and bearing parameters defining the as-built support state are summarized in
Figure 5.
4.4. Shaft, Rotor, Interface, and Electromechanical Excitations
Gear-mesh excitation is central to gearbox NVH, but it is not the only tonal source in an integrated electric drive. Shaft flexibility modifies tooth alignment and dynamic force transmission, while rotor imbalance, eccentricity, torque ripple, electromagnetic force harmonics, splines, and couplings may excite the same structural modes as the gear stage. A simulation-ready model should include the source families relevant to the investigated order range rather than attributing every narrowband component to the gear mesh [
3,
4,
5,
31]. The principal gear, shaft, bearing, and electromechanical source families and their order–domain relationships are summarized in
Supplementary Figure S2.
4.4.1. Shaft Flexibility and Dynamic Alignment
Shaft deformation affects the system through torsional, bending, axial, and tilting compliance. Torsional flexibility modifies the relative angular motion; bending and tilting alter mating-flank position and therefore face-load distribution, loaded transmission error, bearing reactions, and housing excitation. Required fidelity depends on the shaft span, rotor and gear overhang, bearing positions, torque, proximity of shaft modes to gear or motor orders, and contact sensitivity to misalignment.
Representations include rigid bodies, beam elements, reduced flexible bodies, and detailed finite-element models. The selected model should preserve actual gear, bearing, rotor, and coupling interface coordinates. For Level 2 correlation, flexibility may be challenged using shaft displacement or tilt, bearing-force distribution, torsional response, critical-speed location, or load dependence of mesh response.
4.4.2. Imbalance, Runout, and Eccentricity
Imbalance produces a rotating centrifugal force whose magnitude increases with the square of speed. Its descriptors are the magnitude, axial location, angular phase, speed, and component identity, and it is normally represented as a rotating force vector or eccentric mass. Axial location and phase should be retained because identical magnitudes can produce different bearing reactions and housing responses.
Imbalance should be distinguished from runout and eccentricity. Gear eccentricity may periodically change the effective mesh condition and produce shaft-order modulation around mesh-related components. Rotor eccentricity may additionally modify the electromagnetic air-gap field. Pitch error, gear runout, and mounting eccentricity may all generate sidebands, and their effects cannot be separated reliably from spectral amplitude alone [
22,
23,
24,
25]. Phase-synchronous measurements, component index information, and measured runout improve identifiability.
4.4.3. Torque Ripple and Electromagnetic Excitation
Electric-machine excitation may enter through torque ripple, cogging, electromagnetic radial forces, slotting and inverter harmonics, control-dependent components, and rotor eccentricity. Torque ripple acts primarily as torsional excitation and may modulate gear load, interact with mesh stiffness, or excite drivetrain modes. Radial forces act more directly on the stator and motor housing but may propagate into an integrated gearbox casing.
A useful torque-ripple input should contain harmonic or order number, amplitude and phase, speed and torque dependence, drive or regeneration state, and control condition. Detailed electromagnetic excitation may be transferred as nodal force fields, spatial-temporal harmonic maps, modal generalized forces, or reduced radial and tangential distributions. A gearbox-only model cannot support complete source attribution when a relevant motor order overlaps the investigated response but motor-side excitation is omitted; inserting generic harmonics without traceable amplitude and phase also does not increase readiness.
4.4.4. Splines, Couplings, and Readiness
Splines and couplings may introduce torsional, bending, and axial compliance together with clearance, friction, damping, and eccentricity. A linear torsional stiffness may suffice for continuously loaded gear whine, while low-load operation or torque reversal can require nonlinear clearance and contact. The shaft geometry, mass, inertia, and interface locations are baseline. Shaft flexibility, imbalance, runout, coupling stiffness, and relevant torque-ripple components are generally recommended. Detailed electromagnetic force fields, nonlinear spline contact, and phase-resolved multi-source excitation are advanced or conditional. Detailed inputs are retained in
Supplementary Table S5.
4.5. Housing, Joints, Structural Response, and Acoustic Radiation
The gearbox housing is both a load-carrying structure and a principal radiating surface. Gear and motor excitations reach it through bearings, joints, mounts, and structural interfaces. The resulting sound depends on the interface-force distribution, housing dynamics, surface motion, and acoustic radiation. Structural and acoustic validation must therefore be treated as successive but distinct stages.
4.5.1. Housing Geometry and Structural Interfaces
Relevant inputs include the external and internal geometry, wall thickness, ribs, bearing seats, covers and flanges, bolt patterns, mounts, openings, and radiating surfaces. A nominal CAD housing remains Level 0 until its structural behavior is challenged experimentally. Wall-thickness variation affects the mass, stiffness, local modes, and bearing-seat compliance and may be represented using regional shell thicknesses, element-wise fields, or reconstructed solid geometry. Population models should preserve spatial correlation rather than vary every element independently.
Bearing-seat interfaces define both force-application locations and local compliance. The model should preserve interface coordinates, retained nodes or coupling regions, local directions, force and moment conventions, and consistency between MBD and finite-element reference points. A force with the correct magnitude but an incorrect application point or coordinate transformation can produce a misleading structural response.
4.5.2. Covers, Joints, and Damping
Covers, flanges, and bearing caps may dominate individual resonances. Their behavior depends on the geometry, bolt spacing, gasket properties, contact condition, and preload. Joint models may use bonded interfaces, distributed springs, identified stiffness and damping, bolt pretension with contact, or nonlinear friction. The simplest representation consistent with the target frequency range should be used.
Structural damping may represent material loss, joints, seals, bearing interfaces, mounts, and lubricant-related dissipation. Modal testing provides a defensible basis for identifying natural frequencies, mode shapes, and damping [
32]. Damping should not be used as an unrestricted correction factor; updated values should remain physically plausible and be checked on modes, operating points, or measurements not used during calibration.
4.5.3. Structural Transfer Paths and Validation
The dominant acoustic contribution is not necessarily associated with the largest internal force because transfer paths and structural filtering modify the response. Relevant paths include gear mesh to shaft to bearing to housing, motor force to integrated casing, torque ripple through the drivetrain, and housing to vehicle mounts. Classical gearbox studies emphasized the strong influence of the transmission path and the need to separate excitation and structural response [
33,
34].
Structural validation should proceed from numerical verification to modal correlation, interface frequency–response correlations, operational force application, and finally acceleration and surface-velocity comparisons. Useful metrics include the natural-frequency error, modal assurance criterion, damping error, FRF magnitude and phase, bearing-seat mobility, and operational response. Surface velocity is more directly connected to radiation than one local acceleration signal.
4.5.4. Acoustic Outputs and Modeling
ERP uses surface motion to rank regions or variants according to radiation potential but does not equal measured sound power. Acoustic transfer functions relate structural or interface inputs to pressure at defined receivers and are configuration- and environment-specific. SPL describes a receiver-specific response, sound power describes total output under defined measurement conditions, and acoustic intensity provides energy-flow and source-localization information. Intensity methods have been used for gearbox sound-power determination and radiating-casing identification [
35,
36]. These outputs are complementary, not interchangeable.
Acoustic radiation may be calculated using finite-element, boundary-element, coupled FEM-BEM, modal, transfer-function, or reduced-order approaches [
17,
18,
19,
20]. The model should document radiation surfaces, coupling, fluid properties, boundaries, receiver coordinates, frequency range, mesh criteria, and reference quantities. Reduced models may be sufficient for relative comparisons when the geometry and receivers are fixed; detailed coupling is more appropriate when directivity, local radiating regions, geometry changes, or receiver-specific SPL are central.
4.5.5. Readiness Implications for Structural and Acoustic Modeling
The housing geometry, material data, nominal thickness, interface coordinates, boundary conditions, radiation surfaces, and receiver definitions are baseline. Measured thickness, modal damping, FRFs, bearing-seat stiffness, joint behavior, mount properties, surface velocity, ERP, SPL, and sound power are recommended for correlation-oriented models. Nonlinear joints, spatial damping, detailed coupled acoustic fields, intensity maps, and production covariance are advanced or conditional. Detailed structural and acoustic parameters are retained in
Supplementary Tables S6 and S7.
4.6. Operating, Thermal, Lubrication, and Degradation State
A gearbox model represents a defined physical condition, not only a nominal design. The speed, torque, torque direction, temperature, lubricant state, running-in, wear, and support degradation can change excitation, transfer path, and receiver response. Simulation and test can therefore be compared credibly only when operating and life states are matched.
4.6.1. Speed, Torque, and Direction
Speed defines mesh, shaft, motor, and bearing order frequencies. Torque influences the tooth deformation, loaded transmission error, contact distribution, shaft bending, bearing reaction, and support state. The minimum operating definition should include the speed, torque magnitude and sign, drive or coast state, steady or transient operation, acceleration or deceleration, temperature, and relevant motor-control condition. Drive and coast may load opposite flanks, while torque reversal can pass through backlash and contact loss. Inputs may be operating points, speed-torque maps, time histories, run-up profiles, or duty-cycle segments, with explicit sign conventions.
4.6.2. Thermal and Lubrication State
Temperature affects dimensional expansion, bearing preload and clearance, backlash, shaft alignment, lubricant viscosity, damping, friction, and material properties where relevant. A complete thermal simulation is not required for every study, but the temperature associated with each state-dependent input must be stated. Representations range from separate cold and warm states through lookup tables to thermally updated coordinates and coupled thermal–structural analysis.
The minimum lubricant description should normally include the type, grade, relevant viscosity, temperature, oil level, and test condition. Detailed film modeling is justified only when the target response and validation data support that fidelity.
4.6.3. Running-In, Wear, and State Evolution
Running-in and wear may alter the roughness, flank geometry, contact conformity, backlash, bearing state, and load distribution. Three modeling routes are useful: fixed-state models using measured new, run-in, aged, or damaged conditions; incremental updating at defined intervals; and continuous degradation models based on validated wear laws and operating histories. For system-level NVH studies, measured state-to-state geometry and clearance changes may be more defensible than a continuous prediction based on uncertain coefficients.
ISO 10825-1 provides terminology for gear wear and damage, while ISO 6336 provides load-capacity and surface-durability context [
21,
37,
38,
39]. These standards support a consistent description but do not constitute a complete degradation-to-NVH model. Backlash may grow because of flank wear, bearing-clearance growth, fit changes, or support degradation. Bearing degradation should be divided into bearing-origin excitation and support-state modification.
4.6.4. Validation and Readiness Implications for Operating and Degradation States
A practical degradation state may contain the accumulated operating history, measured flank condition, backlash, bearing clearance or preload, lubricant state, damage classification, and temperature or duty-cycle history. Generic labels such as aged should not replace measurable variables when they are available. The speed, torque, direction, and temperature are baseline. The actual transient profiles, oil state, operating backlash, bearing support state, and running-in classification are recommended. Wear maps, continuous degradation laws, detailed lubrication models, bearing-defect excitation, and life-state covariance are advanced or conditional. Detailed inputs are retained in
Supplementary Table S8.
5. Physical-to-Numerical Workflow and Validation
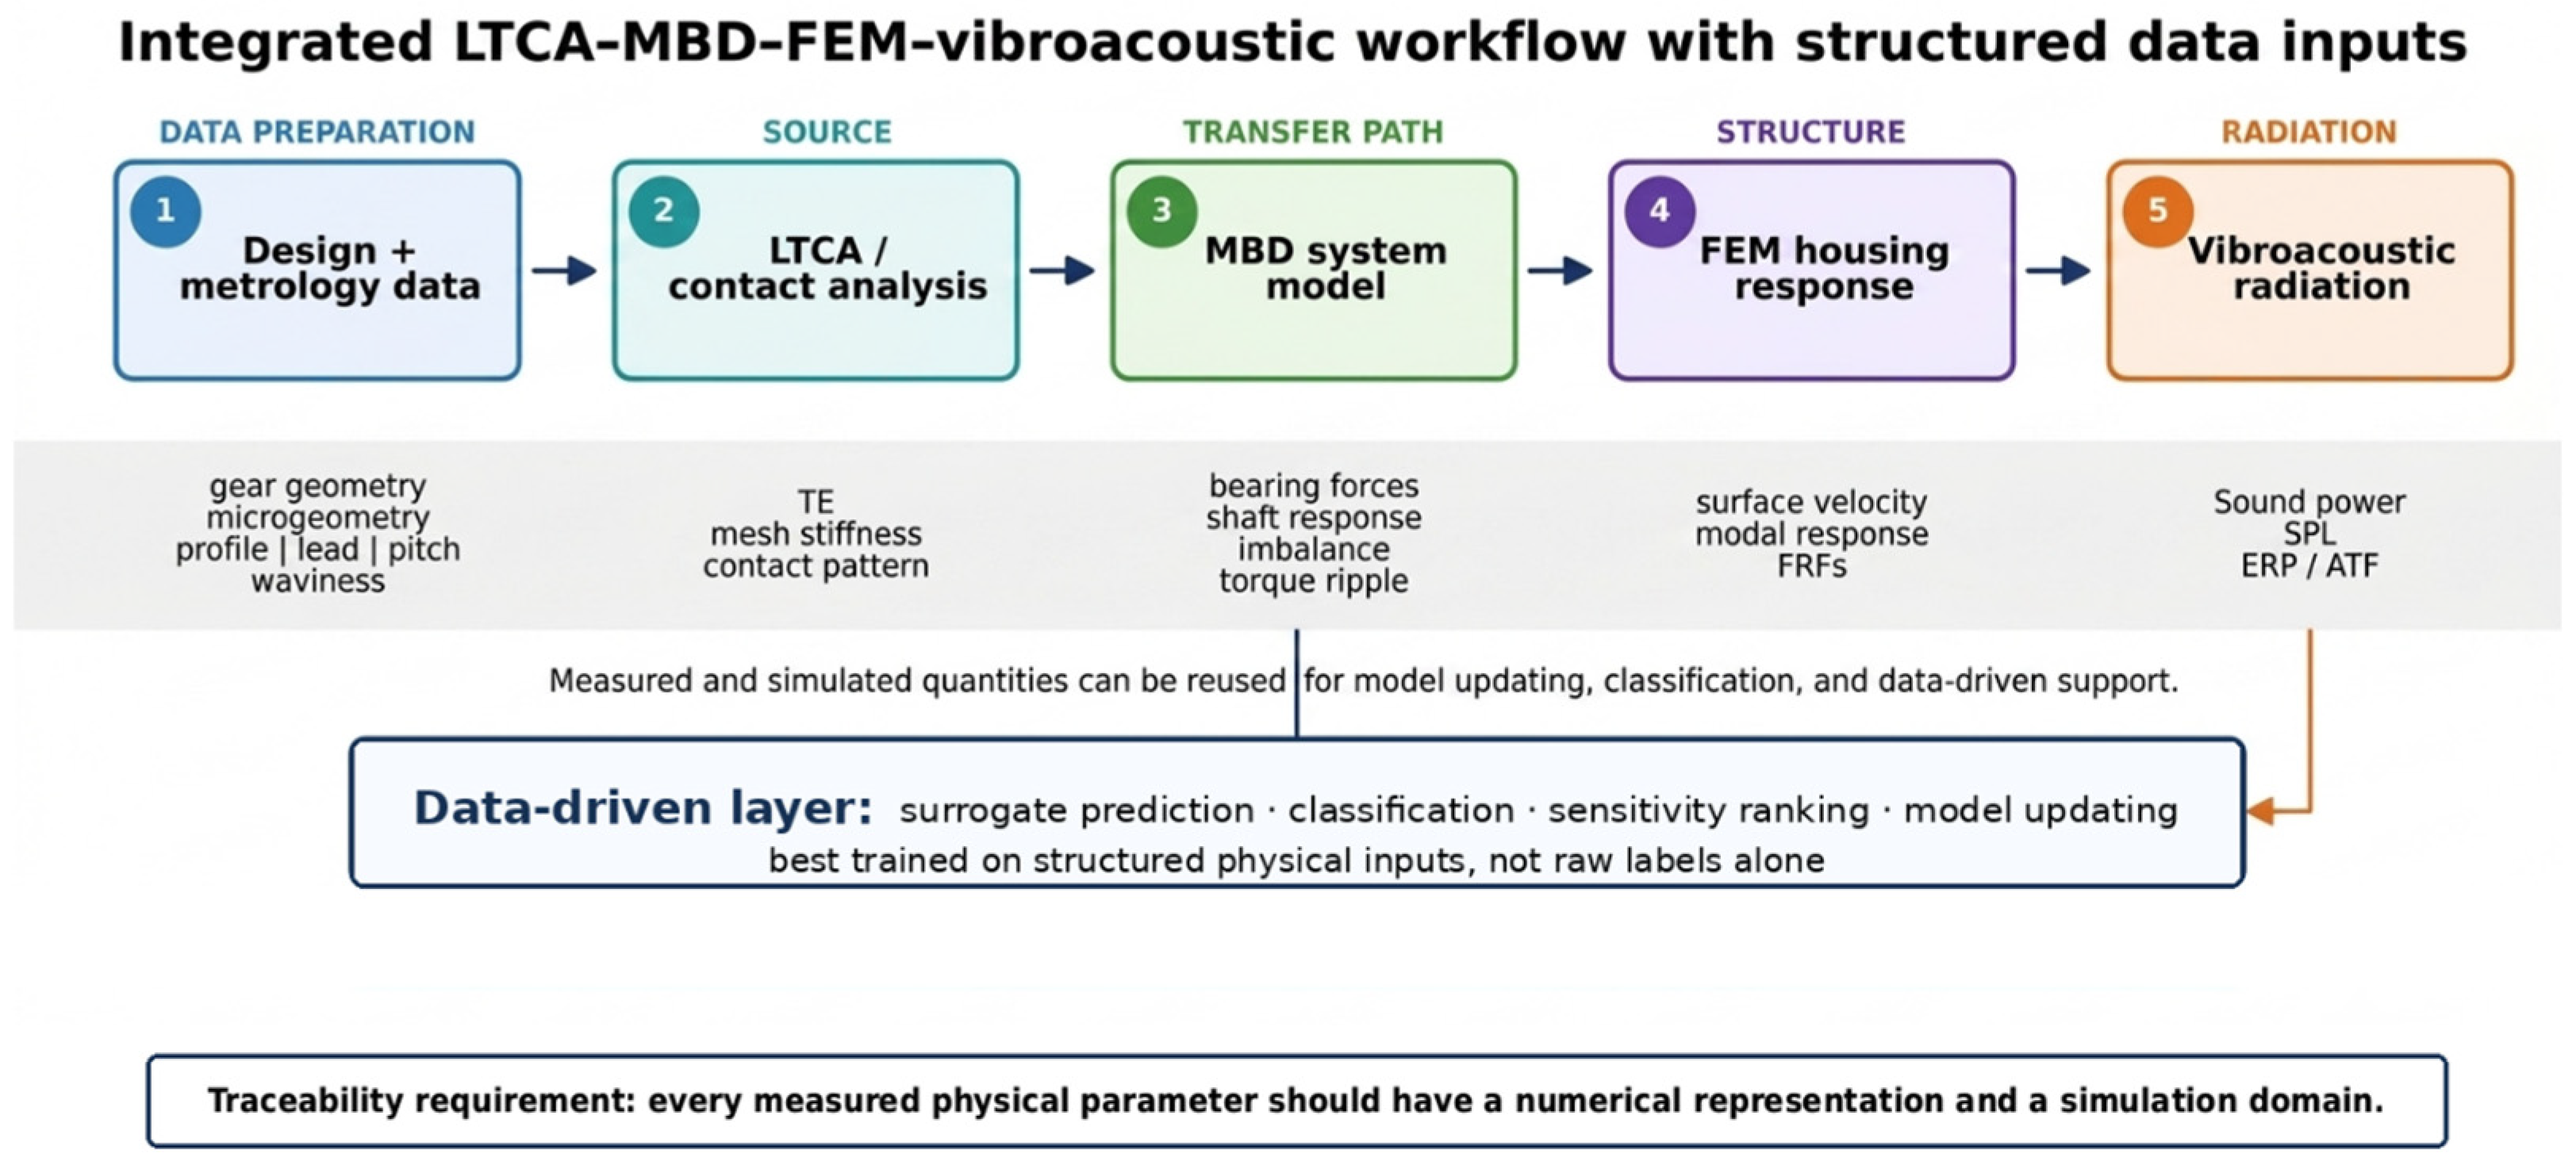
The parameter framework becomes operational only when physical data are transferred consistently into numerical models and challenged by measurements at the appropriate stage. A complete EV gearbox workflow may involve LTCA, MBD, structural finite-element analysis, and vibroacoustic simulation. Each stage consumes different inputs and produces different intermediate quantities. Agreement at the final receiver therefore does not demonstrate that all upstream model stages are correct.
A traceable workflow should preserve the relationship among the physical parameter or measured state, its numerical representation, the solver in which it acts, the quantity transferred to the following stage, the measurement used to validate its effect, and the uncertainty introduced during measurement and transformation. The complete measurement-to-simulation and validation workflow is shown in
Figure 6.
5.1. Measurement-to-Model Data Transfer
Physical inputs may originate from the design definitions, component metrology, assembly records, supplier data, balancing records, thermal measurements, modal tests, end-of-line measurements, and durability inspections. Before use in a solver, these data must be converted into numerical forms, including flank-surface correction fields, tooth-indexed position vectors, eccentricity vectors, spatial harmonic topography descriptions, coordinate translations and rotations, nonlinear clearances, bearing equilibrium states, flexible-body representations, harmonic torque maps, spatial housing-property fields, interface load vectors, and acoustic boundary conditions.
The transformation should preserve units, coordinate systems, sign and rotation conventions, phase reference, component identity, the operating and thermal state, filtering and interpolation, and uncertainty. A force of the correct magnitude may produce an incorrect housing response when applied at the wrong reference point or direction. A measured flank map can be represented incorrectly when intended microgeometry is removed or added twice. A complete cross-domain mapping of the principal physical parameters to LTCA, MBD, FEM, vibroacoustic, and data-driven representations is provided in
Supplementary Table S10.
5.2. Contact and Source Modeling
LTCA is the principal stage at which nominal geometry, intended modifications, manufacturing deviations, alignment, torque, and temperature are converted into gear-contact quantities. Outputs include the geometric and loaded transmission error, contact pattern, face-load distribution, contact pressure, root load, time-varying mesh stiffness, and tooth-pair load sharing. The required input form depends on the target output: scalar deviations may support screening, whereas a measured flank field is required for contact redistribution or tooth-specific excitation.
Direct validation may use the loaded transmission error, single-flank measurements, contact pattern, tooth-root strain, and load-dependent mesh-order response. Comparisons should use matched torque, flank side, temperature, alignment, and reference position. Agreement at one torque should not be treated as universal validation because microgeometry, support deformation, and contact ratio are load-dependent.
5.3. Multibody and Interface-Force Modeling
The MBD stage transfers contact excitation through the rotating system. LTCA information may enter as precomputed transmission error, time-varying mesh stiffness, tooth-dependent lookup tables, equivalent force histories, or integrated contact definitions. Principal outputs include the dynamic mesh force, shaft displacement, bearing reaction force, interface force and moment, torsional response, and operational order amplitudes.
Bearing-force output should retain the reference point, coordinate system, force and moment components, phase, sign convention, and operating state, matching the structural-model interface. Validation may use the shaft motion, torsional response, torque, bearing or interface forces, bearing-seat acceleration, critical-speed location, and order amplitude and phase. When interface forces are identified indirectly, transfer functions, regularization, conditioning, frequency resolution, and uncertainty should be documented.
5.4. Structural and Vibroacoustic Modeling
The structural stage maps interface forces into housing deformation, acceleration, and surface-normal velocity. Inputs include geometry and thickness, material properties, bearing-seat coordinates, joint and mount definitions, damping, and interface loads. Numerical verification should include mesh convergence, mass and inertia checks, modal truncation, interface-node checks, force equilibrium, and coordinate transformation.
Structural validation should preferably proceed in two steps. First, the unforced or experimentally excited structure is evaluated using modal and FRF data. Second, the operational response is compared using calculated or identified interface forces. Test-based updating may improve uncertain housing, joint, mount, or damping parameters, but adjusted values should remain physically defensible and be checked against independent modes, receiver locations, or operating conditions [
40].
The acoustic stage converts structural motion into ERP, SPL, intensity, sound power, and directivity. The receiver position, test environment, radiation surface, acoustic boundary conditions, bandwidth, and reference quantities should be matched between simulation and experiment. The alternative model-form fidelity levels, their additional data requirements, and the corresponding verification outputs are summarized in
Supplementary Table S9.
5.5. Verification, Calibration, Validation, and Prediction
Verification determines whether numerical equations and data exchange have been implemented correctly, including convergence, equilibrium, coordinate, and modal-truncation checks.
Calibration adjusts uncertain parameters using measured data, for example damping, joint stiffness, mount properties, or support parameters.
Validation compares the calibrated or independently specified model with measurements not used directly to determine adjusted parameters.
Prediction evaluates performance in the intended operating, design, or population domain using data excluded from model development.
A model should not be called validated when final SPL is matched by unrestricted damping adjustment, the same FRF is used both to identify and assess a parameter, the same units are used for training and testing, or unexplained correction factors absorb upstream discrepancies. The description should identify calibrated parameters, prior ranges, identification data, validation data, remaining discrepancy, and the supported prediction domain.
5.6. Stage-Specific Validation Matrix
Table 4 links each model stage to its numerical and measured outputs, comparison metrics, challenged parameters, and supported interpretation.
Universal numerical acceptance limits are not proposed because acceptable error depends on the target quantity, measurement uncertainty, frequency range, and engineering decision.
5.7. Sensitivity, Uncertainty, and Hybrid Models
Sensitivity analysis determines which parameters influence the output; uncertainty analysis estimates the resulting range or distribution. A parameter may have high sensitivity but low physical variability or low sensitivity but substantial production scatter. Level 1 may use assumed or tolerance-based distributions, whereas Level 3 requires measured or defensible distributions, covariance, batch effects, and held-out validation units. Independent sampling may be inappropriate when shim selection compensates housing dimensions, preload depends jointly on fits and spacers, pitch and waviness share a manufacturing source, temperature depends on torque and speed, or housing-thickness regions are spatially correlated.
Hybrid and data-driven methods can reduce the cost of repeated LTCA, MBD, finite-element, or acoustic calculations [
41,
42]. Applications include surrogate transmission-error prediction, rapid bearing-force evaluation, housing-response models, and production-risk classification. A surrogate trained primarily on simulation data inherits assumptions of the parent model and should be validated against both the detailed model and independent physical measurements, with explicit training, validation, and held-out partitions.
6. Quantitative Evidence and Closed-Loop Interpretation
The framework should be examined against studies that connect physical inputs, numerical representations, measured outputs, and quantitative validation. No single publication identified in the review demonstrates the complete chain from measured manufacturing geometry through LTCA, MBD, structural response, acoustic radiation, and production-population prediction. Evidence is therefore presented as two complementary cases: experimentally validated elastic multibody modeling and measured manufacturing-data-based gear-whine prediction. Their integration is a framework interpretation rather than a new experimental result.
6.1. Experimentally Validated Elastic Multibody Modeling
Wischmann et al. evaluated alternative elastic multibody representations of gear-mesh excitation using quasi-static and dynamic measurements on a helical gear stage [
43]. The program included three gear-body configurations, operating torques between 25 and 300 Nm, relative angular acceleration, the bearing-seat and radiating-surface response, and airborne noise measurements.
Reducing torque from 300 to 25 Nm shifted a dominant natural frequency by approximately 1200 Hz and increased the measured response by approximately 6 dB. The investigated variants predicted principal natural frequencies within approximately 11%, but their higher-order response differed substantially. A representation using numerically pre-calculated mesh-stiffness arrays reproduced higher excitation orders more accurately and reduced modeling error by up to approximately 10 dB. At 25 Nm, it was also the only investigated formulation that reproduced critical resonances associated with the third to fifth mesh-excitation orders.
Within the present framework, the study provides Level 2 evidence because the numerical model was challenged using matched quasi-static and dynamic measurements and because alternative model forms were discriminated quantitatively. It does not establish Level 3 readiness because production distributions and held-out production units were not evaluated.
6.2. Manufacturing-Data-Based Gear-Whine Prediction
Lee and Park developed machine-learning models using measured gear-tooth inspection variables and transmission-noise measurements obtained under controlled semi-anechoic conditions [
44]. The workflow included data cleaning and feature engineering, LASSO-based variable selection, separate training and testing, cross-validation, and a comparison of ordinary least squares, decision trees, random forest, gradient boosting, XGBoost, and LightGBM.
Across the investigated positive- and negative-torque conditions, nonlinear models outperformed the linear baseline. The published results indicate coefficients of determination of approximately 0.93–0.99 for the stronger machine-learning models, compared with approximately 0.56–0.79 for ordinary least squares. Depending on the algorithm and condition, prediction-error reduction relative to the linear baseline was approximately 35–80%, with the best overall results generally associated with XGBoost.
The findings show that measured gear-inspection data contain information relevant to the acoustic gear-whine response and that nonlinear models can recover relationships not represented adequately by linear regression. The study supports measurement-based data-driven evidence and a step toward Level 3, but it does not establish complete production covariance, independent production-lot generalization, or a full physical source-to-receiver model.
6.3. Closed-Loop Interpretation
The physical simulation study identifies the numerical representation required to reproduce the contact-related and structural–dynamic response. The data-driven study demonstrates that measured manufacturing variables can support the quantitative prediction of acoustic outcomes. A combined engineering loop may contain the component and assembly measurement, contact and system simulation, stage-specific validation; linkage of component identity to NVH results, data-driven identification of influential variables, physical interpretation and refinement, implementation of a design or manufacturing modification, and confirmation on new units or operating states. The final confirmation is essential: statistical feature importance or agreement on calibration units does not establish that modifying the identified variable will produce the expected acoustic improvement.
6.4. Supported and Unsupported Claims
The evidence supports three conclusions. Model-form selection can materially change simulation-to-measurement agreement, measured manufacturing variables can support useful gear-whine prediction, and physics-based and data-driven models are complementary. It does not establish complete validation of every LTCA–MBD–FEM–acoustic stage, universal transfer to other architectures, population prediction outside the sampled domain, causality from feature importance alone, successful corrective action without testing modified components, or lifetime prediction without degradation evidence.
Table 5 compares the quantitative evidence, readiness interpretation, and principal limitations of the two studies and the present framework synthesis.
7. Discussion and Limitations
7.1. Scientific Contribution
The central question was which physical inputs, numerical representations, and validation evidence are required before an EV gearbox NVH model can credibly represent an as-built unit or a population. The results indicate that four conditions must be distinguished: a parameter is physically relevant; the corresponding information is available or measurable; the information is translated traceably into the model; and the modeled effect is challenged by an output sensitive to that mechanism.
These conditions are frequently conflated. A manufacturing parameter may be measured but absent from the simulation. A numerical parameter may be adjustable but lack a physical counterpart. A final receiver response may agree with measurement even when source or transfer-path representation is incorrect. Conversely, a physically detailed model may remain weakly identifiable when available measurements cannot distinguish its uncertain inputs.
The principal contribution is not the identification of individual parameters in isolation. Transmission error, mesh-stiffness variation, bearing-force transmission, housing dynamics, and acoustic radiation are established topics [
1,
6,
7,
10,
11,
12,
13]. The contribution lies in connecting these mechanisms to realistic manufacturing, assembly, and operating data; explicit physical-to-numerical transformations; readiness gates; stage-specific validation quantities; and limits on supported claims. The framework therefore acts as a model-planning and claim-control structure.
A second contribution is the separation of simulation readiness from model-form fidelity. Numerical fidelity describes mathematical representation, whereas readiness describes the traceability of physical inputs, implementation, and supporting evidence. A detailed nonlinear bearing, flexible gear, or coupled acoustic model may remain Level 0 when inputs are nominal; a reduced model may reach Level 2 when it represents a specific unit and is independently validated.
7.2. Engineering Implications
The minimum useful dataset generally extends beyond nominal gear geometry. Depending on the mechanism, representative modeling may require the manufactured flank geometry, pitch and runout, assembly alignment, backlash, bearing preload or clearance, directional support stiffness, rotor and shaft properties, motor-side excitation, housing dynamics, temperature, lubricant condition, and degradation state. This does not imply that every model should include every parameter. Selection should depend on the target order and frequency range, architecture, operating and thermal state, measured spectral signature, sensitivity and uncertainty, available validation measurements, and intended decision.
The four readiness levels support progressive development. Level 0 supports concept comparison and screening, Level 1 supports tolerance and robustness studies, Level 2 supports as-built correlation and diagnosis, and Level 3 supports conditional population prediction when measured distributions, dependencies, and held-out units are available.
This progression emphasizes data lineage. Gear metrology, assembly records, balancing data, thermal measurements, modal tests, and acoustic results are often stored separately. Variability-aware modeling requires these records to remain linked to the same physical components and assemblies. Without persistent identity, apparent production correlations may reflect data-linkage errors. The framework can therefore serve as a common data-request structure for design, manufacturing, metrology, assembly, test, and simulation teams.
7.3. Interpretation of the Quantitative Evidence
The elastic multibody study demonstrated that alternative gear-mesh representations can produce materially different agreement with a measured higher-order response [
43]. The machine-learning study demonstrated that measured gear-inspection variables can support the quantitative prediction of gear-whine responses and that nonlinear methods may outperform a conventional linear model [
44]. These approaches are complementary: physics-based models support mechanism interpretation and controlled extrapolation, while data-driven models capture nonlinear relationships in measured manufacturing and test data.
Their combined discussion does not constitute one experimentally validated full-chain study. Predictive association does not prove causality; feature importance does not establish that changing a feature will produce acoustic improvement; performance within one dataset does not guarantee transfer to another design, process, housing, bearing arrangement, operating map, or test environment; and production-level generalization requires units or lots excluded from feature selection, calibration, and training. The examples demonstrate feasibility rather than universal Level 3 readiness.
7.4. Limitations of the Review
This study is a structured narrative review and framework-development effort rather than a prospectively registered systematic review or meta-analysis. Information sources, search blocks, eligibility criteria, extraction structure, and audit trail are documented, but retrospective hit and exclusion counts were not reconstructed as a PRISMA flow. The evidence base may be influenced by terminology differences across disciplines, unequal indexing, limited access to proprietary industrial studies, publication bias, and expert judgment during synthesis. The priority categories should therefore be interpreted as structured engineering guidance rather than statistically derived universal rankings.
Evidence is uneven across parameter domains. Nominal geometry, transmission error, bearing support, modal behavior, and acoustic radiation have extensive literature, whereas full tooth-resolved topography distributions, assembled bearing-state variability, production covariance, and manufacturing-to-acoustic linkage are less widely documented. An advanced parameter may thus be physically important but supported by fewer accessible studies because measurement is costly or industrially confidential.
7.5. Limitations of Model Validation
Most studies validate only part of the chain: transmission error without bearing forces, bearing forces without radiation, housing modes without operational excitation, SPL without source-side quantities, or production prediction without a physics-based model. Combining such evidence is necessary for framework construction but does not replace a benchmark in which principal inputs and intermediate outputs are measured on the same units.
Parameter identifiability is another limitation. Profile modification and shaft alignment, shim thickness and bearing stiffness, pitch error and runout, housing thickness and damping, or torque and temperature may produce similar response changes. Stage-specific measurements reduce ambiguity but cannot eliminate it when sensors lack independent information.
Measurement uncertainty must be separated from true production variation. The gear topography, alignment, backlash, bearing state, wall thickness, vibration, indirectly identified force, and acoustic quantities all contain repeatability and processing uncertainty. At an increasing frequency, prediction also becomes more sensitive to local geometry, contacts, damping, modal truncation, mesh resolution, acoustic boundaries, and receiver-position uncertainty. A model may still provide useful order trends or design rankings when exact narrowband levels are not achievable, but the supported claim should reflect that limitation.
7.6. Appropriate Use of the Framework
The framework should be used to define which physical gearbox or population is represented, which inputs are required, how those inputs enter the model, which outputs are calibrated or validated, which uncertainties remain, and which claims the evidence supports. It should not be interpreted as a guarantee of accuracy merely because every parameter domain has been considered. Terms such as high fidelity, digital twin, or artificial-intelligence-based do not constitute validation evidence; readiness should communicate the evidential state of the model, not its technological appearance.
8. Future Research Prospects
Future progress toward measurement-based and variability-aware EV gearbox prediction will require advances in both modeling and engineering data infrastructure. Increasing solver detail alone will not resolve the principal limitations identified in this review.
8.1. Autonomous Operating-State Recognition
Future systems should identify active states automatically from synchronized rotational, control, thermal, vibration, acoustic, and electrical data. Relevant scenarios include steady drive, regeneration, low torque, torque reversal, run-up and coast-down, warm-up, stabilized warm operation, running-in, and degradation. The recognized state should provide physically meaningful inputs such as the signed torque, selected flank, temperature, backlash regime, bearing-support condition, acceleration rate, and motor-control state. Classification uncertainty should be propagated rather than forcing deterministic switching when evidence is ambiguous.
8.2. Readiness-Aware Digital Twins
An NVH digital twin should represent the evolving physical state of a specific unit rather than a nominal model connected to live data. A useful state may include the manufactured gear geometry, assembly alignment, bearing preload or clearance, rotor imbalance, housing modal properties, temperature, lubricant state, backlash, accumulated duty cycle, and degradation indicators. Future research should distinguish directly measured states, indirectly identified parameters, supplier-based inputs, calibrated properties, and model discrepancy. State observability is critical: unobservable parameters should remain bounded uncertainties rather than apparently precise fitted values.
8.3. Physics-Informed and Hybrid Surrogates
Detailed LTCA, nonlinear MBD, structural FEM, and acoustic calculations may be too expensive for production-scale uncertainty propagation or continuous digital-twin use. Hybrid and surrogate approaches [
41,
42] could support rapid transmission-error prediction, bearing-force evaluation, reduced housing response, acoustic prediction, production-risk classification, and inverse identification. Surrogates should preserve relevant physical constraints and be validated against both the parent model and independent measurements. A defensible route is to develop and validate a Level 2 physical model, generate structured numerical data, train a reduced model, validate it physically, and assess uncertainty and extrapolation explicitly.
8.4. Manufacturing-to-NVH Data Lineage
Level 3 modeling requires persistent linkage among individual gears, shafts, rotors, bearings, housings, assembly settings, and NVH results. Future data systems should retain the component identifiers, timestamps, machine and process identifiers, coordinates, processing history, calibration status, assembly genealogy, operating and degradation state, model version, and measurement uncertainty. Scalar quality grades alone may not preserve the information needed for future physical or data-driven analysis; tooth-indexed vectors, traces, topography descriptors, and spatial fields should be retained when their expected value justifies the effort.
8.5. Open Benchmark Datasets
The field lacks openly available benchmarks linking the manufacturing measurements, assembly state, numerical models, structural response, and acoustic output for the same units. A staged benchmark could contain the contact-level geometry, alignment, torque, contact pattern, and transmission error; dynamic-system shaft and bearing definitions, interface forces, and seat response; structural-acoustic housing models, FRFs, surface velocity, SPL, intensity, and sound power; and population-level multi-unit data with held-out validation units. Repeat measurements are needed to separate measurement-system variation from unit-to-unit variation.
8.6. Standardized Readiness Reporting
Future publications should report the intended claim, represented unit or population, source and status of each principal input, calibration and validation data, held-out points or units, measurement uncertainty, supported readiness level, and extrapolation limits. Level 3 studies should additionally define the population, measured distributions, covariance, batch effects, and prediction-interval performance. This would reduce ambiguous descriptions such as validated high-fidelity model when evidence consists only of nominal inputs and one calibrated output.
8.7. Autonomous Corrective-Action Loops
The long-term objective is not only autonomous prediction but physically interpretable corrective action. A complete loop should detect an anomalous response, recognize the state, compare it with the expected distribution, rank plausible physical causes, request additional measurements when necessary, update the model, propose a design, manufacturing, assembly, or control modification, and confirm that modification on new units. Success should be evaluated through root-cause accuracy, uncertainty, corrective-action success rate, and performance on unseen units rather than prediction accuracy alone.
8.8. Priority Research Questions
Which minimum measurements make influential gearbox-model parameters observable?
How can manufacturing, assembly, operating, and acoustic data be linked without losing component identity?
How should measurement uncertainty, model discrepancy, and true production variation be separated?
Which reduced representations preserve the NVH-relevant information of full flank and housing measurements?
How can physics-based and data-driven models be validated jointly on the same physical units?
Which evidence is sufficient to extend a Level 2 unit model to a Level 3 population claim?
How should digital-twin states be updated when operating condition and degradation change simultaneously?
Can adaptive multi-fidelity workflows provide reliable production decisions at substantially reduced computational cost?
9. Conclusions
This review examined which physical inputs, numerical representations, and validation evidence are required before an EV gearbox NVH model can credibly represent an as-built unit or a variable production population. Representative prediction cannot be defined by solver complexity alone. It depends on whether the modeled physical state is identified, whether relevant measurements are transferred traceably into the numerical workflow, and whether each stage is challenged by an output sensitive to the modeled mechanism.
The proposed framework connects the physical origin, role in the excitation–transfer–response–radiation chain, numerical representation, and evidence supporting the model claim. Four simulation-readiness levels were defined. Level 0 represents the nominal design, Level 1 introduces bounded deviations or assumed distributions, Level 2 represents a specific manufactured unit using measured or identified inputs and matched validation, and Level 3 extends traceability to multiple units through measured distributions, dependencies, and held-out population validation.
Transition between levels is governed by evidence rather than the addition of numerical detail. A nonlinear bearing model, measured flank field, flexible housing, or coupled acoustic solver does not independently increase readiness. Stronger claims require stronger input traceability, explicit physical-to-numerical mapping, and validation appropriate to the intended output.
The relevant input set generally extends beyond nominal gear geometry. Depending on the mechanism, representative prediction may require manufactured flank deviations, pitch and runout, assembly alignment, backlash, bearing state, shaft and rotor properties, motor-side excitation, housing and joint behavior, temperature, lubricant state, and degradation. These inputs should not be introduced indiscriminately; their priority depends on causal relevance, sensitivity, measurability, identifiability, architecture, operating state, and purpose.
A central requirement is the explicit transformation of measurements into solver-compatible quantities. Units, coordinate systems, datum definitions, phase, component identity, filtering, operating condition, and uncertainty must remain traceable across LTCA, MBD, structural FEM, and vibroacoustic models. Validation should proceed from source toward receiver. Transmission error and contact patterns challenge the excitation model; shaft motion and bearing forces challenge the rotating system; modes, FRFs, acceleration, and surface velocity challenge the structural model; and ERP, SPL, intensity, and sound power challenge different aspects of radiation. Agreement with one final microphone value cannot independently validate every preceding stage.
The quantitative evidence confirms that model-form selection can materially affect simulation-to-measurement agreement and that measured manufacturing variables can support useful nonlinear prediction of the gear-whine response. However, few studies validate the manufacturing data, contact behavior, interface forces, housing response, acoustic radiation, and population variability for the same units. The framework identifies the evidence required for such a complete closed loop without claiming that it has already been demonstrated universally.
The framework should therefore be used as a model-planning, experiment-design, data-integration, and claim-control tool. Future progress will depend on the data lineage, autonomous state recognition, uncertainty separation, multi-unit validation, open benchmarks, and readiness-aware reporting as much as on higher numerical fidelity. The strongest model is not necessarily the most detailed one; it is the model whose inputs, numerical representations, validation evidence, and permitted claims are mutually consistent.