Article

Assessing Lithium-Ion Battery Aging in Urban Electric Buses Through Rainflow-Based Cycle Counting

by
Marco A. M. Ferreira
1,
Paulo G. Pereirinha
1,2,* and
João Pedro F. Trovão
1,2,3
1
Coimbra Institute of Engineering, Polytechnic Institute of Coimbra, Rua Pedro Nunes, Quinta da Nora, 3030-199 Coimbra, Portugal
2
Institute for Systems and Computer Engineering at Coimbra (INESCC), DEEC, Rua Sílvio Lima, Pólo II, 3030-790 Coimbra, Portugal
3
e-TESC Lab, Université de Sherbrooke, 2500, Boul. de l’Université, Sherbrooke, QC J1K 2R1, Canada
*
Author to whom correspondence should be addressed.
World Electr. Veh. J. 2026, 17(5), 245; https://doi.org/10.3390/wevj17050245
Submission received: 23 February 2026 / Revised: 10 April 2026 / Accepted: 20 April 2026 / Published: 3 May 2026

Abstract

This study assesses the impact of regenerative braking on lithium-ion battery aging and operational efficiency of lithium-ion batteries in urban electric buses using a Rainflow-based cycle-counting framework. A previously developed simulation platform based on Energetic Macroscopic Representation (EMR) is employed to reproduce realistic daily driving cycles. Battery degradation is quantified by combining the Rainflow Counting Method with Miner’s Rule, enabling cumulative damage assessment across different depth of discharge (DoD) levels and regenerative braking intensities, kbr. Four representative cycling profiles—fixed 50%, 60%, and 70% DoD and a variable mixed-use scenario—were simulated under regenerative braking intensities ranging from 0% to 100%. Results indicate that regenerative braking extends average battery lifespan by approximately 0.9 years while increasing daily driving range by around 6 km. Profiles with lower DoD values, particularly when combined with moderate regenerative braking (kbr ≈ 0.3), achieved the most favourable balance between cycle induced degradation and energy recovery. Although higher DoD scenarios deliver greater mileage gains, they also accelerate capacity fade. The variable cycling profile demonstrated robust and consistent performance, highlighting the benefits of route and load variability. Additionally, lifetime mileage analysis demonstrates that intermediate DoD levels combined with regenerative braking maximize cumulative energy throughput while preserving service life. Overall, the proposed methodology offers a computationally efficient and practically applicable approach for battery life assessment under dynamic operating conditions, offering valuable insights for optimizing energy management strategies and electric bus fleet operations.

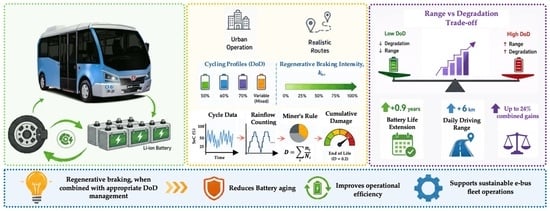
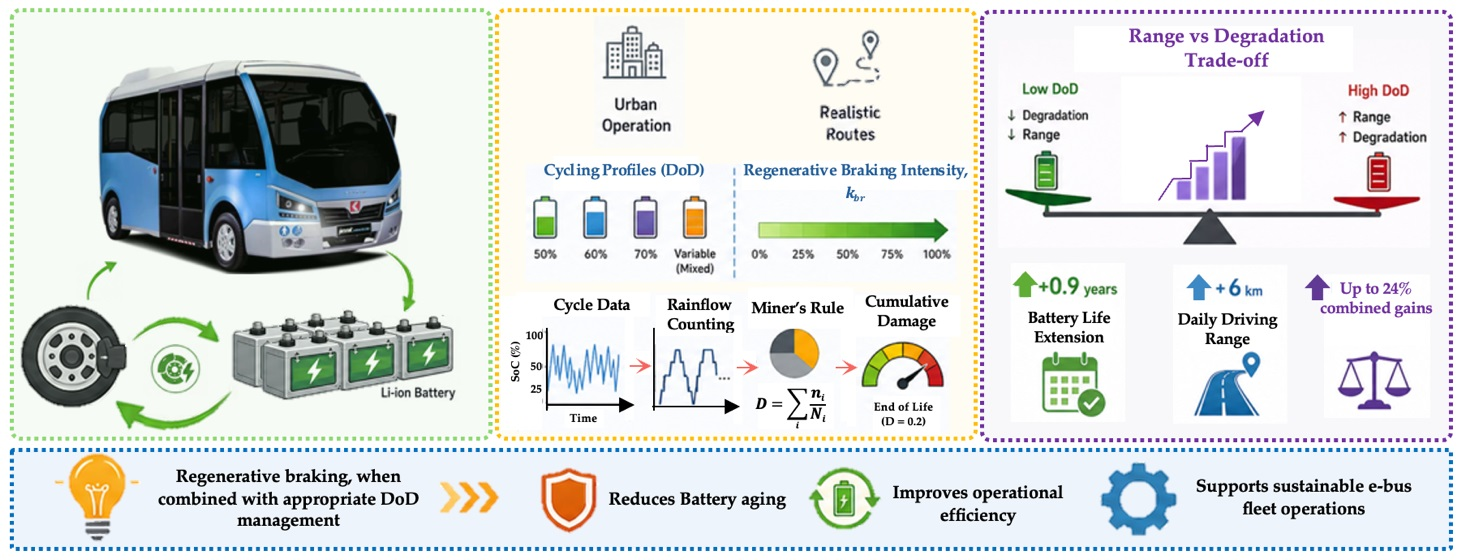
Graphical Abstract

1. Introduction

Technological advancement is progressing faster than ever. Every year, the number of electric vehicles (EVs) on roads worldwide continues to grow significantly, spanning from light vehicles and personal transport to the public transportation sector [1,2,3]. These developments have intensified the demand for battery technologies that are not only high performing, but also durable and economically viable. However, one major challenge that remains is battery degradation over time. This process, influenced by factors such as charge–discharge cycles, temperature variations, and operational conditions, leads to gradual loss of capacity and efficiency [4]. The result is a reduction in driving range, reliability, and the overall sustainability of energy storage systems.
Accurate degradation modelling is essential to predict performance loss, optimize battery management systems (BMS), and extend battery lifespan [5]. By leveraging tools such as machine learning, electrochemical modelling, and real-time monitoring, researchers can enhance reliability, reduce lifecycle costs, and improve the efficiency of energy storage systems [6,7].
Among the primary contributors to degradation is battery cycling. Repeated charge and discharge events cause material wear, electrolyte breakdown, and solid electrolyte interphase (SEI) formation, which collectively reduce battery efficiency [8]. These effects are further amplified by factors such as depth of discharge (DoD), charge rates, and temperature extremes [9,10]. As such, the accurate assessment of cycling behaviour is critical for degradation prediction.
While the literature highlights various modelling approaches, few studies have directly analysed the impact of regenerative braking on cyclic degradation under realistic driving conditions. To achieve this, the Rainflow Counting Method (RfCM) offers a robust solution. Originally developed for fatigue analysis in mechanical systems [11,12], RfCM has been adopted in some battery research due to its ability to break down irregular charge/discharge profiles into discrete cycles [13]. This allows for the identification of all stress events, from minor to major, that contribute to capacity fade. By quantifying cycle magnitudes and frequencies, RfCM supports predictive analysis and the design of usage strategies to minimize degradation [14]. The present study uses the RfCM to classify and quantify the impact of charge and discharge cycles, including both full and half-cycles, as well as those influenced by regenerative braking. The methodology explores how different cycling patterns, including deeper discharge cycles and regenerative braking effects, influence the battery’s lifespan. The analysis considers all stress events, providing a comprehensive assessment of cycling patterns.
Building upon a previously developed Energetic Macroscopic Representation (EMR)-based model of the Karsan e-Jest electric bus [15], this study introduces a semi-empirical methodology to quantify cyclic degradation. It also assesses the impact of regenerative braking on lithium-ion battery aging. In the referenced model, the battery pack is represented through its state of charge (SoC) using an SoC-dependent equivalent circuit parameterized via lookup tables [15]. The existing framework, which accurately simulates battery electrical behaviour under dynamic conditions, serves as a foundation for the present analysis.
The primary objective of this work is to develop and validate a Rainflow Counting Method (RfCM)-based approach for evaluating the influence of regenerative braking on battery cycle life in urban electric buses. This study provides insights into the combined effects of operational profiles and braking strategies on battery longevity and energy efficiency. The article is structured as follows: Section 2 reviews relevant literature on battery degradation and cycle counting techniques. Section 3 details the proposed methodology, including data processing and damage quantification. Section 4 presents and discusses the results, and Section 5 concludes with the main findings and implications for electric bus fleet management.
It is important to emphasize that the objective of this work is not to develop a high-fidelity electrochemical aging model. Instead, it aims to propose a system-level methodology capable of evaluating the impact of regenerative braking on battery lifetime using measurable signals such as State of Charge (SoC). The novelty of the proposed approach lies in the integration of a Rainflow-based cycle counting framework with an EMR-based vehicle model, enabling the direct quantification of regenerative braking effects on degradation under realistic driving conditions. By relying on manufacturer-provided degradation curves instead of detailed electrochemical modeling, the method remains computationally efficient. This makes it suitable for real-time applications, such as Battery Management Systems (BMS) or Public Transport Operator (PTO)-level monitoring in electric bus fleets.

2. Literature Review

Battery degradation significantly affects the performance and lifespan of energy storage systems, particularly in electric vehicles [16]. This multifaceted process results from the interplay of thermodynamic, physical, and chemical phenomena that gradually reduce a cell’s ability to store energy and deliver power [17]. A thorough understanding of these mechanisms is crucial for enhancing battery design, efficiency, and longevity, which are key factors influencing sustainability and economic viability. To this end, several modelling approaches have been developed, including physical, empirical, and semi-empirical methods. These aim to identify the root causes of degradation and support strategies to extend battery life under diverse usage and environmental conditions.
Research on Li-ion cell degradation remains a very dynamic field. Numerous studies have focused on quantifying and classifying the aging mechanisms involved. These models seek to identify the key drivers of degradation, including capacity loss, power fade, increased internal resistance, electrolyte deterioration, and the overall decline in the battery’s State of Health (SOH) [18,19]. SOH is a crucial indicator, as it reflects the battery’s capacity and power capability relative to its Beginning of Life (BoL). Accurate SOH prediction is fundamental for estimating End of Life (EoL) and designing control strategies that extend useful life while mitigating the impact of stress factors.
Despite considerable progress in predictive modelling, ensuring accuracy and robustness under real-world conditions remains a challenge [20]. Variables such as operating conditions, load profiles, and environmental fluctuations add complexity to the estimation of Remaining Useful Life (RUL) and EoL [18]. As such, continued improvement of these models is necessary to reduce reliance on extensive empirical testing and to support the deployment of more cost-effective and durable battery technologies. Overcoming these challenges calls for a detailed evaluation of the principal modelling approaches, their assumptions, and their applicability across different operational contexts.
Degradation in lithium-ion batteries is commonly interpreted through three fundamental mechanisms widely recognized in the literature [21]. The first is loss of lithium inventory (LLI), primarily resulting from side reactions such as the growth of the solid electrolyte interphase (SEI) [21,22,23] on the graphite anode surface, as well as lithium plating, and other parasitic processes that degrade the electrolyte. The second mechanism, loss of active material (LAM), corresponds to the reduction in usable electrode material on both cathode and anode. LAM is predominantly attributed to mechanical stresses induced during cycling, where volume expansion and contraction generate fatigue and lead to particle cracking. This structural damage compromises electrical connectivity and reduces lithium storage capacity [21,23]. Lastly, the increase in internal resistance stems from the growth of passivating layers such as SEI on electrode surfaces and the degradation of conductive pathways within the electrode’s porous structure. This rise in resistance diminishes energy efficiency and contributes to accelerated performance decline [21,23].
  • Physical Models
Physical models focus on the fundamental electrochemical and thermodynamic processes that govern battery behaviour. These approaches provide deep insights into the underlying mechanisms of degradation, offering a more mechanistic understanding of aging phenomena. However, they often require detailed knowledge of the cell’s internal structure and rely on complex numerical simulations, which makes them computationally intensive and time-consuming [22]. Typically, such models address individual degradation pathways explicitly and employ systems of differential equations to describe their evolution over time.
  • Empirical Models
Empirical models, often referred to as data-driven approaches, rely heavily on data obtained from real-world operations or controlled laboratory experiments. Rather than addressing the complexity of physical modelling, these methods offer a simplified and practical alternative [24]. They aim to capture the relationships between input variables and performance indicators through statistical techniques or machine learning algorithms [25,26]. By not requiring the modelling of underlying electrochemical processes, these models enable faster implementation and significantly lower computational cost. However, their accuracy and generalizability are highly dependent on the quality, diversity, and representativeness of the training data. This dependence may limit their effectiveness under conditions that deviate from the original dataset [27].
  • Semi-Empirical Models
This modelling approach integrates elements from both physical and empirical methods. Semi-empirical models have garnered significant attention due to their ability to provide accurate predictions while requiring less data than purely empirical models. By combining experimental data with theoretical principles, these models offer a promising solution for predicting degradation without extensive electrochemical characterization. They typically employ simplified representations of electrochemical processes alongside data-driven techniques to simulate battery behaviour. This provides a balance between accuracy, computational efficiency, and adaptability under diverse operating conditions.
Recently, machine learning-based models have been increasingly used to predict battery degradation and RUL. Approaches such as neural networks and regression techniques can capture complex nonlinear relationships, but they often require large datasets and may lack physical interpretability. To address these limitations, physics-informed and hybrid models have been developed, combining both data-driven methods with electrochemical knowledge to improve accuracy and reliability. In this context, the semi-empirical approach adopted in this work provides a balanced alternative, integrating simplified physical insights with practical modelling strategies. This enables accurate degradation estimation while maintaining computational efficiency and applicability to real-world conditions.
This brief review aims to examine the main approaches to lithium-ion battery degradation modelling. Particular emphasis is given to semi-empirical models that focus on cycling-induced aging, the core subject of the present study, as discussed in the following sections. Additionally, some works on machine learning-based models and physics-informed or hybrid approaches are briefly discussed to provide an overview of recent developments in this field. The review addresses key challenges in predicting battery life, including the need for real-world data and the complexity of applying models across varied usage scenarios and environmental conditions.

Related Works

The following related literature presents some works, its model type and focus in Table 1. Afterwards, in Table 2, for the same analyzed studies the main findings and gaps are presented.
The literature on lithium-ion (Li-ion) battery health modelling has made notable progress, but important gaps remain, particularly regarding models based on cycle counting algorithms, such as the Rainflow Counting Method. These approaches are still in the early stages of development and require further refinement to improve predictive accuracy. Nevertheless, their simplicity and low computational requirements make them highly suitable for real-time applications where resources are limited. It is important to note that lithium-ion battery degradation is influenced by multiple mechanisms, including calendar aging, temperature variations, and charge/discharge rates. However, for high-utilization applications such as urban electric buses, cycle-induced degradation is widely recognized as the dominant aging factor, particularly for LFP chemistries. While more advanced machine learning techniques exist and can capture complex nonlinear degradation patterns, they often require large datasets and significant computational resources. Therefore, this study focuses on cycling-related degradation using a Rainflow-based framework. Other effects are not explicitly modeled, as the objective is to develop a computationally efficient, system-level methodology suitable for integration with real-time monitoring systems (e.g., BMS or PTO-level analysis). These aspects will be addressed in future work.
In conclusion, although cycle counting-based models hold strong potential, they are not yet mature enough for deployment in complex, real-world scenarios. Their simplicity makes them an attractive foundation for further development. Enhancing them with additional degradation drivers will improve their predictive power, contributing to more accurate estimations of battery lifespan.

3. Materials and Methods

The proposed methodology adopts a system-level perspective, focusing on the relationship between operational conditions and battery degradation using measurable signals. To ensure computational efficiency and practical applicability, particularly for real-time monitoring and fleet-level analysis, the degradation model is intentionally simplified and based primarily on cycle-induced aging as a function of Depth of Discharge (DoD). While lithium-ion battery degradation is influenced by additional factors such as temperature effects, charge/discharge rates (C-rate), State of Charge (SoC) window, and calendar aging, these effects are not explicitly modeled in this study. This simplification is justified by the objective of evaluating the relative impact of regenerative braking under consistent operating assumptions, rather than predicting absolute lifetime with high electrochemical fidelity. Furthermore, temperature effects are not considered in this study because it is considered that the battery pack is fully cooled with temperature control within the safe operational region of the LFP cells. These aspects will be considered in future work.
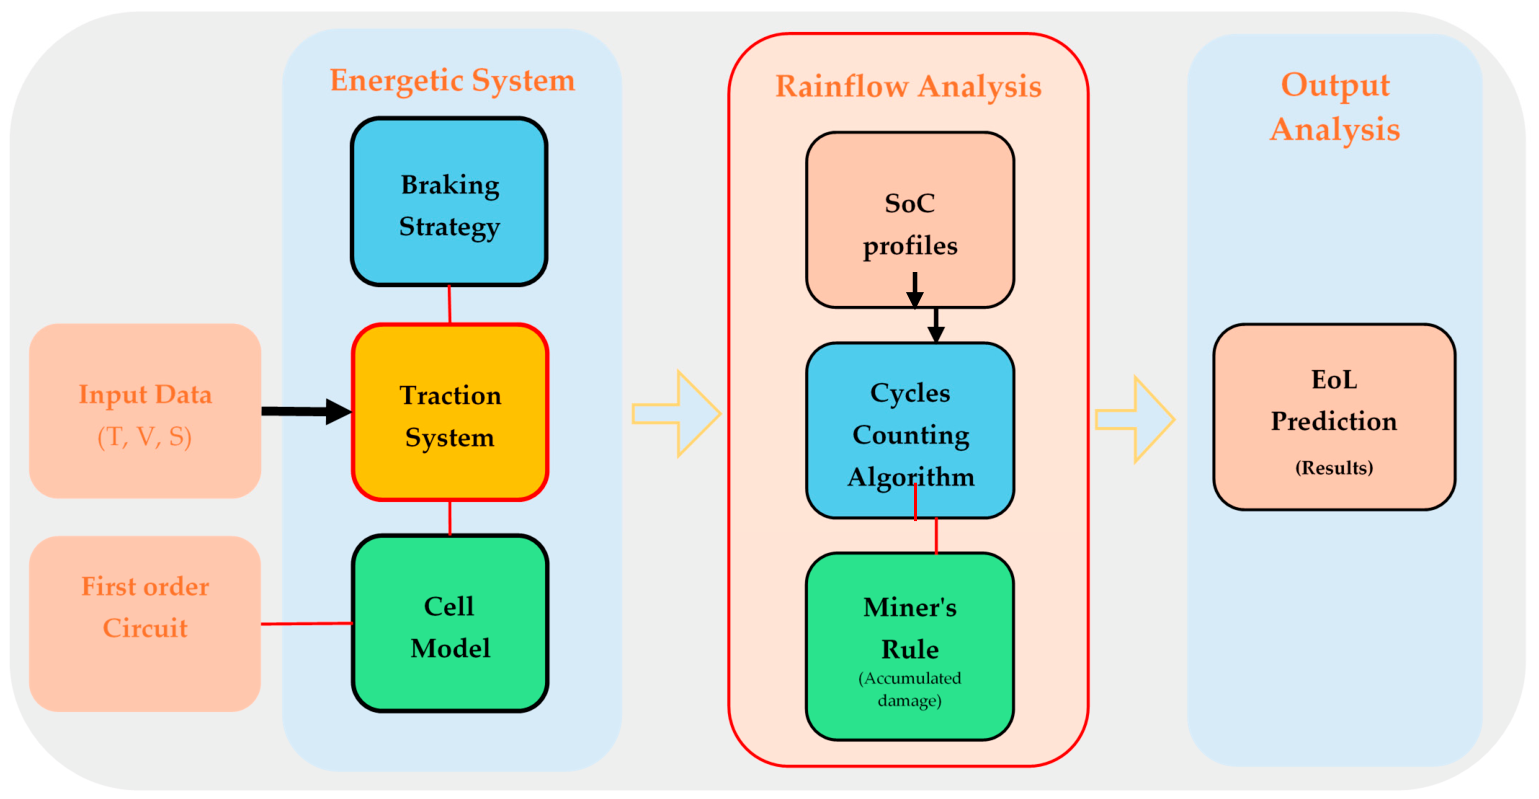
The analysis begins with the State of Charge (SoC), which captures the dynamic changes in battery cell capacity over time. The SoC data were obtained from the outputs of a previously developed Energetic Macroscopic Representation (EMR)-based model [15]. These outputs provide a reliable basis for identifying and analysing cycling behaviour. This is critical for assessing battery degradation under varying operational conditions. Figure 1 below illustrates the overall methodology, detailing the process from SoC extraction through cycle identification to degradation analysis.

3.1. Cycles Counting Algorithm

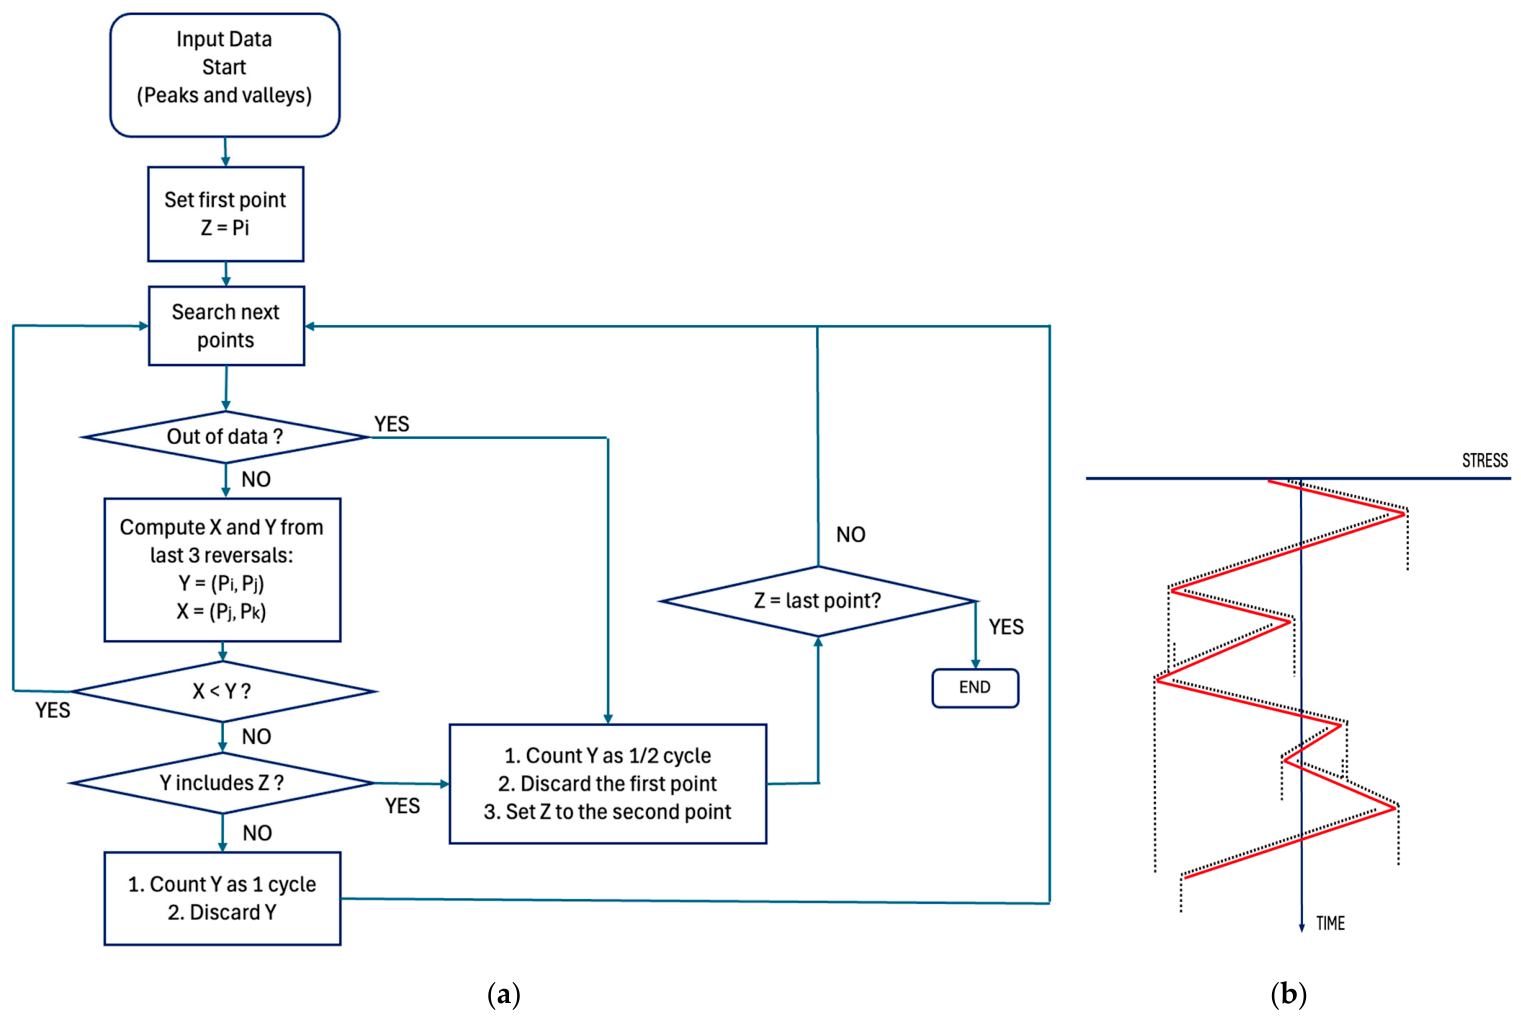
To support this study, a cycle counting algorithm based on the Rainflow method was applied. This method was originally developed by M. Matsuishi et al. and Endo T. et al. [12] and years later implemented in MATLAB (version R2024b) by A. Nieslony [40] following the ASTM standard [41]. The Rainflow Counting Method (RfCM) relies on the stable cyclic stress–strain behaviour of materials, where complete cycles form closed hysteresis loops, whereas half cycles do not. The range of a closed loop is determined by the local maxima and minima within the strain function [11]. Figure 2 illustrates the flowchart of the algorithm.
The cycle counting methodology follows these steps:
  • Start at a reversal point
    The process begins at a local peak or valley in the load-time history.
  • Simulate the rain flowing
    From that point, a virtual “rain flow” moves down the curve, similar to rain running down a sloped surface. The flow continues until it reaches a reversal with a greater magnitude or intersects another flow.
  • Stop when blocked
    The Rainflow stops when it encounters a larger reversal or another flow, preventing overlapping cycles.
  • Count full cycles
    When two reversals form a complete up-and-down (or down-and-up) shape, a full cycle is recorded, and the amplitude of the cycle is saved.
  • Re-analyze remaining points
    The remaining portion of the load history, which resembles a divergent-convergent pattern, is treated as its reverse (convergent-divergent). A second Rainflow count is then performed on this reversed sequence.
  • Sum the results
    The total number of cycles is the sum of cycles counted in both stages.
In this study, the Rainflow algorithm is applied directly to the State of Charge (SoC) time series obtained from the EMR-based vehicle simulation. This allows the identification and quantification of charge and discharge cycles under realistic driving conditions, including the additional micro-cycles induced by regenerative braking events. The resulting cycle distribution serves as the basis for subsequent degradation analysis.

3.2. Accumulated Damage: Miner’s Rule and Effect of Regenerative Braking

Following the cycle counting procedure, the next step is to address accumulated damage, which refers to the progressive degradation of the cells caused by repeated charge and discharge cycles. Accumulated damage plays a crucial role in evaluating the overall impact of cycling behaviour on battery lifespan.
The Rainflow Counting Method (RfCM) enables the identification of cycles and quantification of their magnitude. By correlating these cycles with the cell’s degradation curve, the damage contributed by each cycle or half-cycle can be determined, allowing the calculation of total accumulated damage over time. This degradation manifests as capacity loss, with each cycle imposing stress based on its Depth of Discharge (DoD). To quantify this effect, Miner’s Rule of Cumulative Damage is applied, which assumes that total damage is the sum of individual cycle contributions. According to this rule, significant degradation leading to failure occurs when the cumulative damage reaches a specific threshold, as described by Equation (1),
i = 1 k n i N i = 1 ,   f o r   l i i o n   i = 1 k n i N i 0.2
where n i is the damage caused by cycle i, N i is the total damage that cycle i can endure before failure, and k is the number of cycles.
It should be noted that Miner’s rule assumes linear damage accumulation and does not account for path dependency or nonlinear degradation effects. While lithium-ion battery aging is inherently nonlinear, this approach provides a practical approximation for system-level lifetime estimation and has been widely used in cycle-based degradation studies.
The EoL for lithium-ion cells is typically defined as the point when the cell’s nominal capacity has decreased by 20%. Accumulated damage was calculated by analysing the total number of full and half-cycles, along with their respective amplitudes. This damage was then integrated to assess its cumulative impact on capacity loss, providing a comprehensive understanding of how cycling behaviour influences long-term battery health.
In material fatigue analysis, the S-N curve is commonly used to depict the relationship between the number of cycles (N) and the applied stress amplitude (S). Similarly, a degradation curve can be applied to batteries to illustrate how cycling affects capacity over time.
This degradation curve illustrates how the Depth of Discharge (DoD) affects the number of cycles a cell can endure before reaching its End of Life (EoL). This provides valuable insights into long-term behaviour and the impact of different cycling profiles.
The number of cycles to failure follows an inverse power law with respect to DoD, underscoring DoD as a critical parameter for lifetime prediction and damage quantification under various cycling conditions.
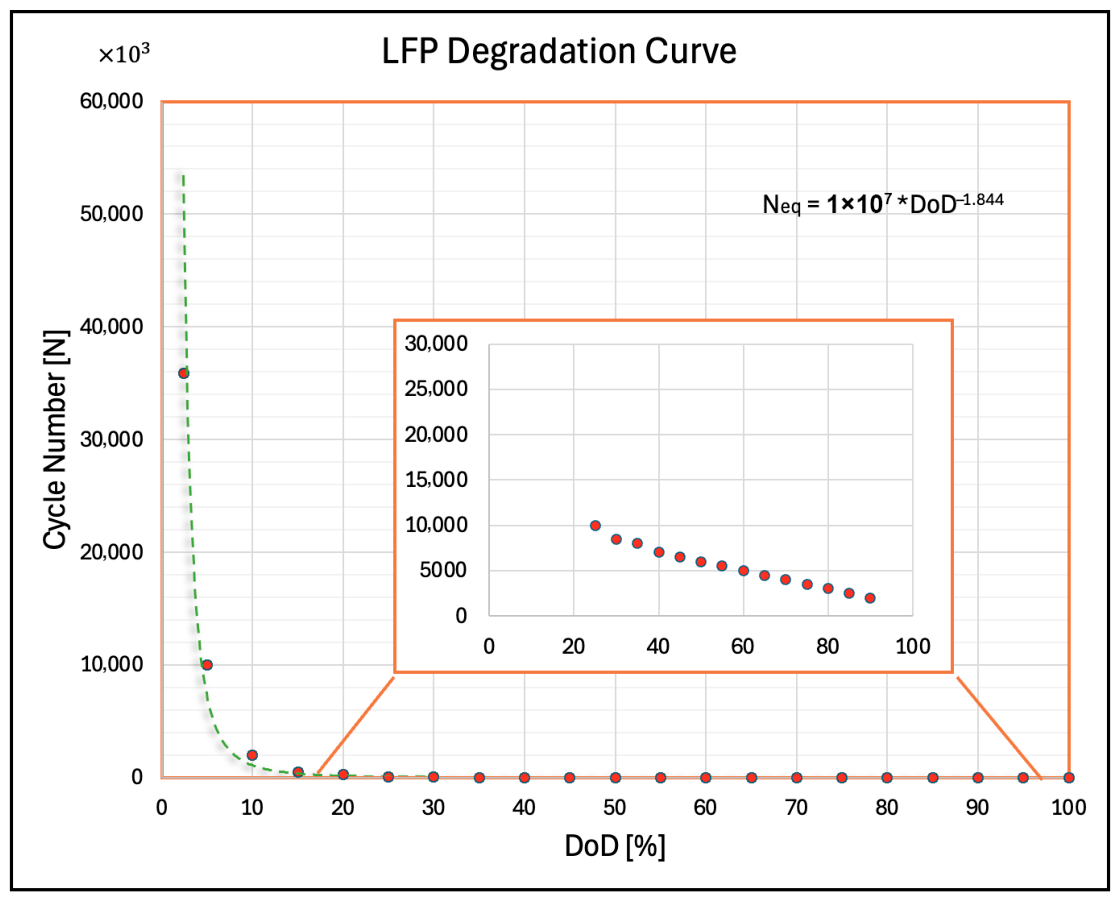
For example, as shown in Figure 3, a cell subjected to a 100% DoD followed by a full recharge completes one full cycle, which corresponds to approximately 1/2000 (i.e., 2000 cycles) of the total allowable capacity loss before reaching EoL, according to the manufacturer’s specifications. However, it is also interesting to note that, for example, a 60% DoD will allow circa 5000 partial cycles, which permits to extract more energy from the battery along its lifetime.
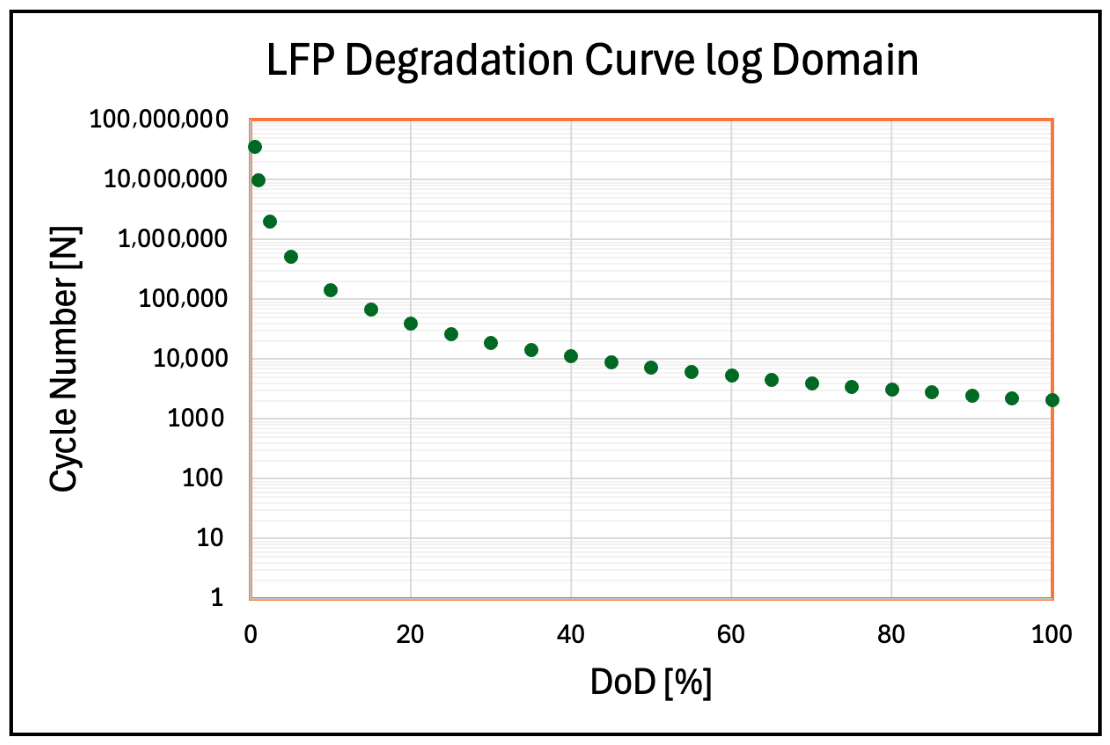
The degradation curve used in this study is derived from manufacturer datasheet values for LFP batteries, which relate Depth of Discharge (DoD) to cycle life. To ensure continuity across the full DoD range, the curve is extended using a power-law interpolation in the logarithmic domain. This approach allows the inclusion of lower-amplitude cycles induced by regenerative braking. This adjustment was essential to capture all relevant cycle amplitudes within the full DoD range.
As previously mentioned, the algorithm was implemented in a MATLAB environment. The process begins with the importation of output data from the EMR system, followed by the application of the RfCM. The resulting output array consists of three rows: detected cycle amplitudes, mean values, and occurrence frequencies. To relate each DoD value to the corresponding point on the aging curve, mathematical interpolation was applied, using Equation (2) [42]. To enhance computational efficiency and ensure accuracy during interpolation, the aging curve was first converted to the logarithmic domain, as shown in Equation (3). After interpolation, the curve was then transformed back to the linear scale for subsequent damage calculation.
y = a x b   y = a · x b   N c y c = a · D o D b
with N c y c the equivalent number of cycles, a and b fitting parameters.
log N c y c = log a + ( b ) · log D o D  
The obtained degradation curve in the logarithmic domain is presented in Figure 4.
Since a monthly analysis was considered, an annual analysis was required to predict the expected lifespan. Assuming that the driving profiles remain consistent throughout the year, the annual degradation was assessed by replicating Miner’s Rule for the entire year (Equation (4)). As mentioned earlier, and as indicated by the literature and studies on batteries, the End of Life (EoL) occurs when the capacity loss reaches 80% of the original capacity. Equation (5) was used to estimate the lifespan in years based on this assumption.
D e g y e a r [ % / y e a r ] = 100 · 12 · i = 1 k n i N i
E o L p r e d i c . y e a r s = C a p .   L o s s m a x D e g y e a r   20 % D e g y e a r
Although the proposed approach is not experimentally validated within this study, the degradation behavior is based on manufacturer data. It is consistent with trends reported in the literature, supporting its applicability for comparative and system-level analyses.

3.3. Test Scenarios

Regenerative braking is widely recognized as a key feature in electric vehicles due to its ability to recover kinetic energy and improve efficiency. However, it also introduces additional micro charge/discharge events, which may accelerate battery degradation. Therefore, different regenerative braking levels are analyzed in this study to evaluate the trade-off between energy recovery and cycle-induced aging.
This work tested four distinct cycling scenarios, each defined by a different DoD and varying levels of regenerative braking, kbr. A kbr = 0 means totally mechanical braking while a kbr = 1 signifies fully electric braking. The aim was to assess their impact on battery degradation under realistic operating conditions. These scenarios replicate typical electric vehicle usage patterns, ranging from deep to moderate discharges, and include both constant and variable cycling profiles. The analysis focused on understanding how different intensities of use and energy recovery behaviours influence battery ageing and capacity fade over time. An overview of the tested scenarios is provided below.
  • High DoD (±70% DoD): This scenario represents deep discharge cycles, where 70% of the battery’s total capacity is used in each cycle. It is designed to stress the battery and simulate frequent deep discharge conditions typical of mixed urban and extra-urban routes.
  • Medium DoD (±60% DoD): In this case, each cycle uses 60% of the battery’s capacity. Compared to the high DoD scenario, this results in reduced stress on the battery and allows the analysis of the effects of moderately shallow discharges on degradation.
  • Medium DoD (±50% DoD): Similar to the previous scenario, this profile involves 50% capacity usage per cycle. This cycling pattern closely resembles typical daily urban driving behaviour.
  • Combined Cycle: This scenario alternates between high and moderate DoD values to simulate more complex, real-world driving conditions, where the battery is subjected to varying depths of discharge depending on load and operational demands.
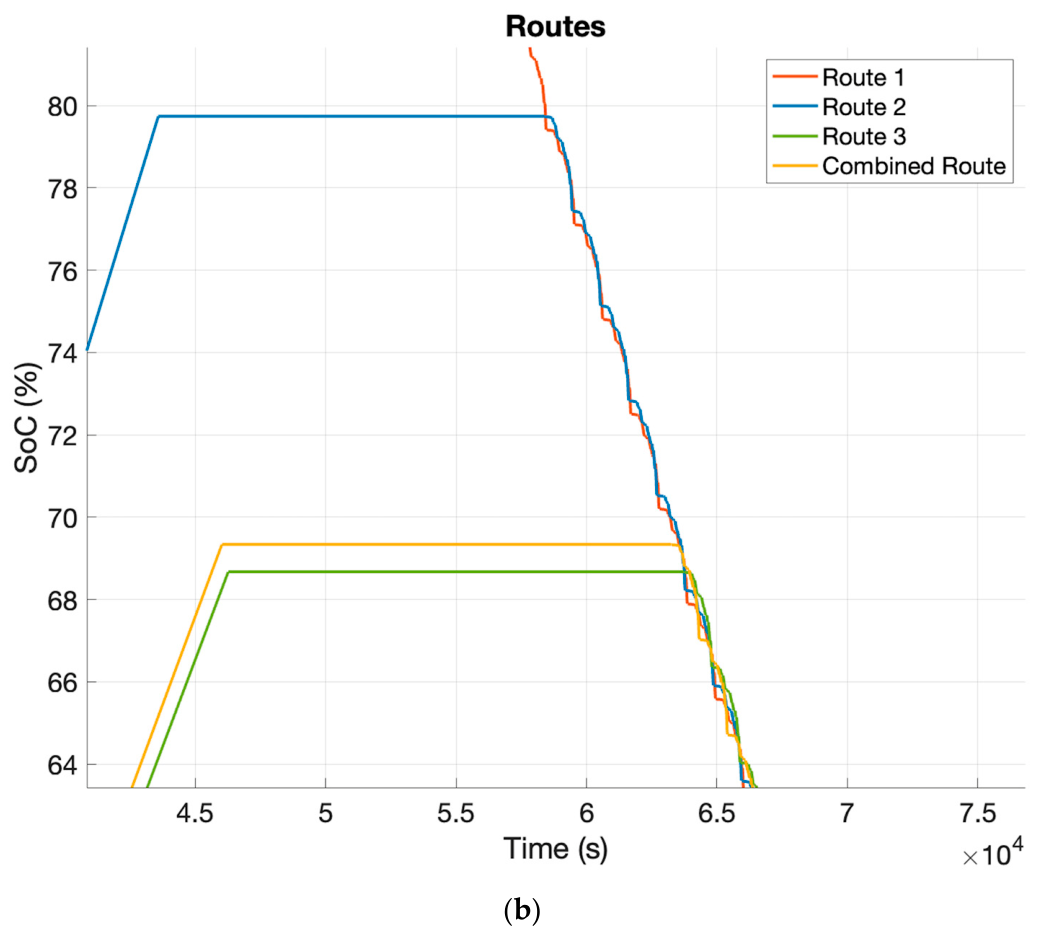
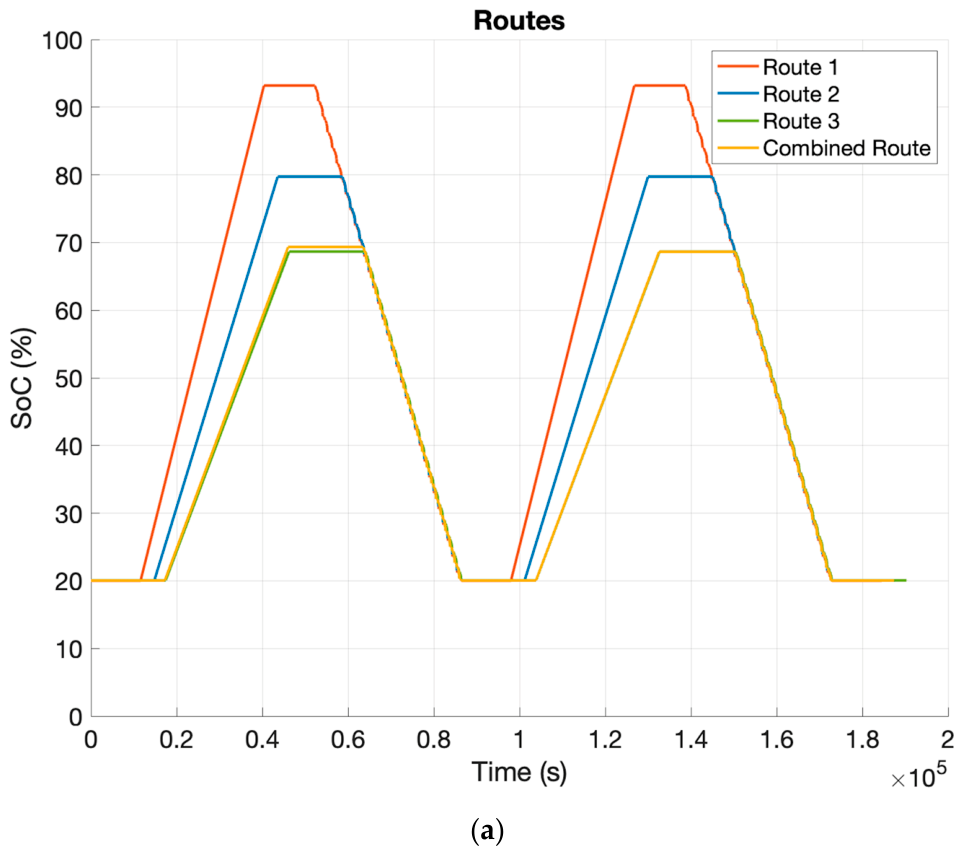
The data for the depth of discharge for the different scenarios is represented as “Routes” in Figure 5.
It is important to note that the constant-DoD scenarios simulate repeated operation on a fixed bus route over 22 consecutive days. The combined cycle represents more realistic operating conditions by alternating among 11 distinct routes, thereby reflecting a typical month of service. The DoD parameter defines the proportion of battery capacity utilized each day. Higher DoD values correspond to more energy-intensive operation, directly associated with longer daily service hours. For each scenario, the corresponding driving pattern is assumed to repeat monthly throughout the battery’s lifespan until the end-of-life criteria are met.
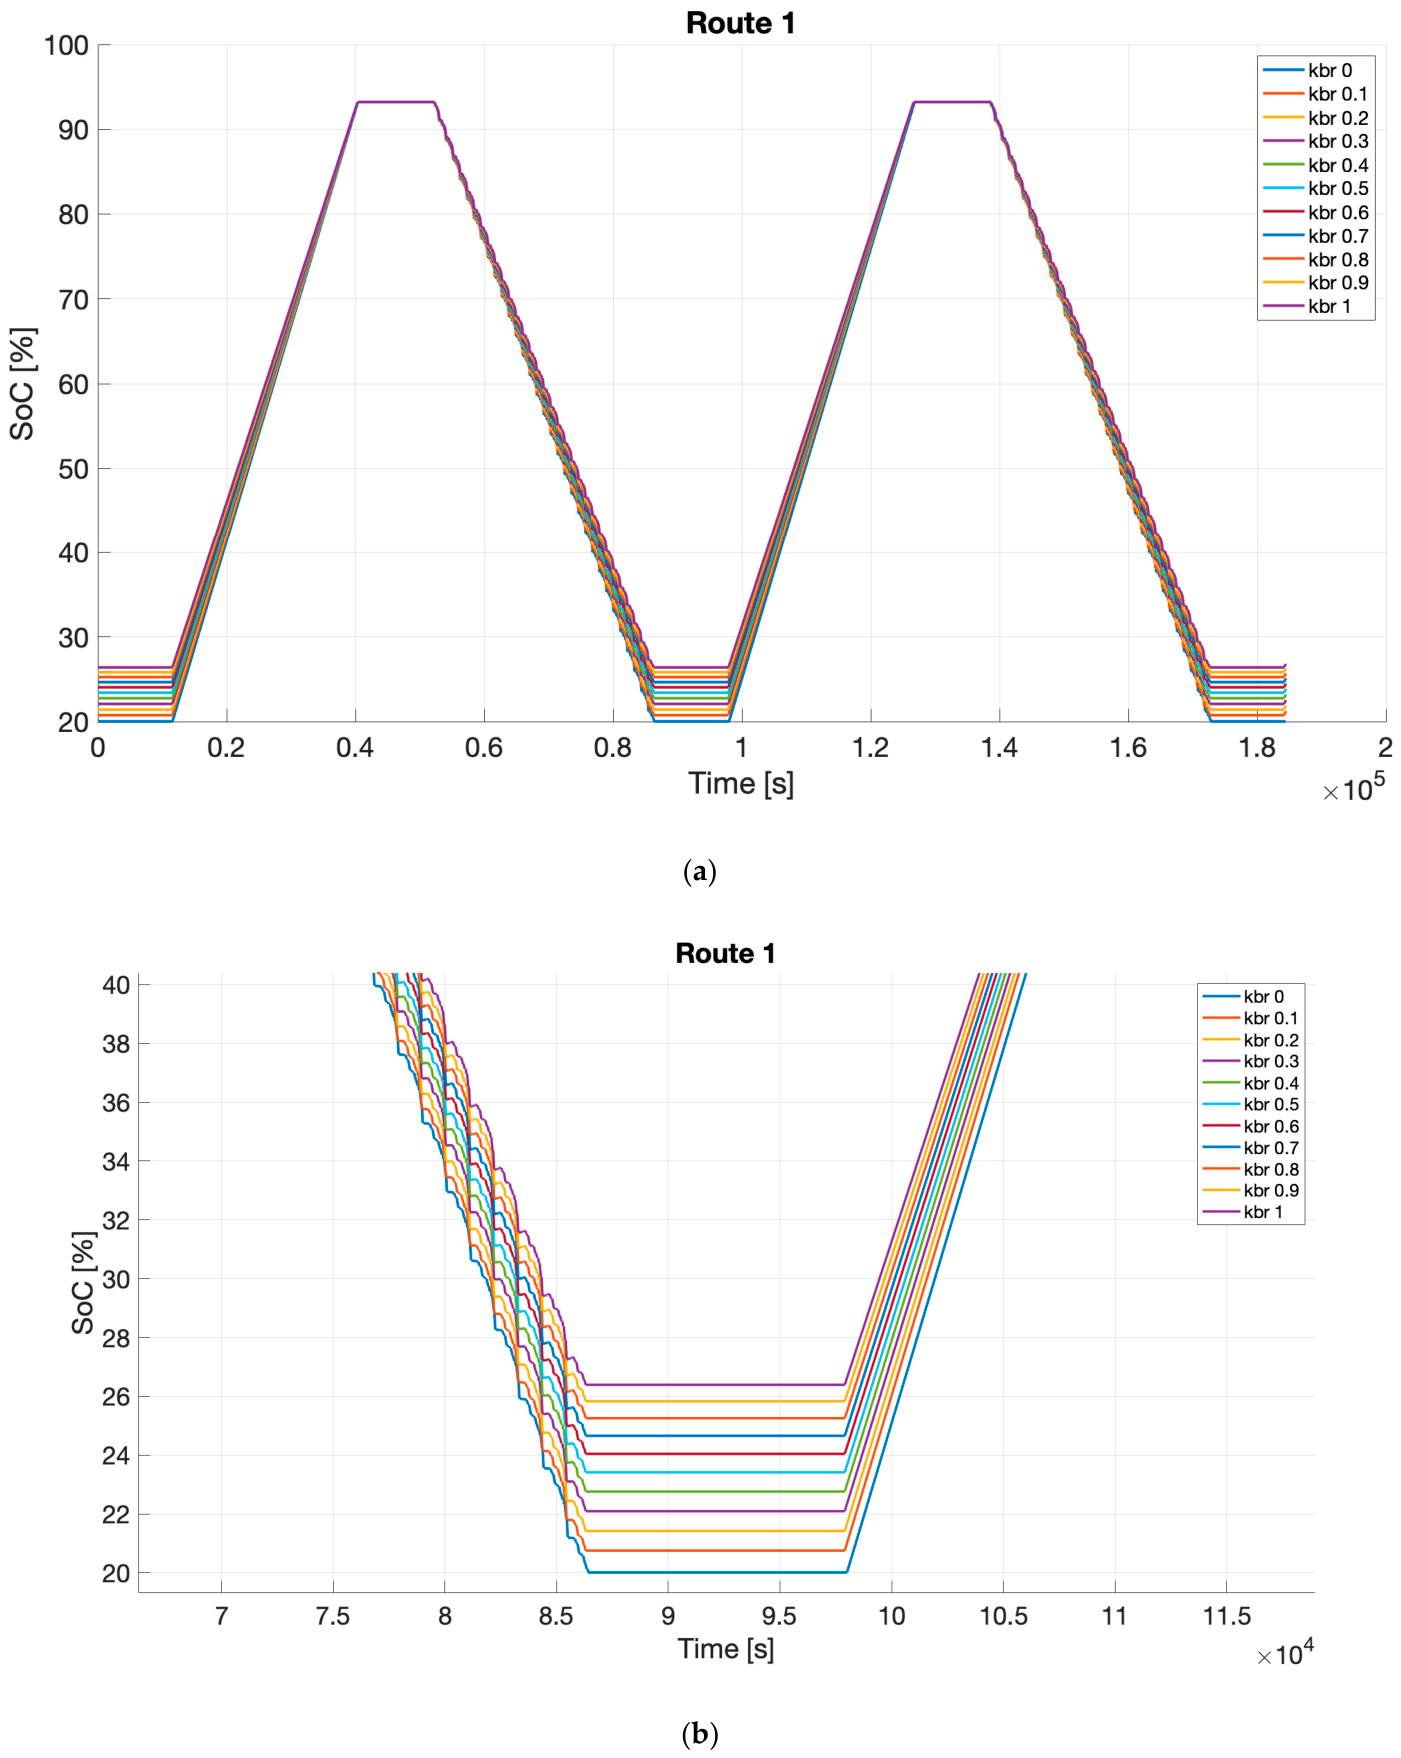
For each of these cycles, the impact of regenerative braking in the SoC was analysed. As in Figure 6, braking levels ranged from 0%, indicating no regenerative or electric braking, to 100%, representing maximum energy recovery. The increments were set at 0.1, meaning a 10% increase at each step. These increments directly correspond to the percentage of the total current absorbed by the battery pack. This approach allowed for a detailed analysis of how different regenerative braking intensities influence battery degradation, considering both the depth of discharge and the energy recovery strategy applied.
The simulation framework described above was applied to a set of realistic operational profiles representing typical electric bus routes. These use-case scenarios provide the basis for the analysis in the following chapter, where the impact of discharge depth and regenerative braking on battery ageing is examined.

4. Results and Discussion

The simulation framework described earlier generated a set of representative cycling conditions, varying in DoD and regenerative braking intensity, denoted as kbr. This section presents a detailed evaluation of how these parameters affect battery ageing in electric buses operating under realistic driving conditions. To assess the influence of each scenario on degradation, the previously discussed Rainflow and Miner-based framework was applied to the simulated profiles. This approach allows for a quantitative comparison across different DoD levels and cycling profiles, both constant and combined. Particular attention is given to the mitigating effect of kbr on capacity fade, emphasizing its potential to extend battery life. The influence of each parameter is explored in detail, with the resulting trends discussed in terms of life recovery and mileage recovery, aiming to optimize energy and battery management strategies.

4.1. Influence of Regenerative Braking in Life Recovery

To assess the impact of regenerative braking on battery end-of-life predictions, three key indicators were examined: the total projected lifespan, the absolute lifespan gain in years attributable to braking, and the relative improvement between successive braking levels. Across all cycling scenarios, an increase in regenerative braking consistently correlates with an extended battery life. However, the magnitude of this benefit varies depending on the DoD profile, highlighting how the effectiveness of regenerative strategies is closely linked to the depth and pattern of discharge.
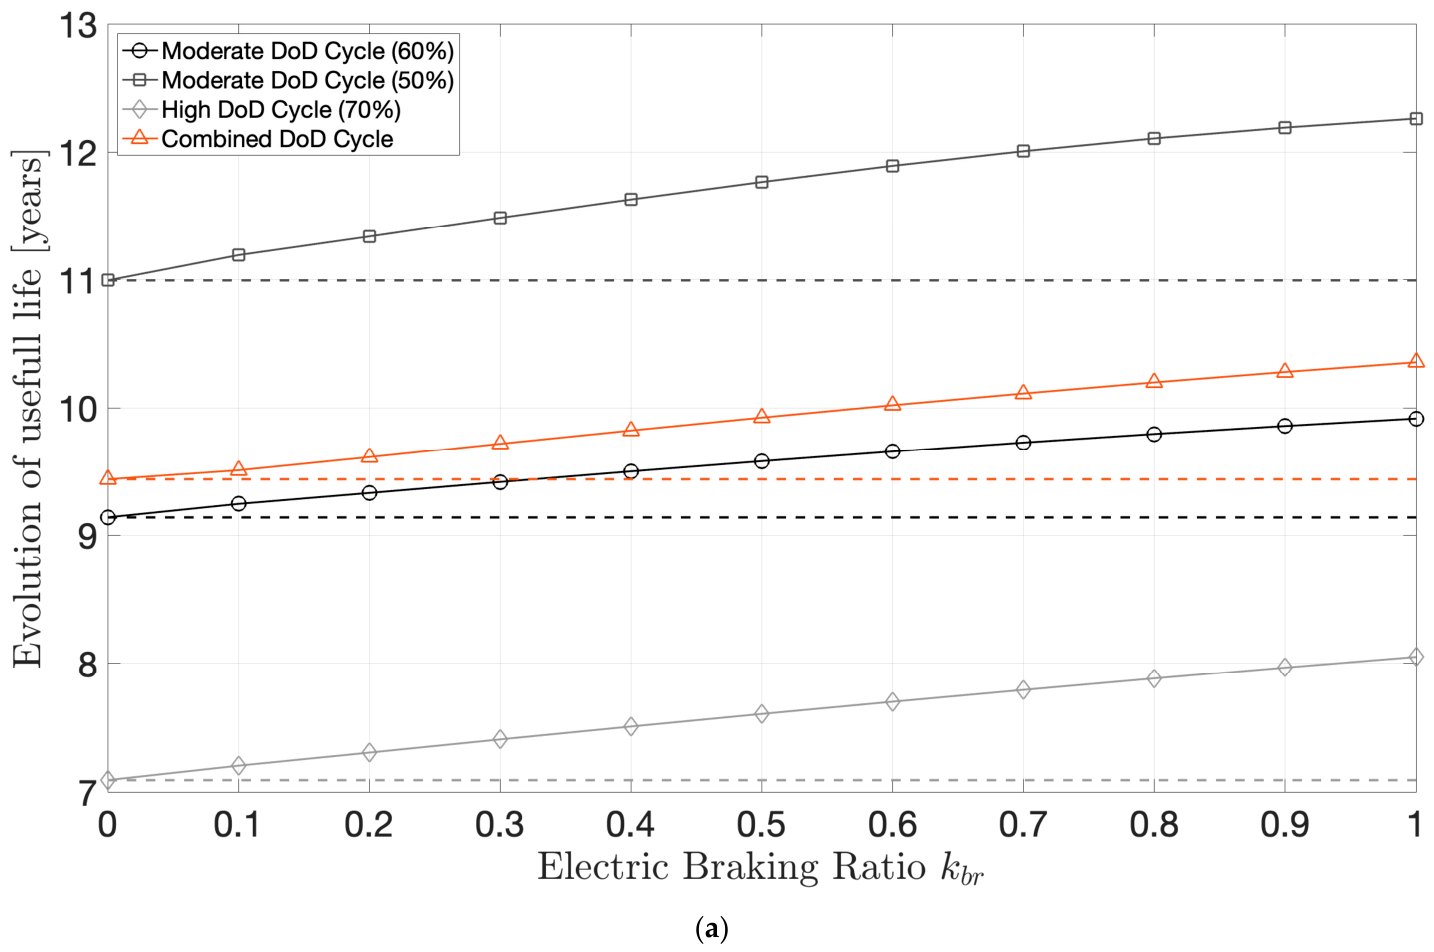
The analysis of EoL predictions, based on the accumulated damage method, confirms that DoD remains the most influential parameter in battery aging. As shown in Figure 7a, deeper discharge scenarios, particularly those involving 70% DoD, accelerate degradation and shorten lifespans. Conversely, lower DoD profiles, such as 50%, can extend battery life by more than 4 years compared to the 70% DoD scenario, reducing daily cycling stress and enhancing durability. By comparison, the combined DoD profile, which alternates between light and heavy daily usage, demonstrates better durability compared to constant 60% and 70% DoD profiles. While it does not surpass the 50% DoD in absolute terms, its relative performance suggests that route variability can mitigate cumulative stress and enhance overall system robustness. This indicates that non-uniform cycling profiles may reduce localized degradation and distribute wear more evenly over time. Notably, regenerative braking shows a visible impact on expected lifespan, with potential improvements of more than 1.25 years as braking intensity increases. This corresponds to an approximate increase of over 11.5% in overall lifetime.
The total lifetime extension reaches more than 0.9 years for the full-electric braking scenario for the High DoD Cycle (70%), representing an approximate improvement of 13.5% in lifetime, with near-linear growth observed for most profiles up to kbr 0.6. As expected, the 50% DoD profile exhibits the highest absolute recovery, confirming its efficiency in both baseline and enhanced scenarios. The variable DoD profile also exhibits consistent improvements, following similar trends to fixed cycles, but with a more stable and predictable progression. This emphasizes the benefit of non-repetitive driving patterns in maximizing regenerative braking potential.
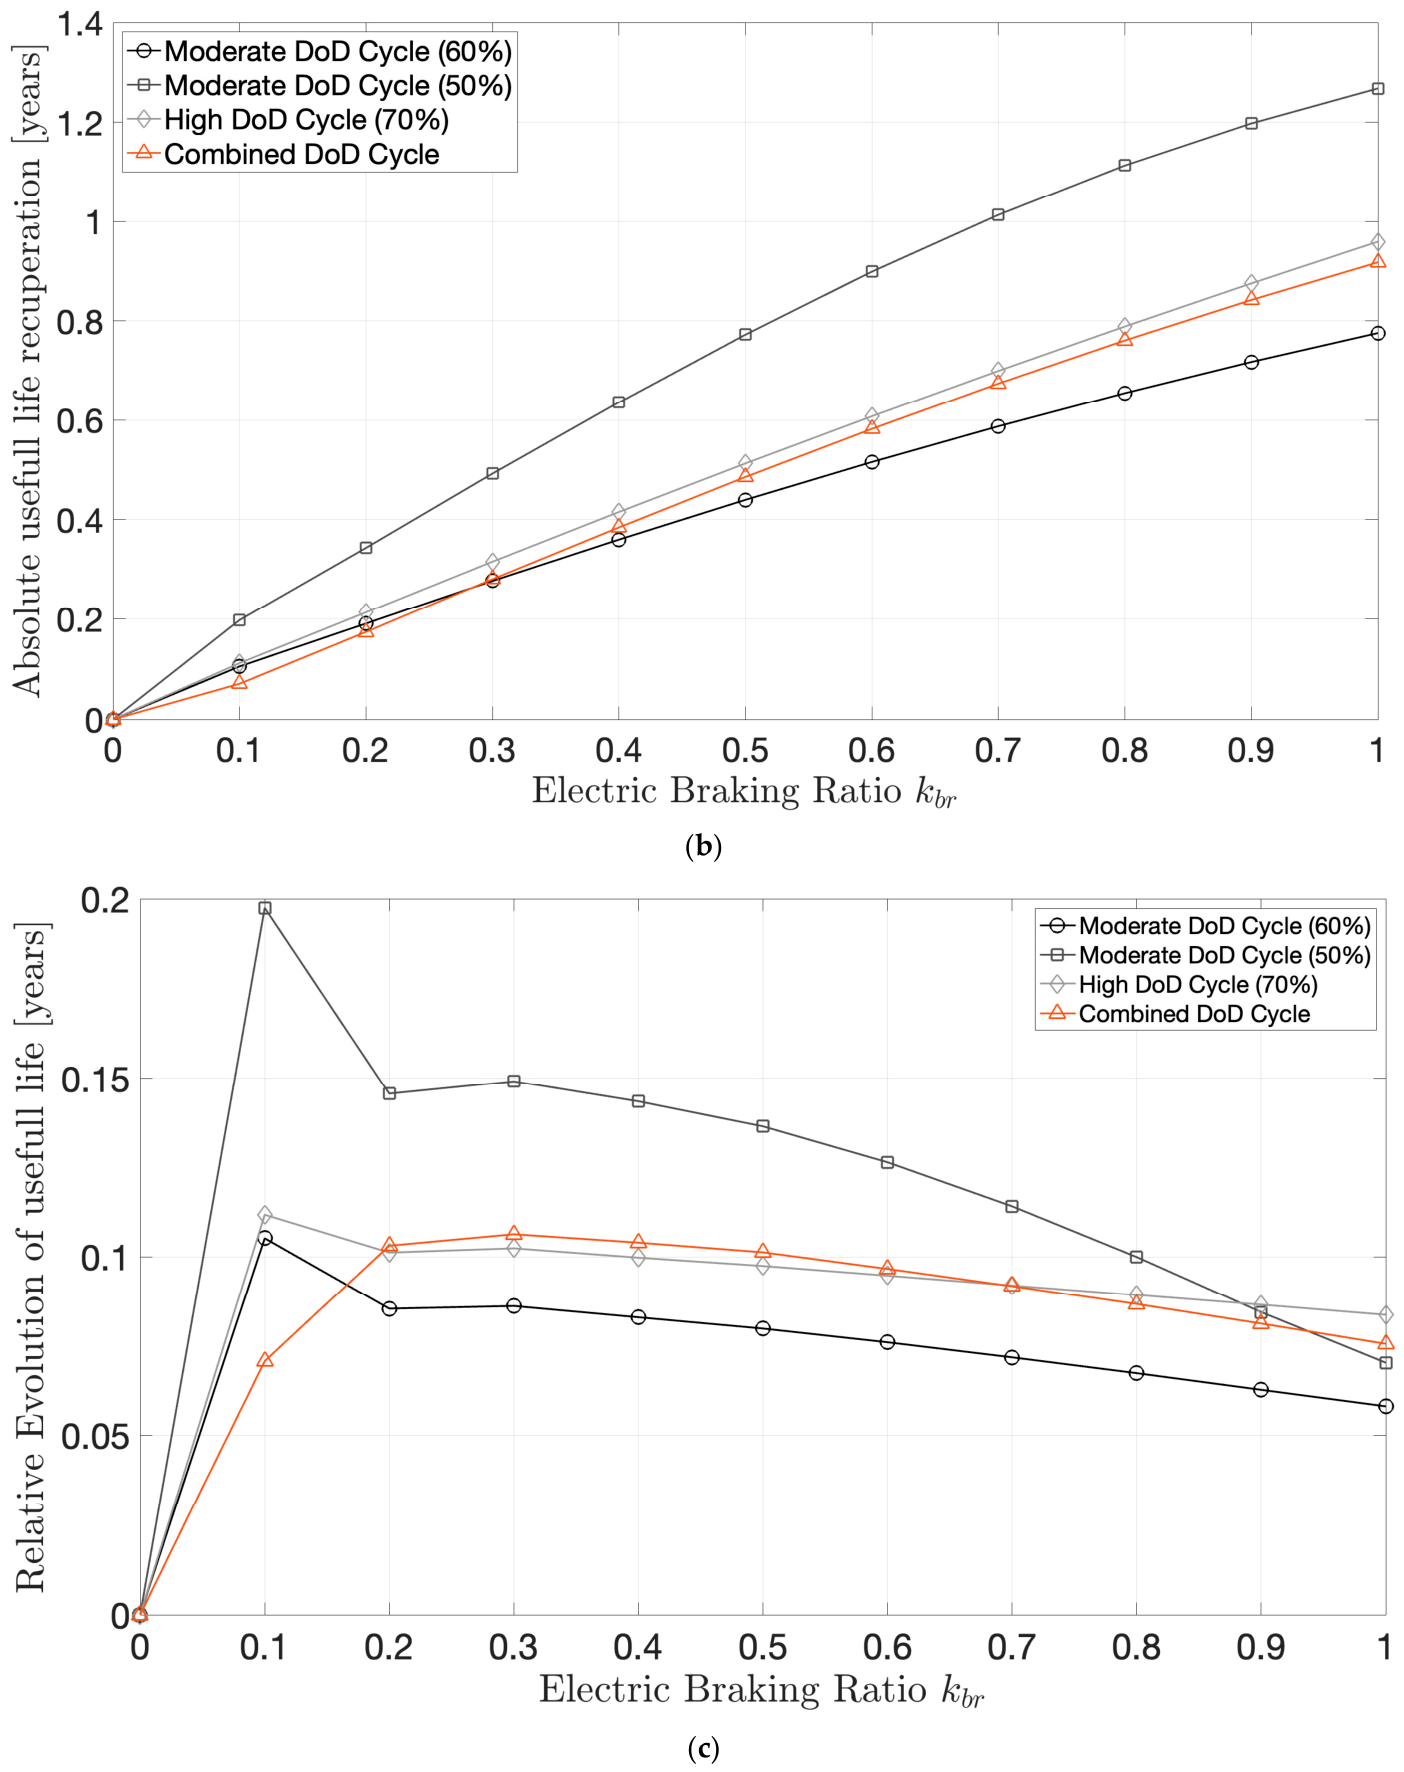
When examining lifetime gains as regenerative braking increases, all profiles demonstrate positive effects with higher kbr values. Regenerative braking increases lifespan for all bus cycles, with gains ranging from approximately 8.5% to 13.5%. As seen in Figure 7b, lower DoD cycles show a more pronounced variation in lifespan as regenerative braking increases. This indicates that less aggressive cycling conditions respond more favourably to energy recovery, with regeneration being more effective at reducing degradation when the baseline stress, defined by the DoD, is lower. However, higher and combined DoD cycles show a steadier trend, with lifespan improvements becoming more uniform. In these cases, the aging process is mainly driven by the depth and frequency of cycling, which diminishes the impact of regenerative braking on degradation mitigation.
Relative recovery, defined as the percentage increase in lifetime compared to each profile’s maximum potential under full regeneration, offers further insights. Figure 7c illustrates that relative lifespan improvements show diminishing returns as regenerative braking levels rise. The most significant gains occur between kbr levels of 0 and 0.3, with a saturation effect evident beyond kbr approx. 0.4. At early braking levels, the 50% DoD profile achieves slightly higher relative gains (4.48% vs. 4.45% for the 70% DoD). For kbr higher than 0.4, relative improvements indicate that the high DoD cycle (70%) can exploit regenerative braking more effectively under the same conditions, achieving on average approximately 3% higher relative gains compared to the moderate and mixed cycles. Notably, the largest marginal improvements are observed at kbr around 0.1, where even minimal braking provides substantial recovery benefits. This is likely due to the system’s ability to capture energy from a wide range of deceleration events, including frequent low intensity braking phases. The variable DoD profile consistently stands out, showing smooth recovery trends with less sensitivity to fluctuations in braking intensity. In contrast, fixed DoD profiles, especially the 50% DoD cycle, while demonstrating the highest relative improvement, also exhibit more pronounced gradual reduction as regenerative braking increases. This analysis leads to the conclusion that lower depths are more effective with lower kbr, and higher depths demonstrate better efficiency with higher kbr values when both trends are compared to each other.
These findings underscore the importance of aligning braking intensity with usage patterns to optimize both energy recovery and long-term performance. In conclusion, low-to-moderate regenerative braking levels, up to 0.3, offer the most cost-effective and technically feasible improvements. However, their effectiveness strongly depends on the underlying usage profile. The synergy between low DoD profiles and moderate regenerative braking strategies presents an operational trade-off, particularly in urban bus applications, where frequent stops facilitate consistent energy recovery without overstressing the battery system. Subsequently, the impact of these braking strategies on driving range is explored in the following sub-section.

4.2. Influence of Regenerative Braking in Mileage

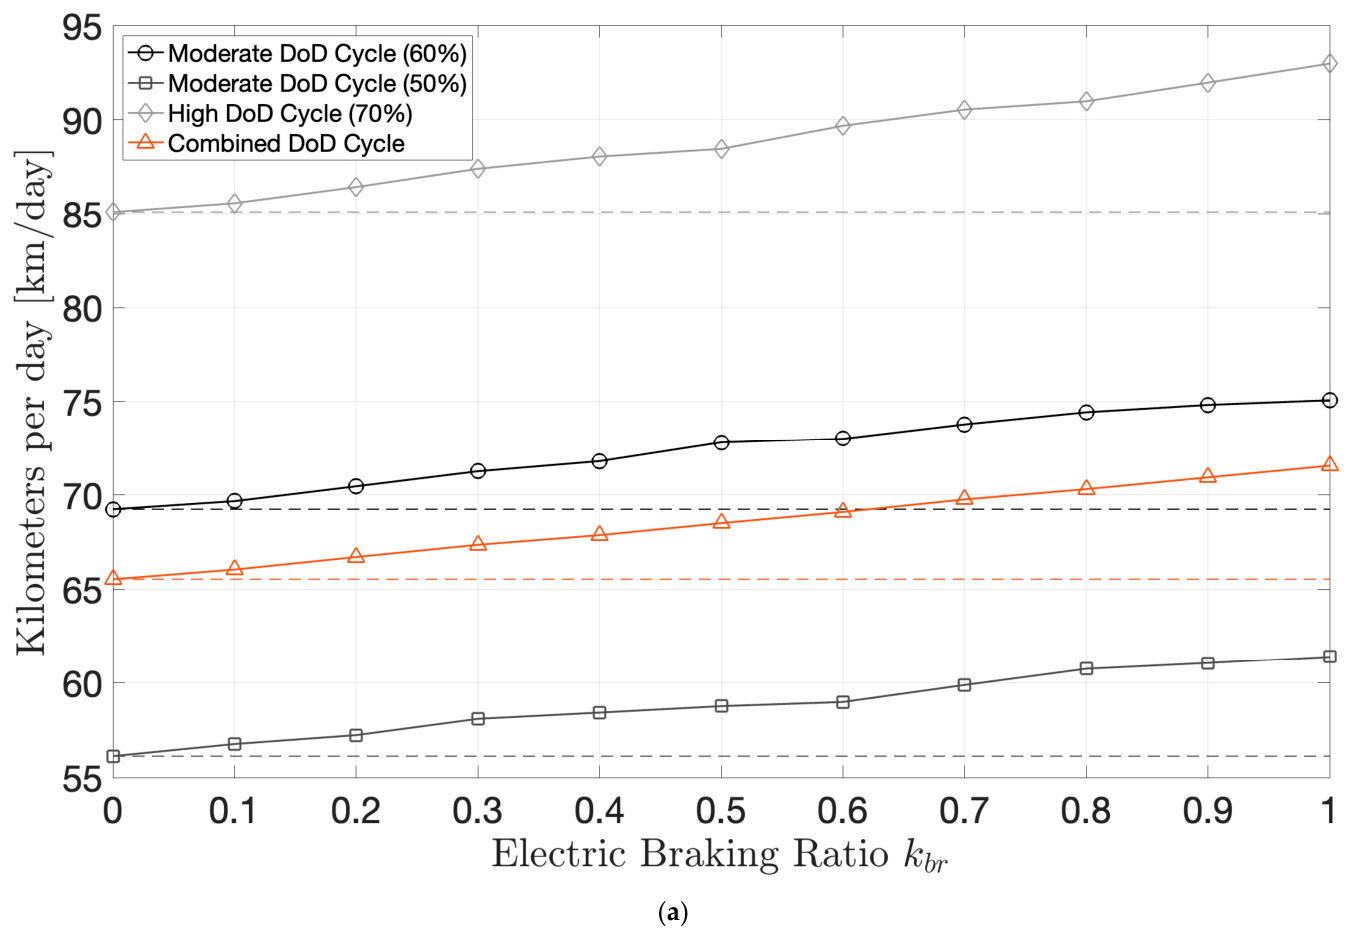
To assess the impact of regenerative braking on driving range, three key metrics were analysed: daily mileage, the absolute distance recovered through braking, and the relative improvement in recovery with increasing braking intensity. Although the previous sub-section addressed battery life, the current analysis reveals a parallel trend in mileage gains, similarly shaped by the electric braking ratio and DoD profile. By examining daily kilometers driven and recovered in relation to the electric braking ratio, this analysis provides insights into the influence of regenerative braking on vehicle energy efficiency and overall performance. It highlights the importance of aligning braking intensity with usage patterns to optimize both range and energy recovery. To better illustrate these findings, the following graphics in Figure 8 present a graphical representation of the data and trends observed.
The results in Figure 8a indicate that deeper discharges, particularly the High DoD Cycle (70%), offer the greatest potential for regenerative braking recovery, resulting in the highest daily total mileage. This corresponds to an approximate improvement of 9.26% for the 70% DoD cycle compared to the baseline case without regenerative braking. By comparison, moderate DoD cycles (60% and 50%) offer slightly different improvements, representing total relative recoveries of 9.39% and 8.78%, respectively. This highlights the strong dependence and impact that even a mere 10% difference in daily DoD can have on their overall regenerative capability. The combined cycle, with a total relative recovery of 9.21%, effectively shares characteristics of both moderate and deep cycles. It benefits from larger incremental recovery like the deeper DoD cycle. At the same time, it remains less susceptible to the saturation effects seen in lower DoD cycles, resulting in stable and consistent performance over time. Differences between cycles become more pronounced once regenerative braking exceeds 40%, with deeper DoD cycles recovering more energy, while the moderate and combined cycles maintain a steady, near-linear recovery pattern.
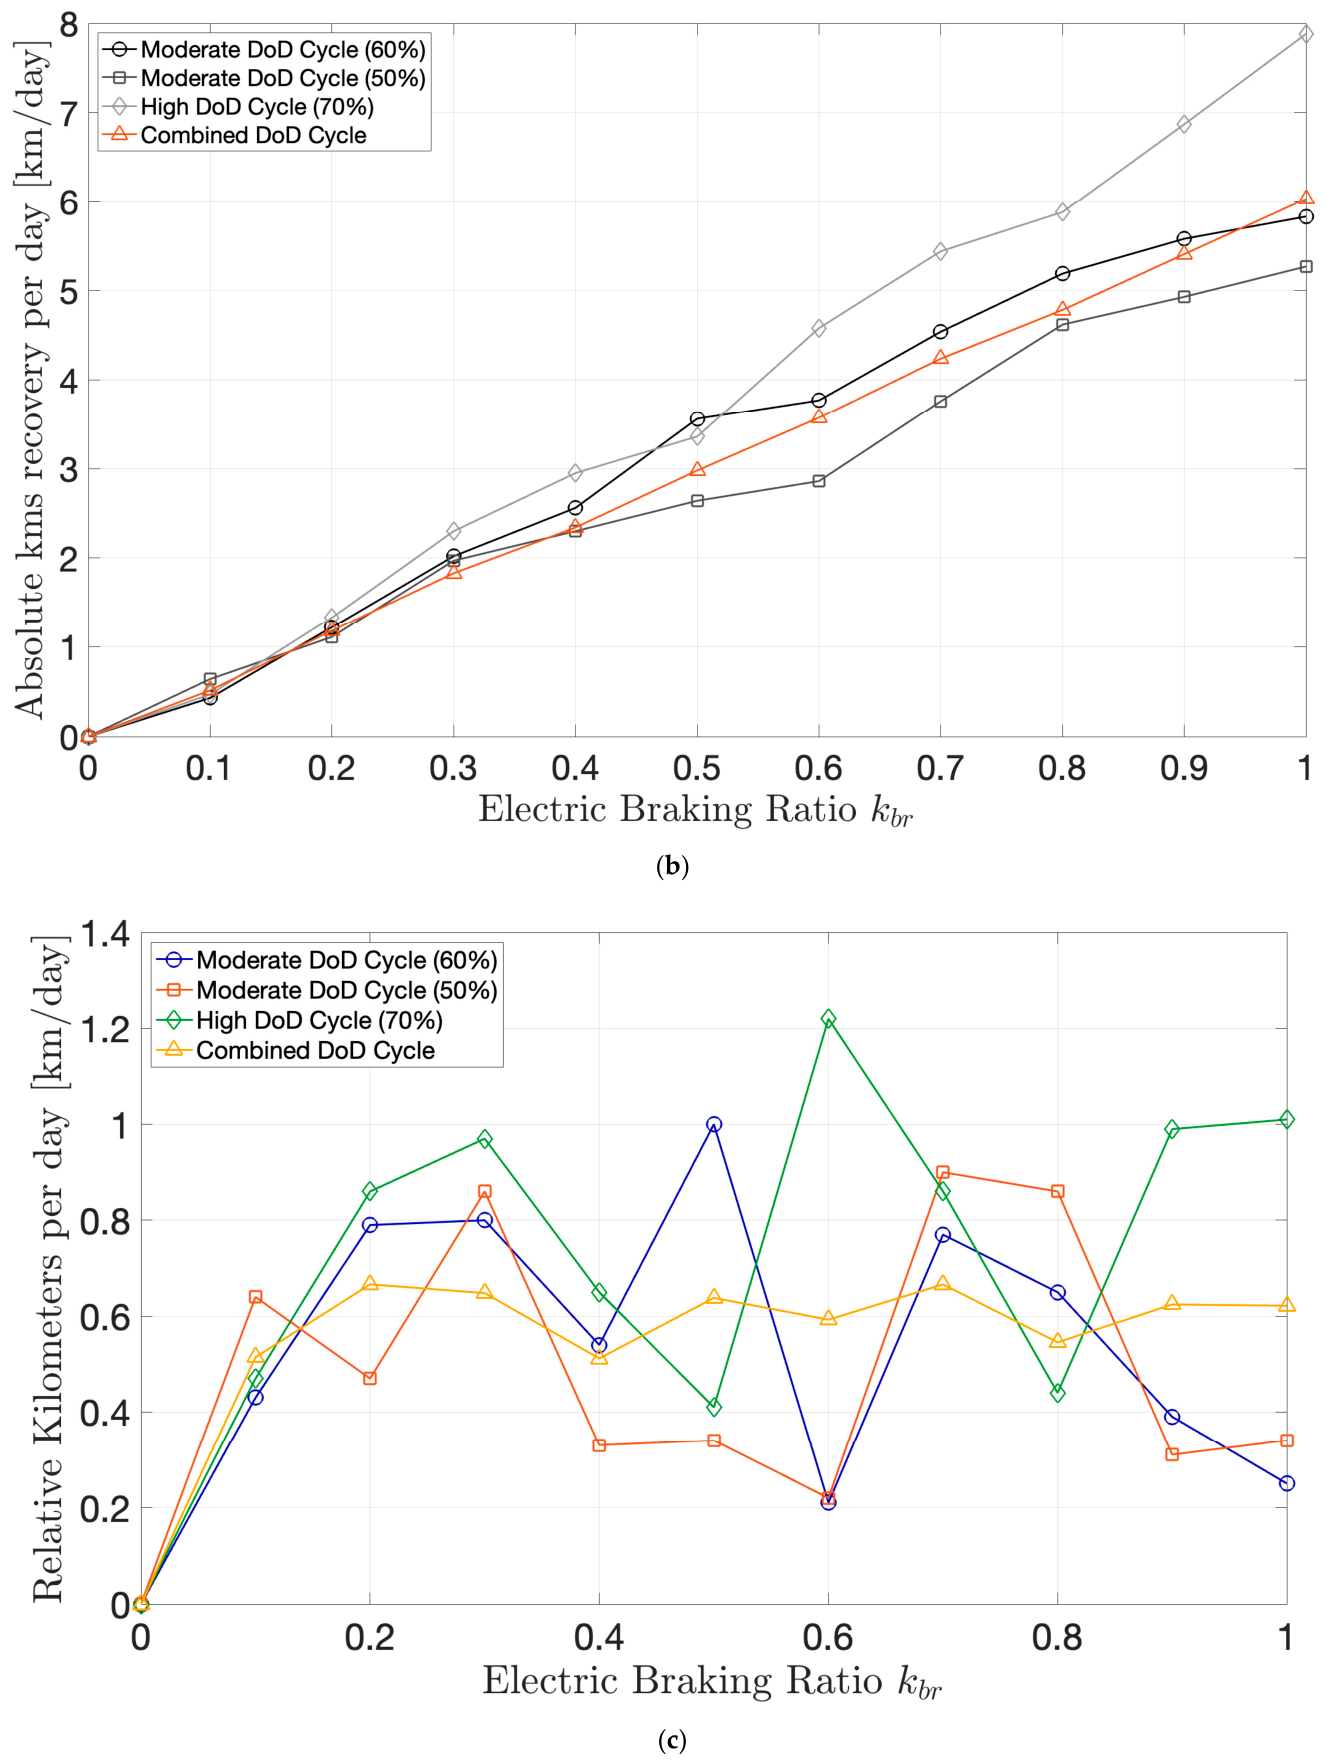
In Figure 8b, the absolute kilometers recovered per day highlight this linear pattern. For lower regenerative braking values, ranging from no regeneration to about 30%, there are no significant variations in mileage across the different DoD cycles. However, when regenerative braking exceeds 40%, the recovery patterns begin to diverge more significantly. This further demonstrates the previously identified trend, where deeper discharges prevail over other DoD profiles in terms of energy recovery. The Combined and lower DoD cycles, by comparison, maintain a consistent progression in mileage recovery, with the Combined Cycle standing out due to its stable and predictable recovery curve. This suggests that mixed driving conditions offer more operational robustness, making it a practical choice for varied real-world conditions.
Since all profiles showed a consistently increasing trend with each braking increment, a relative analysis (Figure 8c) was carried out by normalizing each kbr level against the maximum recovery achievable within its respective DoD cycle. This approach is analogous to evaluating the efficiency of each braking intensity setting. It allows for a clearer identification of local optima across different profiles or routes, helping to highlight patterns and correlations in energy recovery behaviour. This analysis reveals that there are optimal regenerative braking ratios across all cycles. Both very low and very high braking intensities appear less effective, with intermediate values, particularly at kbr values of 0.3 and 0.7, providing the best balance between recovery and efficiency. These relative mileage increments, shown in Figure 8c, outline significant fluctuations across kbr intervals. These variations can be attributed to the dynamic behaviour of energy flows, influenced by braking frequency, speed profiles, and the limitations of the cell chemistry. The analysis confirms that regenerative braking plays a significant role in extending driving range, with its effectiveness influenced by discharge profiles and braking intensity. Rather than pursuing extreme configurations, moderate strategies yield more consistent and energy-efficient results. These findings reinforce the value of adaptive braking strategies tailored to usage conditions, setting the foundation for the concluding discussion on operational optimisation and future implementation.

4.3. Total Lifetime Distance Analysis

According to the previous sub-sections, the analyses provided key insights into both mileage and lifespan evolution across varying levels of regenerative braking. The general behaviour indicates that the system under study exhibits well-defined trends under specific discharge profiles, revealing meaningful distinctions in performance trajectories. These patterns become particularly evident when evaluating lifetime mileage, which integrates both daily range and degradation dynamics, providing a comprehensive metric of long-term energy effectiveness.
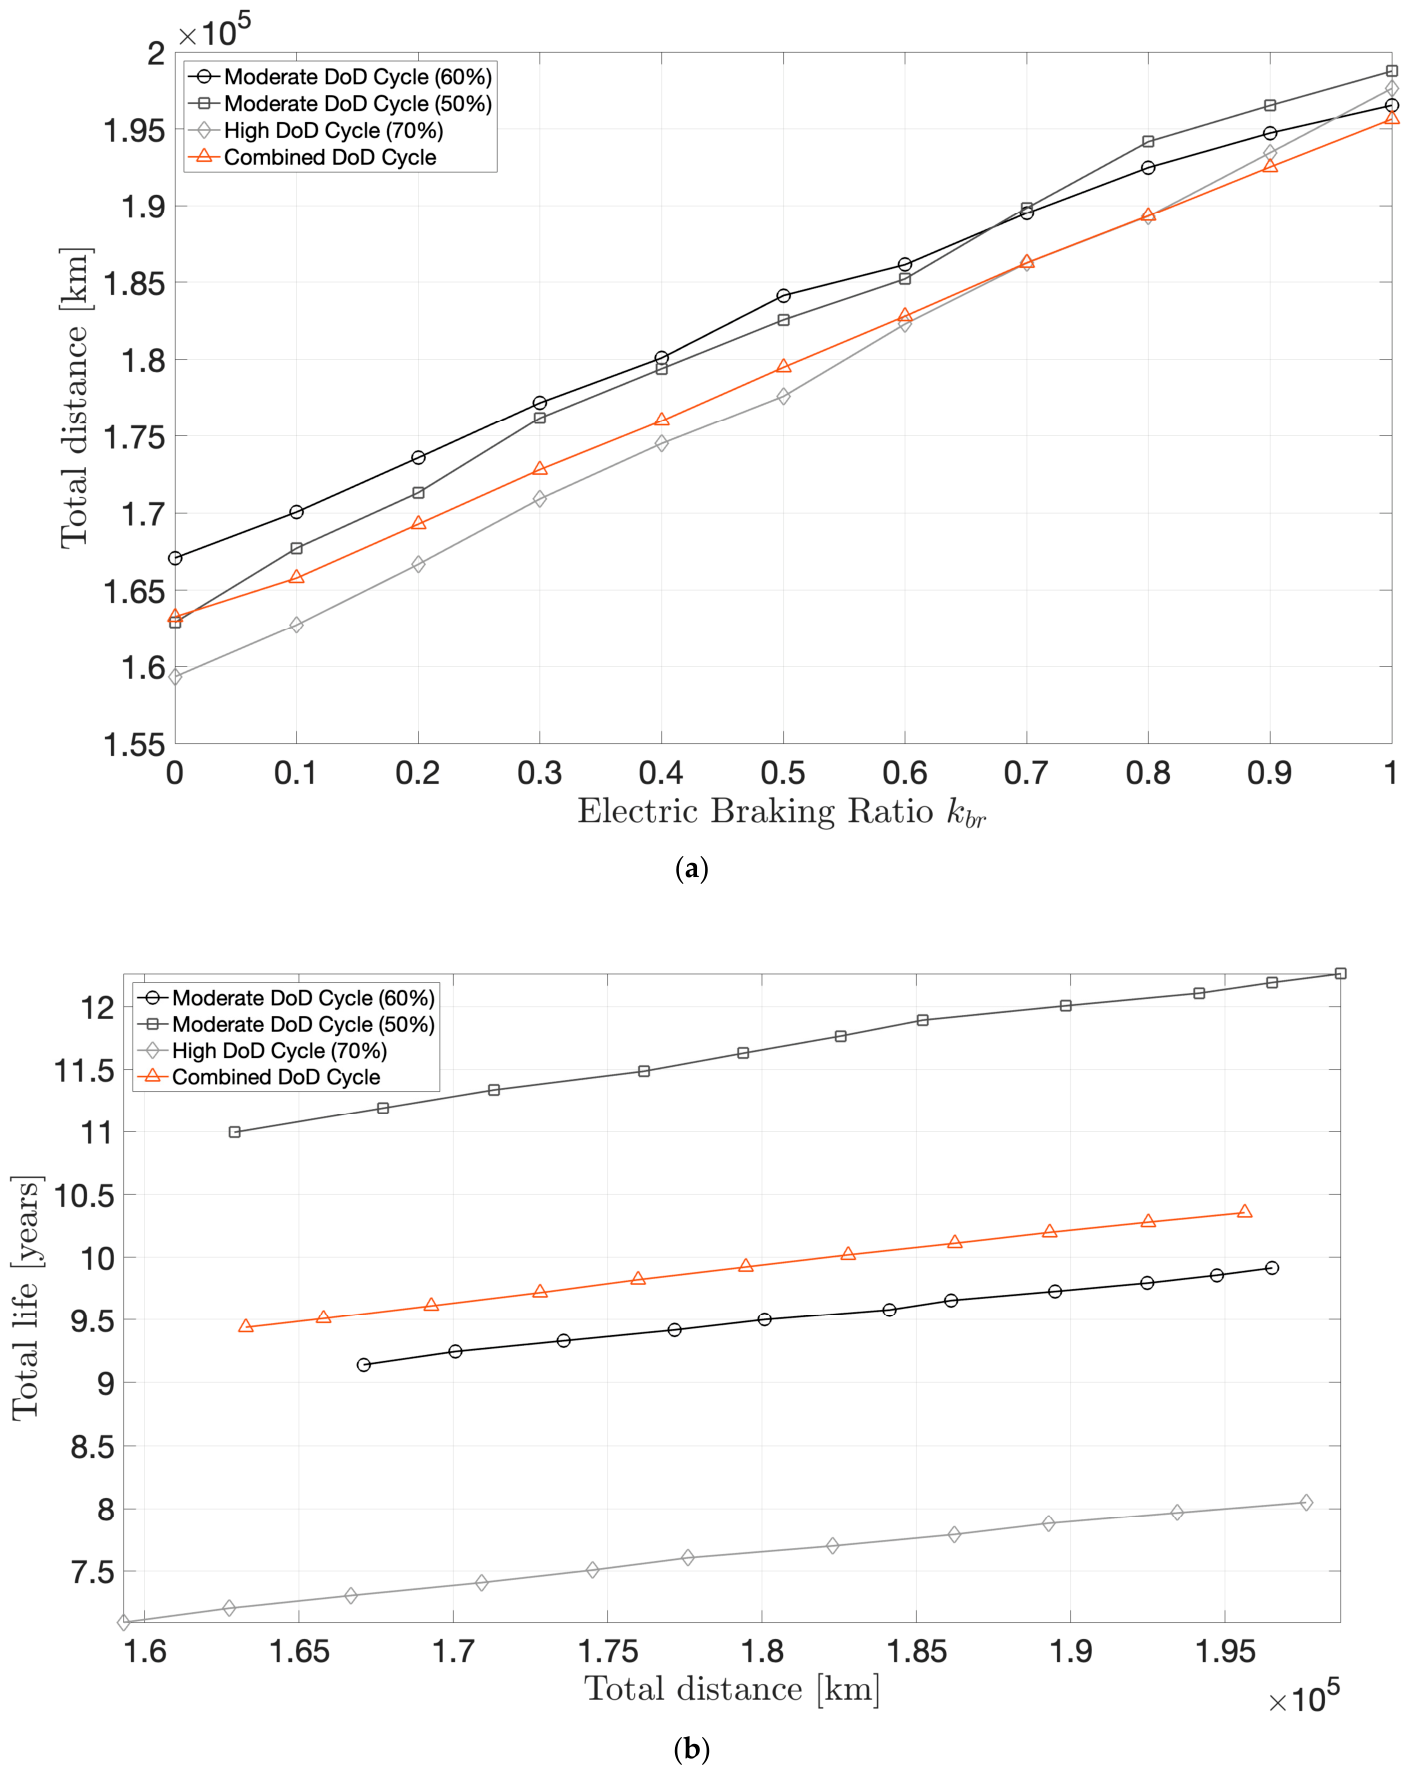
Figure 9 depicts the cumulative distance achievable throughout the battery’s life cycle under varying regenerative braking ratios, across the discharge strategies under study. The results reveal distinct inflection patterns that reflect the nuanced interplay between energy recovery intensity and long-term electrochemical sustainability.
In Figure 9a, it can be seen that the 60% DoD configuration consistently outperforms the alternatives for kbr ≤ 0.7. This indicates that intermediate depth cycling is optimally aligned with moderate regenerative recovery. Its trajectory demonstrates the ability to capitalize on increased braking energy without disproportionately accelerating degradation, suggesting a well-balanced compromise between operational throughput and durability.
However, this hierarchy reverses beyond kbr 0.7. At this point, the 50% DoD strategy overtakes all others, delivering the highest lifetime mileage. This inversion underscores a critical insight: under strong regenerative regimes, conservative cycling not only mitigates degradation but also effectively leverages recovered energy, offering superior long-term energy return. It represents a regime shift that highlights the importance of aligning usage profiles with the anticipated regenerative environment, rather than optimizing a single parameter in isolation.
Conversely, while the 70% DoD profile shows limited performance under low kbr, its curve steepens significantly with increasing regeneration, surpassing the Combined Cycle beyond kbr 0.8. This late-stage acceleration illustrates that high-intensity discharge patterns, though initially penalized by faster degradation, may regain competitiveness under conditions of elevated braking frequency and energy capture.
The Combined Cycle exhibits a linear and consistent trend across the entire kbr range, reflecting its inherently balanced character. However, its middle-ground nature limits its ability to lead in either lifetime or total mileage, revealing the trade-off inherent in generalized operational scenarios.
These distinctions are further clarified in Figure 9b, which maps calendar life against accumulated mileage, providing a two-dimensional perspective of both temporal endurance and energy throughput. The 50% DoD strategy clearly dominates, achieving more than 12 years of projected operation and approaching 200,000 km of service. This corresponds to an overall relative improvement of approximately 22% when combining the gains in mileage and lifetime.
The Combined Cycle, while trailing in both metrics, ranks a close second, with approximately 10.4 years of service and 195,000 km covered. This corresponds to an overall relative improvement of approximately 19.8% compared to the baseline operating condition. On the other hand, the 60% DoD configuration, despite a slightly shorter lifespan (9.9 years), achieves higher total mileage, around 197,000 km. Despite its lowest relative gain (17.6%), evaluating lifespan and distance independently reveals an important operational nuance. The energy delivered per unit of time allows the cycle to cover more distance annually, meaning it may be advantageous to operate a bus that achieves more kilometers in fewer years.
Finally, although the 70% DoD profile delivers the shortest calendar life, it surpasses all others in total mileage, except the 50% DoD. It achieves a total recovery of 24% (2% higher than the 50%DoD) compared to standard operational use without regenerative strategies. This demonstrates that degradation-driven configurations can still provide superior cumulative output when optimized for usage intensity. This finding has critical implications for high-frequency service environments, where maximizing distance per deployed battery unit outweighs absolute longevity.
In sum, these results reinforce the need to interpret regenerative braking impacts through an integrated lens, one that captures both longevity and accumulated output. Operational strategies must be context-sensitive, tailored not only to battery chemistry and degradation mechanisms, but also to expected regenerative profiles and service demands. A comprehensive optimization framework should further incorporate energy pricing and life-cycle costs to identify truly optimal deployment regimes across the electric mobility spectrum.

5. Conclusions

Building on the findings of this study, it can be concluded that lithium-ion battery aging in urban electric buses arises from multiple interacting factors, with cycle-induced fatigue emerging as the dominant degradation mechanism. As demonstrated through the Rainflow-based cycle-counting analysis applied to a lithium-ion battery pack operating under realistic urban driving conditions, daily charge–discharge cycling exerts a greater influence on capacity fade than individual operating events. Although, it remains impractical to explicitly capture all aging mechanisms, such as temperature-dependent effects and high-frequency micro-cycles that may be amplified by internal thermal gradients. These mechanisms are not fully addressed in this study. Nevertheless, the semi-empirical modeling framework adopted exhibits strong potential for predicting battery life under dynamic operating conditions.
The proposed Rainflow-based cycle-counting approach shows significant promise for estimating the useful life of traction batteries in public transport systems characterized by repetitive and well-defined routes. While the accuracy of the results remains dependent on the quality of the degradation curves, linking the DoD to cycle life, the methodological simplicity and low processing requirements offer a major advantage. This approach is particularly valuable for fleet operators. It supports the assessment of battery lifespan and the optimization of route and energy-management strategies prior to vehicle deployment. Despite this potential, the application of the Rainflow algorithm to lithium-ion battery aging remains insufficiently explored in the literature, highlighting a clear research gap.
With specific regard to the impact of regenerative braking, the results demonstrate that appropriate energy recovery strategies can extend battery service life and daily range. On average, this yields approximately 0.9 years of additional service, and an average daily range increase of about 6 km. Combining the contributions of each metric, this results in a relative improvement of 20% compared to non-regenerative scenarios. The analysis further reveals that higher DoD operation, although enabling greater energy recovery, significantly accelerates cyclic fatigue, whereas lower DoD cycling promotes longer battery lifespan at the expense of reduced recovered mileage. Additionally, it was observed that both low regenerative braking intensities (below ~20%) and excessively high levels (above ~80%) are suboptimal when considering the trade-off between energy recovery and battery degradation. Intermediate regenerative braking ratios, particularly around 30% and 70%, provide the most favorable balance between recovered energy and cycle-induced aging.
Considering these findings, further research is essential to refine battery aging predictions and extend the applicability of Rainflow-based methodologies. Comprehensive experimental datasets covering multiple lithium-ion chemistries are needed to derive more accurate, chemistry-dependent life curves and aging models. Moreover, future work should explicitly investigate the coupled thermal and electrochemical effects of regenerative-braking-induced micro-cycles. Understanding their contribution to long-term cumulative degradation will enhance the reliability of battery life assessments for electric bus fleet operation.
The proposed methodology provides a computationally efficient and practical tool for evaluating battery lifetime at system level. It is particularly suitable for applications requiring real-time monitoring and operational optimization. While the simplified degradation model does not capture all physical aging mechanisms, it still allows the analysis of the relative impact of operational strategies, such as regenerative braking, using readily available data. Future work will focus on including temperature effects, C-rate dependency, and experimental validation.

Author Contributions

Conceptualization, P.G.P. and J.P.F.T.; methodology, M.A.M.F. and J.P.F.T.; software, M.A.M.F.; validation, M.A.M.F., P.G.P. and J.P.F.T.; investigation, M.A.M.F.; resources, J.P.F.T. and P.G.P.; writing—original draft preparation, M.A.M.F.; writing—review and editing, J.P.F.T. and P.G.P.; supervision, P.G.P. and J.P.F.T.; funding acquisition, P.G.P. and J.P.F.T. All authors have read and agreed to the published version of the manuscript.

Funding

Funding support for this research comes from the Portuguese Foundation for Science and Technology, ref. UID/00308/2025, FCT Pluriannual Funding UID/308: Instituto de Engenharia de Sistemas e Computadores de Coimbra—INESC Coimbra; DOI https://doi.org/10.54499/UID/00308/2025. Partial support is also provided by the Canada Research Chairs Program (grant no 950–230672) and Mitacs Accelerate Program under project IT30373.

Data Availability Statement

The raw data supporting the conclusions of this article will be made available by the authors on request.

Acknowledgments

Authors would like to express their gratitude to SysNergie Inc. for supporting this research.

Conflicts of Interest

The authors declare no conflicts of interest, The funders had no role in the design of the study; in the collection, analyses, or interpretation of data; in the writing of the manuscript; or in the decision to publish the results.

Abbreviations

The following abbreviations are used in this manuscript:
ASTM American Society for Testing and Materials
BMS Battery Management System
BoL Beginning of Life
DoD Depth of Discharge
EFC Equivalent Full Cycles
EIS Electrochemical Impedance Spectroscopy
EMR Energetic Macroscopic Representation
EoL End of Life
EV Electric Vehicle
kbrRegenerative braking coefficient
LAM Loss of Active Material
LLI Loss of Lithium Inventory
LFP Lithium Iron Phosphate
NMC Nickel Manganese Cobalt
RfCM Rainflow Counting Method
RUL Remaining Useful Life
SEI Solid Electrolyte Interphase
SoC State of Charge
SOH State of Health
SVR Support Vector Regression

References

  1. Sanguesa, J.A.; Torres-Sanz, V.; Garrido, P.; Martinez, F.J.; Marquez-Barja, J.M. A Review on Electric Vehicles: Technologies and Challenges. Smart Cities 2021, 4, 372–404. [Google Scholar] [CrossRef]
  2. Zaino, R.; Ahmed, V.; Alhammadi, A.M.; Alghoush, M. Electric Vehicle Adoption: A Comprehensive Systematic Review of Technological, Environmental, Organizational and Policy Impacts. World Electr. Veh. J. 2024, 15, 375. [Google Scholar] [CrossRef]
  3. Tang, K.; Luo, B.; Chen, D.; Wang, C.; Chen, L.; Li, F.; Cao, Y.; Wang, C. The State of Health Estimation of Lithium-Ion Batteries: A Review of Health Indicators, Estimation Methods, Development Trends and Challenges. World Electr. Veh. J. 2025, 16, 429. [Google Scholar] [CrossRef]
  4. Liu, H.; Deng, Z.; Yang, Y.; Lu, C.; Li, B.; Liu, C.; Cheng, D. Capacity evaluation and degradation analysis of lithium-ion battery packs for on-road electric vehicles. J. Energy Storage 2023, 65, 107270. [Google Scholar] [CrossRef]
  5. Ge, M.-F.; Liu, Y.; Jiang, X.; Liu, J. A review on state of health estimations and remaining useful life prognostics of lithium-ion batteries. Measurement 2021, 174, 109057. [Google Scholar] [CrossRef]
  6. Hossain Lipu, M.S.; Hannan, M.A.; Karim, T.F.; Hussain, A.; Saad, M.H.M.; Ayob, A.; Miah, M.S.; Indra Mahlia, T.M. Intelligent algorithms and control strategies for battery management system in electric vehicles: Progress, challenges and future outlook. J. Clean. Prod. 2021, 292, 126044. [Google Scholar] [CrossRef]
  7. Sakr, H.A.; Eladl, A.A.; El-Afifi, M.I. Leveraging IoT-enabled machine learning techniques to enhance electric vehicle battery state-of-health prediction. J. Energy Storage 2025, 120, 116409. [Google Scholar] [CrossRef]
  8. Laresgoiti, I.; Käbitz, S.; Ecker, M.; Sauer, D.U. Modeling mechanical degradation in lithium ion batteries during cycling: Solid electrolyte interphase fracture. J. Power Sources 2015, 300, 112–122. [Google Scholar] [CrossRef]
  9. De Hoog, J.; Timmermans, J.-M.; Ioan-Stroe, D.; Swierczynski, M.; Jaguemont, J.; Goutam, S.; Omar, N.; Van Mierlo, J.; Van Den Bossche, P. Combined cycling and calendar capacity fade modeling of a Nickel-Manganese-Cobalt Oxide Cell with real-life profile validation. Appl. Energy 2017, 200, 47–61. [Google Scholar] [CrossRef]
  10. Lei, P.; Xiong, Y.; Zhang, C.; Yi, T.; Qian, X. Life prediction model and performance degradation of lithium-ion battery under different cut-off voltages. Solid State Ion. 2025, 420, 116779. [Google Scholar] [CrossRef]
  11. Rychlik, I. A new definition of the rainflow cycle counting method. Int. J. Fatigue 1987, 9, 119–121. [Google Scholar] [CrossRef]
  12. Matsuishi, M.; Endo, T. Fatigue of metals subjected to varying stress. Jpn. Soc. Mech. Eng. Fukuoka Jpn. 1968, 68, 37–40. [Google Scholar]
  13. Musallam, M.; Johnson, C.M. An Efficient Implementation of the Rainflow Counting Algorithm for Life Consumption Estimation. IEEE Trans. Reliab. 2012, 61, 978–986. [Google Scholar] [CrossRef]
  14. Downing, S.; Socie, D. Simple rainflow counting algorithms. Int. J. Fatigue 1982, 4, 31–40. [Google Scholar] [CrossRef]
  15. Ferreira, M.A.M.; Messier, P.; Pereirinha, P.G.; Trovão, J.P.F. Enhanced EMR-Based Modelling for Electric Urban Buses Performance Studies. In Proceedings of the 2024 IEEE Vehicle Power and Propulsion Conference (VPPC); IEEE: Washington, DC, USA, 2024; pp. 1–6. [Google Scholar]
  16. Timilsina, L.; Badr, P.R.; Hoang, P.H.; Ozkan, G.; Papari, B.; Edrington, C.S. Battery Degradation in Electric and Hybrid Electric Vehicles: A Survey Study. IEEE Access 2023, 11, 42431–42462. [Google Scholar] [CrossRef]
  17. Han, X.; Lu, L.; Zheng, Y.; Feng, X.; Li, Z.; Li, J.; Ouyang, M. A review on the key issues of the lithium ion battery degradation among the whole life cycle. eTransportation 2019, 1, 100005. [Google Scholar] [CrossRef]
  18. Liu, Y.; Lai, X.; Zheng, Y.; Cheng, E.; Zhu, J.; Qian, L. Recent advancements and perspectives in lithium-ion battery aging: Mechanism, characterization, and prediction. J. Energy Storage 2025, 122, 116670. [Google Scholar] [CrossRef]
  19. Liu, Y.; Liu, C.; Liu, Y.; Sun, F.; Qiao, J.; Xu, T. Review on degradation mechanism and health state estimation methods of lithium-ion batteries. J. Traffic Transp. Eng. Engl. Ed. 2023, 10, 578–610. [Google Scholar] [CrossRef]
  20. Oji, T.; Zhou, Y.; Ci, S.; Kang, F.; Chen, X.; Liu, X. Data-Driven Methods for Battery SOH Estimation: Survey and a Critical Analysis. IEEE Access 2021, 9, 126903–126916. [Google Scholar] [CrossRef]
  21. Li, Y.; Liu, K.; Foley, A.M.; Zülke, A.; Berecibar, M.; Nanini-Maury, E.; Van Mierlo, J.; Hoster, H.E. Data-driven health estimation and lifetime prediction of lithium-ion batteries: A review. Renew. Sustain. Energy Rev. 2019, 113, 109254. [Google Scholar] [CrossRef]
  22. Collath, N.; Tepe, B.; Englberger, S.; Jossen, A.; Hesse, H. Aging aware operation of lithium-ion battery energy storage systems: A review. J. Energy Storage 2022, 55, 105634. [Google Scholar] [CrossRef]
  23. Birkl, C.R.; Roberts, M.R.; McTurk, E.; Bruce, P.G.; Howey, D.A. Degradation diagnostics for lithium ion cells. J. Power Sources 2017, 341, 373–386. [Google Scholar] [CrossRef]
  24. Richardson, R.R.; Osborne, M.A.; Howey, D.A. Gaussian process regression for forecasting battery state of health. J. Power Sources 2017, 357, 209–219. [Google Scholar] [CrossRef]
  25. Li, W.; Zhang, H.; Van Vlijmen, B.; Dechent, P.; Sauer, D.U. Forecasting battery capacity and power degradation with multi-task learning. Energy Storage Mater. 2022, 53, 453–466. [Google Scholar] [CrossRef]
  26. Zhao, C.; Andersen, P.B.; Træholt, C.; Hashemi, S. Data-driven battery health prognosis with partial-discharge information. J. Energy Storage 2023, 65, 107151. [Google Scholar] [CrossRef]
  27. Zhu, J.; Wang, Y.; Huang, Y.; Bhushan Gopaluni, R.; Cao, Y.; Heere, M.; Mühlbauer, M.J.; Mereacre, L.; Dai, H.; Liu, X.; et al. Data-driven capacity estimation of commercial lithium-ion batteries from voltage relaxation. Nat. Commun. 2022, 13, 2261. [Google Scholar] [CrossRef]
  28. Anseán, D.; Dubarry, M.; Devie, A.; Liaw, B.Y.; García, V.M.; Viera, J.C.; González, M. Operando lithium plating quantification and early detection of a commercial LiFePO4 cell cycled under dynamic driving schedule. J. Power Sources 2017, 356, 36–46. [Google Scholar] [CrossRef]
  29. Schmitt, C.; Kopljar, D.; Friedrich, K.A. Detailed investigation of degradation modes and mechanisms of a cylindrical high-energy Li-ion cell cycled at different temperatures. J. Energy Storage 2025, 120, 116486. [Google Scholar] [CrossRef]
  30. Olmos, J.; Gandiaga, I.; Saez-de-Ibarra, A.; Larrea, X.; Nieva, T.; Aizpuru, I. Modelling the cycling degradation of Li-ion batteries: Chemistry influenced stress factors. J. Energy Storage 2021, 40, 102765. [Google Scholar] [CrossRef]
  31. Soto, A.; Berrueta, A.; Mateos, M.; Sanchis, P.; Ursúa, A. Impact of micro-cycles on the lifetime of lithium-ion batteries: An experimental study. J. Energy Storage 2022, 55, 105343. [Google Scholar] [CrossRef]
  32. Huang, J.; Wang, S.; Xu, W.; Fernandez, C.; Fan, Y.; Chen, X. An Improved Rainflow Algorithm Combined with Linear Criterion for the Accurate Li-ion Battery Residual Life Prediction. Int. J. Electrochem. Sci. 2021, 16, 21075. [Google Scholar] [CrossRef]
  33. Fioriti, D.; Scarpelli, C.; Pellegrino, L.; Lutzemberger, G.; Micolano, E.; Salamone, S. Battery lifetime of electric vehicles by novel rainflow-counting algorithm with temperature and C-rate dynamics: Effects of fast charging, user habits, vehicle-to-grid and climate zones. J. Energy Storage 2023, 59, 106458. [Google Scholar] [CrossRef]
  34. Pérez, A.; San Martín, I.; Sanchis, P.; Ursúa, A. A novel aging modeling approach for second-life lithium-ion batteries. eTransportation 2025, 24, 100400. [Google Scholar] [CrossRef]
  35. Nuhic, A.; Terzimehic, T.; Soczka-Guth, T.; Buchholz, M.; Dietmayer, K. Health diagnosis and remaining useful life prognostics of lithium-ion batteries using data-driven methods. J. Power Sources 2013, 239, 680–688. [Google Scholar] [CrossRef]
  36. Singh, S.; Ebongue, Y.E.; Rezaei, S.; Birke, K.P. Hybrid Modeling of Lithium-Ion Battery: Physics-Informed Neural Network for Battery State Estimation. Batteries 2023, 9, 301. [Google Scholar] [CrossRef]
  37. Wang, F.; Zhai, Z.; Zhao, Z.; Di, Y.; Chen, X. Physics-informed neural network for lithium-ion battery degradation stable modeling and prognosis. Nat. Commun. 2024, 15, 4332. [Google Scholar] [CrossRef]
  38. Mayemba, Q.; Ducret, G.; Li, A.; Mingant, R.; Venet, P. General Machine Learning Approaches for Lithium-Ion Battery Capacity Fade Compared to Empirical Models. Batteries 2024, 10, 367. [Google Scholar] [CrossRef]
  39. Li, K.; Chen, X. Machine Learning-Based Lithium Battery State of Health Prediction Research. Appl. Sci. 2025, 15, 516. [Google Scholar] [CrossRef]
  40. Nieslony, A. Rainflow Counting Algorithm. Available online: https://www.mathworks.com/matlabcentral/fileexchange/3026-rainflow-counting-algorithm (accessed on 12 April 2025).
  41. ASTM E1049-85; Standard Practices for Cycle Counting in Fatigue Analysis. ASTM International: West Conshohocken, PA, USA, 2023.
  42. Vermeer, W.; Chandra Mouli, G.R.; Bauer, P. A Comprehensive Review on the Characteristics and Modeling of Lithium-Ion Battery Aging. IEEE Trans. Transp. Electrif. 2022, 8, 2205–2232. [Google Scholar] [CrossRef]
Figure 1. Methodology used to predict the lifespan of Li-ion battery.
Wevj 17 00245 g001
Figure 2. (a) Adapted flowchart of the Rainflow algorithm according to ASTM standard; (b) Typical diagram of stress events over time, red line, and a simple cycling analysis of the rain flow, dashed lines.
Wevj 17 00245 g002
Figure 3. LFP chemistry degradation curve.
Wevj 17 00245 g003
Figure 4. Degradation curve in the logarithmic domain.
Wevj 17 00245 g004
Figure 5. (a) The depth of discharge Routes data, for the different scenarios; (b) Zoomed-in section with detailed time and SoC scales.
Wevj 17 00245 g005aWevj 17 00245 g005b
Figure 6. (a) Example of the Route 1 with the varying electric braking kbr; (b) Zoomed-in section with detailed time and SoC scales.
Wevj 17 00245 g006
Figure 7. (a) Evolution of the total life across the kbr; (b) Absolute recovery in years for the respective electric braking; (c) Relative gains compared to each maximum DoD cycle.
Wevj 17 00245 g007aWevj 17 00245 g007b
Figure 8. (a) Evolution of the total mileage across the kbr; (b) Absolute recovery in mileage for the respective kbr; (c) Relative gains compared to each maximum DoD cycle.
Wevj 17 00245 g008aWevj 17 00245 g008b
Figure 9. (a) Total lifetime distance for each braking intensity; (b) Total lifespan for each lifetime distance.
Wevj 17 00245 g009
Table 1. Principal works analyzed, its modelling type and focus.
AuthorTitleModel TypeFocus
Ansean et al. [28]Operando lithium plating quantification and early detection of a commercial LiFePO4 cell cycled under dynamic driving scheduleSemi-empiricalDevelop a framework that combines electrochemical and mechanistic simulations to detect and quantify lithium plating in lithium-ion batteries.
Schmitt et al. [29]Detailed investigation of degradation modes and mechanisms of a cylindrical high-energy Li-ion cell cycled at different temperaturesSemi-empiricalAnalyse and compare non-invasive electrochemical techniques (dOCV, DVA, EIS+DRT) with post-mortem analysis in identifying degradation mechanisms in commercial 21700 Li-ion cells under different temperature conditions.
Olmos, J. et al. [30]Modelling the cycling degradation of Li-ion batteries: Chemistry influenced stress factorsEmpiricalEvaluates degradation by comparing empirical models for NMC and LFP lithium-ion batteries, considering various cycling stress factors.
A. Soto et al. [31]Impact of micro-cycles on the lifetime of lithium-ion batteries: An experimental studySemi-EmpiricalThis work investigates the effect of micro-cycles on the aging of li-ion batteries, and proposes a more accurate aging model that incorporates micro-cycles, rather than relying on energy throughput or EFC alone.
Huang J et al. [32]An Improved Rainflow Algorithm Combined with Linear Criterion for the Accurate Li-ion Battery Residual Life PredictionSemi-empiricalIntroduces an improved Rainflow algorithm for accurately counting Li-ion battery cycles and predicting their life, without requiring complex tests or special equipment.
D. Fioriti et al. [33]Battery lifetime of electric vehicles by novel rainflow-counting algorithm with temperature and C-rate dynamics: Effects of fast charging, user habits, vehicle-to-grid and climate zonesSemi-empiricalThe study develops a model to predict battery degradation, considering cycling, calendar life, temperature, and current, using Rainflow-counting.
A. Pérez et al. [34]A novel aging modeling approach for second-life lithium-ion batteriesSemi-empiricalThe study presents a degradation modelling methodology for second-life lithium-ion batteries that predicts capacity and internal resistance without prior usage history by identifying aging stages and using linear models for capacity fade and resistance increase.
A. Nuhic et al. [35]Health diagnosis and remaining useful life prognostics of lithium-ion batteries using data-driven methodsSemi-empiricalThis study presents a data-driven method using Support Vector Regression (SVR) to estimate battery health and predict remaining useful life in automotive applications.
S. Singh et al.
[36]
Hybrid Modeling of Lithium-Ion Battery: Physics-Informed Neural Network for Battery State Estimation
Physics-informed Neural networksThe work proposes a Physics-Informed Neural Network (PINN) model to estimate SOC and SOH by combining physical laws with machine learning.
Wang, F. et al.
[37]
Physics-informed neural network for lithium-ion battery degradation stable modeling and prognosisPhysics-informed Neural networksThis study introduces an accurate and stable SOH estimation of lithium-ion batteries using a PINN model combining empirical degradation attributes and neural networks.
Q. Mayemba et al.
[38]
General Machine Learning Approaches for Lithium-Ion Battery Capacity Fade Compared to Empirical ModelsMachine learningThis work develops machine learning models to predict lithium-ion battery capacity loss across different aging conditions, introducing novel input features and architectures, and compares their performance with existing empirical models.
K. Li et al.
[39]
Machine Learning-Based Lithium Battery State of Health Prediction ResearchMachine learningThis study predicts the state of health (SOH) of lithium-ion batteries. Long Short-Term Memory (LSTM), Convolutional Neural Networks (CNN), and Support Vector Regression (SVR) models were evaluated, with parameters optimized using Particle Swarm Optimization (PSO). Key health indicators were extracted from voltage, current, and temperature data to track battery degradation.
Table 2. Findings and Gaps.
AuthorFindingsGaps
Ansean et al. [28]The study found that the loss of active material in the negative electrode causes cell imbalance and lithium plating, and that cell degradation follows a two-stage capacity fade, accelerated by lithium plating.The study identified a gap in understanding the full impact of regenerative braking on cell degradation and the need for further investigation into how intercalation/deintercalation processes affect lithium-ion battery life.
Schmitt et al. [29]LLI was identified as the dominant degradation mode at all temperatures.
LAM was more evident at higher temperatures due to higher cycling.
Li plating was observed, especially in the core of the anode at 10 °C.
Non-invasive methods successfully identified degradation trends, but some degradation (e.g., cathode LAM) was masked by LLI.
Design flaws (e.g., absence of center pin) led to uneven aging and deformation.
Non-invasive methods, while useful, can miss or underestimate certain degradation modes, like cathode LAM.
There is a need to improve plating detection without relying on post-mortem analysis.
Cell design limitations (e.g., lack of center pin) contribute to inhomogeneous aging, suggesting a need for optimized structural designs.
Olmos, J. et al. [30]The study found that the degradation of NMC and LFP batteries is primarily influenced by factors like depth-of-discharge and temperature, with NMC having a higher life expectancy at lower DOD and temperature, while LFP is more sensitive to charge/discharge current rates.The study misses some stress factors, like charging strategies, and does not consider all degradation phases. It could also improve by adding more data, such as calendar degradation or internal resistance, to make the model more accurate.
A. Soto et al. [31]The study experimentally demonstrated that cells subjected to micro-cycles have a 31% to 50% longer lifespan than those subjected only to full charge/discharge cycles, suggesting that micro-cycles positively influence the longevity of lithium-ion batteries.The study reveals gaps in the literature regarding the impact of micro-cycles on battery degradation, lacks broader validation of the proposed methodology for other battery types, and contradicts traditional aging models that do not account for micro-cycles.
Huang J et al. [32]The study demonstrates that the Rainflow algorithm accurately counts Li-ion battery cycles, and the linear prediction method provides highly precise life predictions, with errors under 2.53%, offering a simple and efficient solution for real-time battery health monitoring in various fields.The study does not consider the limitations of the improved Rainflow algorithm in complex battery scenarios or the effect of environmental factors on battery life. It also does not compare its method with other life prediction approaches.
D. Fioriti et al. [33]The model predicts battery lifetimes of 10–20 years for typical commuter use, with accuracy improving by modeling temperature and C-rate dynamics and shows that heavy usage and highway driving can shorten battery life by 1–2 years.The study does not consider the effects of different battery chemistries, lacks large-scale experimental data for validation, which limits its general accuracy in real-world conditions.
A. Pérez et al. [34]The model is validated across a broad range of states of health (95–20%) and conditions, achieving accurate predictions with RMSE and MAPE values well within acceptable limits for both capacity and internal resistance in both lab and real-world scenarios.The model’s applicability may be limited for extreme temperatures or C-rates above 2C. Further research is needed to explore its compatibility with different battery chemistries and irregular charging/discharging patterns over long periods.
A. Nuhic et al. [35]The method learns battery degradation using real driving data, achieves accurate SOH and RUL predictions, and is enhanced by using load collectives and rainflow algorithms to represent battery usage.The study’s gaps include limited data for complex scenarios, no uncertainty estimates in the model, lack of testing on different battery chemistries, and inefficiency for real-time applications.
S. Singh et al.
[36]
The developed model achieves low error margins for SOC (0.014–0.2%) and SOH (1.1–2.3%) even with limited training data, and provides accurate predictions in unseen scenarios.This study has limited validation across different battery chemistries, extreme operating conditions, and long-term degradation scenarios, requiring further testing for generalization.
Wang, F. et al.
[37]
This method achieved a Mean Absolute Percentage Error (MAPE) of 0.87% for SOH estimation across 387 batteries and performed well in regular, small sample, and transfer experiments.The author does not explicitly mention limitations. The model was tested on 55 NCM cells and additional batteries from other manufacturers, but its performance across different chemistries, charge protocols, and operating conditions remains unclear.
Q. Mayemba et al.
[38]
The machine learning models accurately predicted capacity loss, outperforming empirical models with Root Mean Squared Errors (RMSEs), between 1.3% and 2.7%. They proved robustness across all datasets and different aging conditions. The use of novel input features and autoencoders improved the ability to capture complex degradation patterns.The study only considered li-ion cells under the selected datasets and aging conditions. Other machine learning architectures or additional input features could be explored, and further testing on wider or more diverse real-world scenarios would help generalize the results.
K. Li et al.
[39]
PSO-LSTM achieved the best results (Mean Absolute Error (MAE) is 0.67%, RMSE 0.94%, MAPE 45.82%). PSO-CNN performed well in stable regions but showed reduced accuracy during sudden fluctuations, while PSO-SVR captured general trends with larger errors in volatile areas. PSO optimization improved accuracy and stability across all models.The study is limited by experiments on single batteries under controlled conditions, testing only three models. SOH estimation was performed in isolation, while integration with other battery states and evaluation across diverse battery types and operating conditions warrants further investigation.
Disclaimer/Publisher’s Note: The statements, opinions and data contained in all publications are solely those of the individual author(s) and contributor(s) and not of MDPI and/or the editor(s). MDPI and/or the editor(s) disclaim responsibility for any injury to people or property resulting from any ideas, methods, instructions or products referred to in the content.