1. Introduction
With the rapid development of intelligent vehicles and autonomous driving, real-time driver state monitoring has become a core safety function. Facial keypoint localization is the foundation for eye tracking, head pose estimation, fatigue detection, and attention analysis in intelligent cockpits, which are further crucial for analyzing abnormal driver behavior [
1], detecting driver distraction [
2], and estimating driver emotional states and gaze direction [
3]—key elements of in-vehicle safety systems. However, in-vehicle environments pose severe challenges: uneven illumination, large head pose variations, partial occlusions (e.g., glasses, masks), and extremely limited computing resources on embedded CPU-only platforms. These challenges directly affect the performance of driver monitoring technologies, making it difficult for existing methods to meet the practical requirements of real vehicular scenarios [
4].
Facial keypoint localization is a fundamental task in computer vision and intelligent transportation systems. It aims to detect key facial structures such as eyes, eyebrows, nose, mouth, and facial contour, providing essential support for driver monitoring, fatigue detection, gesture recognition, and human–computer interaction in intelligent cockpits. Gaze estimation, as a core application of facial keypoint localization, has attracted extensive research attention in recent years, with studies focusing on improving accuracy, robustness, and adaptability to complex in-vehicle environments [
5,
6,
7]. Face recognition and analysis technologies, including facial keypoint localization and gaze estimation, have been widely applied in security surveillance, human–computer interaction, intelligent access control, autonomous driving, and medical assistance systems [
4], among which accurate and efficient face detection and facial landmark localization are fundamental prerequisites for high-level facial analysis tasks.
Existing research on driver state monitoring and gaze estimation has made remarkable progress but still faces significant limitations. For instance, Thesniyom et al. [
1] proposed a method to analyze abnormal driver behavior through gaze direction and blinking, highlighting the importance of accurate gaze and facial feature detection for driver safety, but their method lacked robustness under complex in-vehicle conditions. Huang et al. [
2] developed a driver distraction detection method based on fusion enhancement and global saliency optimization, which improved detection accuracy but relied on complex computing resources that are not suitable for embedded platforms. Fedullo et al. [
3] explored the use of artificial intelligence and sensor fusion for eye tracking and driver emotional state estimation, demonstrating the potential of multi-modal fusion but failing to address the problem of high computational latency on CPU-only devices.
In terms of gaze estimation, traditional methods and recent advanced approaches also have obvious shortcomings. Guestrin and Eizenman [
5] proposed a general theory of remote gaze estimation using the pupil center and corneal reflections, laying a foundation for gaze estimation technology, but this method is sensitive to illumination changes and occlusions. Recent studies have proposed various improved gaze estimation methods: Wu et al. [
6] designed a modulation-based adaptive network with auxiliary self-learning for gaze estimation, achieving high accuracy but requiring substantial computing resources; Hu et al. [
8] proposed a dual-branch dynamic feature interaction network for gaze estimation, which enhanced feature representation but still struggled with extreme head poses; and Zhong et al. [
9] developed GazeSymCAT, a symmetric cross-attention transformer for robust gaze estimation under extreme head poses and gaze variations, but its complex transformer structure leads to high latency. Bendimered et al. [
7] proposed Dual Focus-3D, a hybrid deep learning approach for robust 3D gaze estimation, which improved accuracy through multi-modal fusion but was not suitable for lightweight deployment.
Beyond these, other gaze estimation studies also have limitations in adapting to in-vehicle scenarios: Wang et al. [
10] proposed a method for driver’s head pose and gaze zone estimation based on multi-zone templates registration and multi-frame point cloud fusion, which improved robustness but had low real-time performance; Cheng et al. [
11] presented a comprehensive vision solution for in-vehicle gaze estimation, but it relied on GPU acceleration; Abdelrahman et al. [
12] developed Mobgazenet, a lightweight gaze estimation mobile network based on progressive attention mechanisms, which enhanced efficiency but still had insufficient accuracy under complex occlusions; and Wu et al. [
13] proposed a multi-task driver gaze estimation method for real-world driving scenes, which improved adaptability but required large-scale training data. Additionally, Plomecka et al. [
14] explored predicting gaze position using deep learning of electroencephalography data, which provided a new direction but was not suitable for real-time in-vehicle deployment due to the need for additional sensors. Wang et al. [
15] proposed generalizing eye tracking with Bayesian adversarial learning, which improved generalization but had high computational complexity; Niu et al. [
16] developed a lightweight network for real-time localization and matching of corneal reflections for gaze estimation, which solved the real-time problem but lacked robustness under extreme poses.
In summary, existing methods still have obvious limitations in adapting to in-vehicle scenarios: Traditional handcrafted feature-based methods are computationally efficient but lack accuracy and robustness under complex in-vehicle conditions (e.g., uneven illumination, partial occlusion) [
17]. Deep learning-based methods, including recent gaze estimation approaches, achieve high precision but rely on powerful GPUs, failing to meet real-time requirements on resource-constrained vehicle-embedded CPU-only platforms [
6,
7,
9]. Therefore, it is urgent to develop a lightweight, robust, and accurate facial keypoint localization method suitable for real vehicular applications.
To address these limitations, this paper proposes a novel TSDM (T-shaped feature + SDM) framework that integrates T-shaped features with the Supervised Descent Method (SDM) [
18]. The T-shaped feature design is inspired by the spatial distribution of facial components, providing a more expressive structural representation than conventional rectangular features [
19,
20]. By combining improved feature design with efficient optimization-based landmark localization, the proposed method achieves a favorable balance between accuracy, robustness, and real-time performance, effectively solving the pain points of existing methods in in-vehicle scenarios—overcoming the high latency of deep learning methods [
17] and the low accuracy of traditional handcrafted feature methods [
6] and better adapting to the complex in-vehicle environment with uneven illumination, pose variations, and occlusions.
The main contributions of this work are summarized as follows:
A novel T-shaped feature is proposed to better capture facial geometric structures and improve robustness against illumination and pose variations;
An end-to-end TSDM framework is constructed by integrating T-shaped features, AdaBoost cascade detection, and SDM alignment for 68-point facial keypoint localization;
The proposed method achieves superior performance on CPU-only platforms with high accuracy, low false positives, and real-time speed, making it suitable for driver monitoring systems.
2. Related Work
2.1. Traditional Face Detection Methods
Traditional face detection methods are mainly based on handcrafted features such as Haar-like features, Local Binary Pattern (LBP), and Local Binary Pattern Histogram (LBPH). The Viola-Jones framework, which combines Haar-like features with AdaBoost classifiers, is efficient in real-time detection but lacks sufficient structural representation, making it less robust under complex backgrounds, occlusions, and illumination variations [
17]. LBPH improves texture description but performs poorly under illumination and pose changes, while traditional LBP methods also suffer from limited feature expressiveness. These traditional methods, although computationally efficient, cannot meet the accuracy requirements of in-vehicle driver monitoring systems, especially in the presence of partial occlusions (e.g., glasses, masks) and uneven illumination—key challenges highlighted in recent driver behavior and gaze estimation studies [
1].
2.2. Facial Landmark Localization Methods
The Supervised Descent Method (SDM), proposed by Xiong et al. [
18], is a classic optimization-based face alignment method with fast convergence and low computational complexity. It formulates landmark localization as a nonlinear least-squares optimization problem and iteratively refines landmark positions through learned descent directions, remaining competitive for real-time facial alignment tasks [
21]. However, its performance depends heavily on the quality of face detection and initial bounding boxes, which limits its stability in complex in-vehicle environments. As a fundamental technology for gaze estimation and driver state monitoring, facial landmark localization’s accuracy directly affects the performance of subsequent high-level tasks, making it crucial to improve the robustness of SDM in complex scenarios [
1].
2.3. Gaze Estimation as a Core Application of Facial Keypoint Localization
Facial keypoint localization is the fundamental prerequisite for gaze estimation, especially in in-vehicle driver monitoring scenarios—accurate detection of eye, eyebrow, and facial contour keypoints directly determines the performance of gaze direction estimation, driver distraction detection, and abnormal behavior analysis [
1,
10,
13]. Therefore, reviewing the research status of gaze estimation can better highlight the core requirements and existing pain points of facial keypoint localization in practical applications.
Gaze estimation methods, whether traditional geometric-based or modern deep learning-based, are highly dependent on high-quality facial keypoint localization results. Traditional gaze estimation methods mainly rely on geometric features derived from facial keypoints (e.g., pupil center and corneal reflections), among which Guestrin and Eizenman [
5] proposed a general theory of remote gaze estimation using the pupil center and corneal reflections—this method relies heavily on accurate localization of eye keypoints, but it is sensitive to illumination changes and occlusions, which essentially reflects the lack of robustness of traditional facial keypoint localization methods [
5]. Niu et al. [
16] improved traditional geometric methods by proposing a lightweight network for real-time localization and matching of corneal reflections, but their method still lacked robustness under extreme poses, mainly because the facial keypoint localization module used in their framework failed to adapt to complex pose variations [
16].
With the development of deep learning, various gaze estimation methods have been proposed to improve accuracy and robustness, but their performance bottleneck still lies in facial keypoint localization. Wu et al. [
6] designed a modulation-based adaptive network with auxiliary self-learning for gaze estimation, which achieved high accuracy but required substantial computing resources—this is not only due to the complexity of the gaze estimation network itself, but also because the facial keypoint localization module they adopted (a lightweight deep learning model) still had high latency [
6]. Hu et al. [
8] proposed a dual-branch dynamic feature interaction network for gaze estimation, which struggled with extreme head poses, mainly because the facial keypoint localization module failed to accurately capture facial structural features under large pose variations [
8]. Zhong et al. [
9] developed GazeSymCAT, a symmetric cross-attention transformer for robust gaze estimation under extreme head poses, but its complex structure led to high latency, and the lack of an efficient facial keypoint localization module further limited its deployment in embedded systems [
9].
Hybrid and lightweight gaze estimation methods, which are more suitable for in-vehicle scenarios, also highlight the importance of efficient and accurate facial keypoint localization. Bendimered et al. [
7] proposed Dual Focus-3D, a hybrid deep learning approach for robust 3D gaze estimation, which combined eye image features with 3D head orientation data—but its poor lightweight deployment capability was partly due to the inefficient facial keypoint localization module [
7]. Abdelrahman et al. [
12] developed Mobgazenet, a lightweight gaze estimation mobile network, which enhanced efficiency but still had insufficient accuracy under complex occlusions because the facial keypoint localization module could not effectively handle occluded facial features [
12]. Wu et al. [
13] proposed a multi-task driver gaze estimation method for real-world driving scenes, which required large-scale training data partly because the facial keypoint localization module lacked strong generalization ability [
13].
Other related studies further confirm the close correlation between gaze estimation and facial keypoint localization. Wang et al. [
10] proposed a method for driver’s head pose and gaze zone estimation, which had low real-time performance due to the low efficiency of its built-in facial keypoint localization module [
10]. Cheng et al. [
11] presented a comprehensive vision solution for in-vehicle gaze estimation, which relied on GPU acceleration partly because its facial keypoint localization module was computationally intensive [
11]. Fedullo et al. [
3] explored sensor fusion for eye tracking and driver emotional state estimation but failed to address high latency on CPU-only devices, which was also related to the inefficient facial keypoint localization module [
3]. Thesniyom et al. [
1] analyzed abnormal driver behavior through gaze direction and blinking, highlighting that the lack of robustness of facial keypoint localization directly affected the accuracy of gaze estimation. Plomecka et al. [
14] and Wang et al. [
10] proposed gaze estimation methods based on electroencephalography data and Bayesian adversarial learning, respectively, but their high complexity or reliance on additional sensors further confirms the need for an efficient, robust facial keypoint localization method to support practical gaze estimation in in-vehicle scenarios.
2.4. Lightweight Deep Learning Methods for Facial Keypoint Localization
With the rise of deep learning, approaches such as MTCNN [
22], Stacked Hourglass Networks [
23], boundary-aware alignment methods [
24], and 3D-aware facial landmark detection models [
25] have achieved remarkable accuracy improvements. In recent years, lightweight models such as PFLD, SAN, Lite-HRNet, PIPNet, and DamoFD have been proposed to reduce computational complexity, aiming to adapt to resource-constrained scenarios [
26,
27,
28,
29]. However, these methods still rely on large-scale training data and substantial computational resources, suffering from high latency when deployed on CPU-only embedded platforms, making them difficult to apply in in-vehicle driver monitoring systems. This limitation is consistent with the challenges faced by deep learning-based gaze estimation methods [
6,
11,
14], which further confirms the need for a lightweight and efficient facial keypoint localization method.
2.5. Summary of Related Work and Research Motivation
Existing methods have obvious limitations in adapting to in-vehicle facial keypoint localization and related gaze estimation tasks: Traditional handcrafted feature-based methods (Haar-like, LBP, and LBPH) are efficient but lack accuracy and robustness under complex in-vehicle conditions (uneven illumination, partial occlusion, and pose variations). Traditional gaze estimation methods [
5,
16] are sensitive to environmental changes and occlusions. Deep learning-based methods (including lightweight models and gaze estimation approaches [
6,
9,
12,
13]) achieve high precision but cannot meet real-time requirements on CPU-only embedded platforms due to high latency. Hybrid and multi-modal methods [
7,
10,
13] either lack lightweight deployment capability or require additional sensors, making them unsuitable for real in-vehicle scenarios.
Recent studies [
1,
3,
16] have further highlighted the urgent need for lightweight, robust, and accurate facial keypoint localization methods that can adapt to complex in-vehicle environments. To solve these problems, this paper proposes the TSDM framework, which combines the advantages of handcrafted structural features (T-shaped features [
19,
20]) and optimization-based localization (SDM [
18]), realizing a balance between real-time performance, robustness, and accuracy. Compared with existing methods, TSDM avoids the high latency of deep learning models and the low accuracy of traditional handcrafted feature methods and better adapts to the complex in-vehicle environment—effectively addressing the core pain points of existing methods in in-vehicle driver monitoring and gaze estimation scenarios.
3. T-Shaped Feature–Based Matching
The work of Viola and Jones demonstrated the effectiveness of Haar-like features in the field of face detection, as they enable fast and robust face detection [
17]. Their method is based on integral images and employs AdaBoost as the learning algorithm. Viola and Jones developed a framework using Haar descriptors, in which the contrast differences between several adjacent rectangular regions within a fixed-size window are computed while scanning the entire image. Through the design of a cascaded classifier, the framework can rapidly reject non-target regions, thereby significantly improving detection efficiency. The main advantage of Haar descriptors lies in their simplicity. However, this technique requires a large number of Haar filters; for example, more than 160,000 detectors can be generated within a window of size (24, 24). Scanning all pixels in each window across an image is therefore computationally expensive. As shown in Equation (1) below, the use of integral images enables rapid feature computation, thereby significantly accelerating the detection process.
Here, (
II) denotes the integral image of (
I). Among all generated Haar descriptors, only a limited subset provides good performance for face detection. The AdaBoost classifier iteratively combines weak classifiers into a strong classifier, thereby making this process more efficient [
17].
In complex scenarios, the detection accuracy and robustness of Haar-like features still require further improvement. Over the past decades, researchers have continuously sought to enhance the performance of Haar-like rectangular features while also exploring novel feature design strategies [
19,
20].
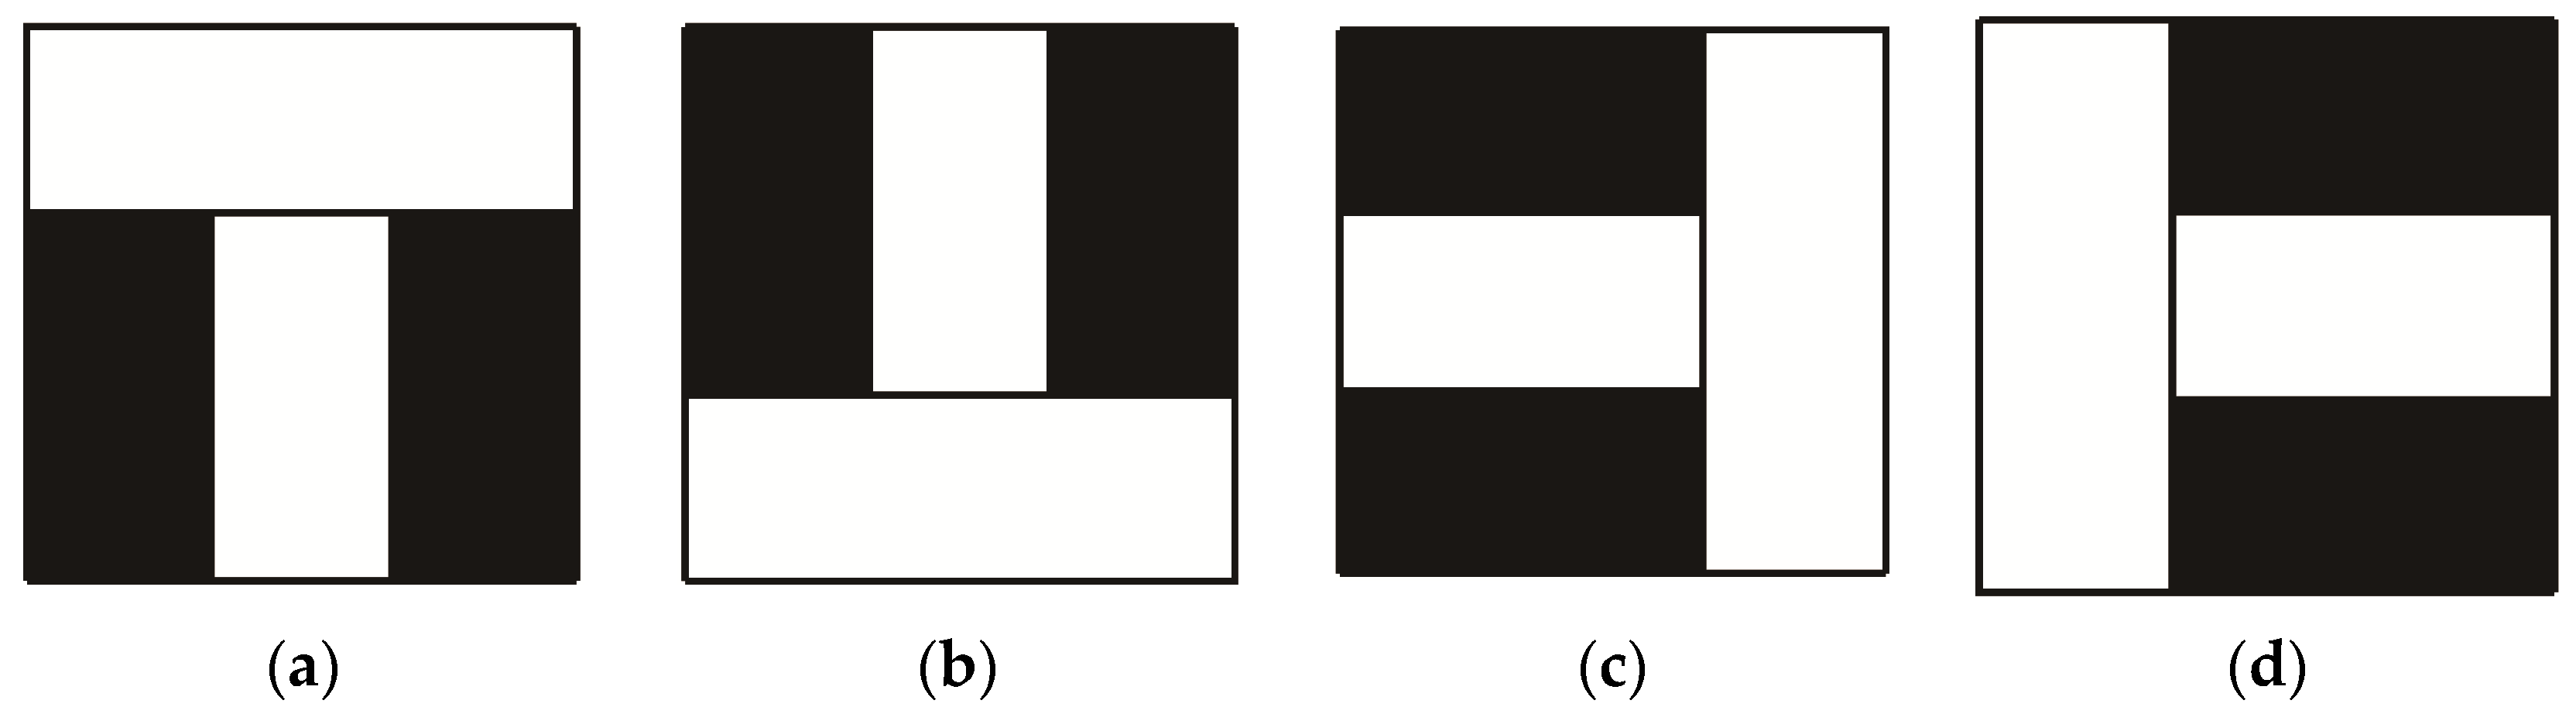
The design of the T-shaped features is inspired by the spatial distribution characteristics of facial components, as T-shaped structures frequently appear in human faces. For instance, regions such as the eyes and nose often exhibit T-shaped distribution patterns. Based on this observation, four types of T-shaped features were proposed, which are slightly more complex than traditional Haar-like features, as illustrated in
Figure 1.
These features describe local facial structures by computing the sums or differences in pixel intensity values within T-shaped regions.
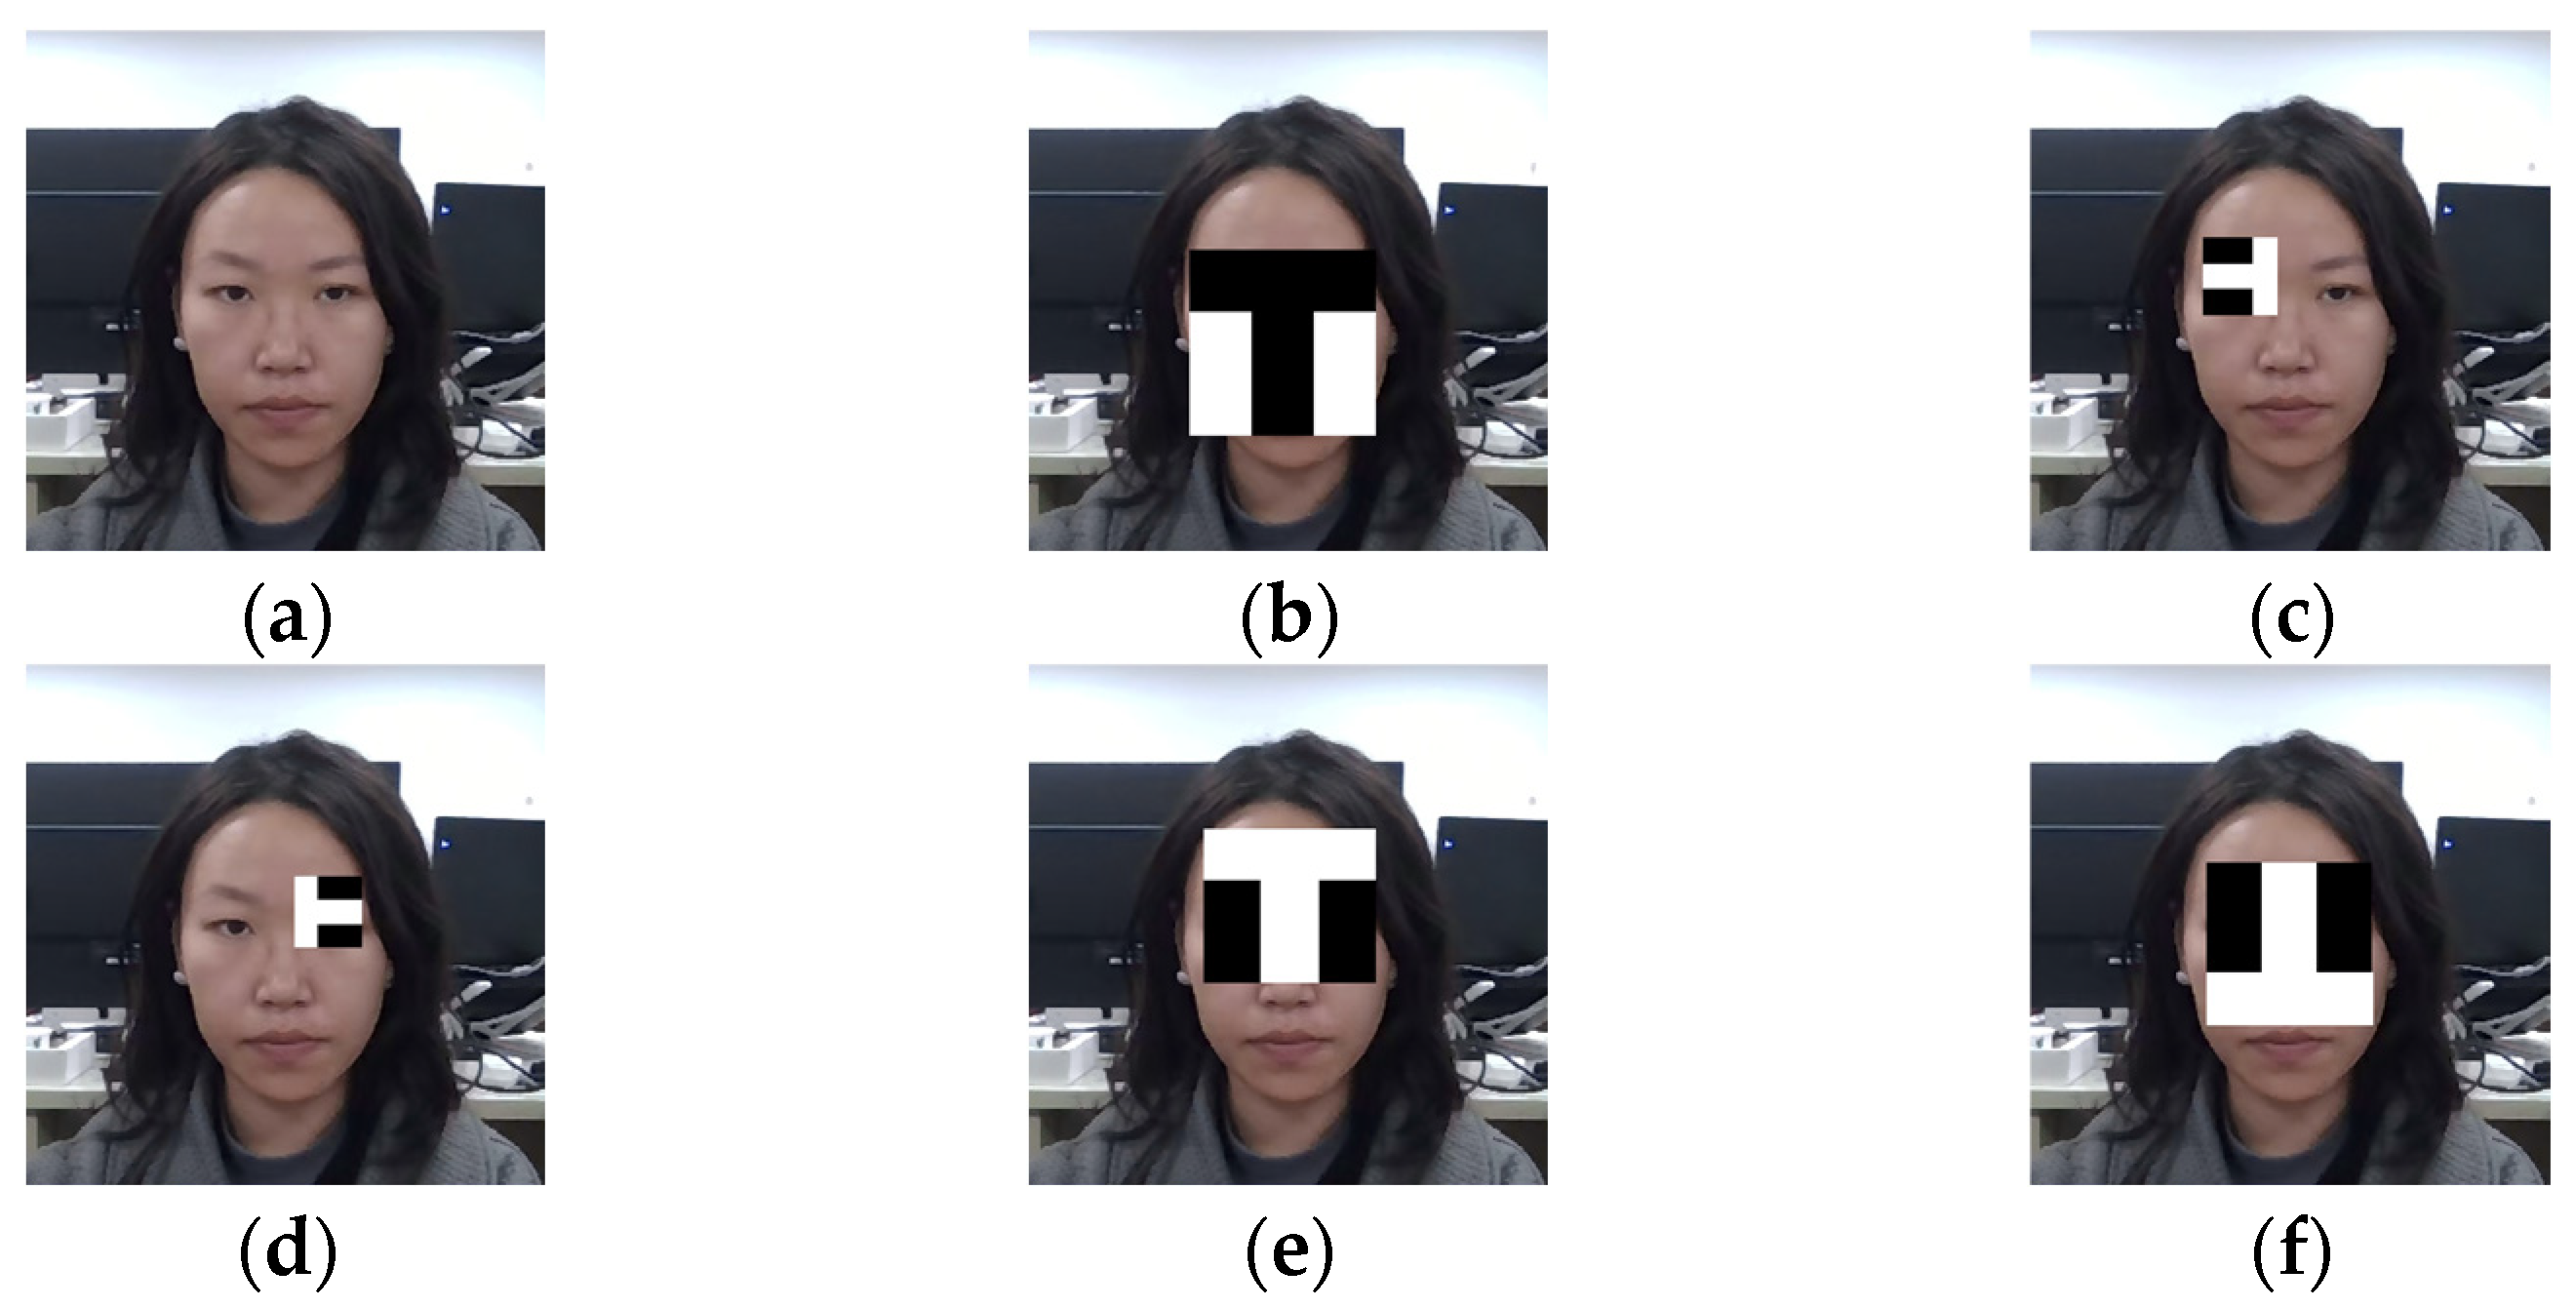
As shown in the face image in
Figure 2a, this study takes it as an example to analyze the overall distribution of facial components and the grayscale patterns of local features.
- 1.
T-Shaped Structure of the Overall Distribution of Facial Components
Figure 2b illustrates the overall distribution of facial components. The facial skin regions generally exhibit lower grayscale values, corresponding to the white areas on the left and right sides of the face, whereas the eyes, eyebrows, mouth, and nose have relatively higher grayscale values and are therefore distributed within the T-shaped region. This grayscale contrast effectively captures the global distribution of facial components.
- 2.
T-Shaped Structure of the Eye and Nasal Bridge Region
Figure 2c and
Figure 2d respectively illustrate the grayscale characteristics of the eye, eyebrow, and nasal bridge regions in the left and right halves of the face. Unlike the pattern shown in
Figure 2b, the grayscale values within the T-shaped region are generally lighter than those of the eyes and eyebrows. This variation in grayscale distribution enables the T-shaped features to effectively capture the structural characteristics of the eye and nasal bridge regions.
- 3.
T-Shaped Structure of the Forehead and Nose Region
Different from the pattern shown in
Figure 2b,
Figure 2e shows that the grayscale values within the T-shaped region are relatively lighter, while those in the rectangular regions on both sides are darker. In this case, the forehead and nose regions can be regarded as forming a positive white T-shaped pattern. Such grayscale contrasts enable effective characterization of the structural features of the forehead and nose regions.
- 4.
T-Shaped Structure of the Eye and Eyebrow Region
As shown in
Figure 2f, the eye and eyebrow regions of the face typically exhibit higher grayscale values, while the nose region has lower grayscale values, forming an inverted T-shaped pattern with the nose as the intersection point. This grayscale contrast highlights the prominence of the eyes and eyebrows in facial structures and provides an important basis for the extraction of T-shaped features.
In summary, T-shaped features exhibit a high degree of theoretical consistency with both the global distribution and local characteristics of facial components. These features not only effectively capture local structural information of the face but also maintain strong robustness in complex image backgrounds. Therefore, T-shaped features possess significant application potential in the field of face detection, providing a solid theoretical foundation for subsequent research and practical applications.
The computation of integral images effectively improves the efficiency of Haar-like feature value calculation. Haar-like features can be regarded as being composed of two to three rectangular regions, and the sum of grayscale values of all pixels within these regions can be rapidly computed using integral image calculations [
3].
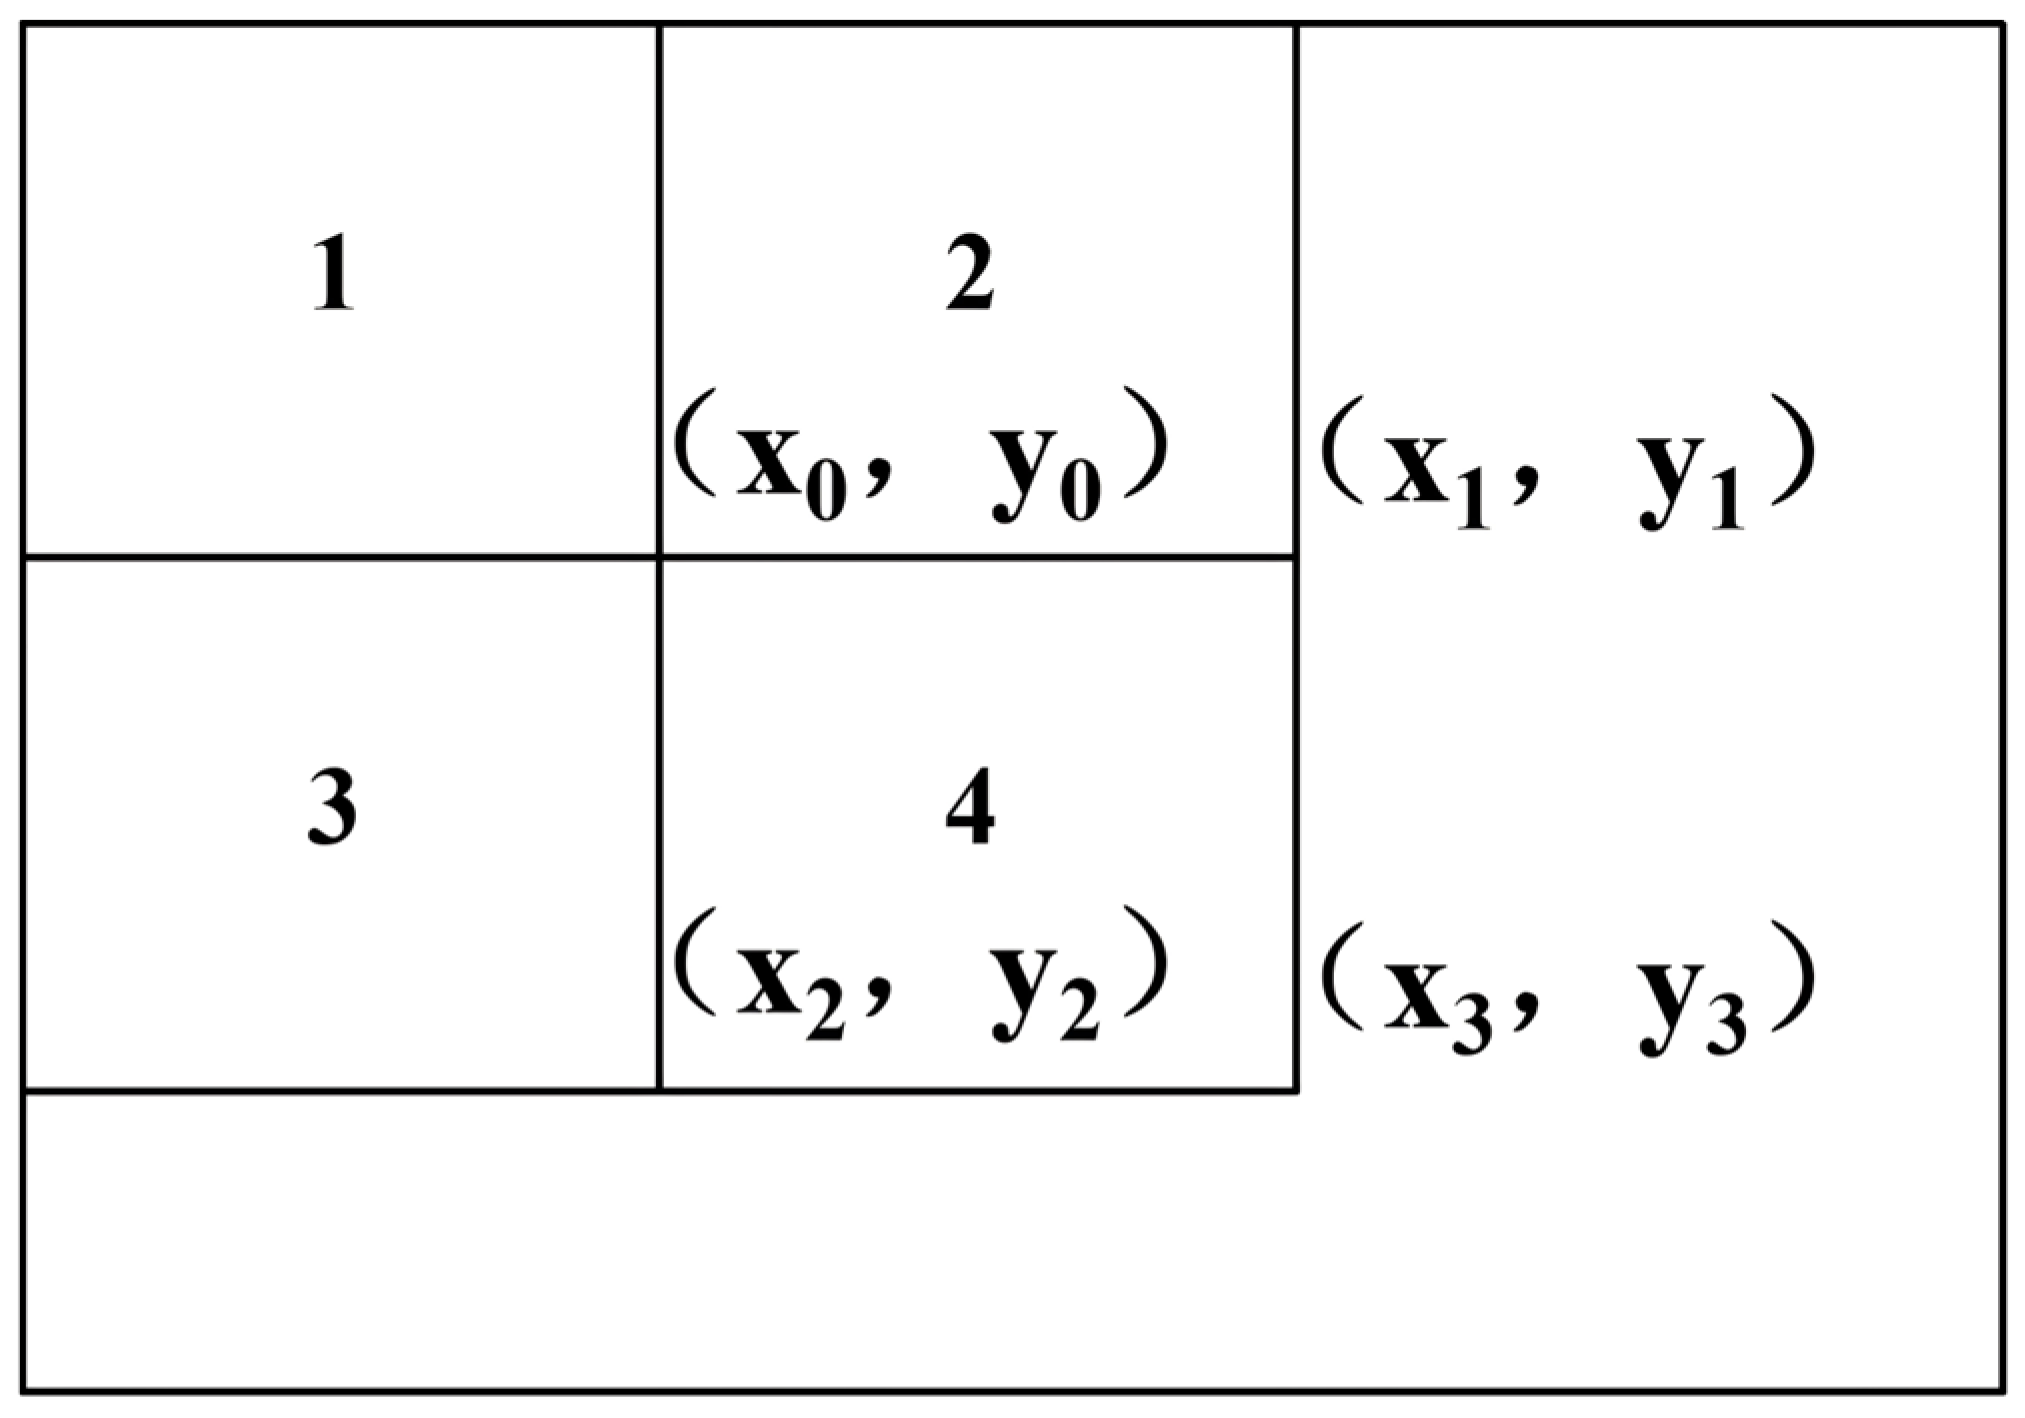
Taking the integral image shown in
Figure 3 as an example, let the four vertices of rectangle 4 be denoted as (a
0,b
0), (a
1,b
1), (a
2,b
2), and (a
3,b
3). The sum of pixel intensity values within rectangle 4 can then be computed using Equation (2) as follows:
From the above expression, (II) denotes the integral image of (I), and (II(a, b)) represents the sum of grayscale values of all pixels located in the upper-left region of pixel (a, b).
The Haar-like feature value can be computed using Equation (3) as follows:
In the above equation, denotes the feature value of the Haar-like feature, i represents the i-th rectangle, denotes the weight assigned to the i-th rectangle, is the sum of grayscale values of all pixels within the i-th rectangle, and N is the number of rectangles in the image.
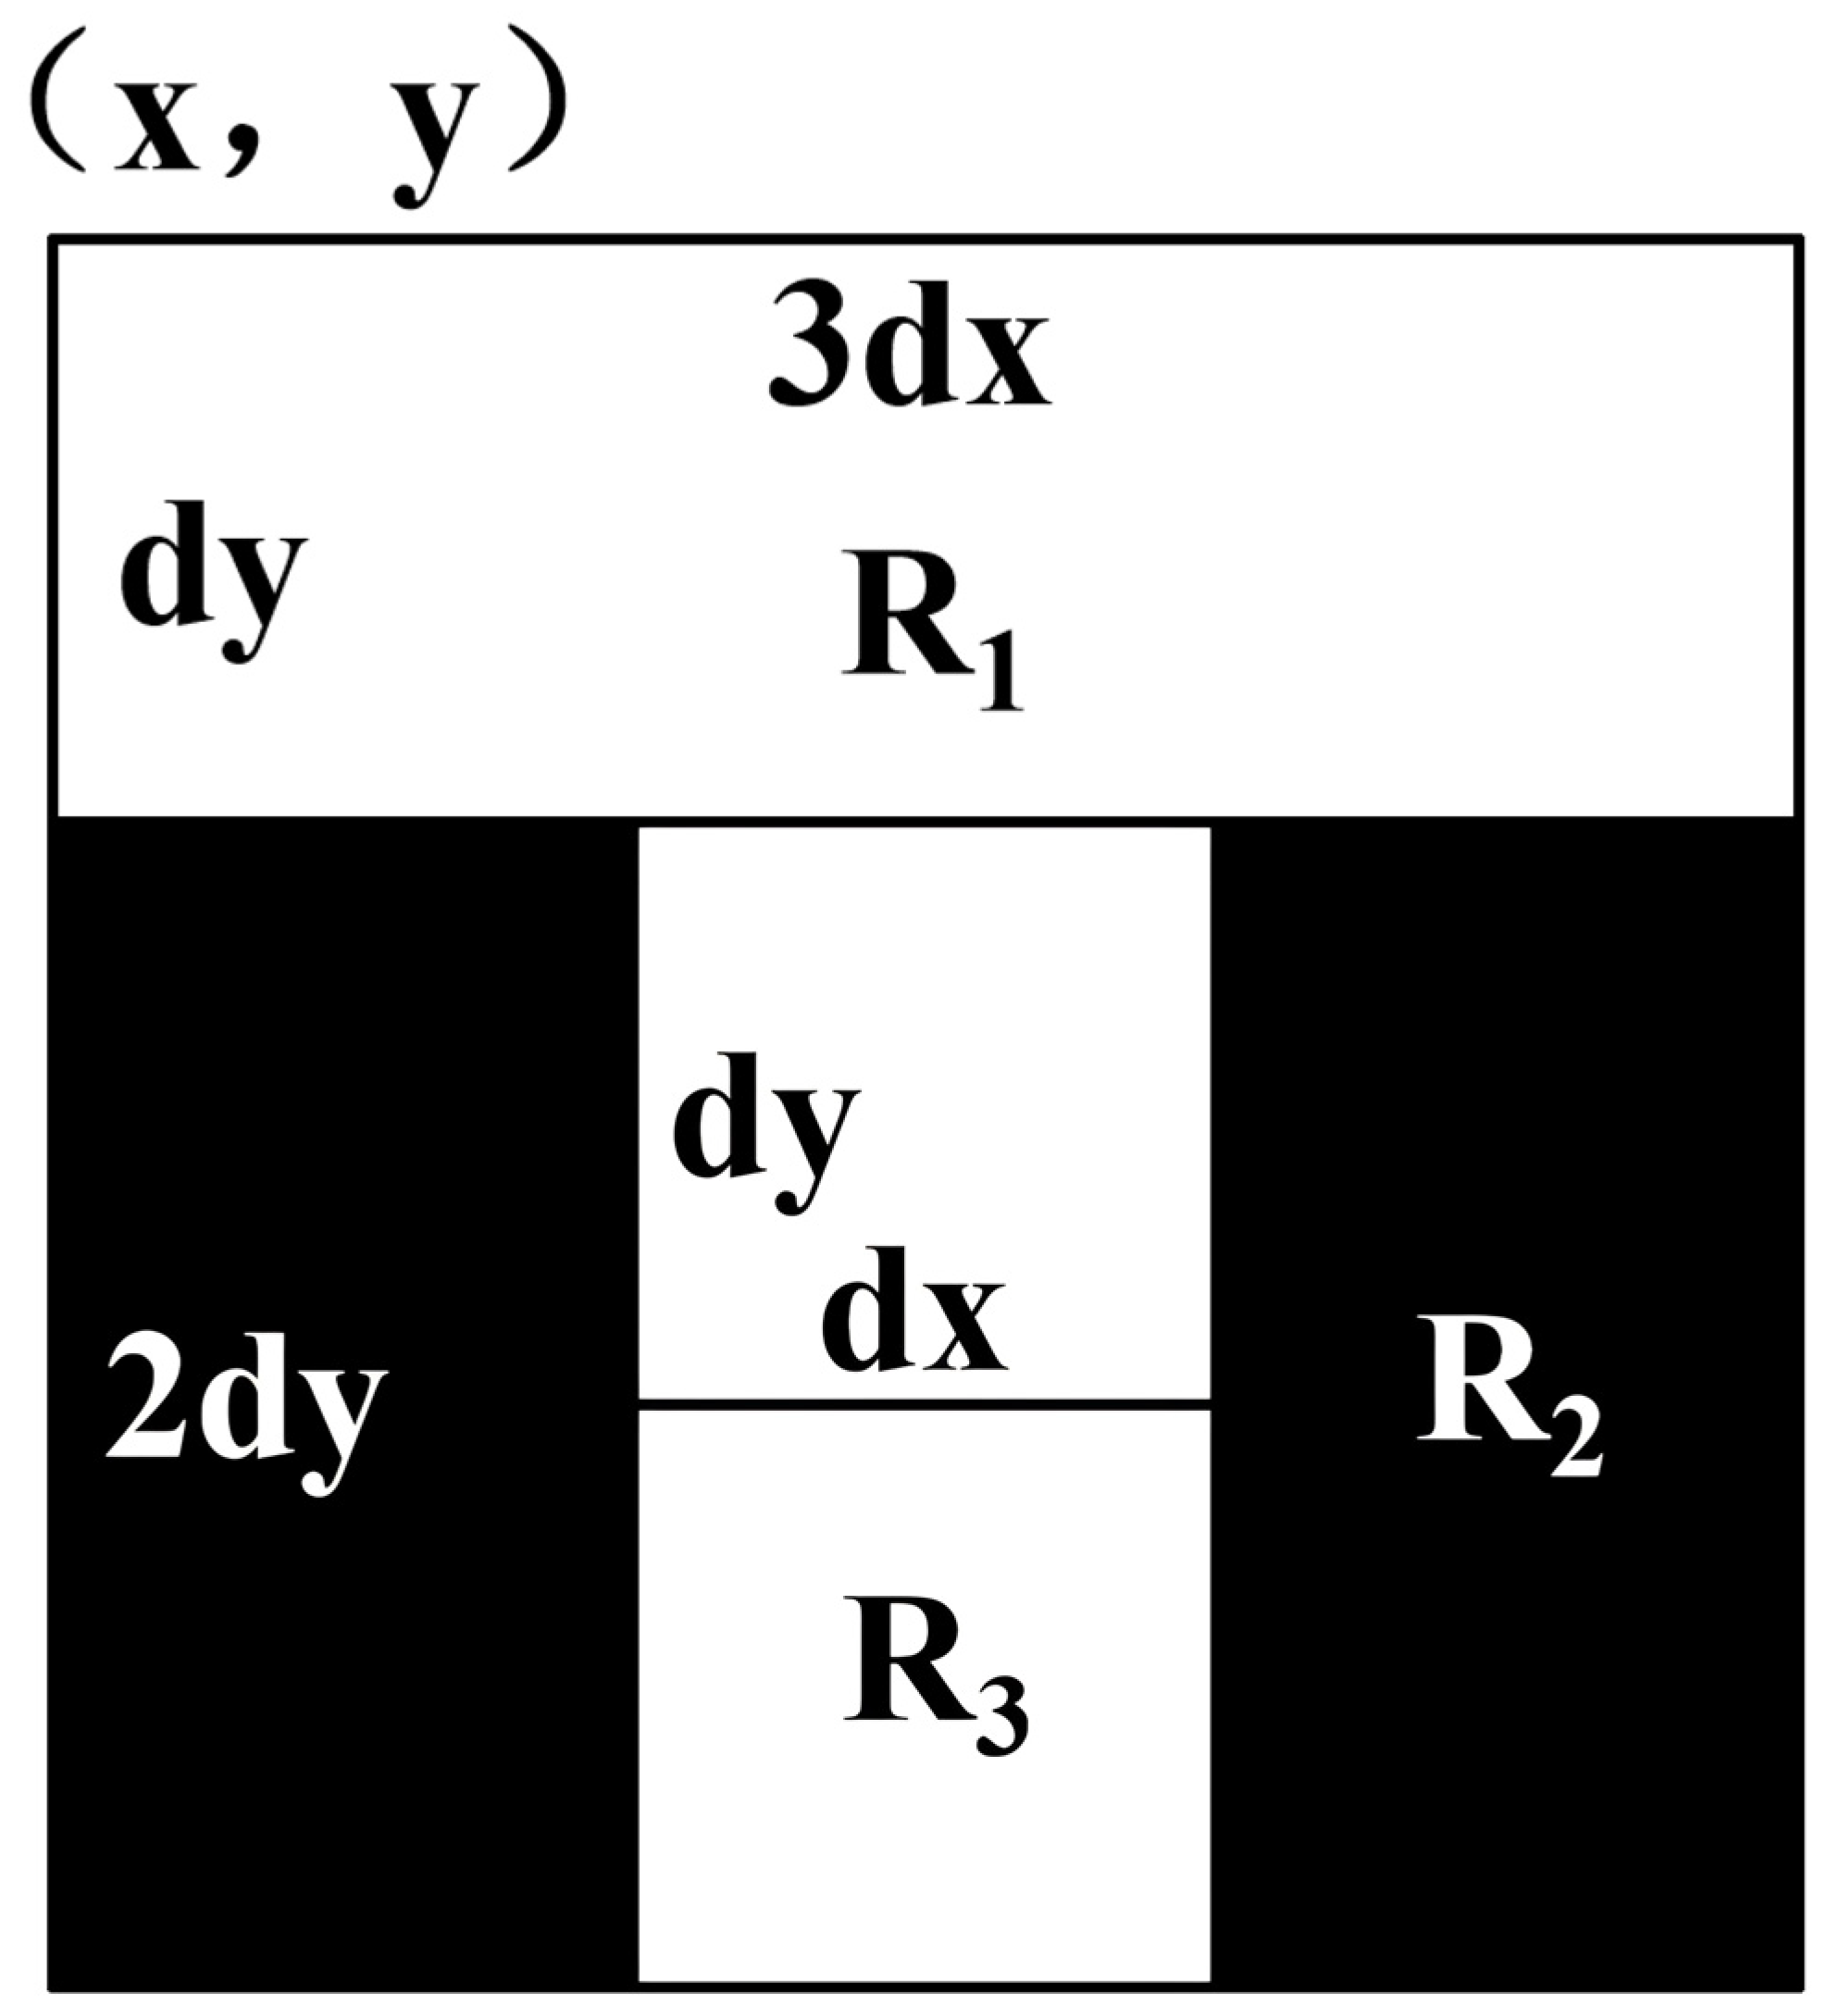
Similarly, taking the T-down feature as an example, the feature value shown in
Figure 4 can be efficiently computed using the integral image. A T-shaped feature is determined by three rectangular regions, denoted as (R
1), (R
2), and (R
3). For the three rectangles (R
1), (R
2), and (R
3) in
Figure 4, the parameters are defined as follows: each rectangle has a width of 3dx and a height of dy, with the assigned weights being −1, −1, and −1, respectively. Consequently, for the pixel located at (x, y), the corresponding T-shaped feature value can be computed using Equation (4) as follows:
In this equation, , , and can be computed in the same manner as Sum4. This expression represents the feature value computation for the T-down feature, and the feature values of the other three types of T-shaped features can be derived in a similar way.
Given a training sample of size (m, n), the number of T-shaped features can be expressed as follows:
In the above equation, a and b denote the minimum sizes of the rectangular blocks into which a T-shaped feature can be partitioned, and represents the integer (floor) operation. For a (24, 24) image, the total number of Haar-like features is 263,103. In contrast, for the same image, the number of T-shaped features computed using the above equation is 33,856. The Haar-like T classifier incorporates both the aforementioned T-shaped features and the traditional Haar-like features. Therefore, the total number of features contained in the Haar-like T classifier is 296,959.
4. SDM for 68-Point Facial Keypoint Localization
Zhu et al. proposed an efficient facial landmark localization method based on supervised gradient descent, known as the SDM algorithm [
18]. This algorithm formulates landmark localization as an optimization problem and progressively approaches the true landmark positions by learning a series of regression functions. The core of the SDM algorithm lies in its iterative optimization process. Using a supervised learning strategy, a regressor is trained at each iteration to determine the optimal search direction and step size, thereby progressively refining the landmark positions during the optimization process. This gradient-descent-based optimization strategy enables SDM to rapidly and accurately localize facial landmarks even in complex image backgrounds.
In facial landmark localization tasks, accurately identifying and localizing facial landmarks is crucial for subsequent face analysis applications. As an efficient and accurate landmark localization method, the SDM algorithm can effectively handle complex features and variations in facial images. During the training stage of face alignment, the algorithm learns the descent directions for multiple sets of feature points, enabling the initial landmark configuration to progressively approach the annotated landmark set and ultimately achieve face normalization. Through continuous iterative optimization, SDM gradually converges to the true facial landmark positions, thereby enabling high-precision localization.
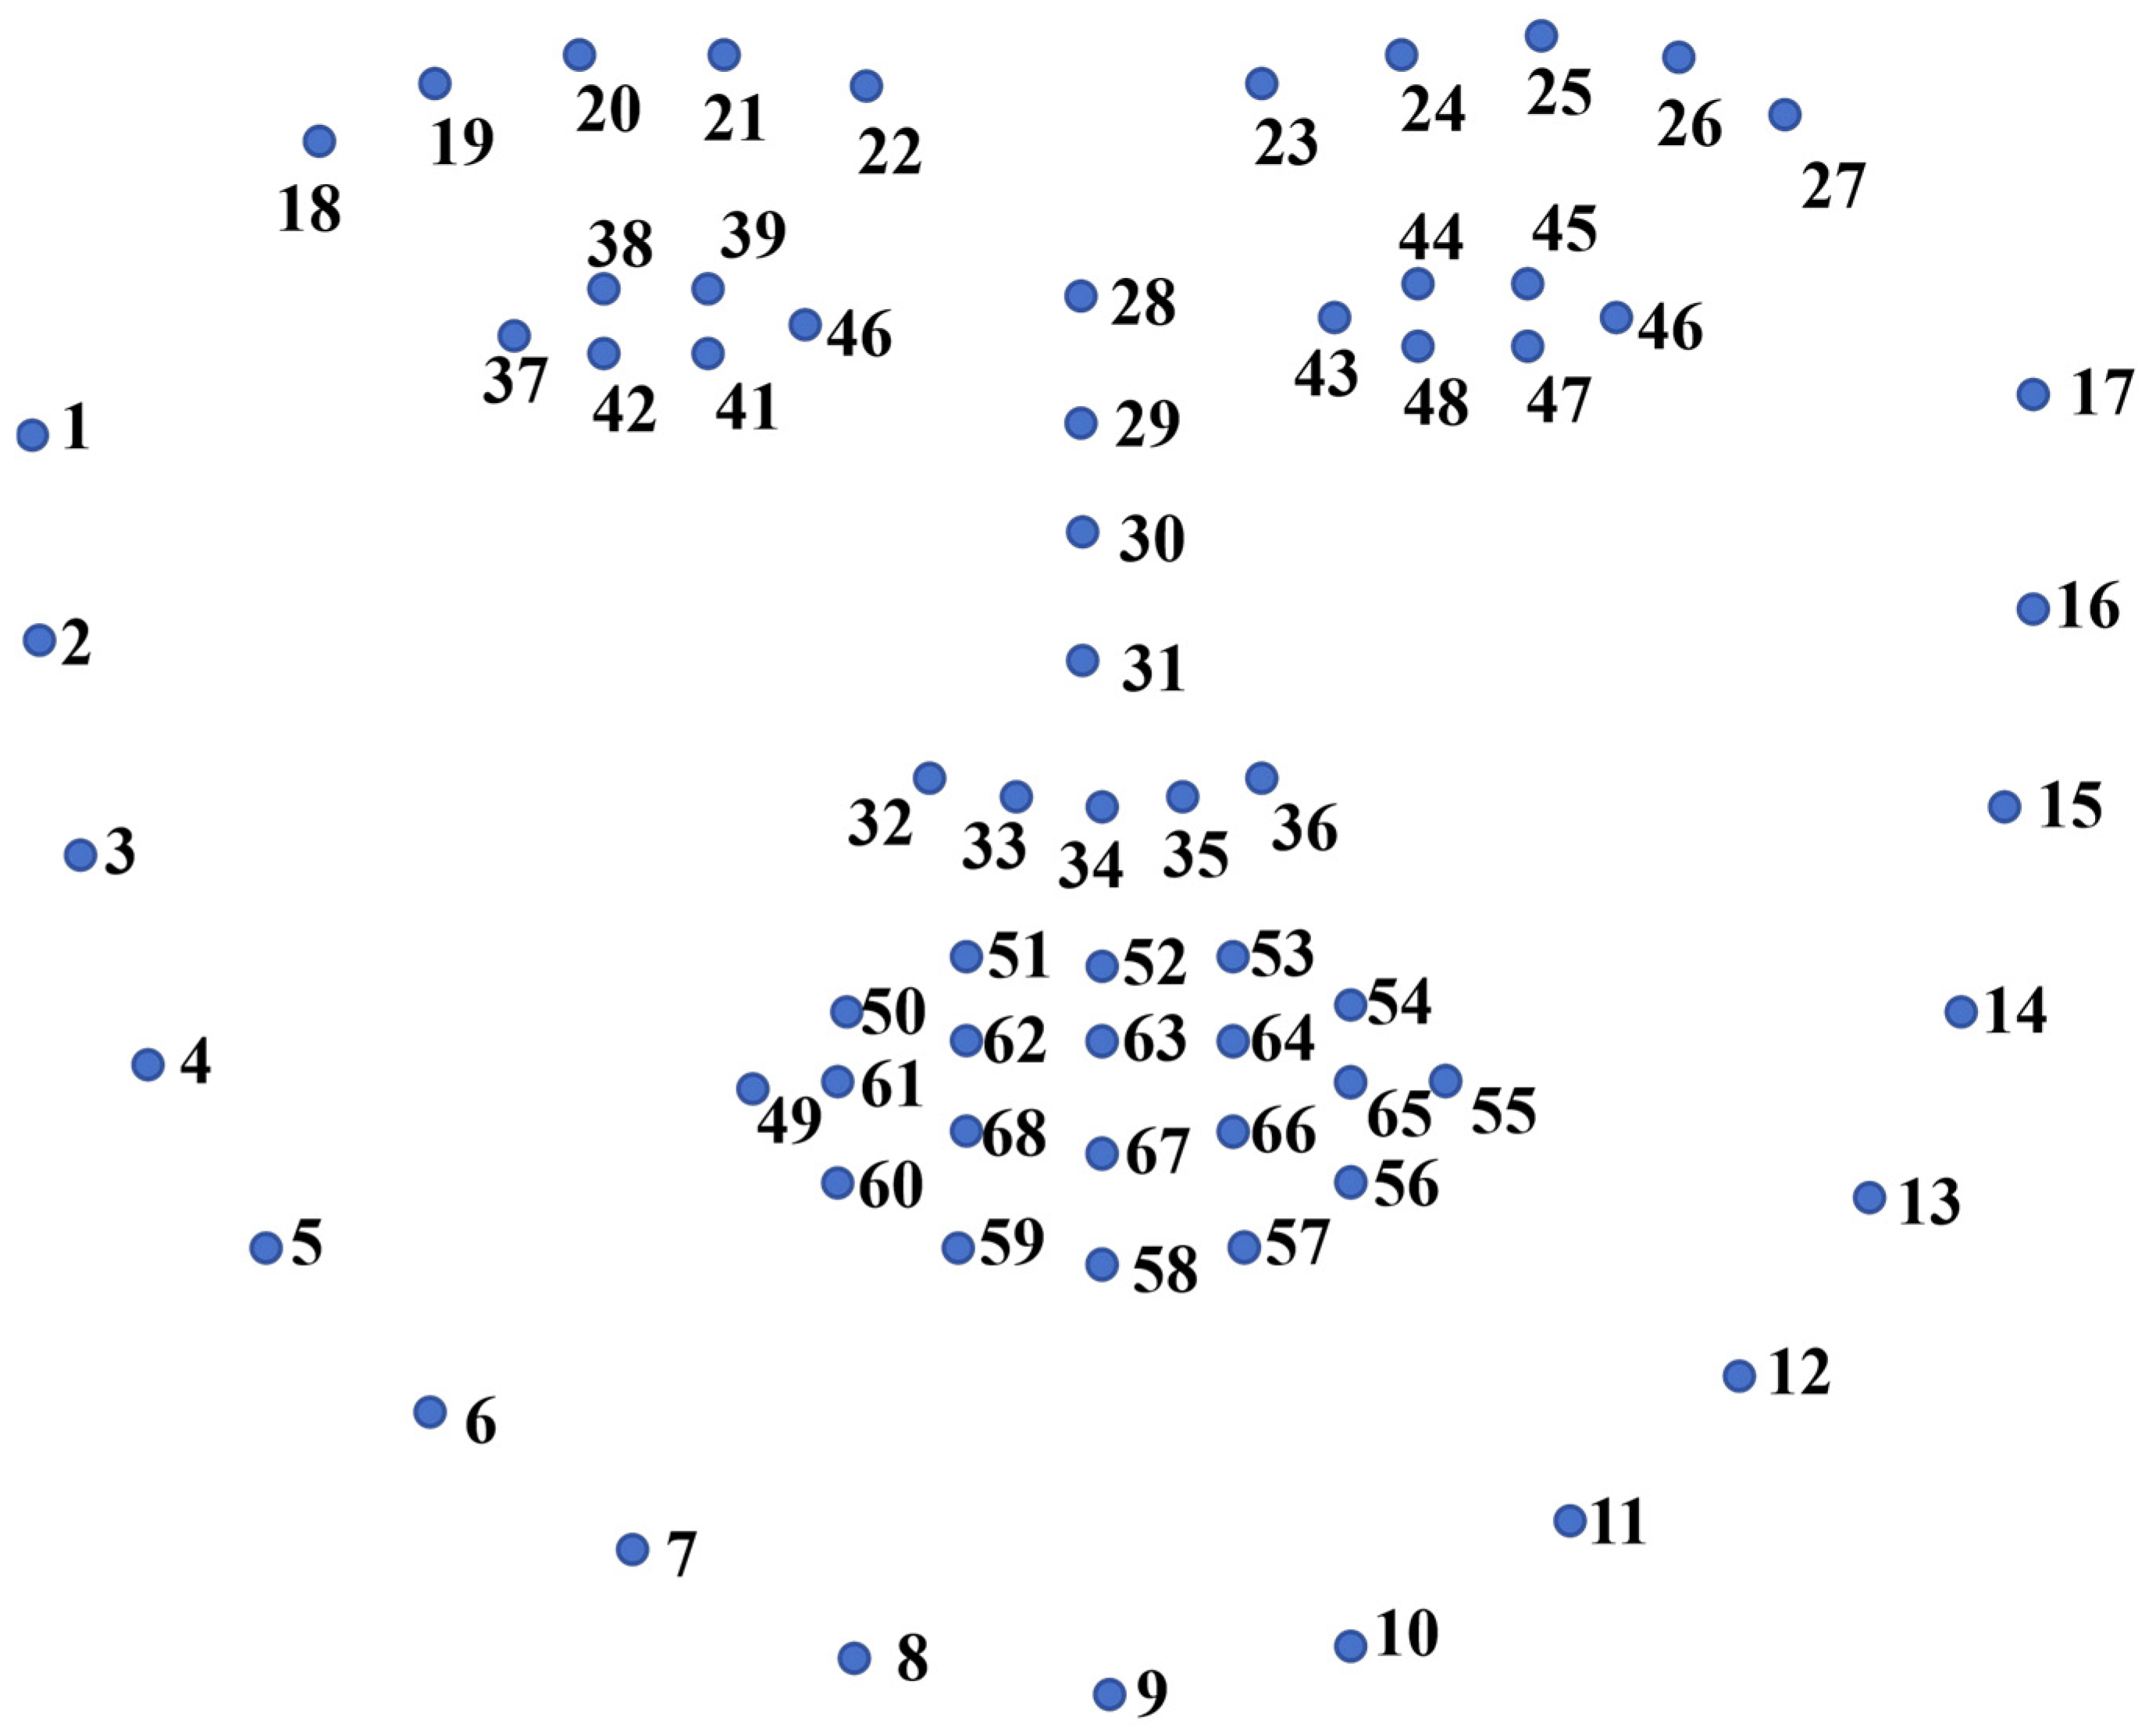
In the experimental study presented in this paper, key facial regions—including the facial contour, eyes, eyebrows, nose, and mouth—are selected to form the landmark set. The SDM algorithm is then applied to perform 68-point facial landmark localization on these features [
4]. The distribution of the landmark points is illustrated in
Figure 5.
Specifically, 17 landmarks are used to precisely delineate the facial contour, providing a foundational framework for facial pose estimation and expression recognition and serving as an essential starting point for face analysis. Subtle movements of the eyebrows often convey complex emotional cues. The 10 landmarks located in the eyebrow region can accurately capture variations in eyebrow shape, which is critical for understanding subtle differences in facial expressions. The 9 landmarks on the nose are used to characterize its shape, playing a central role in face alignment and 3D reconstruction, as the nose’s shape and position serve as important references for overall facial structure. The 12 landmarks around the eyes are used to describe their shape, which is crucial for eye-feature analysis and gaze estimation, enabling the system to accurately determine eye orientation and state. The 20 landmarks on the lips are employed to localize their shape, providing rich information for mouth motion analysis and speech-related applications and serving as an important foundation for human–computer interaction and speech recognition technologies. By precisely identifying these 68 specific facial landmarks, robust support is provided for a wide range of subsequent applications.
Through the SDM algorithm, these landmarks can be localized with high accuracy and efficiency. Its iterative optimization process progressively refines the position of each landmark, ultimately achieving close agreement with the ground-truth locations. Such comprehensive and precise landmark coverage not only enhances face alignment performance under varying poses and expressions but also establishes a solid foundation for subsequent advanced face analysis tasks.
5. Overall Design of the TSDM Algorithm
To further clarify the overall design, the TSDM framework follows a modular and cascaded pipeline that ensures both efficiency and accuracy. First, face regions are rapidly detected using the AdaBoost cascade classifier based on T-shaped features. Then, the SDM algorithm performs iterative regression to achieve accurate 68-point facial keypoint localization. All parameters, including cascade stages, iteration numbers, and stopping criteria, are carefully set to balance real-time performance and localization precision.
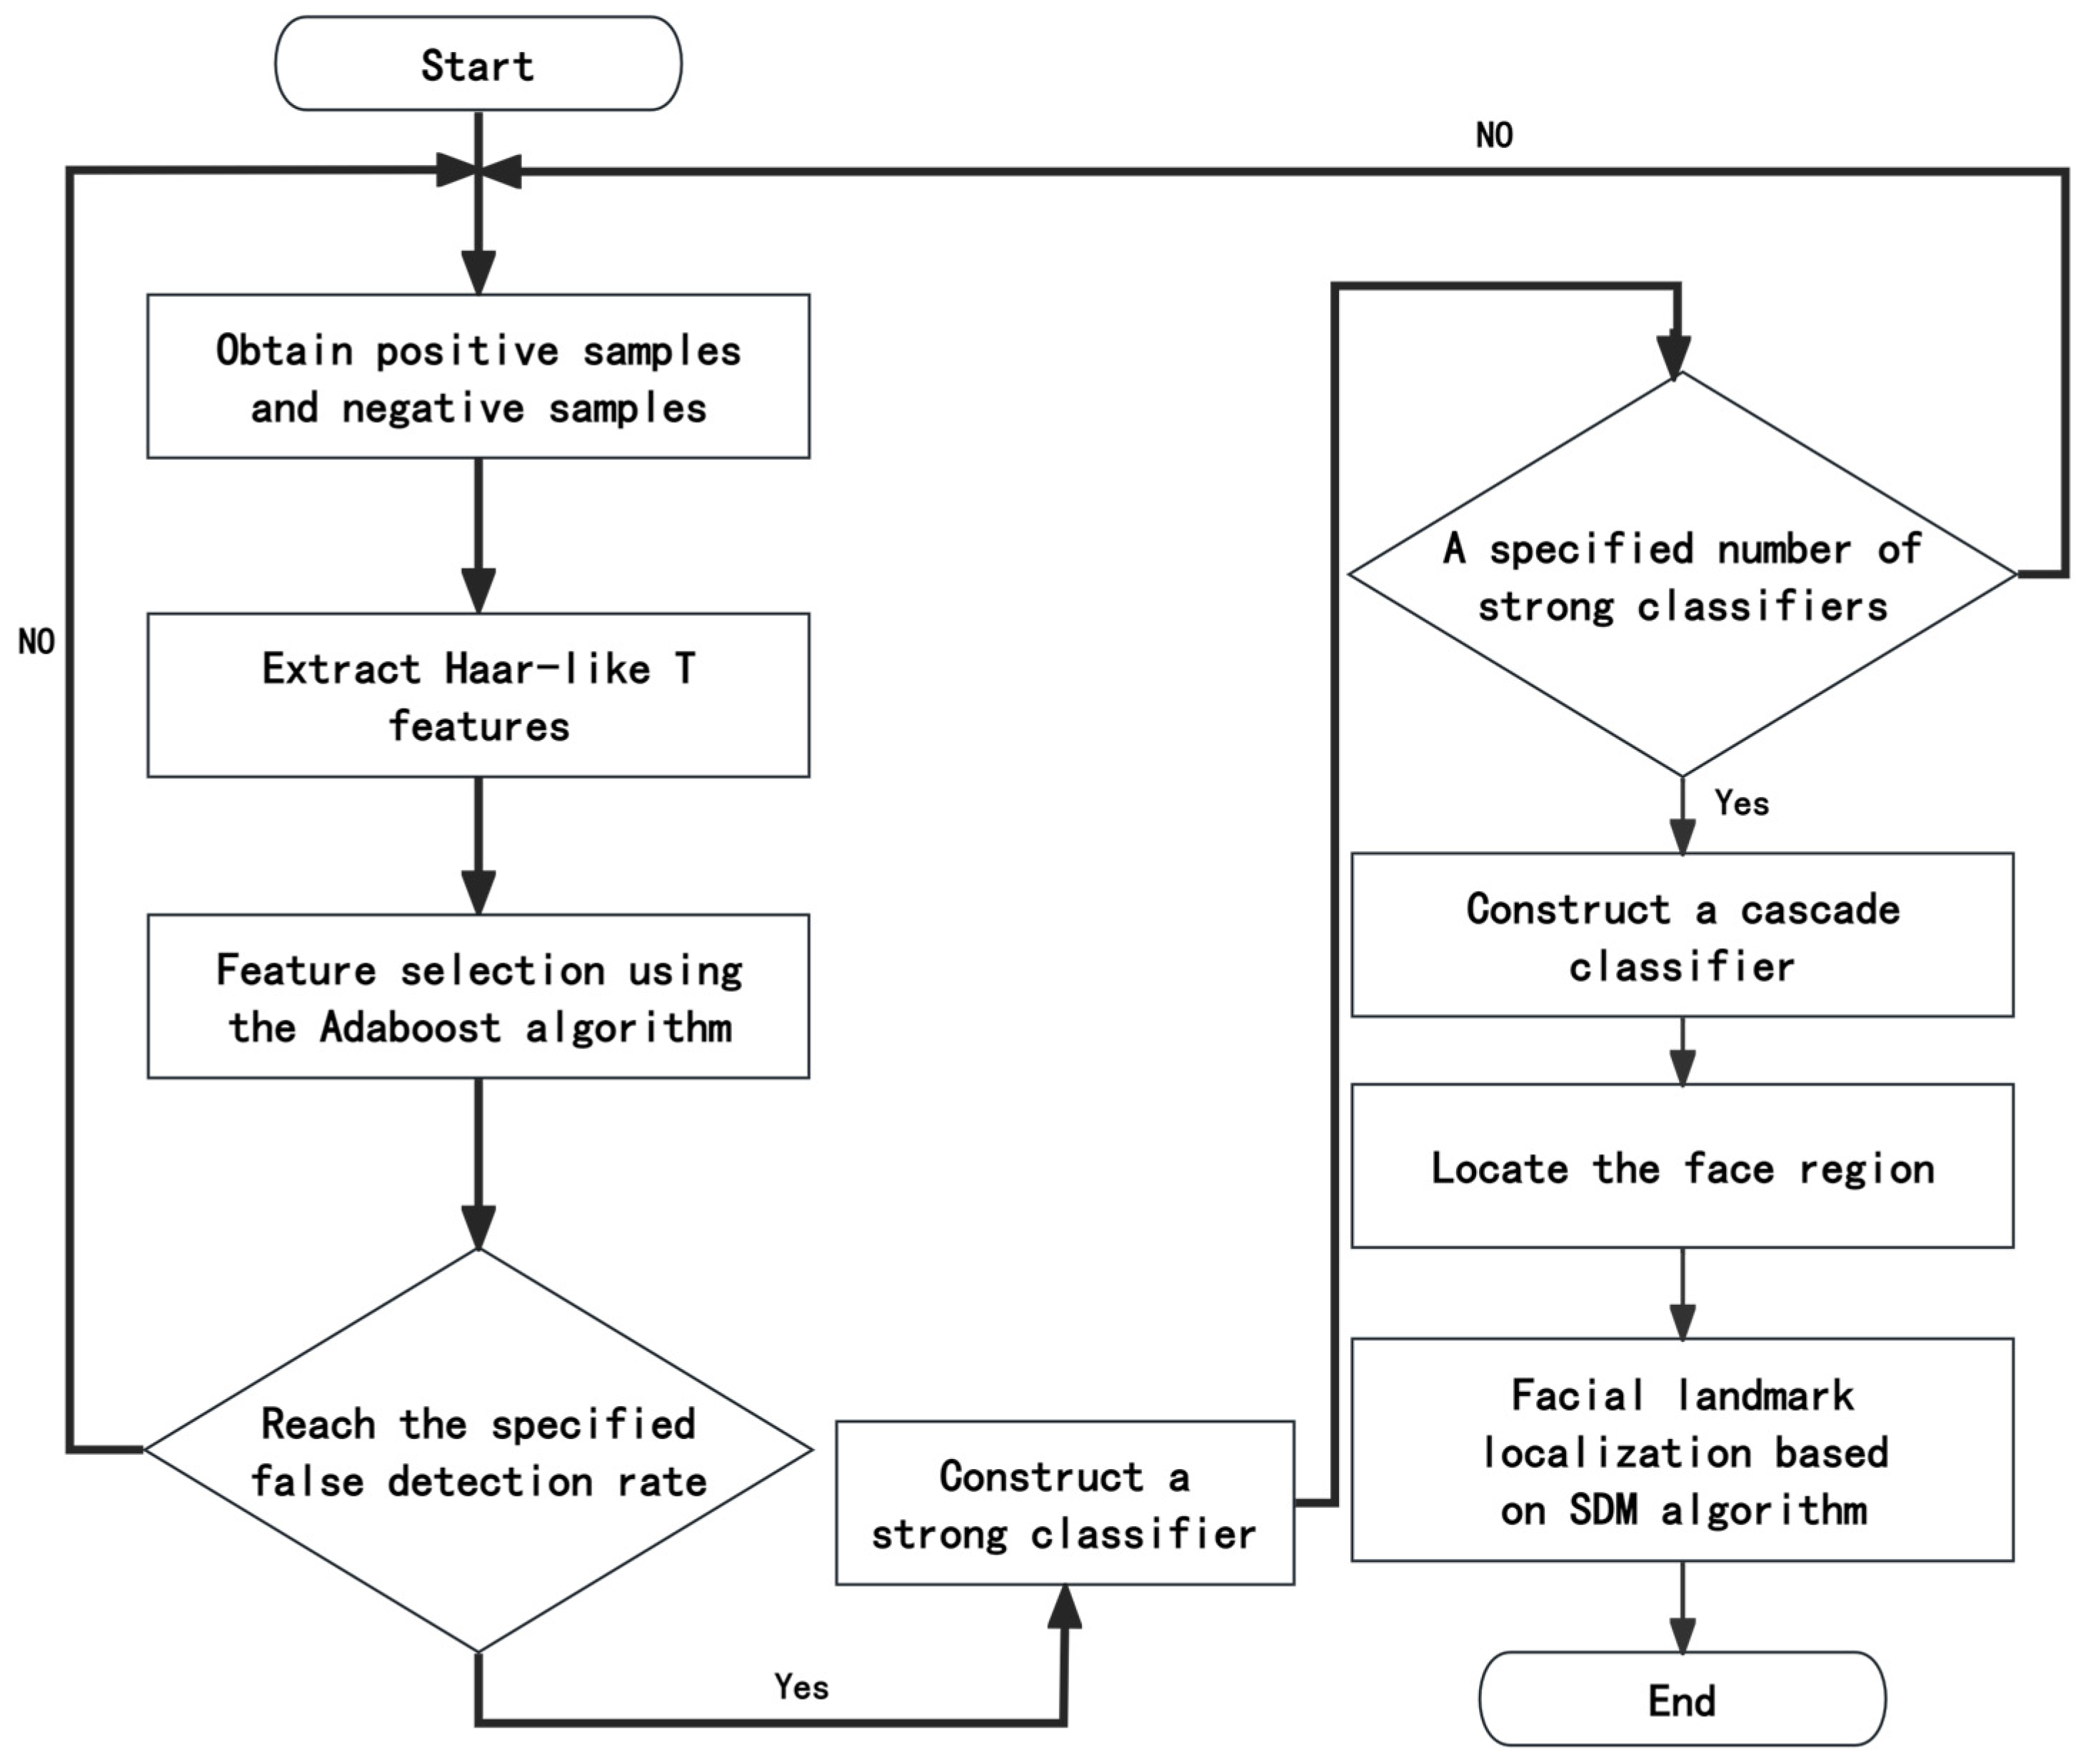
For a (24, 24) image, as derived in the previous section, a total of 296,959 features can be extracted. After feature extraction, an AdaBoost classifier is employed to select the facial features that are effective for face detection and localization. The flowchart of the proposed TSDM framework of this study is illustrated in
Figure 6.
At this stage, face images and non-face images are extracted from the input image data and are denoted as positive samples and negative samples, respectively. These samples are used to train the classifier, enabling accurate face detection and landmark localization in subsequent steps (typically, face samples are labeled as 1 and non-face samples as 0).
During the training phase, both Haar-like features and T-shaped features are extracted from the sample images. The T-shaped features exploit the distribution patterns of facial components, thereby enhancing the representation of both global facial structure and local facial details.
In this stage, the AdaBoost algorithm is employed to iteratively select features that minimize the classification error rate. At each iteration, the misclassification rate of the current strong classifier is evaluated against a predefined threshold. If the criterion is satisfied, the current iteration is terminated, and the resulting strong classifier is stored in a temporary file; otherwise, training proceeds to the next strong classifier.
At this stage, once the specified number of strong classifiers has been trained, they are cascaded to form the final cascaded classifier model. This cascaded classifier can rapidly detect faces while efficiently rejecting non-face regions.
In this step, the previously constructed cascaded classifier model is applied to the input images to perform face detection and localize face regions. After face detection is completed, the SDM algorithm is employed to localize 68 facial landmarks. Through an iterative optimization process, SDM progressively approaches the true landmark positions, ultimately achieving high-precision landmark localization.
6. Experimental Results and Analysis
In the face detection experiments conducted in this study, all training samples consist of images containing face-positive samples. Under identical experimental conditions, these training samples are fed into the AdaBoost classifier during training and cascading to construct both the Haar-like classifier and the Haar-like T classifier. The Haar-like classifier utilizes 263,103 features, whereas the Haar-like T classifier employs 296,959 features, which include both traditional Haar-like features and T-shaped features.
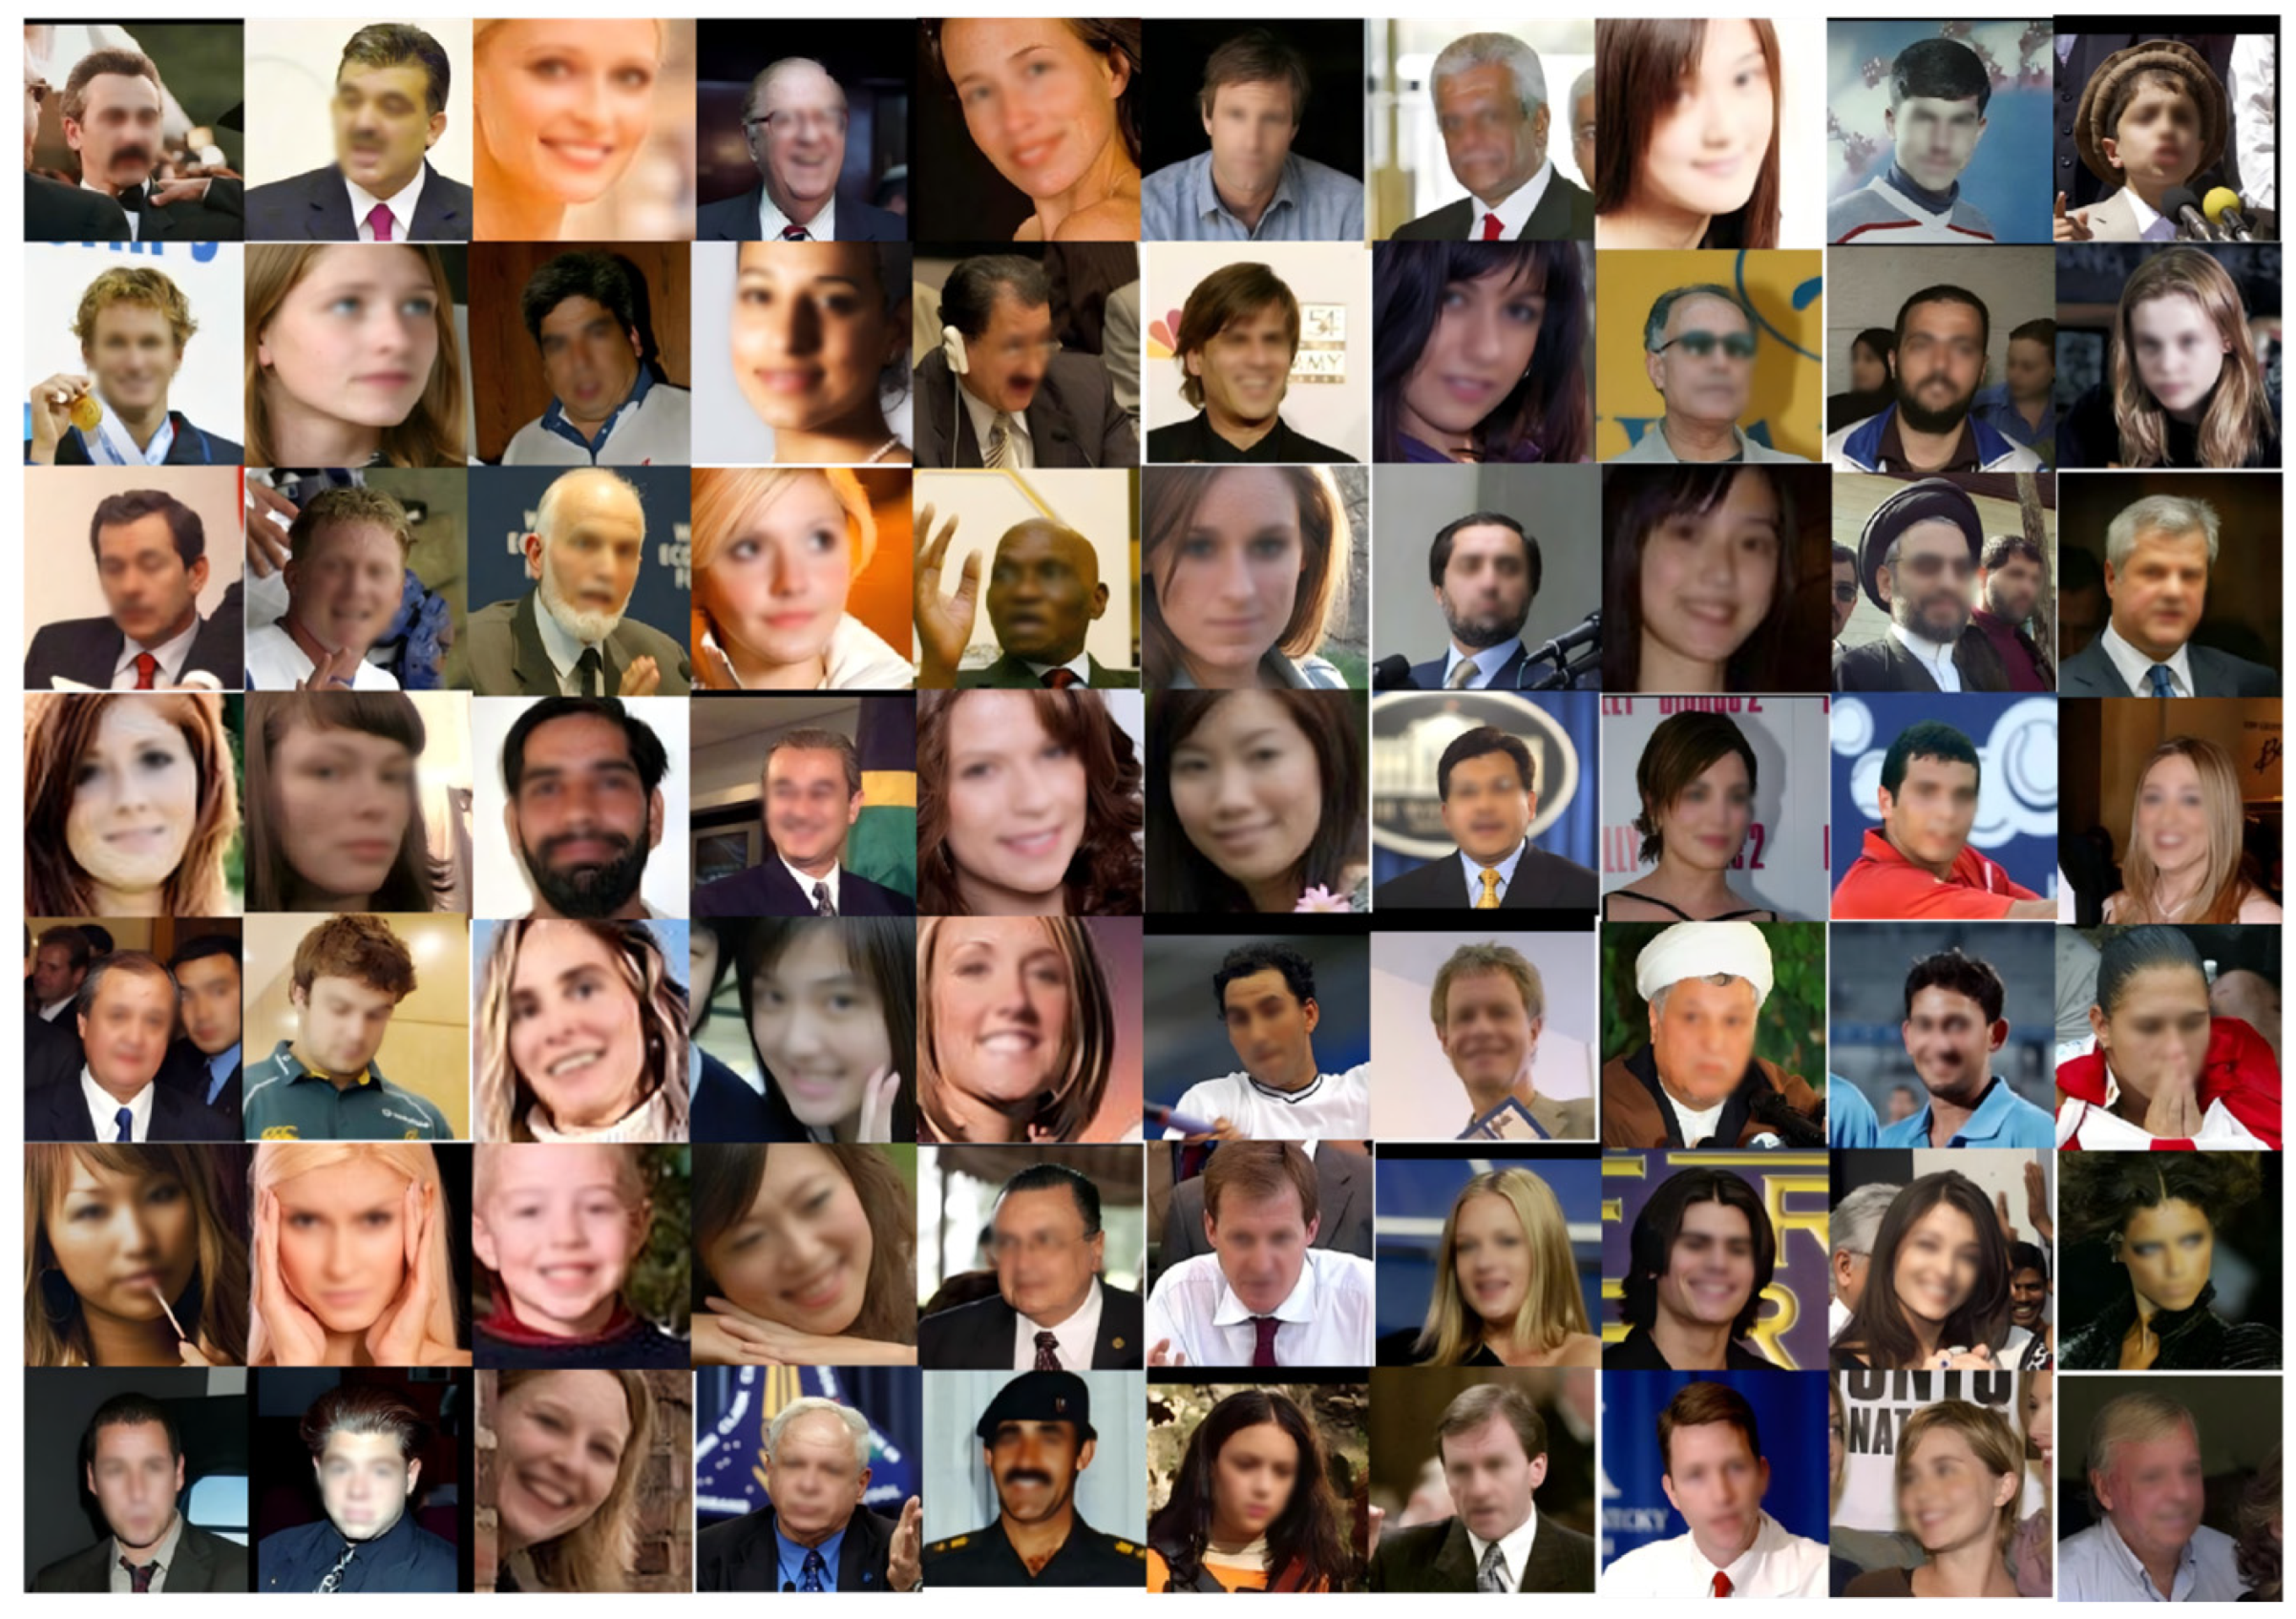
This study primarily focuses on facial keypoint localization in complex environments under various practical scenarios, hence the selection of several well-known public face datasets. These datasets include the Yale Face Database, the 300 W dataset (comprising the AFW, HELEN, LFPW, IBUG, and 300 VW subsets), the CASIA WebFace database, the COFW dataset, and the WFLW dataset. These public face datasets are diverse and comprehensive, covering different facial poses, expressions, illumination conditions, and partial occlusions (e.g., glasses and masks), which are consistent with the practical in-vehicle facial capture scenarios targeted in this study. The total number of facial samples collected from these datasets is approximately 8000 images, with a unified image resolution of 24 × 24 pixels after preprocessing to meet the input requirements of the proposed TSDM.
Figure 7 shows several facial sample images used in the training phase.
Before training, the dimensions of all facial image samples to be used as input are uniformly resized to (24, 24) pixels. For non-face images, 6000 background images were collected from the internet as data sources for this study. During training, the number of negative face samples required at each stage is dynamically adjusted based on the misclassification rate of negative samples from the previous stage. Ultimately, the total number of (24, 24) negative samples used is approximately . During the training phase, the extremely large number of samples significantly increases the computational time required when using the AdaBoost algorithm for face data training. The proposed Haar-like T classifier employs approximately 35,000 more features than the traditional Haar-like classifier, resulting in a higher computational load and consequently a longer training duration of about 30 days. However, this extended training time does not have a significant negative impact on practical applications.
In this experiment, the hardware environment chosen was an Intel(R) Core(TM) i7-9750H CPU @ 2.60 GHz running a 64-bit Windows 10 operating system with 8 GB of RAM; the software environment chosen included Python 3.8.2 and OpenCV 4.11.0; the feature window size was set to (24, 24); a random selection of 145 images containing faces was used for the face detection experiments, totaling 621 faces across all images; and face detection and localization experiments were conducted on these samples using the Haar-like T classifier, the traditional Haar-like classifier, and the LBPH classifier. In addition, the dataset partition adopted a random division strategy, with the training set, validation set, and test set divided at a ratio of 7:2:1. For the SDM algorithm, the key parameters were set as follows: the initial value of facial keypoints was given based on the bounding box obtained by face detection, the number of iterations was set to 10, and the stopping condition was that the displacement of keypoints between two consecutive iterations was less than 0.01 pixels. For the training process, the cascaded classifier was constructed with 15 stages, and each stage contained 200 weak classifiers; the positive and negative sample sampling strategy adopted a hard negative mining method, where positive samples were selected from face regions of the dataset, and negative samples were mined from non-face regions that were misclassified by the current classifier to improve the detection performance.
The configuration of the experimental host is presented in
Table 1.
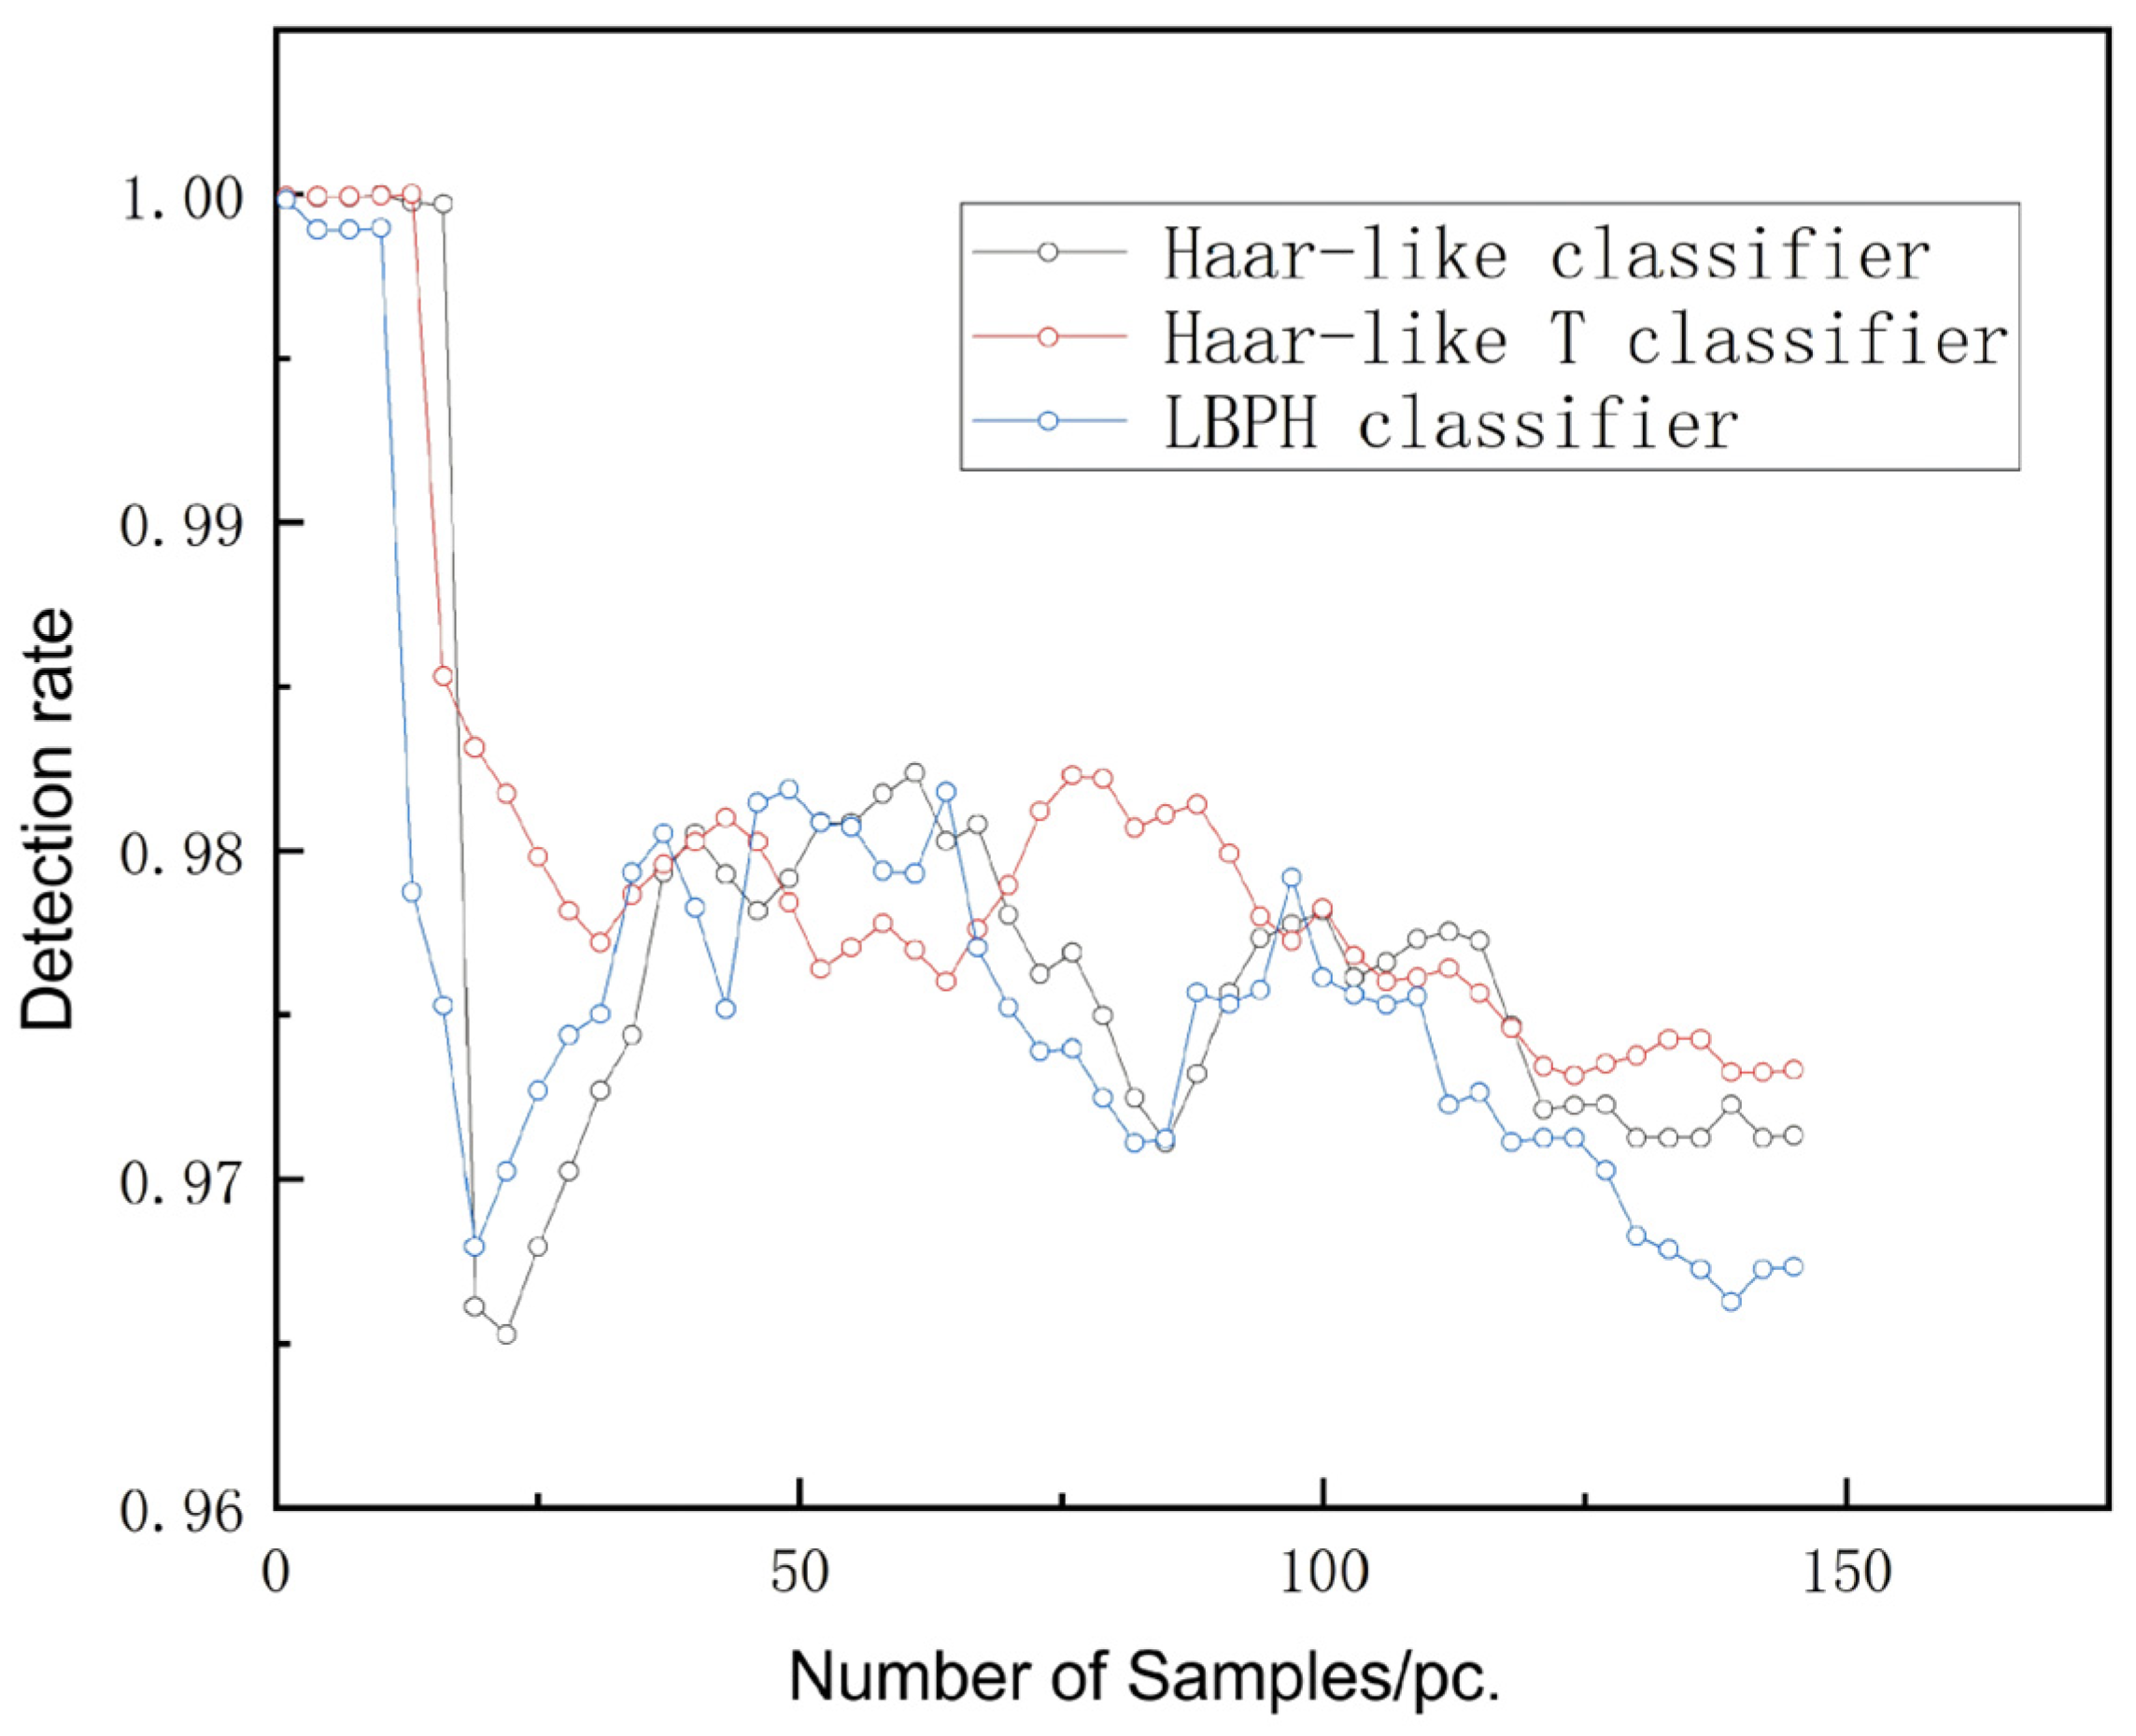
During the training process, the relationship between the number of face training samples and the face detection rates of the three classifiers (Haar-like classifier, Haar-like T classifier, and LBPH classifier) is illustrated in
Figure 8. As shown in the figure, as the number of input face samples increases, the face detection rates of all three classifiers gradually begin to stabilize. Among them, the Haar-like T classifier achieves the highest detection rate of 97.43%, followed by the Haar-like classifier at 97.12%, while the LBPH classifier exhibits the lowest average face detection rate of 96.72%. These results indicate that, in terms of face detection performance, the Haar-like T classifier slightly outperforms both the Haar-like and LBPH classifiers.
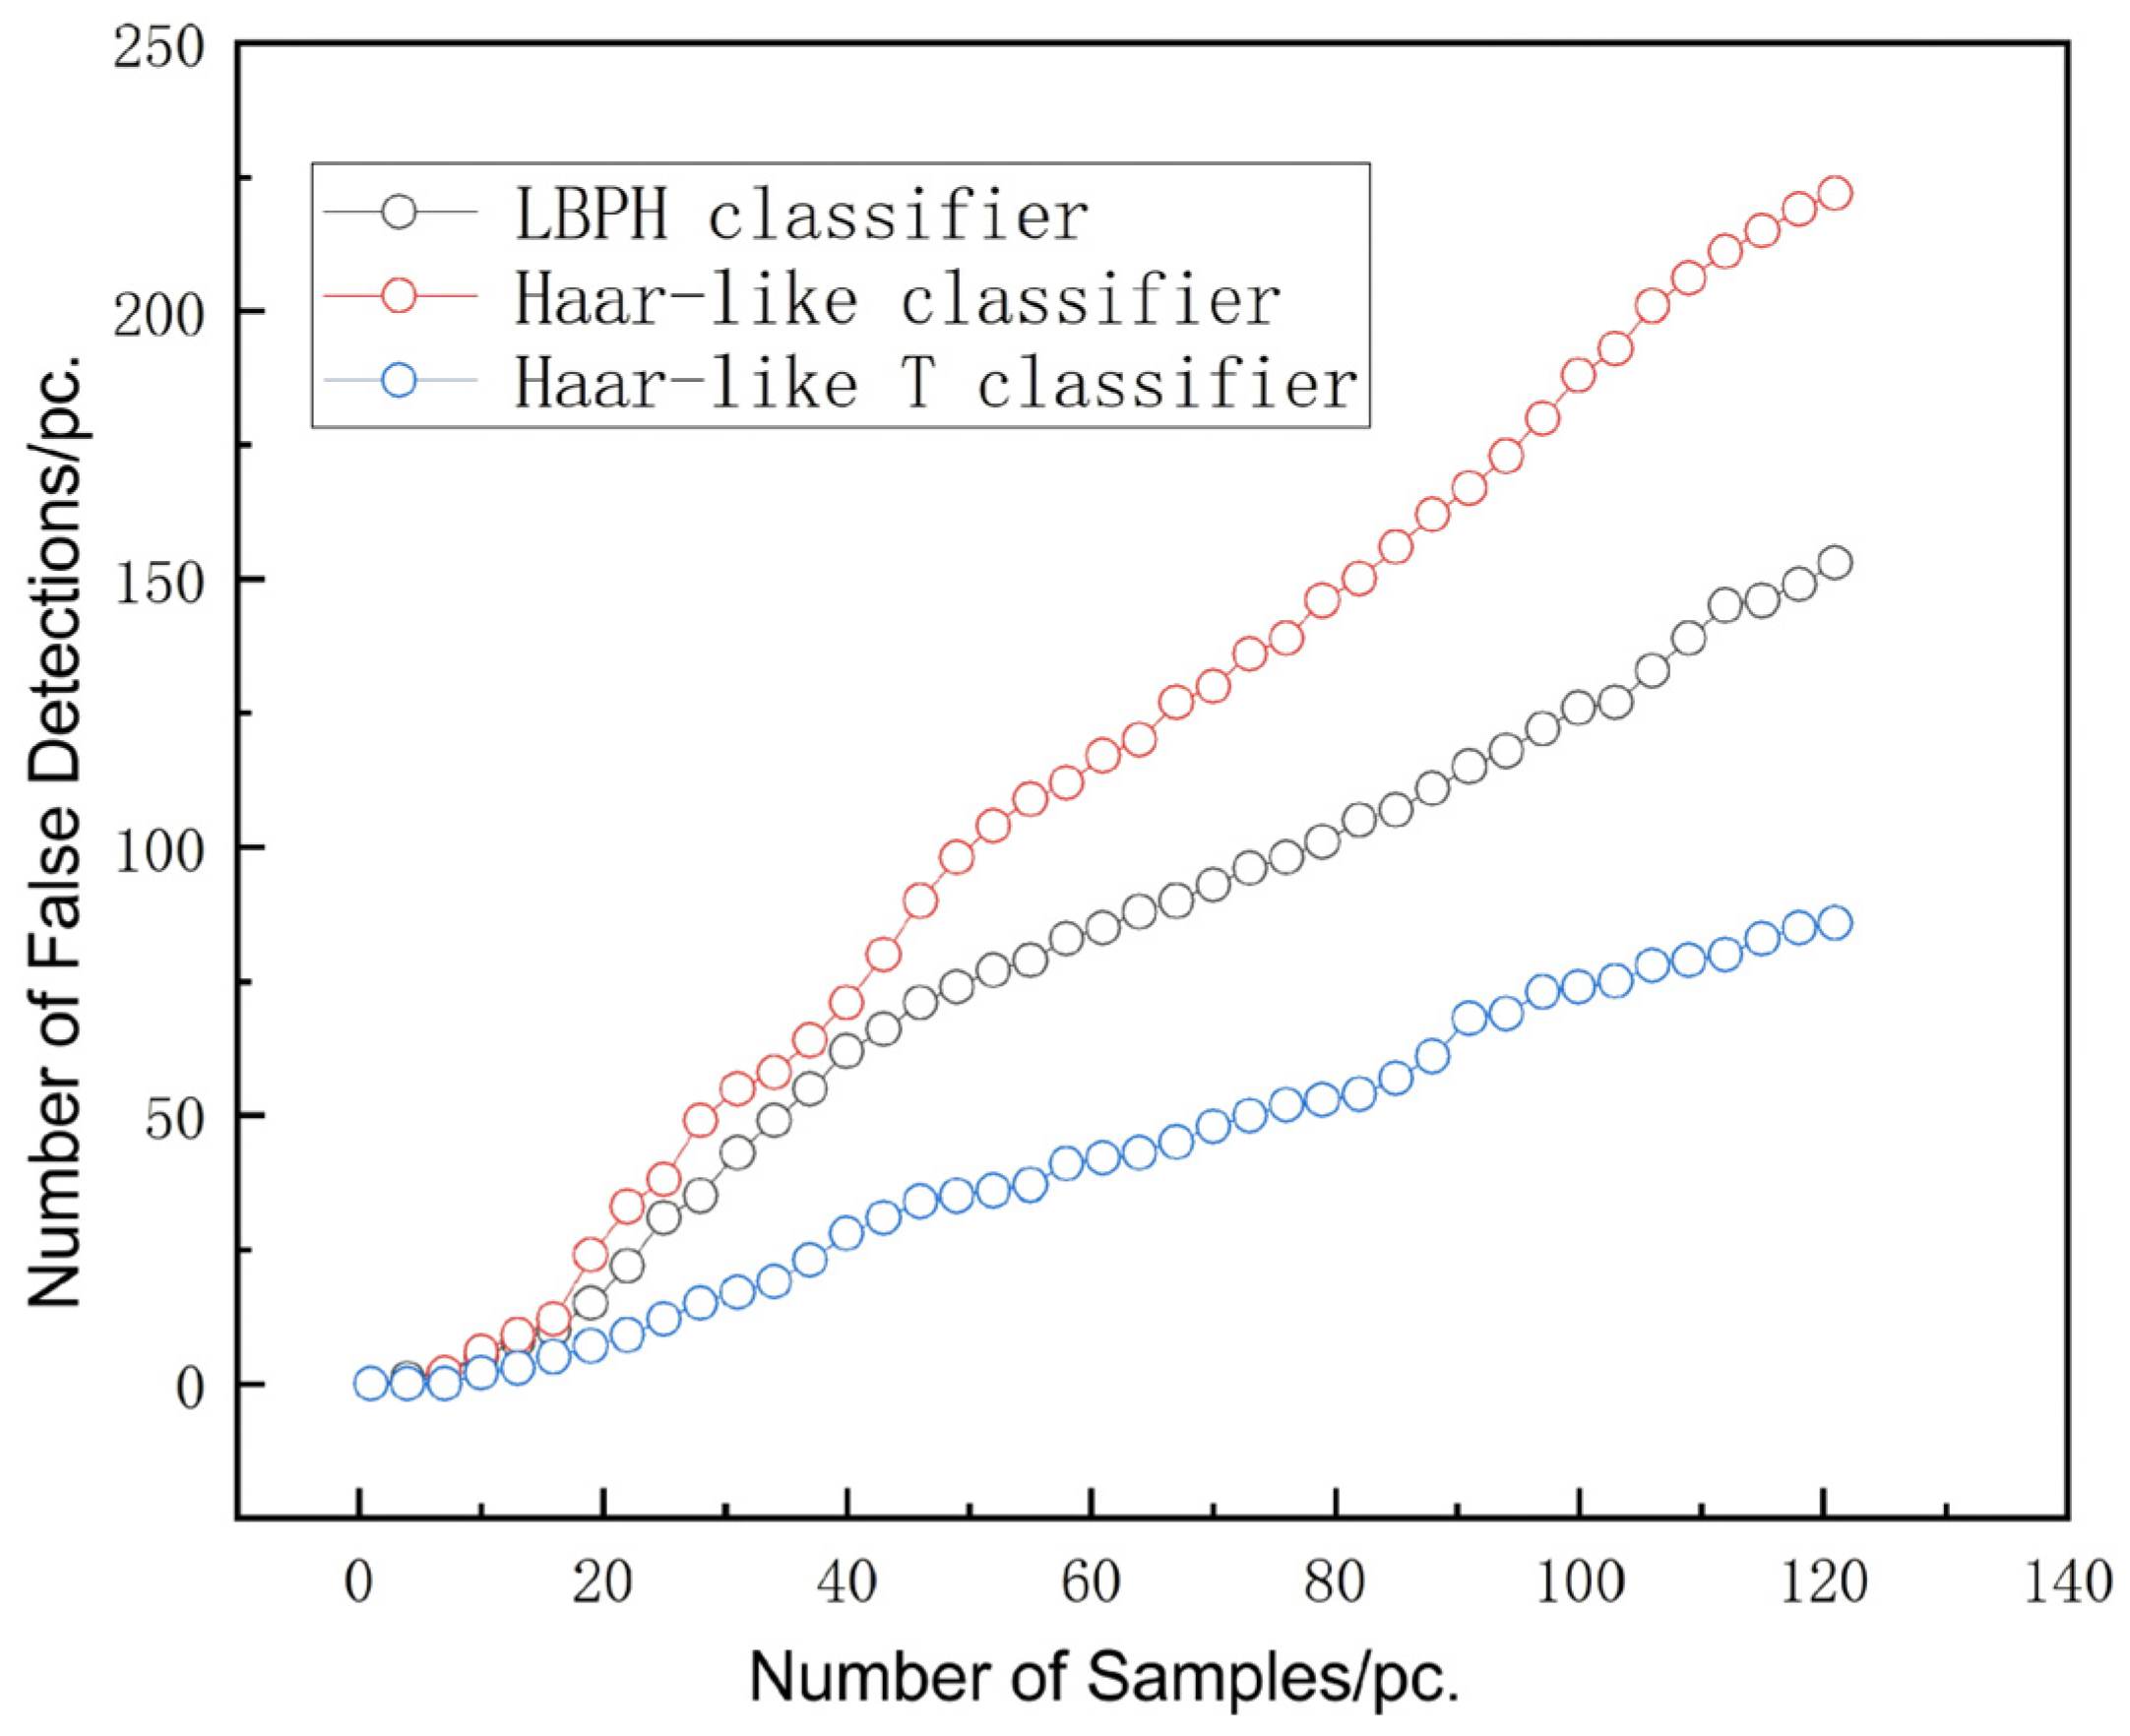
The relationship between the number of training samples and the number of false-positive face detections for the three classifiers (Haar-like classifier, Haar-like T classifier, and LBPH classifier) during training is shown in
Figure 9.
Figure 9 shows that, as the number of input samples increases, the number of false-positive face detections rises for all three classifiers; however, their abilities to reject non-face samples differ significantly. Under the same experimental conditions, the Haar-like T classifier produced 86 false positives, the Haar-like classifier produced 222, and the LBPH classifier produced 153. These results indicate that the Haar-like T classifier exhibits a substantially stronger capability to reject negative samples compared to both the Haar-like and LBPH classifiers.
Table 2 presents a comparison of several evaluation metrics for the Haar-like T classifier, Haar-like classifier, and LBPH classifier, including the face detection rate, number of false positives, and detection time for the experimental face samples.
Analysis of
Table 2 indicates that the Haar-like T classifier achieves a slightly higher detection rate compared to the Haar-like and LBPH classifiers. In terms of false-positive detections, the Haar-like T classifier produces significantly fewer errors than the other two classifiers. Regarding detection speed, the Haar-like T classifier also outperforms both the Haar-like and LBPH classifiers. Overall, these results demonstrate that the Haar-like T classifier exhibits superior performance in face detection.
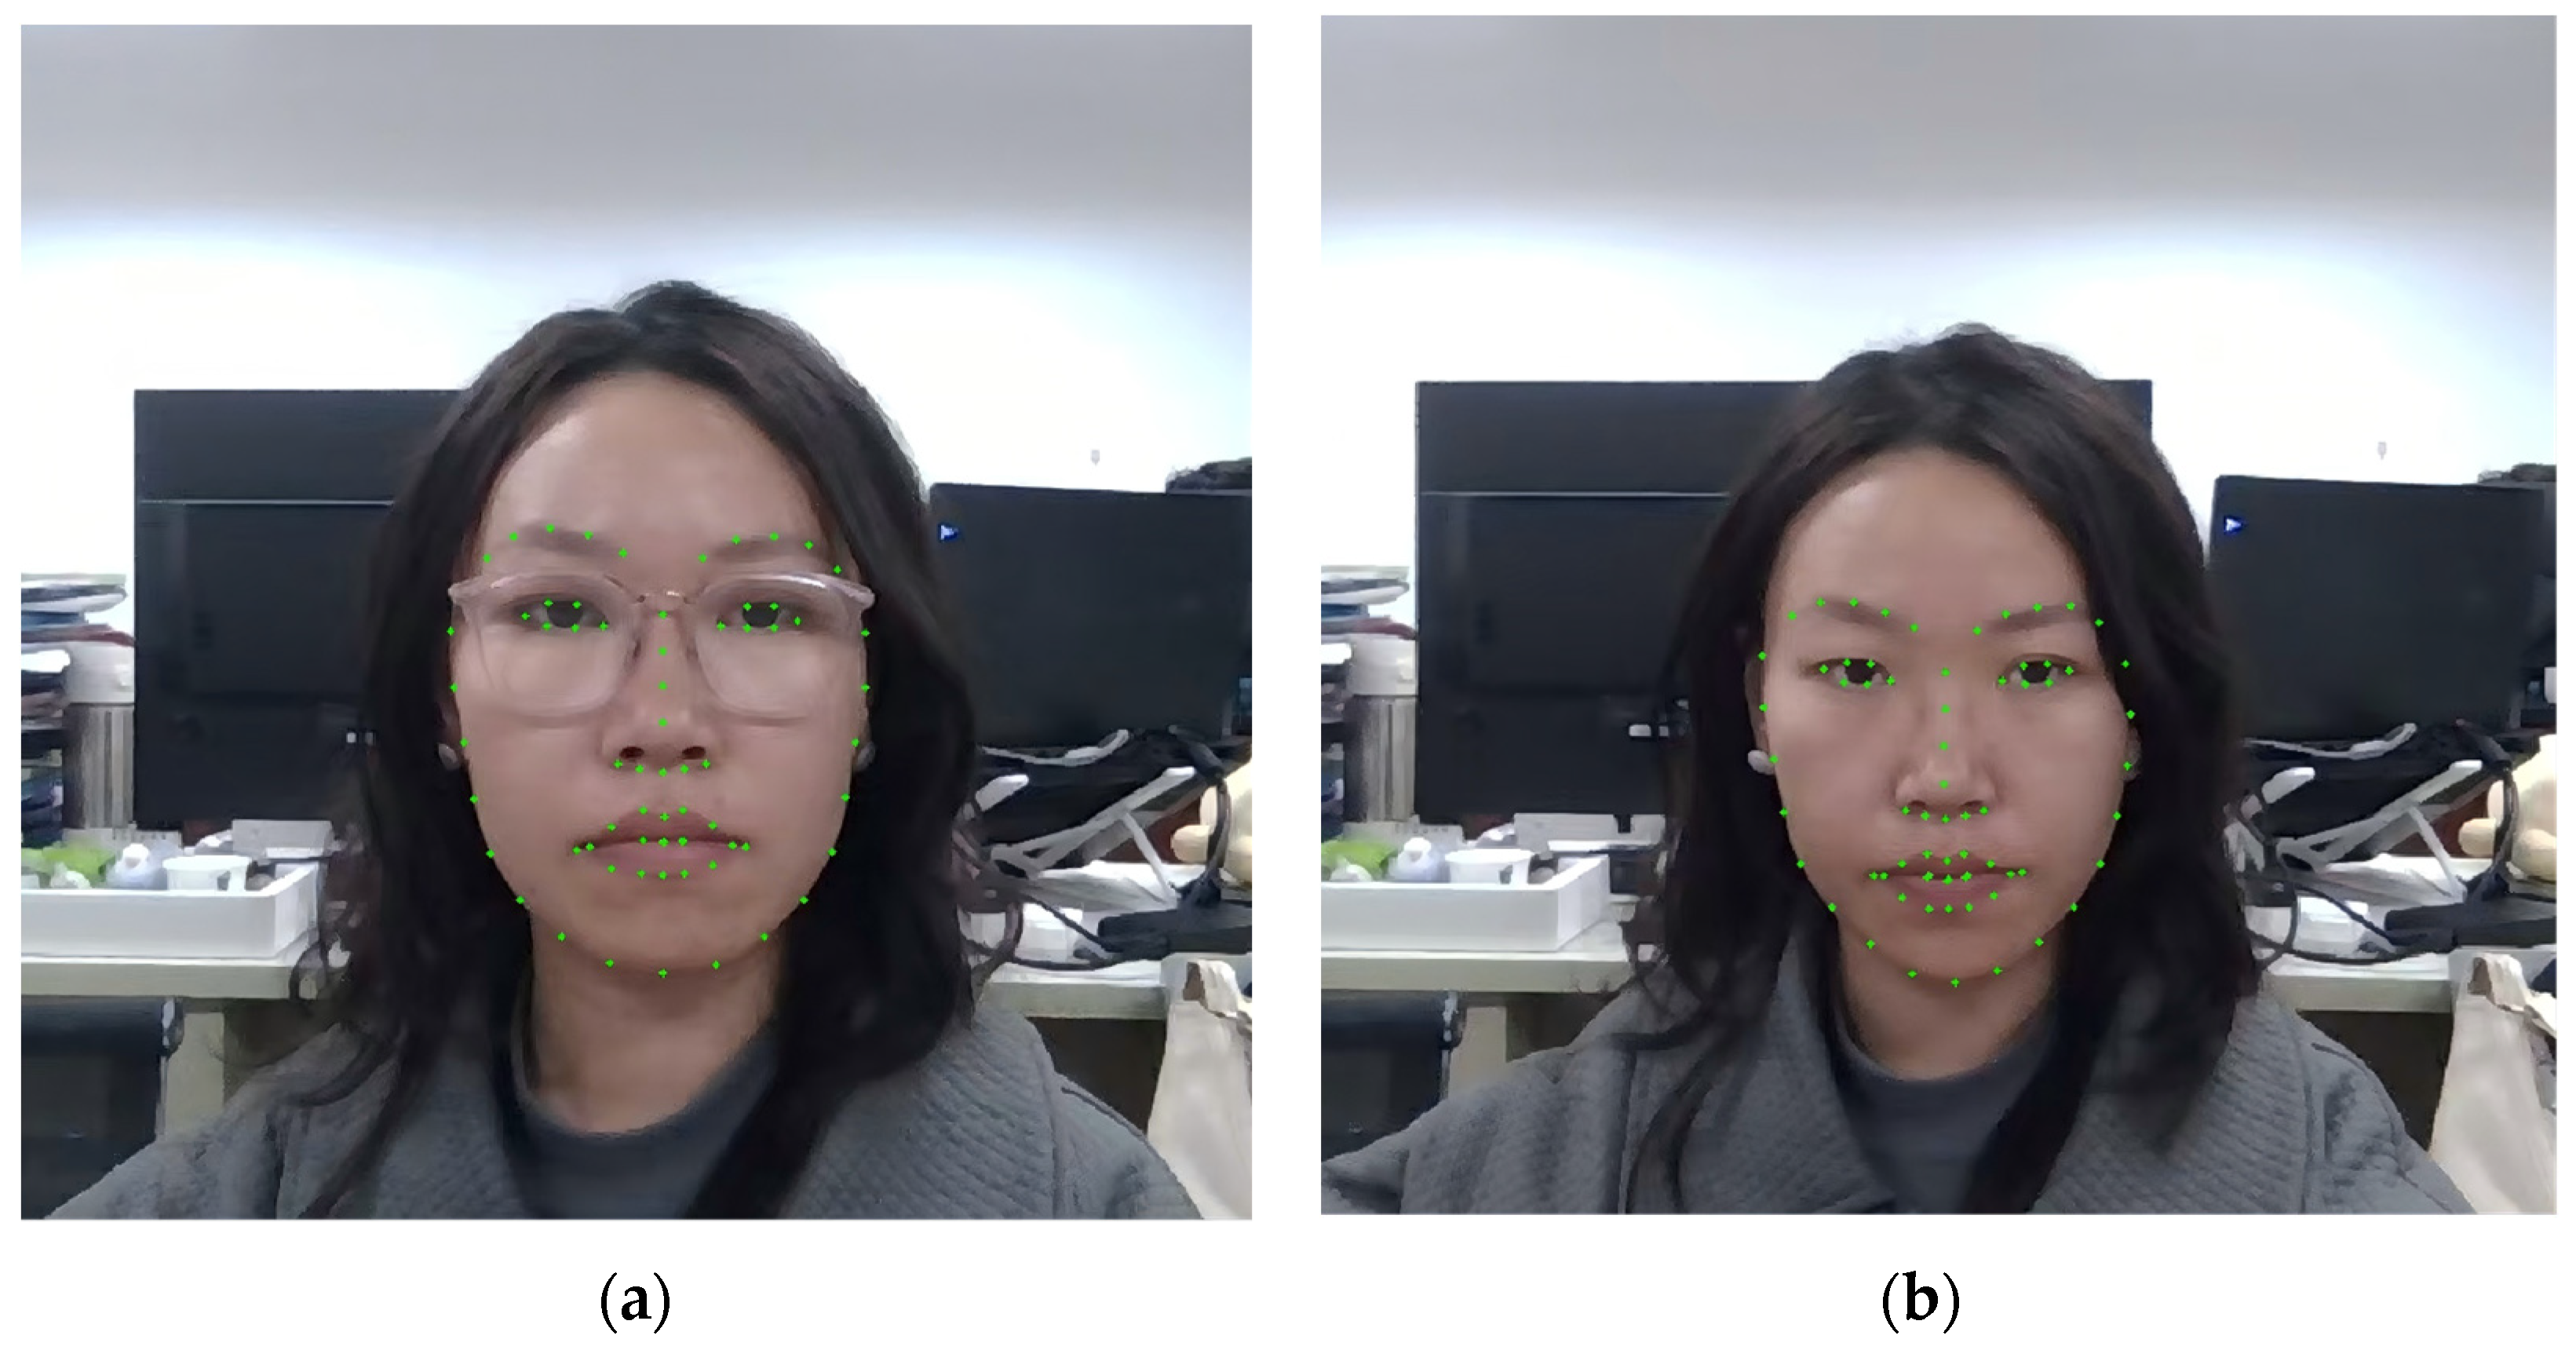
The following figure shows the experimental results of 68-point facial landmark localization under two conditions: with and without glasses.
Figure 10a illustrates the results for subjects wearing glasses, while
Figure 10b shows the results for subjects without glasses. It can be observed that even when the eyes are partially occluded, the proposed method is still able to accurately localize the facial features.
Table 3 lists the accuracy, normalized mean error (NME) and RMSE of the proposed method compared with other approaches on several datasets. As shown in the table, the proposed method demonstrates superior accuracy relative to the other methods, further highlighting its practicality and precision.
Ablation experiments (
Table 4) quantitatively verify the individual and combined contributions of the T-shaped feature and the SDM algorithm to face detection rate and facial keypoint localization accuracy. The baseline model (only traditional Haar-like features, without Haar-like T and SDM) achieves a detection rate of 96.81% but cannot perform keypoint localization, so no valid NME is available. Using only T-shaped features (without traditional Haar and SDM) yields a lower detection rate of 93.10%, indicating that T-shaped features focus more on structural details and are less effective for general face detection alone. Combining traditional Haar features with SDM (without Haar-like T) achieves a detection rate of 96.72% and an NME of 5.5%, showing that conventional Haar features lack sufficient structural representation, limiting SDM alignment precision. The proposed TSDM framework (Haar-like T + SDM) integrates both advantages and achieves the best overall performance: a detection rate of 97.43% and an NME of 3.4%, representing a significant 38.2% error reduction compared with the Haar + SDM combination.
These results confirm the strong synergy between the T-shaped feature and the SDM algorithm. The T-shaped feature provides fine-grained structural guidance, while SDM performs precise keypoint regression, enabling TSDM to achieve the optimal balance between detection robustness and localization accuracy. The core implementation code of the TSDM framework is presented in
Table 5.
7. Conclusions and Future Suggestions
The proposed TSDM framework achieves a dual improvement in facial keypoint localization accuracy and deployment efficiency by integrating T-shaped features, AdaBoost cascade detection, and the Supervised Descent Method (SDM) for real-time 68-point facial keypoint localization. On multiple public datasets, TSDM achieves a detection rate of 97.43% and a normalized mean error (NME) of 3.4%, outperforming traditional Haar methods and LBPH methods and showing favorable robustness and computational efficiency compared with several lightweight deep learning models. Unlike GPU-dependent deep learning models, TSDM runs stably on CPU-only platforms without extra hardware support and without performance degradation, making it highly suitable for resource-constrained vehicular environments such as driver state monitoring. Compared with traditional Haar-only methods, TSDM reduces the false positive rate by approximately 35% and improves keypoint localization accuracy. Compared with lightweight deep learning models, it maintains equivalent or higher localization precision, fully meeting the practical requirements of in-vehicle intelligent monitoring scenarios. The proposed TSDM achieves over 20 FPS on a CPU-only platform, satisfying the real-time requirement of driver monitoring systems (DMS).
Although the TSDM framework performs favorably in the targeted application scenarios, it still has certain limitations. First, the model training process is time-consuming due to sufficient sample learning and parameter tuning, which affects model iteration efficiency. Second, under heavy occlusion (e.g., face occlusion caused by masks) and extreme pose variations, the keypoint localization accuracy may decline, and the feature representation robustness needs further enhancement.
Future research will focus on the following four directions: (1) Designing more robust T-shaped features to strengthen the model’s adaptability to occluded and multi-pose faces, reducing the impact of occlusion and pose changes on localization accuracy. (2) Integrating the TSDM framework with lightweight neural networks to further improve localization accuracy while maintaining low computational overhead, achieving a better balance between precision and efficiency. (3) Carrying out targeted optimization for vehicle-mounted embedded chips to improve computational efficiency and enable real-time deployment on edge devices. (4) Extending the TSDM to real-time video streams and multi-face scenarios, broadening its application scope in intelligent cockpit systems, and promoting its practical value in driver state monitoring.