Article

A Demand Factor Analysis for Electric Vehicle Charging Infrastructure

1
Mining Industry Digital Transformation Lab, Kuzbass State Technical University Named after T.F. Gorbachev, 650000 Kemerovo, Russia
2
Microgrid Management Department, LLC “RTSoft-SG”, 105264 Moscow, Russia
3
Department of Research on the Relationship Between Energy and the Economy, Energy Research Institute of the Russian Academy of Sciences, 117186 Moscow, Russia
4
Department of Hydropower and Renewable Energy Sources, National Research University “Moscow Power Engineering Institute”, 111250 Moscow, Russia
*
Author to whom correspondence should be addressed.
World Electr. Veh. J. 2025, 16(9), 537; https://doi.org/10.3390/wevj16090537
Submission received: 24 August 2025 / Revised: 17 September 2025 / Accepted: 19 September 2025 / Published: 21 September 2025

Abstract

This paper investigates the factors influencing the power consumption of electric vehicle (EV) charging infrastructure and develops a methodology for determining the design electrical loads of EV charging stations (EVCSs). A comprehensive review of existing research on demand factor (DF) calculations for EVCSs is presented, highlighting discrepancies in current approaches and identifying key influencing factors. To address these gaps, a simulation model was developed in Python 3.11.9, generating minute-by-minute power consumption profiles based on EVCS parameters, EV fleet characteristics, and charging behavior patterns. In contrast with state-of-the-art methods that often provide limited reference values or scenario-specific analyses, this study quantifies the influence of key factors and demonstrates that the average number of daily charging sessions, EVCS power rating, and the number of charging ports are the most significant determinants of DF. For instance, increasing the number of sessions from 0.5 to 4 per day raises DF by 2.4 times, while higher EVCS power ratings reduce DF by 32–56%. This study proposes a practical generalized algorithm for calculating DF homogeneous and heterogeneous EVCS groups. The proposed model demonstrates superior accuracy (MAPE = 6.01%, R2 = 0.987) compared with existing SOTA approaches, which, when applied to our dataset, yielded significantly higher errors (MAPE of 50.36–67.72%). The derived expressions enable efficient planning of distribution networks, minimizing overestimation of design loads and associated infrastructure costs. This work contributes to the field by quantifying the impact of behavioral and technical factors on EVCS power consumption, offering a robust tool for grid planners and policymakers to optimize EV charging infrastructure deployment.

Graphical Abstract

1. Introduction

According to forecasts from the “Concept for the Development of Production and Use of Electric Automobile Transport in the Russian Federation until 2030” [1], servicing the fleet of electric vehicles (EVs) in 2030 will require approximately 54,000 electric vehicle charging stations (EVCSs), the installed capacity of which may exceed 3000 MW. The emergence of ultra-fast charging stations with unit capacities over 300 kW and the construction of charging hubs in high-demand areas (with installed capacities ranging from hundreds of kilowatts to tens of megawatts) may necessitate significant investments in strengthening urban and suburban distribution networks. This could increase the cost of building EVCSs and slow the development of EV charging infrastructure (EVCI) in Russia.
IRENA estimates [2] suggest that global EV electricity consumption could reach 3200–4590 TWh by 2040, with 339–490 million EVCSs worldwide. Uncontrolled EV charging could increase peak load by 9–20%. The Energy Systems Integration Group [3] estimates that investments of USD 16–50 billion will be required to strengthen the U.S. power grid for EVCI integration, depending on projected loads and consumption profiles. Research [4] indicates that by 2045, California may need to upgrade 67% of its feeders, requiring investments of USD 6–20 billion, or 10–40% of the current cost of the existing distribution network. A study in Nairobi [5] shows that replacing power transformers to support EVCI could cost between USD 300,000 and USD 1.5 million over five years, depending on the level of transport electrification.
Uncontrolled EVCI development can also degrade power quality in distribution networks. Numerous studies [6,7] demonstrate that EVCS operation can cause significant voltage deviations (up to −20%), negatively affecting urban and industrial power consumers [8,9], particularly with the widespread adoption of photovoltaic and wind power installations [10,11].
Accurately determining design electrical loads is crucial for planning the development of distribution networks with large-scale EVCI integration. The main methods for calculating design electrical loads are as follows [12]: (1) methods multiplying installed capacity by a factor less than one; (2) methods multiplying average power by a factor that may be less than, equal to, or greater than one; (3) statistical methods. When determining design loads for heterogeneous groups of consumers at transformer substation inputs and power supply center connections, the simultaneity factor (SF) is used. The most widely used methods for determining EVCI design loads belong to the first group, as confirmed by the literature review (Section 2). In this case, the design active power is calculated as the product of the installed capacity of the considered group of electrical consumers and the demand factor (DF).
Determining the values of DF and SF for EVCI is a non-trivial task, since the electricity consumption patterns of EVCSs are determined not only by the technical parameters of the EVCS but also by the technical parameters of the EVs and the specifics of EV owners’ charging behavior. However, as the literature review reveals, most existing approaches for determining DF suffer from two key limitations: (1) they often focus on a narrow set of parameters, primarily the number of charging ports and EVCS power, while neglecting the quantitative impact of behavioral factors such as the average number of daily charging sessions; and (2) they predominantly offer analysis of specific simulation results or provide reference DF values for direct application rather than proposing a generalized calculation methodology. To overcome these limitations, the primary objective of this work is to develop an algorithm for determining EVCI design electrical loads based on a comprehensive analysis of key influencing factors. This study distinguishes itself by quantifying the impact of these factors and formulating practical expressions for DF calculation with acceptable accuracy.
This paper is organized as follows: Section 2 provides an overview of the current state of research in the field of determining EVCI design electrical loads; Section 3 describes the developed simulation model for generating EVCI electricity consumption profiles and the experimental conditions; Section 4 presents an investigation of the influence of various factors on the DF; and Section 5 introduces the algorithm for determining the design electrical loads of EVCSs.

2. The Current State of Knowledge

A significant number of studies on determining the DF for EVCI have been published. This section provides a comprehensive analysis of the scientific literature in this field and offers a comparison of the quantitative results obtained by different authors.
Study [13] investigated the influence of EVCS power, the number of EVs, charging behavior (expressed as the probability of charging an EV depending on the battery state of charge (SOC)), and EV battery capacity on DF. The authors concluded that the most significant factors are the number of EVs and the EVCS power (reducing EVCS power from 22 to 3.7 kW increases DF by 23%), while battery capacity and charging behavior have a negligible effect (around 2%). DF decreases rapidly to 0.3 for more than 30 EVs and to less than 0.25 for more than 50 EVs. Similar results were obtained in [14], where DF ranged from 0.3 to 0.4 for 100 charging stations to approximately 0.2 for 1000 stations.
Research in [15], based on the Finnish National Household Travel Survey (NHTS), modeled and analyzed power consumption profiles and DF for EVCI. The study accounted for the influence of location type, ambient temperature, EVCS type, and available power. The results showed that the most significant influencing factor is location type (the difference between locations with the lowest (retail) and highest (workplace) DF values averaged 414%); EVCS power (average difference between highest and lowest DF values was 104%); and ambient temperature (average difference of 51% for slow EVCSs and 470% for fast EVCSs).
The authors of [16] modeled EVCI power consumption in the Frederiksberg district (Denmark) under the condition of full electrification of private passenger cars. Charging behavior was modeled using data from the Danish National Travel Survey. Five charging scenarios were considered, including uncontrolled EV charging and managed charging, where tariff adjustments incentivized shifting charging schedules. The modeling demonstrated that EVCI DF significantly depends on the EV charging control strategy and, in the worst-case scenario, can reach 94.8% in residential locations and 86.2% in workplace locations, whereas uncontrolled charging does not exceed 8.5–12.4% in residential locations and 16.8–27% in workplace locations.
A simulation of the electrical regime of five different low-voltage distribution networks was conducted in [17]: (1) 12 consumers; (2) 52 consumers; (3) 23 consumers, 100 kVA transformer; (4) 47 consumers, 250 kVA transformer; (5) 69 consumers, 400 kVA transformer. EVCS power consumption profiles were modeled based on real EV charging data collected from 300 Belgian households over one year. The analysis revealed that DF can vary significantly, ranging from 0.15 to 0.92. The most significant factor was EVCS power (increasing EVCS power from 3.5 to 11 kW can increase DF by a factor of 2.76). Average EVCS power consumption also had a substantial impact (increasing consumption from 10 to 30 kWh or more can raise DF by 100%).
A detailed study in [18] employed the Monte Carlo method to model power consumption for residential EVCSs (3.7 and 11 kW) to determine DF. The goal was to refine the coefficients of the Velander formula for EVCSs. The mean absolute percentage error (MAPE) when using refined coefficients ranged from 22.5% to 8.7% as the number of EVCSs increased from 5 to 45 for 3.7 kW EVCSs, and from 22.5% to 11.25% for 11 kW EVCSs. The average DF decreased from approximately 60% to 40% as the number of EVCSs increased from 5 to 50 for 3.7 kW EVCSs, and from 40% to 25% for 11 kW EVCSs.
Using the Monte Carlo method based on real EV power consumption data from 2014 to 2015, the authors of [19] modeled power consumption profiles for AC EVCSs with capacities of 3.5 and 7 kW. The modeling results showed that DF for 3.5 kW EVCSs decreased rapidly from 0.8 to 0.4 as the number of EVCSs increased from 10 to 100, reaching approximately 0.35 for 3000 EVCSs. For 7 kW EVCSs, DF was around 0.25 for 3000 EVCSs.
Simulation modeling in [20] was based on data from a German transport survey. Data from 316,000 surveyed individuals across various German regions were used to create statistical distributions of trip durations and arrival times in different urban areas, which were then applied to model EVCS demand. The study determined DF for EVCSs with power ratings ranging from 3.7 to 350 kW and quantities from 1 to 500 across seven region types. The analysis showed that reducing the rated power of EVCS decreased DF by 55–90% depending on the number of EVCS, while city size influenced DF by an average of 18.1% (smaller cities had higher DF).
The UK Power Networks Electric Vehicle Connections EDS 08-5050 standard [21] provides DF values for residential and public buildings. For residential buildings, DF depends on EVCS power and quantity: for EVCSs up to 6.6 kW, DF ranges from 0.5 to 0.31 for 1 to 274 or more EVCSs; for EVCSs from 6.6 to 22 kW, DF ranges from 0.5 to 0.22 for 1 to 274 or more EVCSs. For public parking lots, DF is set at 0.8.
An approach for determining the non-coincidence of peak loads for EVCI facilities was proposed in [22]. It involves describing the object under study and characterizing the charging behavior of the main users in the area; preparing EVCS usage data through direct data collection or open data from similar facilities; adjusting the data based on EV market development forecasts and EV parameter improvements; and calculating DF. The same study included an example of DF analysis based on EVCI usage data in Germany. The authors showed that DF decreased rapidly from 0.6 to 0.8 for 10 EVCSs to 0.2 or lower for 1000 or more EVCSs. The study also demonstrated that the rated power of EVCSs significantly affected DF by reducing charging session durations: a higher-rated EVCS resulted in lower DF.
It was demonstrated in [23] that EVCS DF depends on the time of day and day of the week (DF peaked in the evening on Fridays), charging service tariffs (time-of-use tariffs significantly increased DF during low-price hours), air temperature (lower temperatures increased charging frequency and DF), and terrain (hilly regions had higher DF than flat areas due to higher EV energy consumption).
The authors of [24] performed simulation modeling of fast EVCS power consumption profiles using the Monte Carlo method and investigated factors influencing DF. The conclusions were as follows: EVCS location type (intercity highways vs. urban areas) did not affect DF; increasing the number of EVCSs (from 2 to 8) reduced DF; increasing the number of arriving EVs per day (from 2 to 15) increased DF; increasing EVCS power (150–300 kW) reduced DF. In most cases, DF was around 0.5–0.6, reaching 0.9 in extreme scenarios.
In [25], the authors examined the influence of EV charging control strategies on EVCS power consumption profiles. The following strategies were considered: shifted charging, where EV charging is shifted to low-load hours (nighttime or periods of surplus generation from residential photovoltaic systems); weighted charging, where charging power is managed proportionally to the inverse load profile; smoothed charging, where charging power is optimized to flatten the load profile. The results showed that these strategies had a moderate impact: DF ranged from 0.37 to 0.56 for 50 EVs. The highest DF was observed for shifted charging, while the lowest was for weighted charging.
Amendment No. 7 to SP 256.1325800.2016 “Electrical Installations of Residential and Public Buildings. Design and Installation Rules” [26] proposes a methodology for determining design electrical loads for residential and public buildings with integrated EV charging infrastructure based on demand factors and utilization factors, which range from 0.4–1 to 0.5–1, respectively, depending on EVCS type and quantity. Section 7.4.5 states that if automation regulates the allocation of available power for charging infrastructure according to residential building peak load schedules, the charging infrastructure load can be calculated with an SF of 0.25 relative to the main residential load.
Researchers from Kazan State Power Engineering University [27,28] studied the problem of determining design electrical loads for EV charging infrastructure integrated into electrical installations of residential and public buildings. The authors concluded that additional grid capacity for connecting EVCI to residential and public building power supply systems will not be required until 2030 due to sufficient transformer substation capacity reserves. Based on the research, the authors developed the set of rules SP “Electrical Networks of Urban Microdistricts. Design Rules” [29]. According to this document, design electrical loads for non-integrated EVCS should be determined using the demand factor method, with values ranging from 0.15 to 0.95 depending on EVCS quantity and type, while the design electrical load for urban microdistrict consumers with EVCSs should account for an SF ranging from 0.83 to 0.85.
A summary of the literature review results is provided in Table 1. Figure 1 shows DF curves as functions of EVCS quantity and power, as obtained by various authors.
This review shows the following:
(1)
The main factors influencing DF, in descending order of significance, are as follows:
-
Charging control strategy—tariff-based regulation risks significantly increasing DF due to synchronization of charging for large numbers of EVs. According to [16], DF can increase by 2.5–10 times.
-
EVCS location type (residential, workplace, public, etc.)—differences in DF can exceed 400% [15].
-
Air temperature—lower temperatures increase DF (estimates range from 52–74% [19] to 470% [15]).
-
Average power consumption per session—higher consumption increases DF (up to 100%).
-
Number of EVCSs—more EVCSs lead to lower DF (average reduction of 33–95%).
-
Rated power of EVCSs—higher power reduces DF (approximately 50%).
-
Settlement size—smaller cities have higher DF (average increase of 18.1%).
-
EV parameters—battery capacity has a minor effect on DF, but this factor has received insufficient attention in the literature.
-
Geographical location—hilly areas have higher DF than flat regions.
(2)
DF estimates vary significantly across studies. Table 2 presents the relative root mean square error (RRMSE) of DF curves from Figure 1 compared with averaged DF values for EVCSs of different power ratings. The results show that deviations can exceed 40%.
The discrepancies in DF values obtained by different authors (Table 2) indicate an incomplete consideration of influencing factors. These results demonstrate that considering only the number of charging ports and EVCS power is insufficient for determining the values of the DF. To obtain more accurate estimates of the DF, it is also necessary to account for the specifics of EV charging behavior.
To generate EVCS power consumption profiles, the following minimal set of parameters is required:
-
Nominal technical parameters and number of EVCS charging ports;
-
Nominal technical parameters of charged EVs;
-
EV plug-in time probability distribution;
-
EV initial SOC probability distribution;
-
Charging session durations probability distribution;
-
Average number of charging sessions per day.
These parameters provide a complete picture of expected EVCS power consumption profiles and are considered key factors. Additional factors (e.g., ambient temperature, average EV mileage) can be indirectly accounted for through these key parameters (e.g., lower temperatures increase battery consumption, affecting charging session durations and daily charging frequency). Based on the analysis, Figure 2 illustrates the interrelationship of various factors. In the figure, derivative factors are shown in green, and key factors are shown in blue. For some factors, the effect of the factor on the change in DF is indicated in parentheses.
Factors such as the number of daily charging sessions, plug-in frequency, and charging duration were not directly examined in the reviewed studies. Instead, derivative factors like air temperature, location type, geographical position, energy consumption per session, and charging control strategies were analyzed, which influence the aforementioned key factors. Thus, to develop a methodology for determining EVCS design electrical loads, it is advisable to investigate the impact of key factors on EVCS power consumption.

3. Materials and Methods

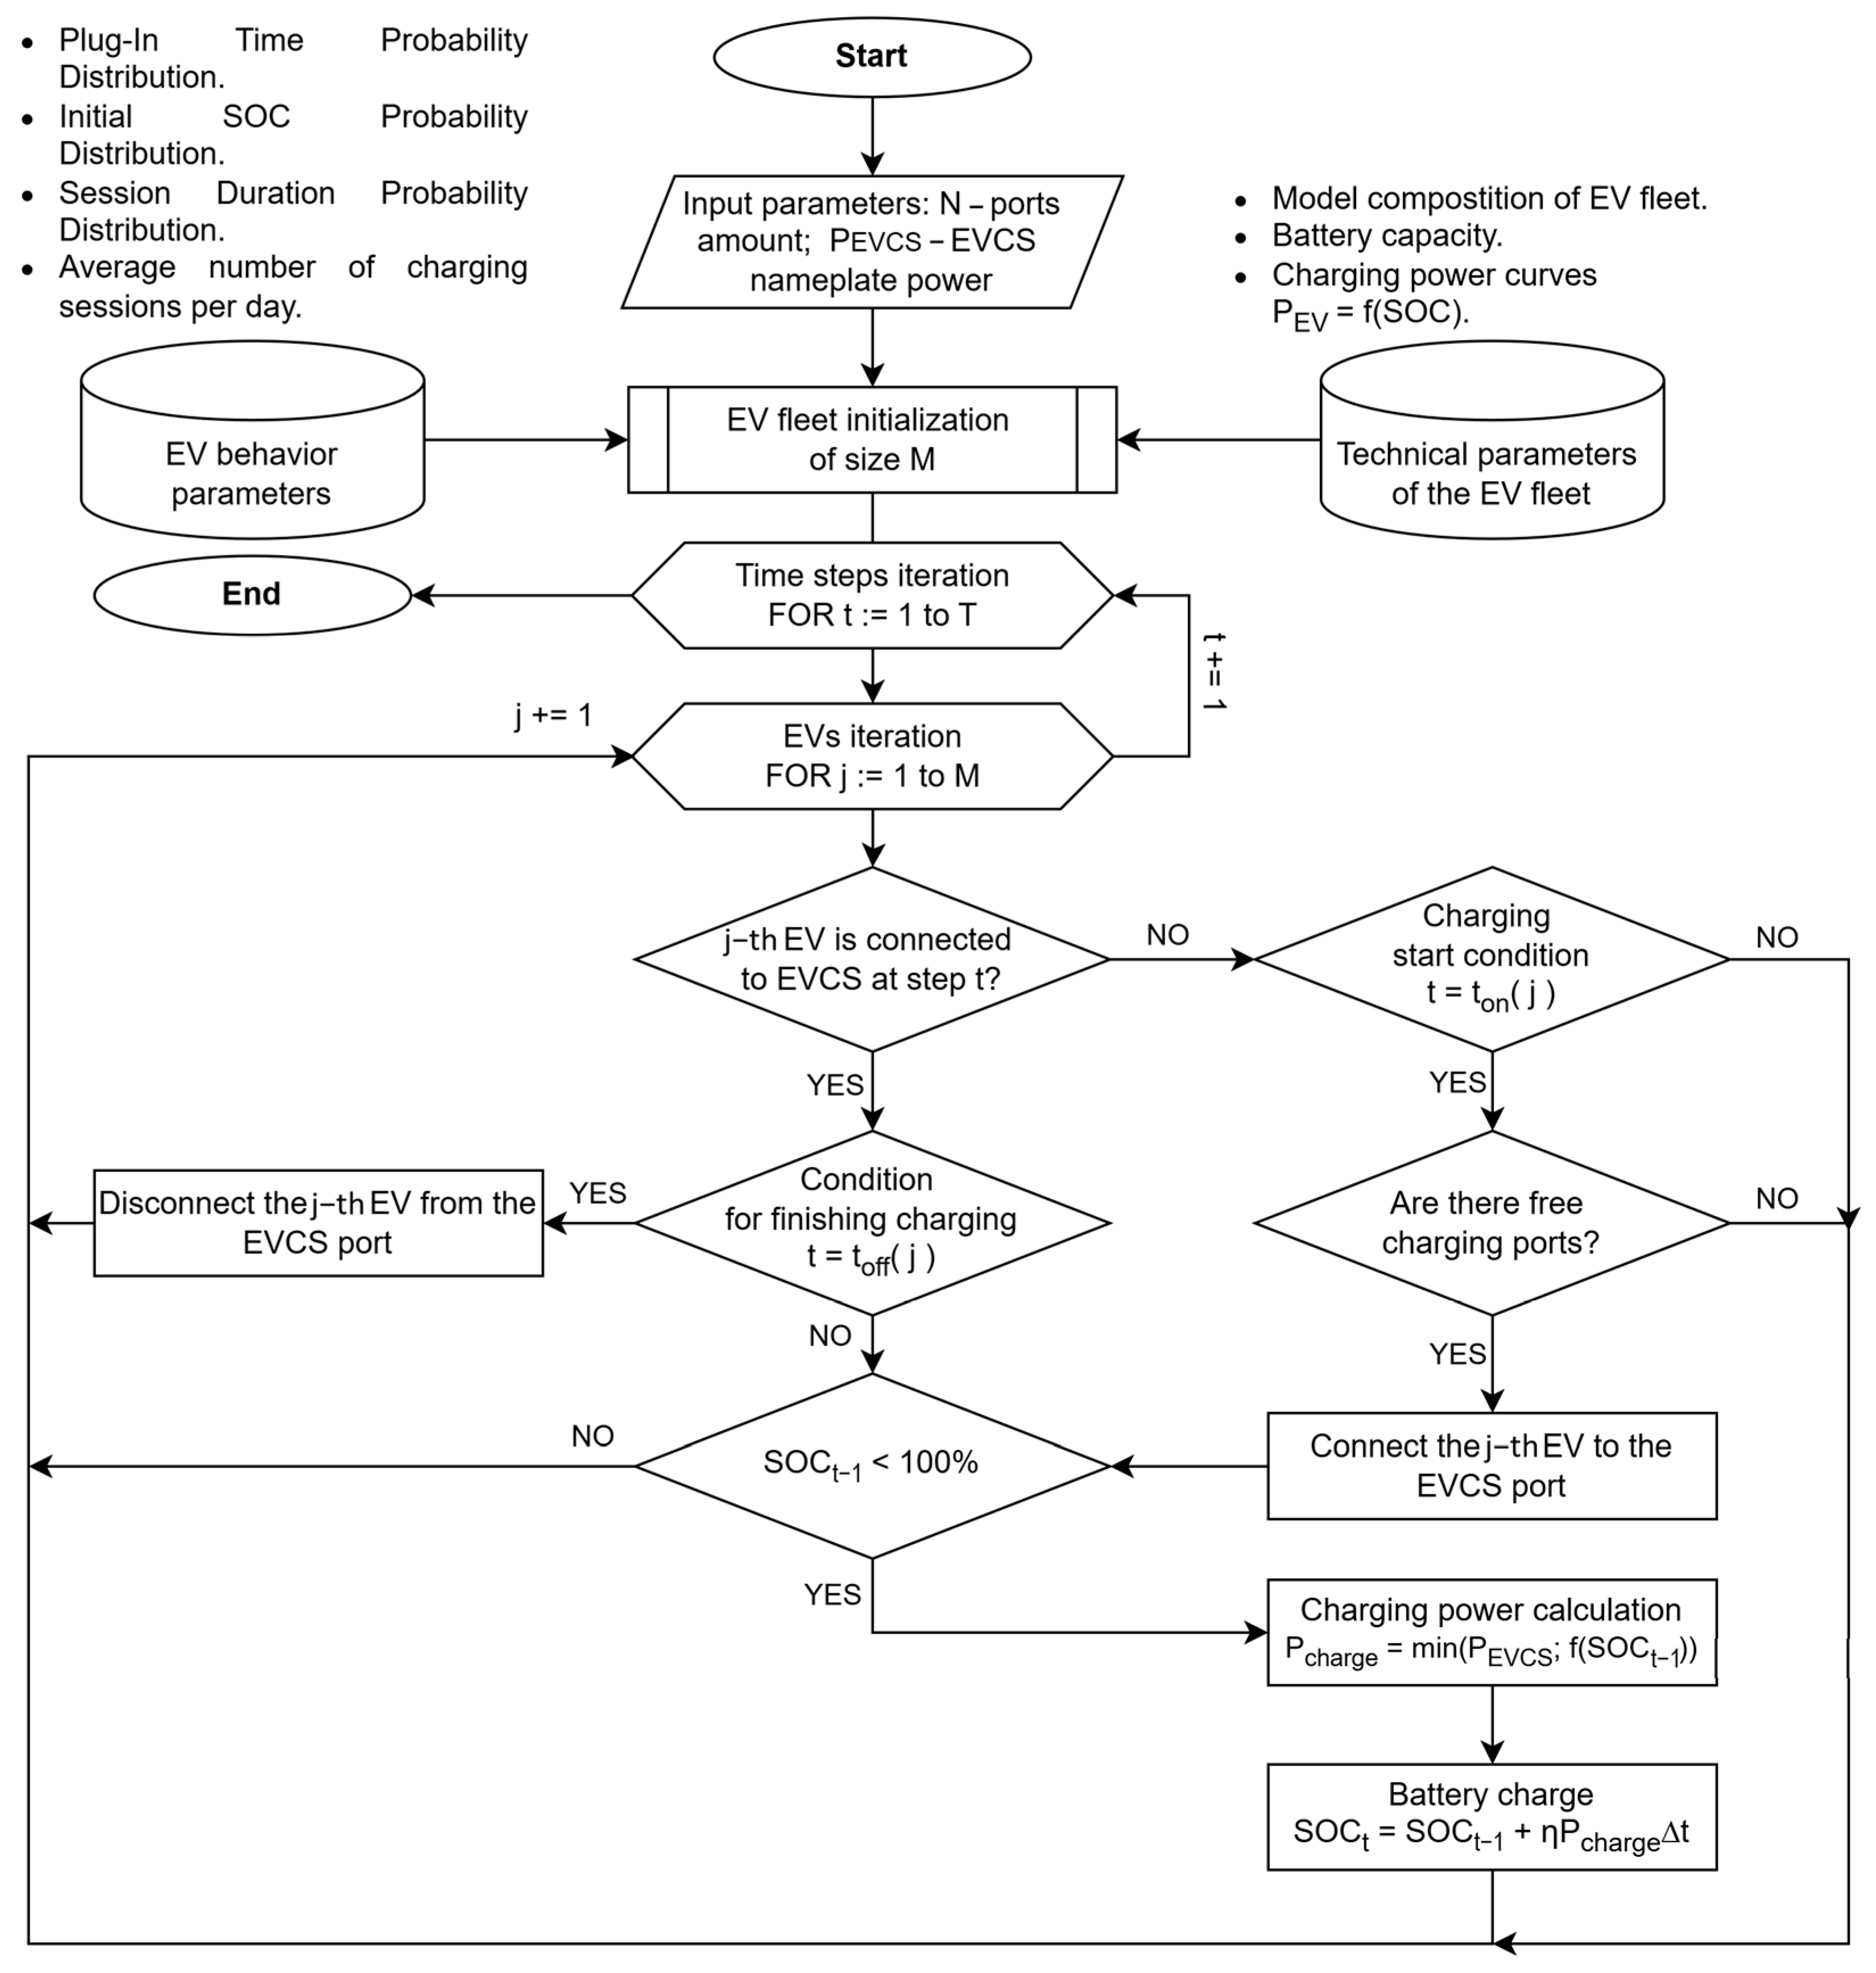
A simulation model was developed in the Python programming language to simulate EVCS power consumption profiles. This model allows for the stochastic modeling of EVCS usage patterns based on given probability distributions of EV plug-in times, initial SOC, charging durations, and average daily charging sessions. The developed model determines the status of each charging port and the power consumption of charging EVs for each minute of simulated time, while also modeling changes in EV battery SOC. The calculation of power consumption accounts for dependencies of charging power on battery SOC. The algorithm’s flowchart is shown in Figure 3. The calculation is performed as follows:
P c h a r g e , t = m i n P E V S O C , m , P E V C S ,
S O C t = S O C t 1 + η P c h a r g e , t Δ t ,
where PEV(SOC, m) is the charging power dependency on battery charge level for EV model m, kW (the dependencies were adopted from the electric vehicle knowledge exchange (evkx) website for the considered set of EV models, and the dependencies establish the values of PEV for SOC ranging from 1% to 100% with a step of 1%); PEVCS is the rated power of the EVCS charging port, kW; SOCt is the EV battery state of charge at time t, kWh; Pcharge,t is the charging power at time t, kW; ∆t is the simulation time step (1 min), h; η is the efficiency coefficient (assumed to be 0.95).
Different criteria were used to terminate charging sessions for fast and slow EVCSs. For fast EVCSs, it was assumed that the EV disconnects when the battery reaches 90% SOC (based on the analysis of open fast EVCS usage data [34]). For slow EVCS, disconnection occurs after reaching a predefined charging duration specified by probability distributions of EV charging times. This difference in termination criteria accounts for distinct charging behaviors when using fast versus slow EVCS, including potential prolonged idle times for slow EVCSs occupied by EVs that have already completed charging.
The simulation generates a time series of total power consumption for a homogeneous group of EVCSs at one-minute intervals. The simulation duration was set to 365 simulated days.
The demand factor (DF) is calculated as:
D F = P m a x i = 1 N P r a t e d , i ,
where Pmax is the maximum power consumption of the homogeneous EVCS group, kW (defined as the 0.99 quantile of the EVCS group’s power consumption time series); Prated,i is the rated power of the i-th EVCS charging port, kW; N is the total number of charging ports in the EVCS group.
For determining the design power of heterogeneous EVCS groups, the simultaneity factor (SF) is used, calculated as:
S F = P m a x i = 1 N P m a x , i ,
where Pmax,i is the maximum power consumption of the i-th EVCS group (defined as the 0.99 quantile of the time series), kW; N is the number of heterogeneous EVCS groups.
When calculating these coefficients, the EVCS power consumption time series was averaged over 10 min intervals, accounting for the thermal time constant for networks up to 1 kV (following recommendations of RTM 36.18.32.4-92).
The simulation of EVCS power consumption accounted for the influence of the following factors:
(1)
EVCS type: fast or slow.
(2)
Number of charging ports: 5 to 50.
(3)
Rated power of charging ports: for slow EVCSs: 3.7, 11, 22 kW; for fast EVCSs: 50, 120, 180 kW.
(4)
EV parameters: two variants of model fleet structures were considered: (a) current structure corresponding to the actual EV model distribution in the Russian Federation according to [35] (Table 3); (b) prospective structure: parameters of all EVs were conventionally set equal to those of Zeekr 001. EV parameters were based on data from [36].
(5)
Average daily charging sessions: for slow EVCSs: 0.5, 2, 4; for fast EVCSs: 2, 6, 12. The number of daily charging sessions followed a Poisson distribution.
The selected ranges for slow EVCSs were based on the following:
-
One and a half sessions per day corresponds to typical home EVCS usage: surveys of EV owners [37] show average home charging frequency of about four sessions/week (~0.6 sessions per day);
-
Four sessions per day represents the theoretical maximum usage for slow EVCSs; given the parameters of the modeled EV fleet, 3–5 EVs could be fully charged (0–100%) per day.
For fast EVCSs, the range of average daily charging sessions could vary more widely. The theoretical maximum for the modeled EV fleet when charging from 10% to 90% SOC corresponds to about 20 EVs. According to [38], the most popular charging station of PJSC “Rosseti Moscow Region” averaged 11 charging sessions per day in 2024.
(6)
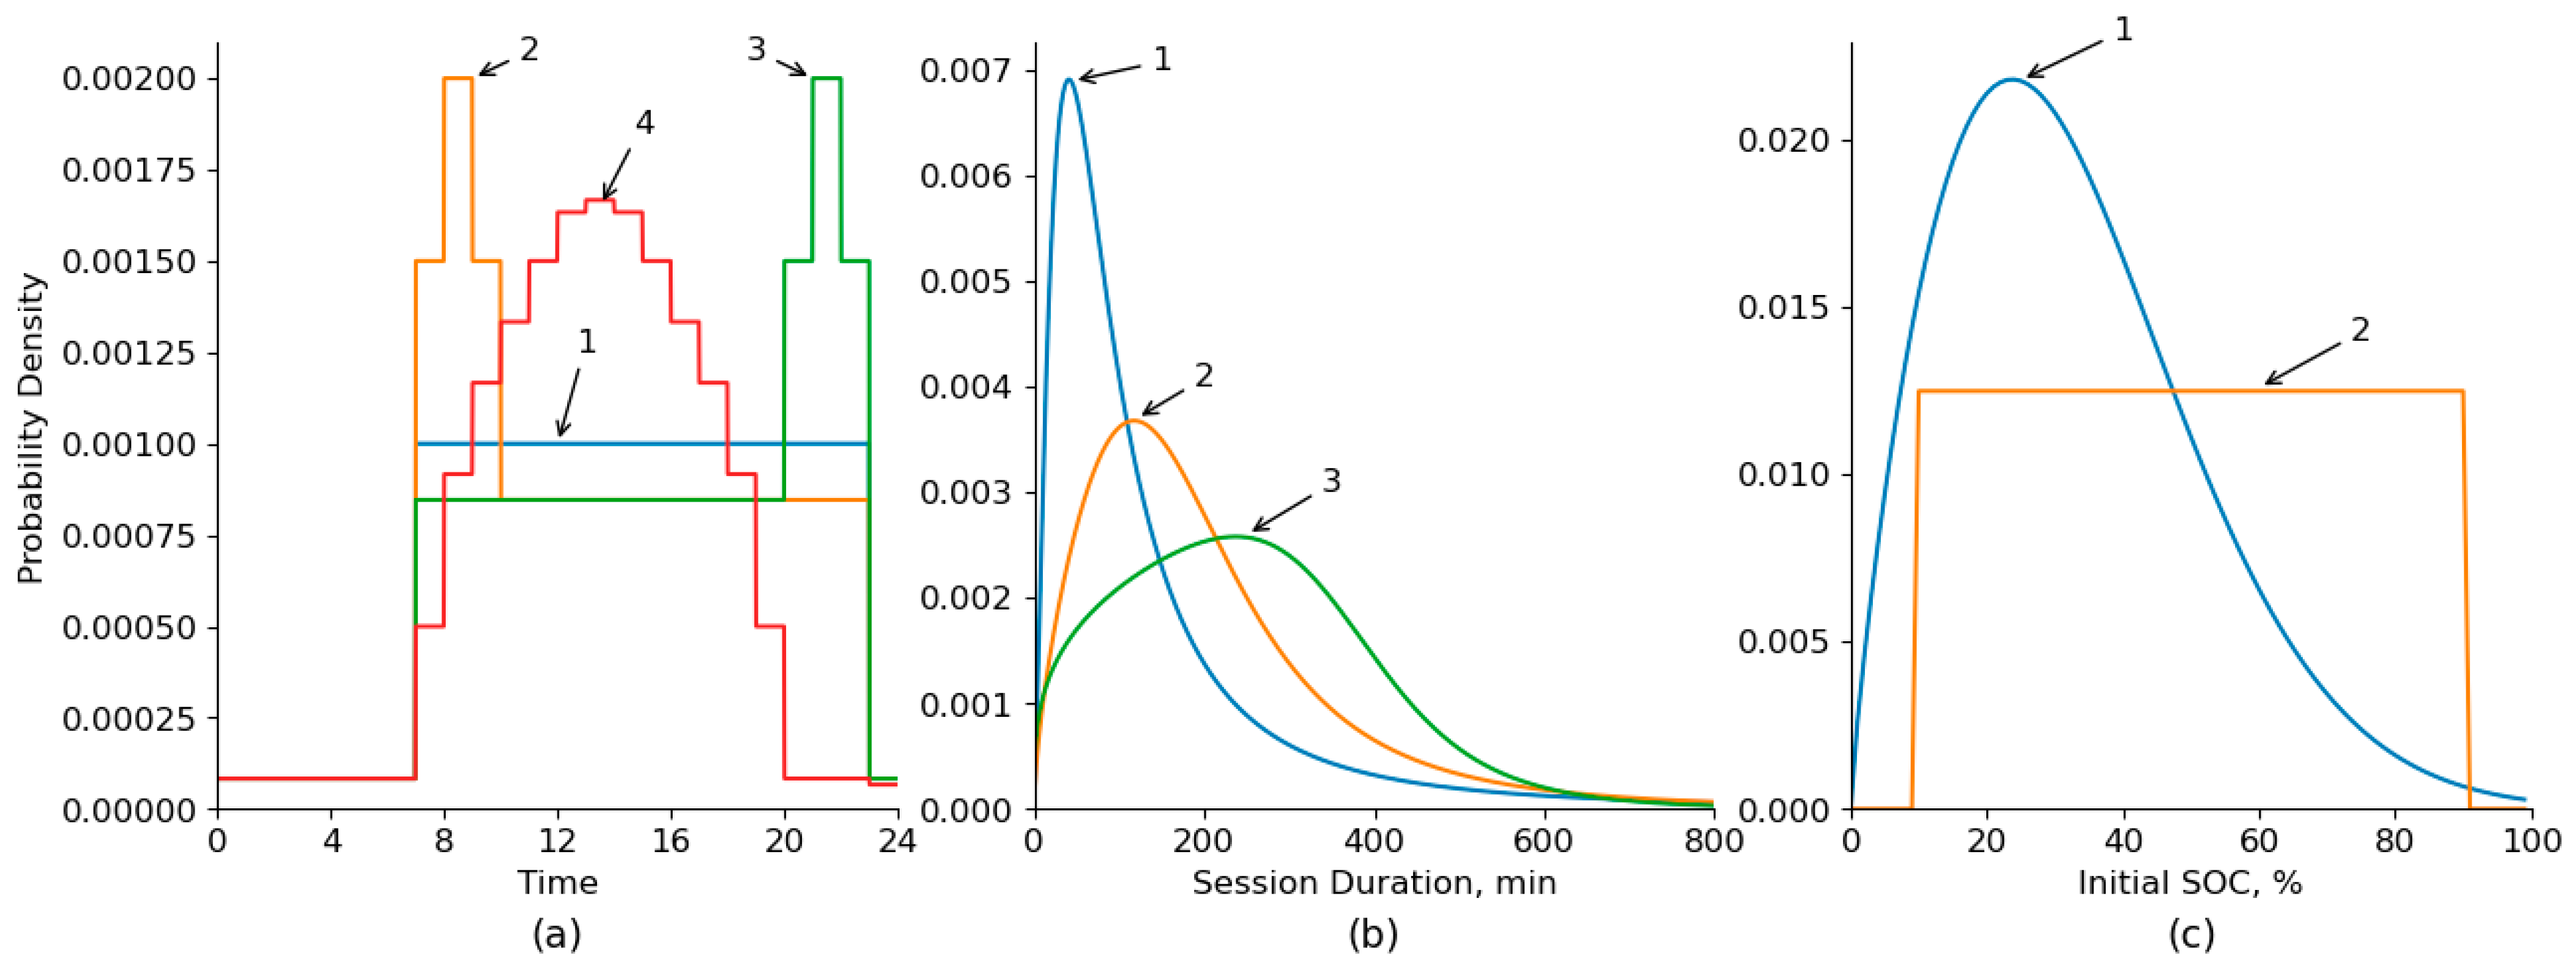
EV plug-in times. Based on the analysis of open EVCS usage data [39], four characteristic types of daily plug-in time distributions were identified (Figure 4a) as follows: 1—uniform distribution during working hours (typical for public areas and restaurants); 2—morning peak distribution (typical for stores and offices); 3—evening peak distribution (typical for residential areas and hotels); 4—afternoon peak distribution (typical for public parking lots).
(7)
Charging session duration (only for slow EVCSs). Based on the analysis of open EVCS utilization data [39] (data on 14,953 sessions of 990 EVCSs), three types of Burr distributions were adopted (Figure 4b) (the distribution parameters, as well as the KS-statistics (D) and p-value are given in brackets) as follows: 1—short sessions (median 88 min, typical for stores; distribution parameters: c = 1.50, d = 1.45, scale = 67.60 (D = 0.077, p > 0.05)); 2—medium sessions (median 169 min, typical for residential areas; parameters: c = 2.66, d = 0.62, scale = 225.48 (D = 0.0245, p > 0.05)); 3—long sessions (median 235 min, typical for campgrounds; parameters: c = 5.77, d = 0.23, scale = 406.23 (D = 0.053, p > 0.05)). For all distributions p > 0.05, there is therefore no reason to reject the hypothesis that the data follow a Burr distribution.
(8)
Initial battery SOC. Two distributions were used (Figure 4c) as follows: 1—Weibull distribution (parameters: c = 1.81, scale = 37.85 (D = 0.0236, p > 0.05)), based on the analysis of open data from [40,41,42] (in total, these papers present an analysis of data from 53,377 sessions of 882 EVCS); 2—uniform distribution between 10% and 90%.
It should be noted that the proposed simulation model is universal, as it operates exclusively within the parameters of the EVCS and user behavior, which are the primary and direct factors shaping the load. To account for the specifics of individual regions or EVCS locations, it is necessary to collect and analyze a sufficiently extensive dataset on the usage of the corresponding EVCS, followed by the development of characteristic statistical distributions of EVCS usage for modeling and investigating their electricity consumption profiles. It is important to note that obtaining access to such data can be challenging. In this regard, the present study adopted sufficiently broad distribution ranges covering different types of EVCS locations to investigate the influence of charging behavior characteristics on the DF. This approach allows for an assessment of the strength of the impact of these factors on the DF.
The following feature importance assessment methods were used for quantitative evaluation of factors affecting DF:
-
Filter methods: Spearman correlation coefficient, mutual information (Mutual_Info_Regression);
-
Wrapper methods: permutation feature importance, Shapley values.
-
This combination of methods provides a comprehensive assessment of the feature contributions to the DF value by identifying both monotonic and non-linear relationships between a feature and the target variable, as well as the overall predictive importance of the feature. The following approach is used for feature importance analysis and selection:
-
High values for all four metrics—a significant feature;
-
Filter methods: high score; wrapper methods: low score—a redundant feature (it has a statistical association with the target variable but is not actually used by the model in determining the DF value);
-
Filter methods: low score; wrapper methods: high score—the feature’s significance is only revealed through interaction with other features;
-
Low values for all four metrics—an insignificant feature.
Practical formulas for DF calculation were developed using multiple linear regression. Model accuracy was evaluated using RRMSE, MAPE, and R2 metrics.
To improve model accuracy, the following transformations were applied to dependent and independent variables: squaring, cubing, square root, logarithm, and exponentiation. To account for interactions between variables, new variables were created through multiplication, logarithmic multiplication, and normalized multiplication. Feature selection was performed using an exhaustive search.
The dataset of EVCS load profile coefficients (DF and SF) was created in several stages as follows:
(1)
Simulation of power consumption profiles for homogeneous EVCS groups under various influencing factors, with DF calculation for each group;
(2)
Generation of power consumption profiles for heterogeneous EVCS groups by summing profiles from stage 1, with SF determination. All possible combinations of two and three EVCS groups were considered.
All calculations were performed in Python using pandas, scikit-learn, shap, and statsmodels libraries.
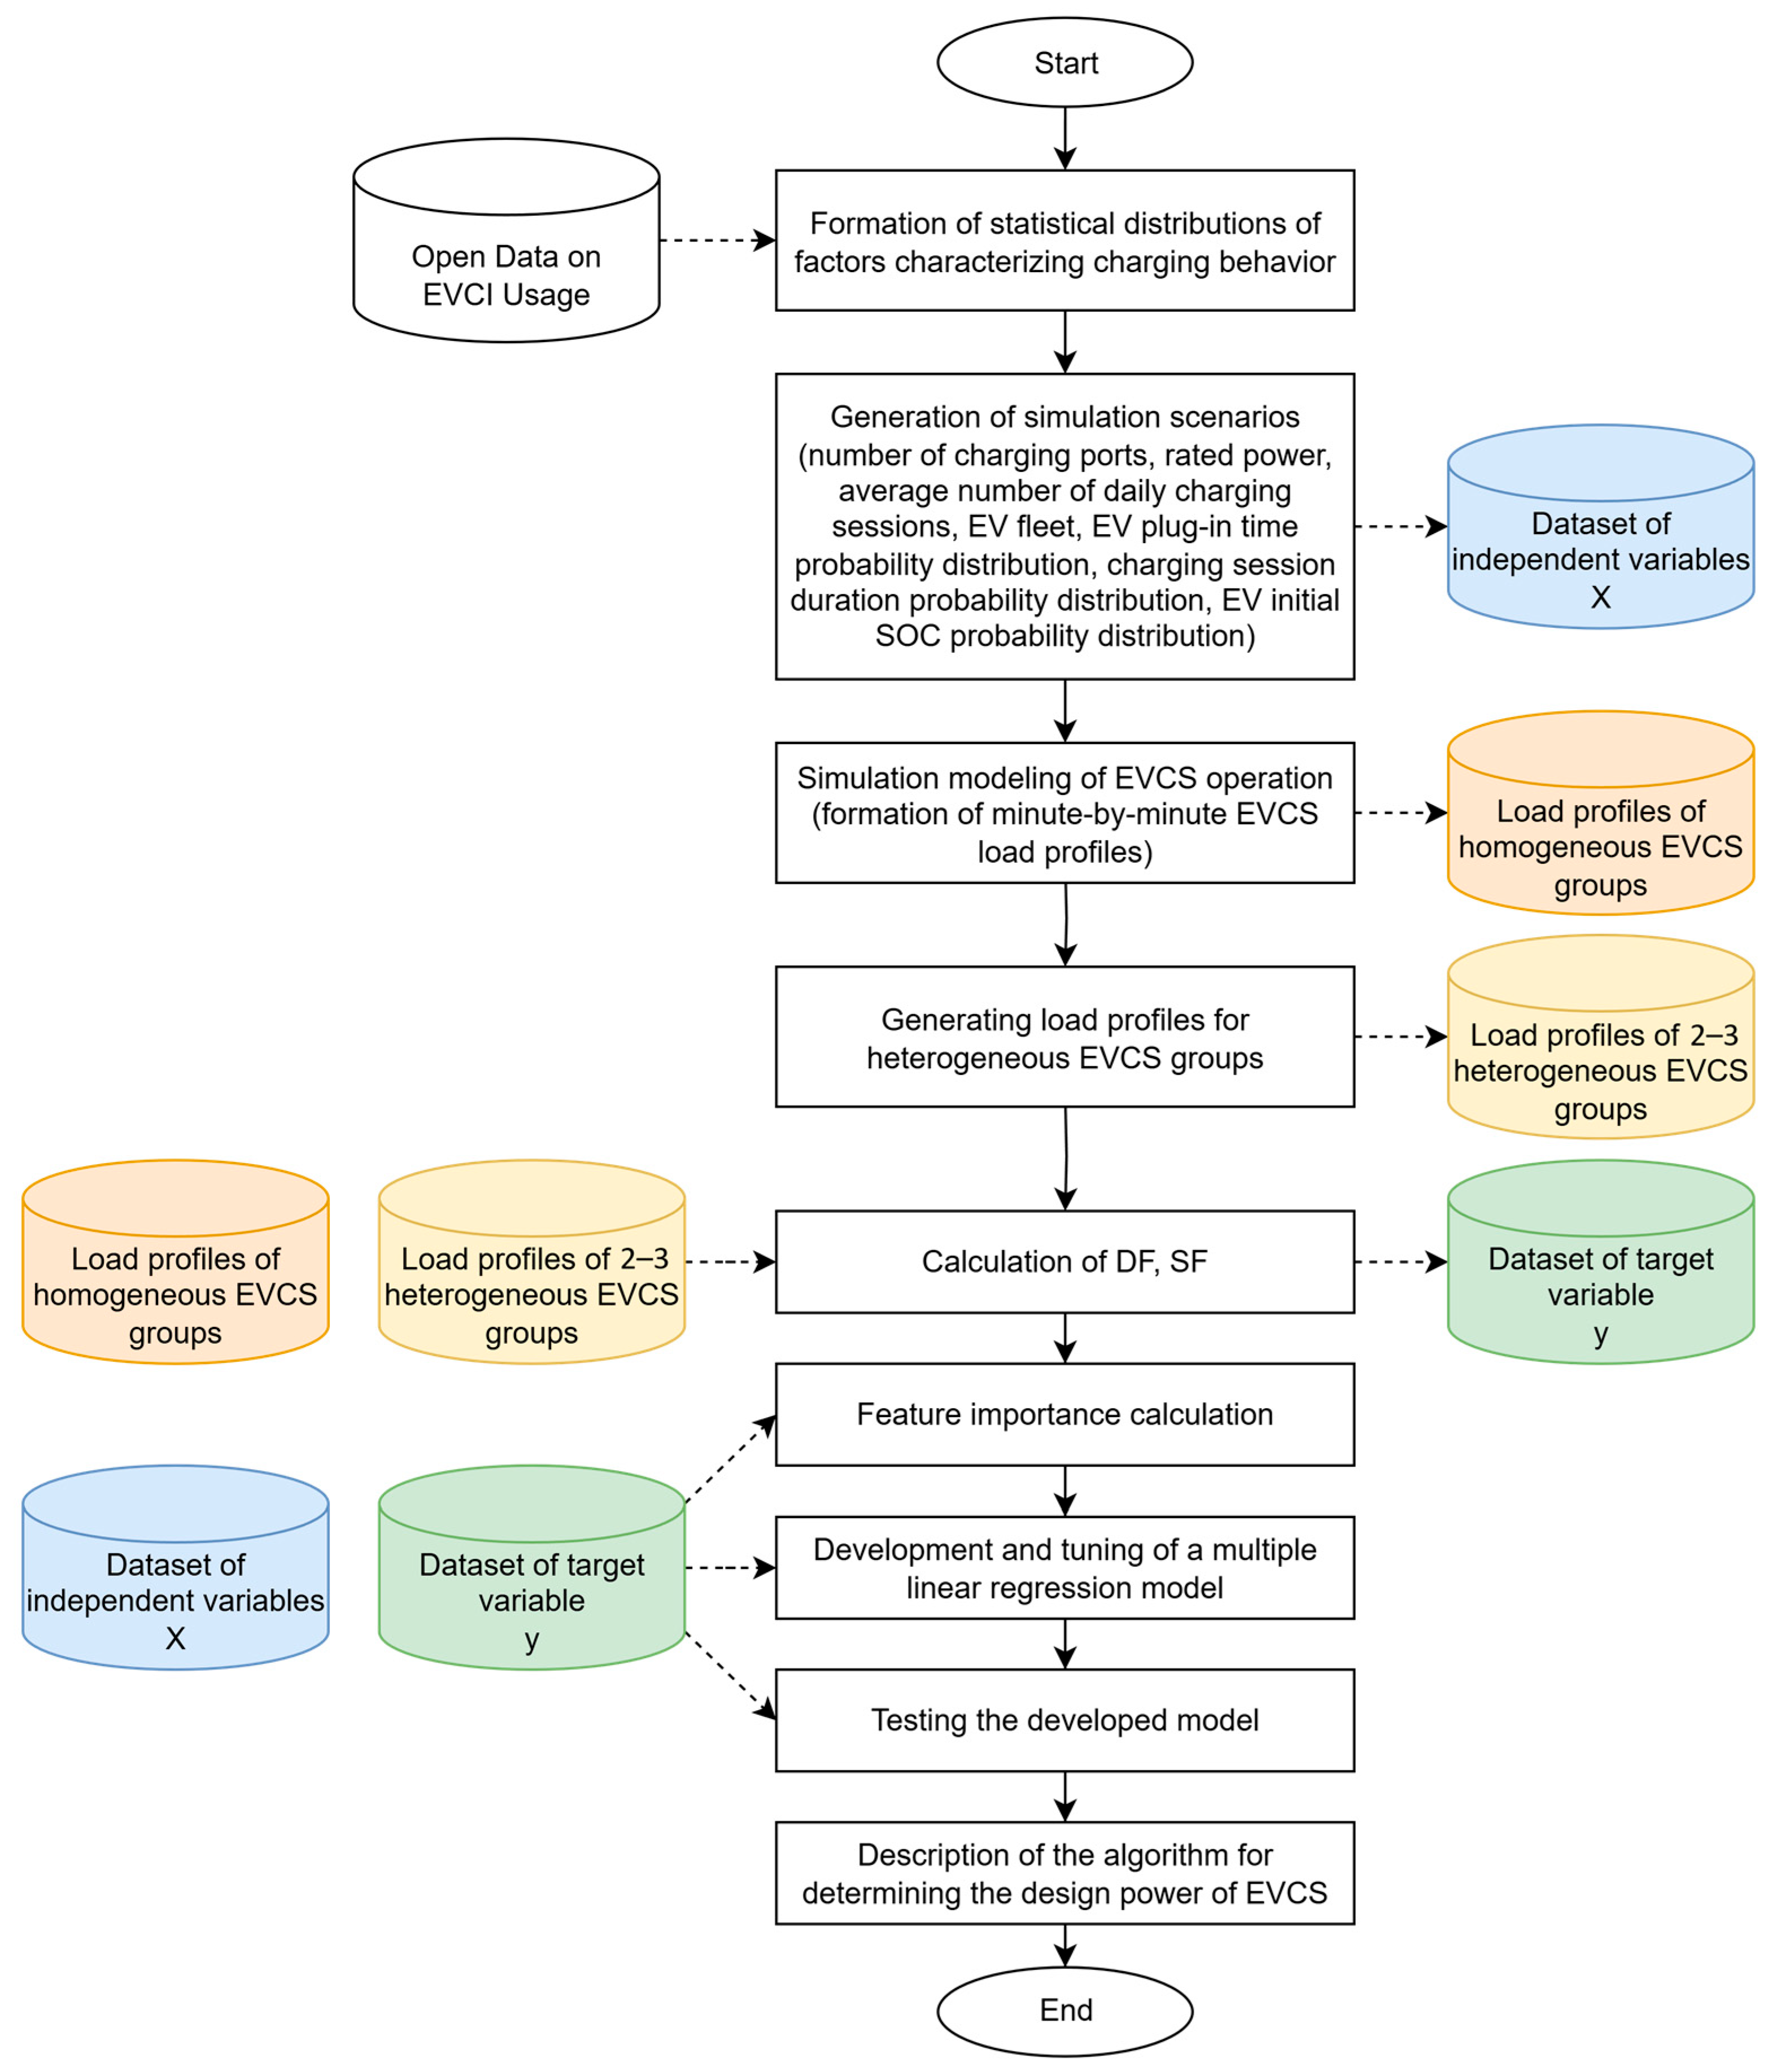
A high-level flowchart of the methodology is shown in Figure 5.
Assumptions adopted for the modeling are as follows:
-
Statistical distributions characterizing EVCS usage patterns in different countries, climate zones, and location types fall within the boundaries of the adopted distribution ranges;
-
A common rule for ending a charging session is adopted for all EVs at fast EVCSs: reaching a battery SOC of 90%;
-
A limited set of EV models, presented in Table 3, is used;
-
Smart charging capabilities (V1G, V2G) are not considered;
-
Ultra-fast charging stations with a charging port power exceeding 180 kW are not accounted for.

4. Significance Analysis of Factors Affecting the Diversity Factor

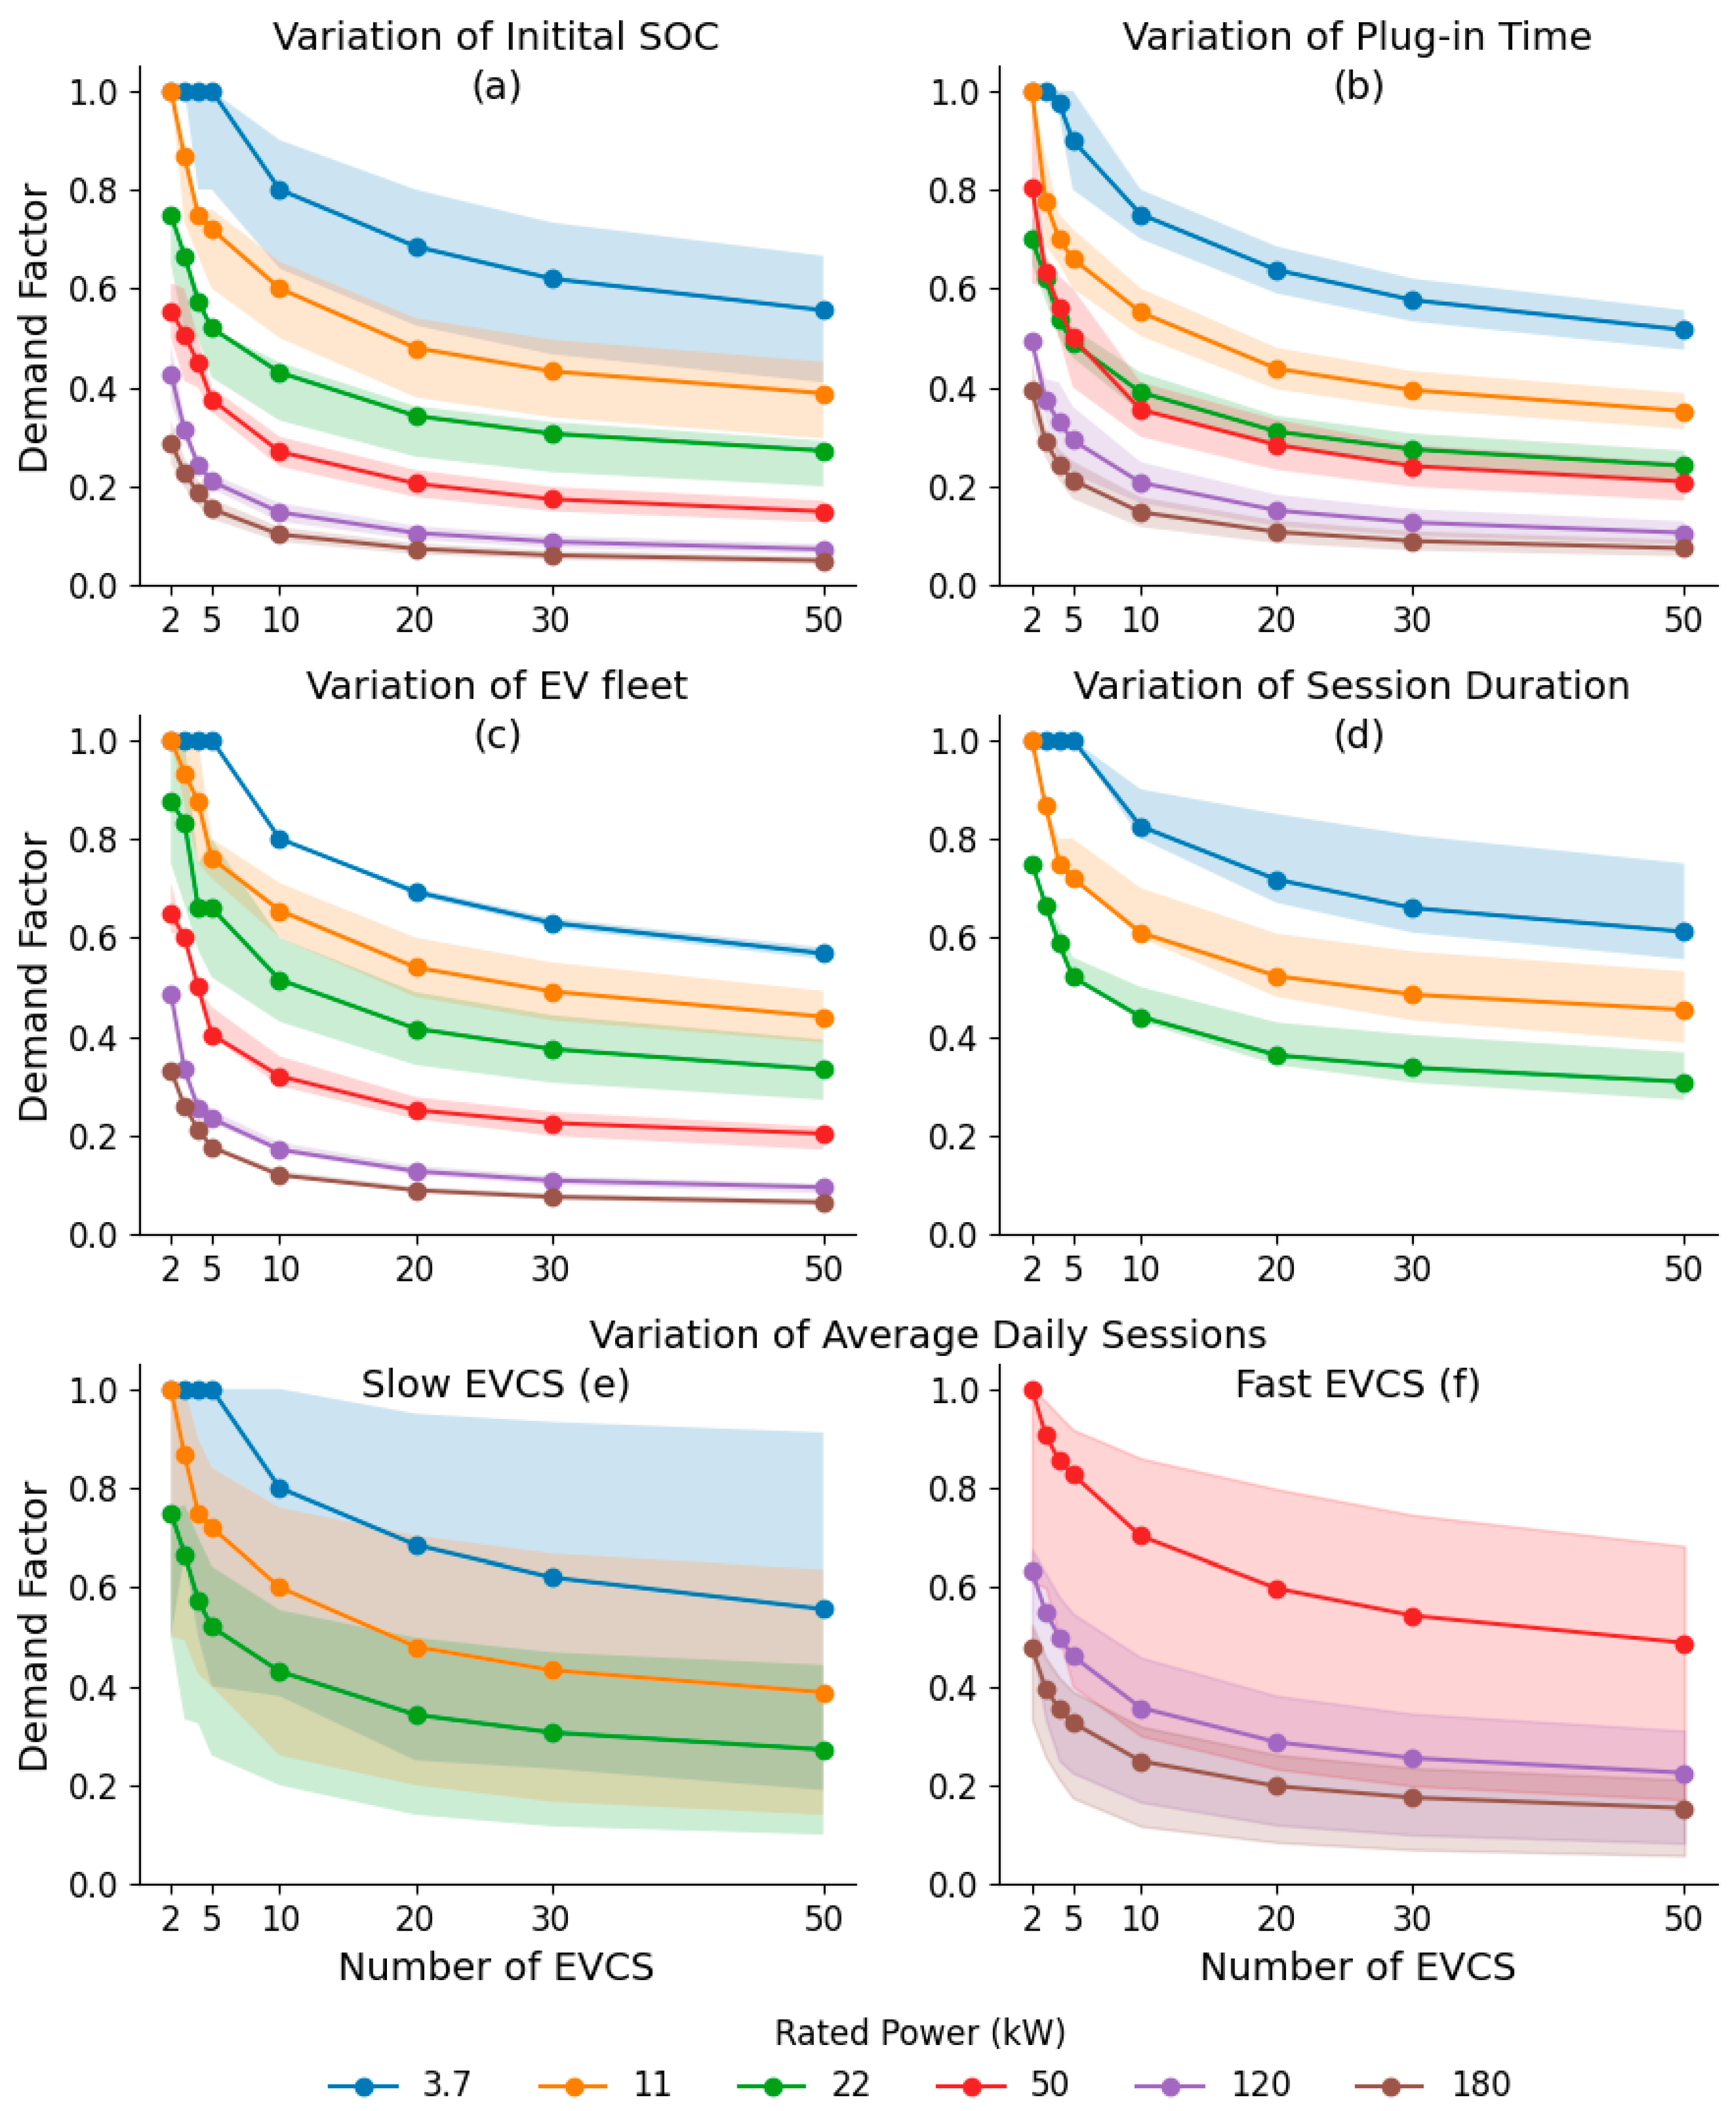
The graphs showing the dependencies of the DF for fast and slow EVCSs are presented in Figure 6. Solid lines represent average values, while shaded areas indicate the range of DF variation when accounting for the specified factors (initial battery SOC, plug-in time, EV fleet composition, charging duration, and average daily sessions). The variation of each factor is presented in a separate graph (the variation of the average daily sessions is shown on two graphs, separately for fast and slow EVCSs). The graph for session duration variation displays curves only for slow EVCSs, because, for fast EVCSs, the charging session ends not after a predetermined time has elapsed but when the EV’s battery reaches a 90% SOC.
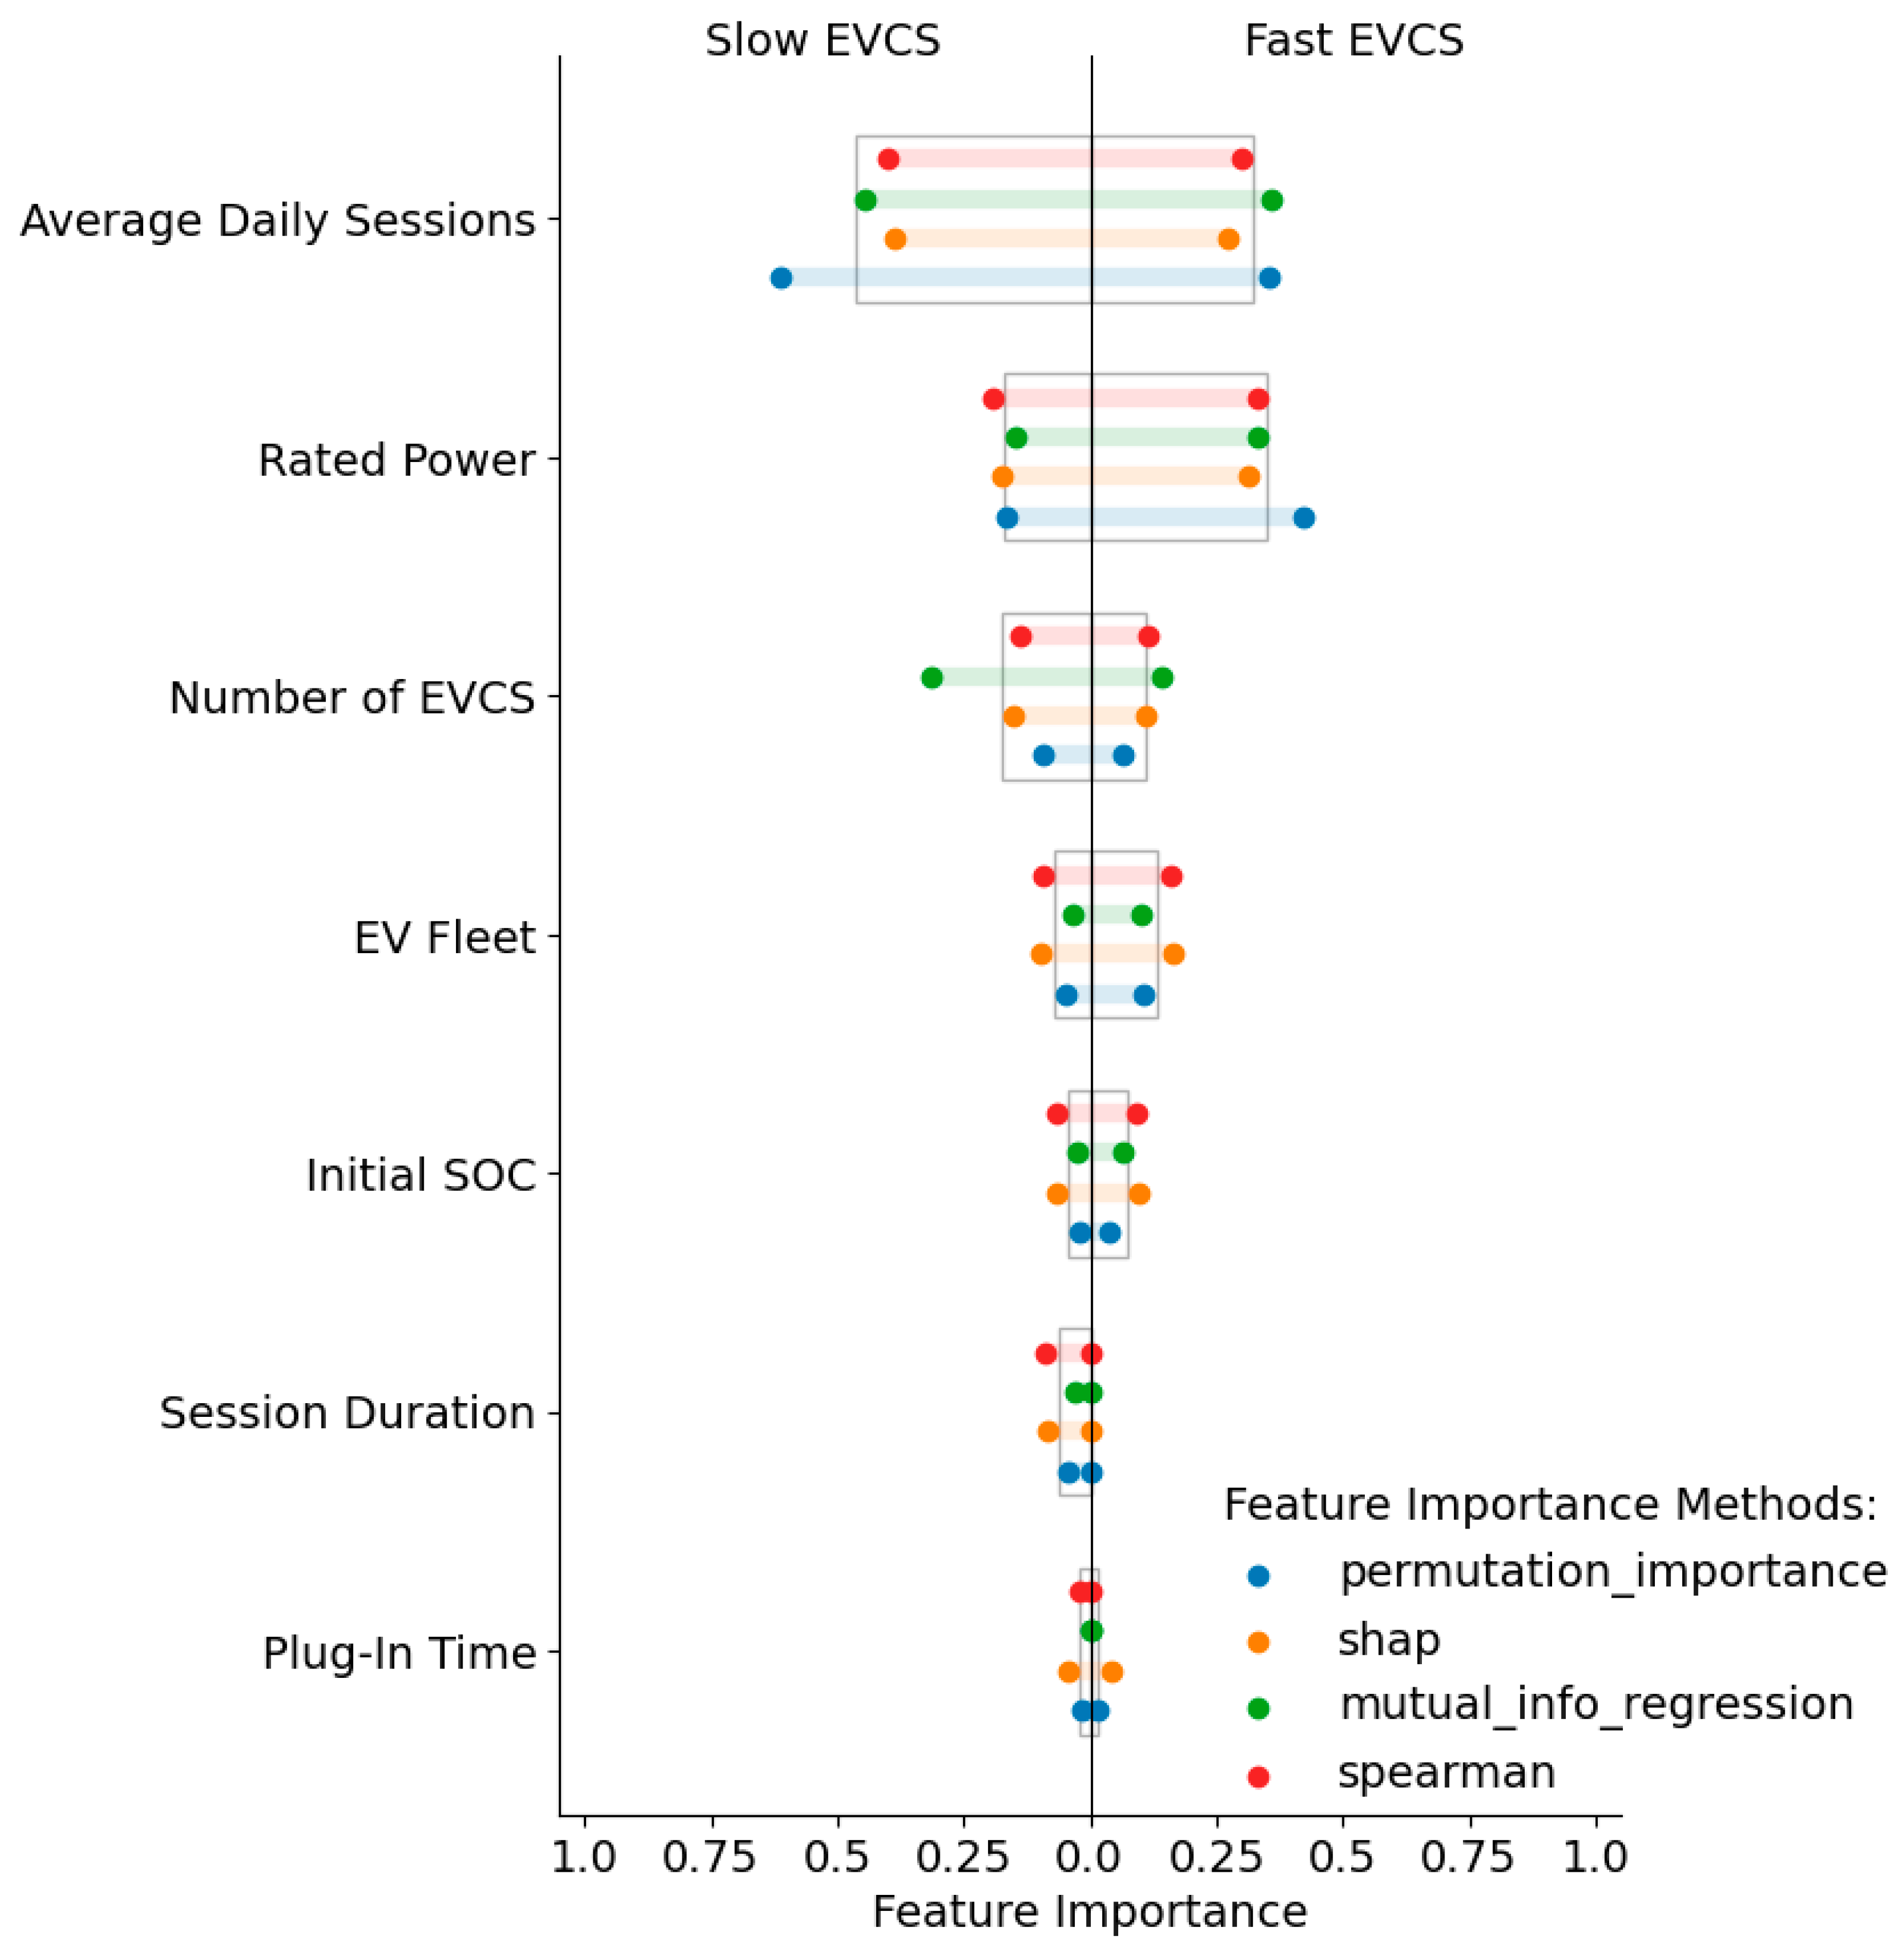
Figure 7 presents the results of assessing the importance of the considered factors affecting EVCS power consumption, using four different methods. The bars in the diagram show feature importance averaged across all methods. The importance estimates were highly consistent across all four methods, facilitating a straightforward interpretation of the results.
The most significant factor affecting the DF was found to be the average number of daily charging sessions. Figure 7 illustrates the relative feature importance, which was calculated as 0.46 for slow EVCSs and 0.32 for fast EVCSs (for fast EVCSs, this feature is secondary in importance to the EVCS rated power). The high relative importance value of this feature according to the permutation feature importance method may indicate the presence of interactions with other features. Increasing the number of sessions from the minimum to maximum values in the considered range led to a 2.4-fold increase in the average DF value.
The second most important factor was the rated power of EVCS charging ports. Increasing the power of slow EVCSs from 3.7 kW to 22 kW reduced DF by an average of 32%, while increasing the power of fast EVCSs from 50 kW to 180 kW reduced DF by 56%. Higher-power EVCSs enabled faster EV charging, decreasing the probability of load coincidence across charging port groups. Figure 7 illustrates the relative feature importance, which was calculated as 0.17 for slow EVCSs and 0.32 for fast EVCSs. This factor had a significantly greater importance for fast EVCSs compared with slow EVCSs.
The third most significant factor was the number of charging ports. Increasing the number of ports from 5 to 50 reduced the average DF by 38%. Figure 7 illustrates the relative feature importance, which was calculated as 0.17 for slow EVCSs and 0.11 for fast EVCSs.
The next important factor was the composition of the EV model fleet. The main differences between current and prospective EV fleets involved battery capacities, onboard charger power ratings, and maximum fast-charging capabilities (the most significant parameter affecting DF is the maximum charging power of EV). Older EV models had significant charging power limitations, leading to the underutilization of EVCS installed capacity and affecting DF. Transitioning from current to prospective EV fleets increased average DF by 17.7% for slow EVCSs and 41.1% for fast EVCSs. This factor affected EVCSs of different power ratings differently. As shown in Figure 6, the EV fleet composition primarily influenced 11 kW and 22 kW EVCSs, as most models in current fleets have onboard chargers with power ratings below 22 kW. Figure 7 illustrates the relative feature importance, which was calculated as 0.07 for slow EVCSs and 0.13 for fast EVCSs.
The remaining behavioral factors had relatively minor effects on DF. The probability distribution of EV plug-in times throughout the day had approximately equal influence across all considered EVCS power ratings and quantities. The influence of charging session duration was only considered for slow EVCSs. Longer average charging durations (including idle time after battery charging completes) resulted in higher DF values. Changing the initial battery SOC distribution from Weibull to uniform reduced DF by 9–16% on average.
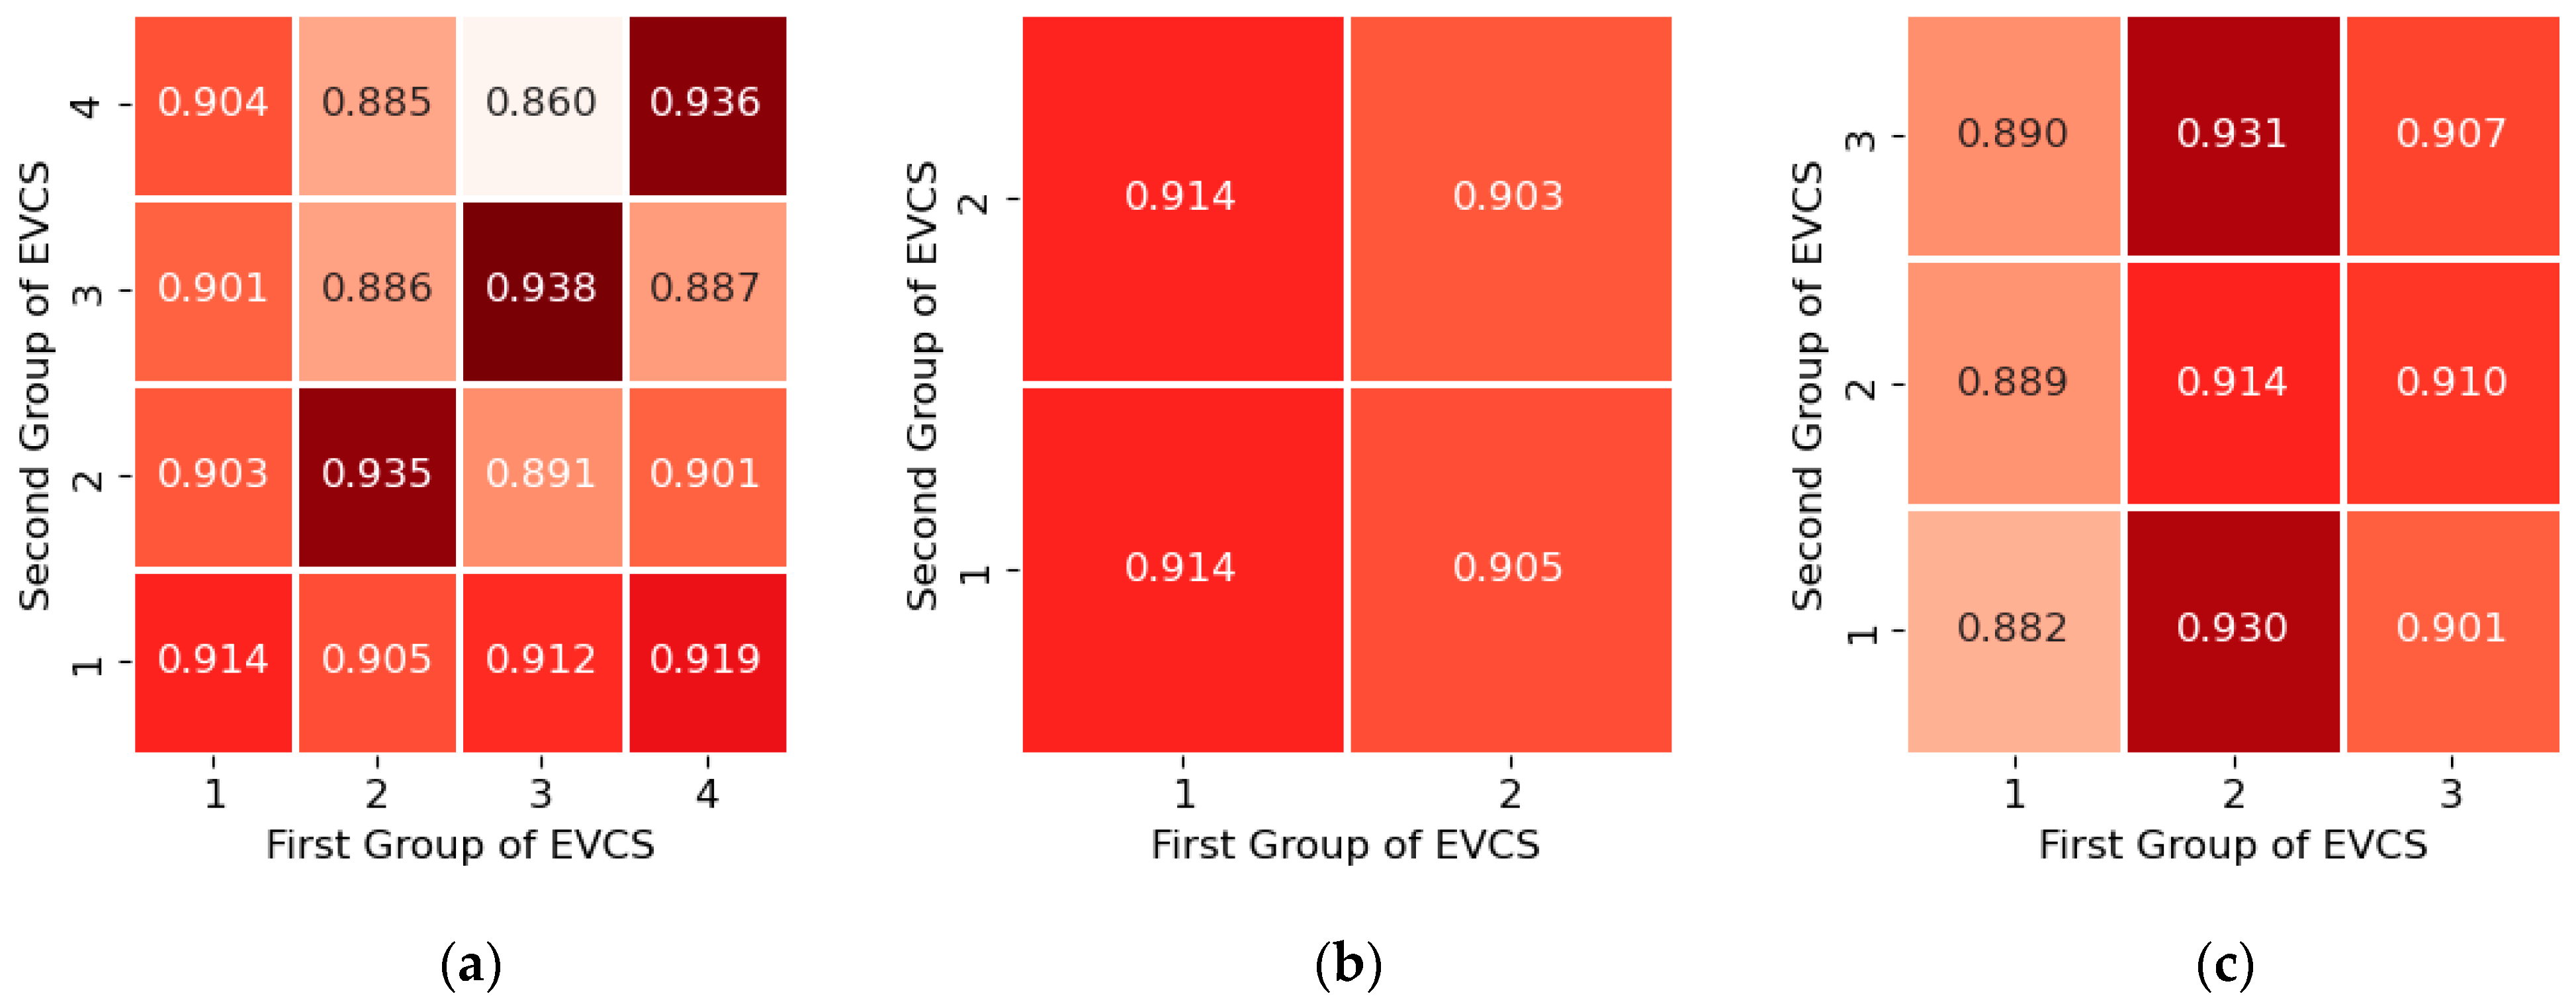
The influence of EV owners’ charging behavior on SF values when summing power consumption profiles of two EVCS groups is shown in Figure 8. The figure shows a heat map of SF values obtained by summing the power consumption profiles of two heterogeneous EVCS groups with different plug-in time, initial SOC, and session duration distributions. Charging behavior patterns had greater influence on SF than on DF. As shown in figure, the distribution of plug-in times had the strongest effect: SF was higher when different EVCS groups shared similar statistical distributions (the range of variation was approximately 8.59% of the relative mean value). Other factors had a lesser effect on the SF: the maximum range of variation in the SF for heterogeneous groups of EVCSs with different session duration distributions was approximately 5.34%, and for those with different initial SOC distributions, it was 1.27%.

5. EVCI Design Load Estimation Algorithm

Below is the expression for calculating the demand factor for fast and slow EVCSs, obtained through multiple linear regression under the following conditions: a prospective EV fleet structure was assumed, and behavioral parameters (initial SOC, charging session duration, and plug-in time) were not accounted for. To maintain high accuracy while keeping the analytical expression simple, five independent variables were selected (including more features would increase accuracy but overcomplicate the calculation):
D F = m i n β 0 + β 1 ln n + β 2 P + β 3 n · s + β 4 ln n · s + 1 + β 5 P · s · n ; 1 2 ,
where β0–β5 are coefficients of the multiple linear regression model; n is the number of charging ports in the EVCS; P is the rated power of the EVCS charging port, kW; s is the average number of charging sessions per day. The coefficient values are presented in Table 4. This expression is valid under the following conditions: the power range of EVCSs is from 3.7 to 120 kW; the total number of charging ports is from 5 to 50; the average number of daily sessions is 0.5–4 for slow EVCSs and 2–12 for fast EVCSs.
The model demonstrates robustness against overfitting, as evidenced by consistent high performance across all cross-validation folds R2 = 0.979 ± 0.018 (five folds). The small standard deviation (±0.018) in cross-validation scores indicates stable performance across different data splits.
To quantify the contribution of each variable to the model’s variance, a sensitivity analysis based on Sobol indices was performed. The results are presented in Table 5 in the form of first-order indices (S1) and total-effect indices (St), which reflect the influence of individual factors and their interactions on the model output. Variables 1 and 4 make the largest contribution. Despite the introduction of transformations and interaction terms, their combined effect does not lead to a substantial change in the overall contribution. This indicates the stability of the model.
The simulation results for power consumption profiles of heterogeneous EVCS groups showed an average SF of 0.868 ± 0.061. When determining design power for heterogeneous EVCS groups, the SF showed much less dependence on the considered influencing factors; the interquartile range was less than 10% relative to the mean SF value. This allowed using the average SF value with sufficient accuracy for practical determination of design loads for heterogeneous EVCS groups.
Table 5 presents accuracy metrics for calculating the maximum power of EVCS groups (confidence intervals for metrics obtained using the bootstrap method are given in brackets). The following expressions were used to determine the design power of homogeneous and heterogeneous EVCS groups:
P h o m = D F n , P , s · i = 1 n P r a t e d , i ,
P h e t = S F · i = 1 N P h o m , i ,
where Phom and Phet are the design powers of homogeneous and heterogeneous EVCS groups, respectively, kW; n is the total number of charging ports in a homogeneous EVCS group; s is the average number of charging sessions per day; N is the number of heterogeneous EVCS groups. The demand factor in Equation (6) was determined using Formula (5). The simultaneity factor in Equation (7) was set equal to the average value obtained from simulation results (0.868).
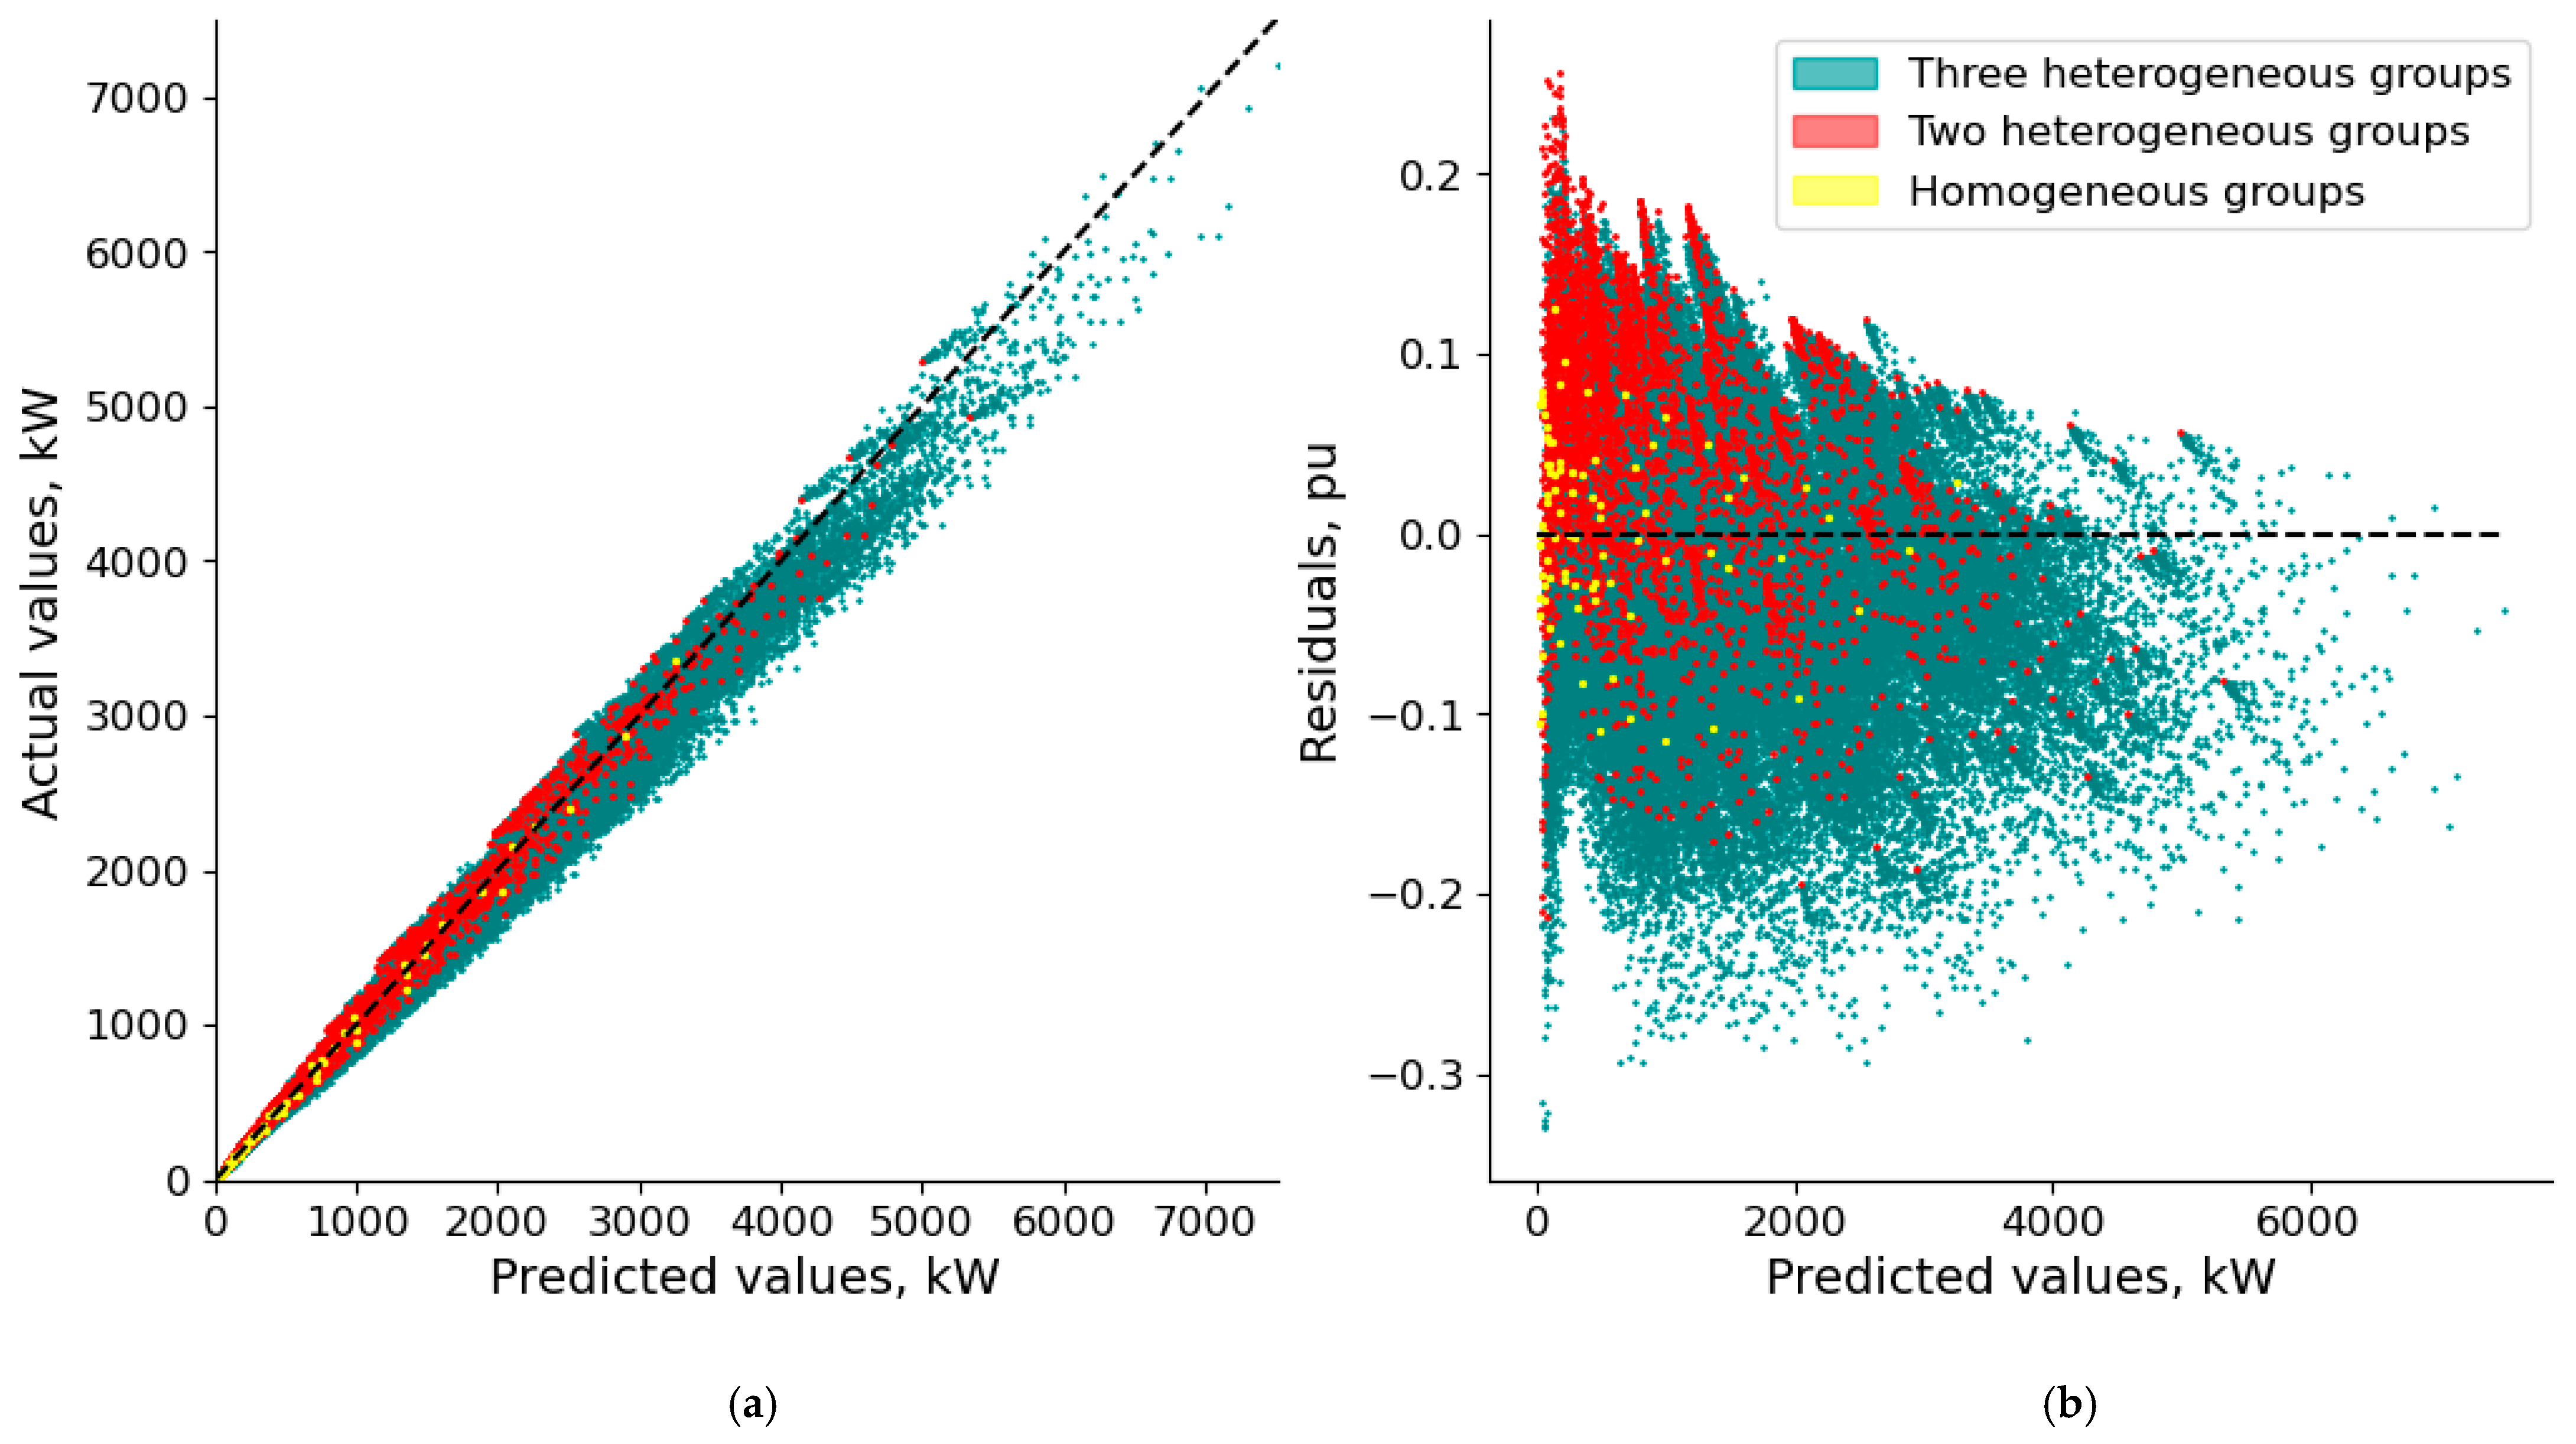
Figure 9 presents a plot of the calculation error for the design power of homogeneous and heterogeneous EVCS groups, obtained using expressions (6) and (7). The power rating of the charging ports had the greatest influence on the error. As can be seen from the graph, the relative error was at its maximum when the total installed power of the EVCS group was at its minimum.
The observed deviations in the design power (Table 5) are due to the fact that charging behavior characteristics—specifically the probability distributions of plug-in times, charging durations, and initial battery SOC—are not accounted for in Equation (5). Incorporating these factors into the calculation would lead to its overcomplication. Moreover, obtaining reliable data on these statistical distributions under real-world conditions may prove difficult.
The developed Equation (5) provides sufficient accuracy for practical applications. However, it is important to note that, since not all behavioral factors are accounted for in the proposed formulas, the calculation results provide approximate values for the EVCS design power, with deviations as shown in Table 5 and Figure 9. When charging behavior distribution data are available, simulation modeling (Figure 3) should be used instead of Equation (5) to improve the accuracy of the design power estimation.
When the data presented in Figure 1 are used to estimate the design power for the considered dataset, the mean absolute percentage error (MAPE) ranges from 50.36% to 67.72%. Thus, the currently accepted methods for determining the DF, which consider only the number and power of EVCS charging ports, are unable to determine the DF with sufficient accuracy.
To use the presented calculation methods, it is sufficient to have data only on the number of ports, the rated power of the EVCS, and the average number of daily charging sessions. Estimating the average number of daily charging sessions presents the greatest challenge. As shown in studies [34,43,44], the number of charging sessions at existing EVCI facilities can vary widely. Therefore, reliable estimates should use statistical data collected from large samples of similar EVCS groups in comparable locations. Consequently, it is important to perform a sensitivity analysis of the DF calculation using Equation (5) under conditions of input parameter uncertainty. The calculation results showed how an error in determining the average number of daily charging sessions (s) affected the error (MAPE) in the DF calculation:
-
s ± 5%—increase in DF calculation error: from 0.36% to 0.72%;
-
s ± 10%—increase in DF calculation error: from 1.87% to 2.43%;
-
s ± 20%—increase in DF calculation error: from 6.05% to 8.40%.
As the results indicate, Equation (5) was sufficiently robust to input parameter uncertainty: a 20% error in determining the average number of daily charging sessions led to an increase in the DF calculation error of no more than 10%. Sensitivity analysis for variations in the number and rated power of the EVCS was not performed, as these input parameters can be determined with high accuracy.
Based on this research, the following procedure can be formulated for determining EVCS design electrical loads:
  • Determine parameters for homogeneous EVCS groups: number of charging ports; rated power of charging ports; average number of daily charging sessions.
  • Calculate demand factors using Equation (5) and design power using Equation (6) for each homogeneous EVCS group.
  • Determine the design power for heterogeneous EVCS groups using Equation (7).
As an example, consider determining the design power for a heterogeneous EVCS group consisting of the following:
-
Subgroup 1: 3.7 kW, 30 units, 2 sessions per day.
-
Subgroup 2: 22 kW, 50 units, 4 sessions per day.
-
Subgroup 3: 50 kW, 10 units, 6 sessions per day.
Then, use Equation (5) to calculate DF yield values of 0.621, 0.655, and 0.758, respectively. The design powers for these subgroups (with mean error 6.11%) are:
P h o m , 1 = 3.7 · 30 · 0.621 = 68.99 ,
P h o m , 2 = 22 · 50 · 0.655 = 721.15 ,
P h o m , 3 = 50 · 10 · 0.758 = 378.94 .
The total design load for all EVCSs is calculated using Equation (7):
P h e t = 0.868 · 68.99 + 721.15 + 378.94 = 1014.66 .
The actual maximum load (99th percentile) for this EVCS group is 1040 kW, resulting in a 2.43% error.
When using the data presented in Figure 1 to estimate the design power of the considered heterogeneous EVCS group, values ranging from 362.46 to 845.86 kW were obtained (deviations from 18.66 to 65.15%). The deviations for the three homogeneous EVCS groups with power ratings of 3.7, 22, and 50 kW ranged from −23.71 to 73.18%. These results demonstrate that considering only the quantity and power of EVCSs when determining the DF is not a satisfactory approach, as indicated by the significant spread in DF values obtained by different authors for similar EVCS groups (Figure 1). In the view of the present authors, to achieve more accurate design power estimates when determining the DF, it is necessary to consider not only the rated power and quantity of EVCSs, but also the average number of daily charging sessions. Accounting for additional behavioral factors (probability distributions of plug-in times, charging durations, and initial battery SOC) can provide a further improvement in calculation accuracy (up to 10%). However, for their consideration, the use of simulation modeling methods is recommended.
The proposed expression for determining the DF (5) is a universal model for a wide range of conditions. Its parameters (n, P, s) are fundamental variables describing any group of EVCSs. To adapt this expression to a specific scenario, a designer needs to determine the most probable values of the average number of daily charging sessions (s) for the object under consideration. The following example scenarios can be distinguished:
-
Home charging: s = 0.4–0.6 (charge once every 2–3 days);
-
Lowload public EVCSs: s = 1–2;
-
Mediumload public EVCSs: s = 3–6;
-
Highload public EVCSs: s = 7–12.
Since the utilization of an EVCS can significantly depend on its location, further research is required to establish the influence of geospatial factors on the frequency of EVCS usage. Forming characteristic usage scenarios for EVCSs necessitates conducting separate studies involving the analysis of large volumes of statistical data. Consequently, this issue will be addressed by the authors in future works.
If the design power of an EVCS group exceeds the available capacity for grid connection, solutions involving EVCS power management can be implemented to reduce design power by limiting charging for some EVs during peak load hours at supply points. As shown in [45], connecting EVCS groups to transformer substations without increasing their maximum capacity is possible through minor annual charging power limitations and EVCS revenue reductions when using dynamic power balancing systems. Besides reducing distribution network reinforcement investments [46,47], this approach may improve reliability and equipment lifespan by flattening daily load profiles at supply points [48].
The key distinction of this work from the existing research on EVCS electrical loads lies in its comprehensive consideration of influencing factors and quantitative assessment of their significance, along with the development of practical expressions for determining EVCS design loads. The proposed approach enables the calculation of design power for homogeneous and heterogeneous EVCS groups with mean errors not exceeding 10% (MAPE = 6.01%, R2 = 0.987). In the authors’ opinion, the discrepancies in demand factors reported across studies (Table 1) primarily result from failing to quantitatively account for the average number of daily charging sessions. These results demonstrate that the average number of daily charging sessions is the most significant factor and enable quantitative assessment of its influence on EVCS design loads.
Our research provides a focused analysis on estimating the design loads for battery EV charging infrastructure, a critical challenge for power distribution networks [49,50]. It is important to note that the transition to electric transportation encompasses other technologies, such as fuel cell electric vehicles (FCEVs). The energy infrastructure for FCEVs, centered on hydrogen production and refueling stations, presents fundamentally different planning challenges (e.g., thermal management of fuel cell systems [51,52], logistics of hydrogen supply) compared with the electrical grid load management concerns addressed here for battery EVs. The development of the FCEV market has a lesser impact on distribution networks and the electric power system due to the absence of direct charging of vehicles from the electrical grid [53]. Consequently, for planning the future structure of the alternative energy vehicle fleet, a crucial task is determining the prospective growth of electrical loads, which necessitates developing accurate load estimation tools, like the one proposed in this paper.
The results obtained in this study represent an advancement in the methodology for designing power supply systems under conditions of widespread EVCS deployment. The proposed algorithm for determining the design power for homogeneous and heterogeneous groups of EVCSs will improve the accuracy of estimating design electrical loads for power supply centers with EVCSs and reduce the volume of unjustified investments in reinforcing distribution networks. This algorithm can be used at the planning and design stage of EVCI when developing and analyzing measures for the grid connection of EVCSs.

6. Conclusions

This study presented a comprehensive analysis of the factors influencing the design electrical loads of EVCI and developed a robust methodology for determining the demand factor (DF). The key findings, derived from an extensive simulation modeling campaign and quantitative feature importance analysis, are as follows:
  • The average number of daily charging sessions was identified as the most significant factor affecting the DF, a parameter largely overlooked in state-of-the-art (SOTA) methodologies. An increase in daily sessions from 0.5 to 4 led to a 2.4-fold rise in DF, underscoring that charging behavior is a primary driver of peak load, not just station hardware.
  • The rated power of EVCSs is a critical technical factor, with higher power ratings substantially reducing DF due to shorter charging sessions and decreased probability of load coincidence. Increasing the power of slow EVCSs from 3.7 kW to 22 kW reduced the average DF by 32%, while for fast EVCSs (50 kW to 180 kW), the reduction was more pronounced at 56%.
  • The number of charging ports remains a crucial parameter, consistent with the existing literature. However, our model quantifies its effect in conjunction with behavioral factors. Increasing the number of ports from 5 to 50 reduced the average DF by 38%, confirming the expected diversification effect but with greater accuracy.
  • The proposed algorithm and the regression model (5)–(7) demonstrate a superior performance compared with SOTA approaches. Validation results showed high accuracy (MAPE = 6.01%, R2 = 0.987) in calculating design loads for both homogeneous and heterogeneous EVCS groups. In stark contrast, applying the DF values and methods from the reviewed SOTA literature to our dataset yielded unacceptably high errors (MAPE of 50.36–67.72%). This significant improvement in accuracy is directly attributable to the inclusion of the average number of daily sessions alongside technical parameters. However, it should be taken into account that, due to the omission of all behavioral factors, the proposed algorithm provides an estimate of the EVCS design power with the deviations shown in Table 5 and Figure 9.
  • The practical relevance of this work is substantial. The derived expressions provide grid planners and utilities with a simple yet accurate tool to determine design loads without resorting to complex simulations in most cases. This minimizes the overestimation of infrastructure requirements, leading to direct capital expenditure (CAPEX) savings by avoiding the unnecessary reinforcement of distribution networks. The proposed methodology has been formalized into a practical step-by-step procedure for direct application in planning and design stages.
While this study provides a comprehensive analysis of EVCS load profiles, certain limitations should be acknowledged. First, the model assumes idealized conditions for charging behavior and does not account for extreme scenarios, such as mass EV adoption in concentrated urban areas. Second, the impact of emerging technologies, such as vehicle-to-grid (V2G) systems and ultra-fast charging, is not considered. Future research should explore these dynamics, as well as regional variations in charging behavior and their effects on DF.
The main directions for the future research are as follows: (1) expanding the range of variation of the considered factors, particularly by accounting for ultra-fast EVCSs with a power exceeding 200 kW; (2) incorporating power consumption management and vehicle-to-grid (V2G) capabilities into the methodology for determining the design power; (3) individual assessment of the influence of derivative factors (air temperature, location type, etc.) on the considered set of key factors; (4) research into regional charging behavior specifics for assessing peak loads of EVCI and refining the accuracy metrics for determining the design power of EVCSs in specific regions.

Author Contributions

Conceptualization, V.V., F.N., and P.I.; methodology, V.V.; software, V.V.; validation, V.V.; formal analysis, V.V.; investigation, V.V.; resources, F.N.; data curation, P.I.; writing—original draft preparation, V.V., F.N., and P.I.; writing—review and editing, V.V., F.N., and P.I.; visualization, V.V.; supervision, F.N. and P.I.; project administration, F.N. and P.I.; funding acquisition, F.N. All authors have read and agreed to the published version of the manuscript.

Funding

This research was supported by the state assignment of the Ministry of Science and Higher Education of the Russian Federation, grant number 075-03-2024-082/2.

Data Availability Statement

The original contributions presented in this study are included in the article; further inquiries can be directed to the corresponding author.

Conflicts of Interest

Author Fedor Nepsha was employed by the company Microgrid Management Department, LLC “RTSoft-SG”. The remaining authors declare that the research was conducted in the absence of any commercial or financial relationships that could be construed as a potential conflict of interest.

Abbreviations

The following abbreviations are used in this manuscript:
ACAlternating Current
DCDirect Current
DFDemand Factor
DSODistribution System Operator
EVElectric Vehicle
EVCIElectric Vehicle Charging Infrastructure
EVCSElectric Vehicle Charging Station
EVSEElectric Vehicle Supply Equipment
MAPEMean Absolute Percentage Error
NHTSNational Household Travel Survey
RRMSERelative Root Mean Square Error
SFSimultaneity Factor
SOCState of Charge
SOTAState-of-the-Art
V2GVehicle-to-Grid

References

  1. On the Concept for the Development of Production and Use of Electric Vehicle Transport in the Russian Federation for the Period Until 2030—ConsultantPlus. Available online: https://www.consultant.ru/document/cons_doc_LAW_393496/2cc3e7a044fad83b4255225febe023d7c743e4a0 (accessed on 1 August 2025). (In Russian).
  2. IRENA. Innovation Landscape for Smart Electrification: Decarbonising End-Use Sectors with Renewable Power; International Renewable Energy Agency: Abu Dhabi, United Arab Emirates, 2023; p. 212. Available online: https://digital-energy.eu/en/studies/irena-innovation-landscape-smart-electrification (accessed on 17 September 2025).
  3. ESIG’s Report. Charging Ahead. Grid Planning for Vehicle Electrification. A Report of the Energy Systems Integration Group’s Grid Planning for Vehicle Electrification Task Force. Available online: https://www.esig.energy/grid-planning-for-vehicle-electrification (accessed on 17 August 2025).
  4. Li, Y.; Jenn, A. Impact of Electric Vehicle Charging Demand on Power Distribution Grid Congestion. Proc. Natl. Acad. Sci. USA 2024, 121, e2317599121. [Google Scholar] [CrossRef]
  5. Lukuyu, J.; Shirley, R.; Taneja, J. Managing Grid Impacts from Increased Electric Vehicle Adoption in African Cities. Sci. Rep. 2024, 14, 24320. [Google Scholar] [CrossRef] [PubMed]
  6. Ahmed, S.I.; Salehfar, H.; Selvaraj, D.F. Impact of Electric Vehicle Charging on the Performance of Distribution Grid. In Proceedings of the 2021 IEEE 12th International Symposium on Power Electronics for Distributed Generation Systems (PEDG), Chicago, IL, USA, 28 June–1 July 2021; pp. 1–8. [Google Scholar] [CrossRef]
  7. Huang, L.; Li, H.; Lai, C.S.; Zobaa, A.F.; Zhong, B.; Zhao, Z.; Lai, L.L. Electric Vehicle Cluster Scheduling Model for Distribution Systems Considering Reactive-Power Compensation of Charging Piles. Energies 2024, 17, 2541. [Google Scholar] [CrossRef]
  8. Ilyushin, P.V.; Shepovalova, O.V.; Filippov, S.P.; Nekrasov, A.A. The Effect of Complex Load on the Reliable Operation of Solar Photovoltaic and Wind Power Stations Integrated into Energy Systems and into Off-Grid Energy Areas. Energy Rep. 2022, 8, 1515–1529. [Google Scholar] [CrossRef]
  9. Kulikov, A.; Ilyushin, P.; Suslov, K.; Filippov, S. Organization of Control of the Generalized Power Quality Parameter Using Wald’s Sequential Analysis Procedure. Inventions 2023, 8, 17. [Google Scholar] [CrossRef]
  10. Kulikov, A.L.; Shepovalova, O.V.; Ilyushin, P.V.; Filippov, S.P.; Chirkov, S.V. Control of Electric Power Quality Indicators in Distribution Networks Comprising a High Share of Solar Photovoltaic and Wind Power Stations. Energy Rep. 2022, 8, 1501–1514. [Google Scholar] [CrossRef]
  11. Kulikov, A.L.; Ilyushin, P.V.; Suslov, K.V.; Karamov, D.N. Coherence of Digital Processing of Current and Voltage Signals at Decimation for Power Systems with a Large Share of Renewable Power Stations. Energy Rep. 2022, 8, 1464–1478. [Google Scholar] [CrossRef]
  12. Glover, J.D.; Sarma, M.S.; Overbye, T. Power Systems Analysis and Design, 6th ed.; Cengage Learning: Boston, MA, USA, 2015; ISBN 978-1-305-63213-4. [Google Scholar]
  13. Bollerslev, J.; Andersen, P.B.; Jensen, T.V.; Marinelli, M.; Thingvad, A.; Calearo, L.; Weckesser, T. Coincidence Factors for Domestic EV Charging From Driving and Plug-In Behavior. IEEE Trans. Transp. Electrif. 2022, 8, 808–819. [Google Scholar] [CrossRef]
  14. Hecht, C.; Figgener, J.; Sauer, D.U. Simultaneity Factors of Public Electric Vehicle Charging Stations Based on Real-World Occupation Data. World Electr. Veh. J. 2022, 13, 129. [Google Scholar] [CrossRef]
  15. Jokinen, I.; Lehtonen, M. Modeling of Electric Vehicle Charging Demand and Coincidence of Large-Scale Charging Loads in Different Charging Locations. IEEE Access 2023, 11, 114291–114315. [Google Scholar] [CrossRef]
  16. Unterluggauer, T.; Hipolito, F.; Klyapovskiy, S.; Andersen, P.B. Impact of Electric Vehicle Charging Synchronization on the Urban Medium Voltage Power Distribution Network of Frederiksberg. World Electr. Veh. J. 2022, 13, 182. [Google Scholar] [CrossRef]
  17. Fani, H.; Hashmi, M.U.; Deconinck, G. Impact of Electric Vehicle Charging Simultaneity Factor on the Hosting Capacity of LV Feeder. Sustain. Energy Grids Netw. 2024, 40, 101581. [Google Scholar] [CrossRef]
  18. Gardholm, E. Dimensioning of the Electricity Distribution Network as the Share of Electric Vehicles Increases. 2024. Available online: http://www.diva-portal.org/smash/record.jsf?pid=diva2:1894764 (accessed on 13 February 2025).
  19. Zakaria, A.; Duan, C.; Djokic, S.Z. Hosting Capacity of Distribution Networks for Controlled and Uncontrolled Residential EV Charging with Static and Dynamic Thermal Ratings of Network Components. Electr. Veh. Integr. Impacts Power Syst. 2024, 18, 1283–1301. [Google Scholar] [CrossRef]
  20. Ali, S.; Wintzek, P.; Zdrallek, M. Development of Demand Factors for Electric Car Charging Points for Varying Charging Powers and Area Types. Electricity 2022, 3, 410–441. [Google Scholar] [CrossRef]
  21. Mason, J. Engineering Design Standard EDS 08-5050 Electric Vehicle Connections. Available online: https://media.umbraco.io/uk-power-networks/baik5mop/eds-08-5050-electric-vehicle-connections.pdf (accessed on 14 February 2024).
  22. Burges, K.; Schlösser, T.; Tröster, E. Handbook on Planning and Operating an E-Mobility Infrastructure; Deutsche Energie-Agentur: Berlin, Germany, 2022; p. 41. Available online: https://energypedia.info/wiki/File:025_Handbook_on_Planning_and_Operating_an_E-Mobility_Infrastructure.pdf (accessed on 19 August 2025).
  23. Opstad, A.; Bakken, B.H.; Nygård, H.S.; Doorman, G.; Sevdari, K. Flexibility from Electric Vehicles—Residential Charging Coincidence Factors in Norway. CSE 2024, 35, 1–17. Available online: https://cse.cigre.org/cse-n035/c1-flexibility-from-electric-vehicles-residential-charging-coincidence-factors-in-norway.html (accessed on 20 August 2025).
  24. Silber, F.; Scheubner, S.; Märtz, A. Analysis of the Simultaneity Factor of Fast-Charging Sites Using Monte-Carlo Simulation. Int. J. Electr. Power Energy Syst. 2024, 155, 109540. [Google Scholar] [CrossRef]
  25. Bong, A.; Cisneiros e Faria, L.A.; Leier, E.; Vertgewall, C.M.; Kortmann, S.; Ulbig, A. Grid Impacts by Providing Flexibility of Electric Vehicles Based on Simultaneity Factors. In Proceedings of the 2024 International Conference on Smart Energy Systems and Technologies (SEST), Torino, Italy, 10–12 September 2024; pp. 1–6. [Google Scholar] [CrossRef]
  26. Rosstandart. Notification on the Development of Draft Amendment No. 7 to SP 256.1325800.2016 “Electrical Installations of Residential and Public Buildings. Design and Installation Rules”. Available online: https://www.gost.ru/portal/gost/home/activity/standardization/notification/notificationssetrules (accessed on 8 February 2025). (In Russian).
  27. Zhang, Y.; Yang, J.; Li, Q.; Deng, W.; Xie, X. Special transformer sharing mode: Utilizing special transformers of buildings to supply power for charging stations. IET Gener. Transm. Distrib. 2023, 17, 1021–1034. [Google Scholar] [CrossRef]
  28. Carvalhosa, S.; Ferreira, J.R.; Araújo, R.E. Fuzzy Logic Estimation of Coincidence Factors for EV Fleet Charging Infrastructure Planning in Residential Buildings. Energies 2025, 18, 4679. [Google Scholar] [CrossRef]
  29. Rosstandart. Notification on the Development of SP “Electrical Networks of Urban Microdistricts. Design Rules”. Available online: https://www.rst.gov.ru/portal/gost/home/activity/standardization/notification/notificationssetrules (accessed on 5 February 2025). (In Russian)
  30. Palomino, A.; Parvania, M. Probabilistic Impact Analysis of Residential Electric Vehicle Charging on Distribution Transformers. In Proceedings of the 2018 North American Power Symposium (NAPS), Fargo, ND, USA, 9–11 September 2018; pp. 1–6. [Google Scholar] [CrossRef]
  31. Ali, S.; Wintzek, P.; Zdrallek, M.; Böse, C.; Monscheidt, J.; Gemsjäger, B.; Slupinski, A. Demand Factor Identification of Electric Vehicle Charging Points for Distribution System Planning. In Proceedings of the CIRED 2021—The 26th International Conference and Exhibition on Electricity Distribution, Online, 20–23 September 2021; Volume 2021, pp. 2574–2578. [Google Scholar] [CrossRef]
  32. Märtz, A.; Held, L.; Wirth, J.; Jochem, P.; Suriyah, M.; Leibfried, T. Development of a Tool for the Determination of Simultaneity Factors in PEV Charging Processes; Zenodo: Dublin, Ireland, 14 October 2019; Available online: https://www.ieh.kit.edu/veroeffentlichungen_3464.php (accessed on 22 August 2025).
  33. Stahleder, D.; Übermasser, S.; Reihs, D.; Ledinger, S.; Lehfuss, S. Electric Vehicle Car Park Charging Simultaneity and Grid Connection Power Requirement Analysis. In Proceedings of the CIRED 2021—The 26th International Conference and Exhibition on Electricity Distribution, Online, 20–23 September 2021; Volume 2021, pp. 2183–2187. [Google Scholar] [CrossRef]
  34. Voronin, V.A. Analysis of Open Data on the Use of DC Electric Charging Stations for Electric Vehicles. In Proceedings of the All-Russian School of Young Scientists “Digitalization, Decarbonization and Decentralization of Modern Electric Power Industry”, Sevastopol, Russia, 29–30 May 2024; SevSU: Sevastopol, Russia, 2024; pp. 218–227. Available online: https://www.elibrary.ru/item.asp?id=69918879 (accessed on 20 August 2025). (In Russian).
  35. There Are Almost 60 Thousand Electric Vehicles in Russia. Available online: https://www.autostat.ru/news/59463/ (accessed on 23 February 2025). (In Russian).
  36. EV Database. Available online: https://ev-database.org/ (accessed on 19 May 2025).
  37. Bonfiglio, A.; Minetti, M.; Loggia, R.; Mascioli, L.F.; Golino, A.; Moscatiello, C.; Martirano, L. Integrated Vehicle-to-Building and Vehicle-to-Home Services for Residential and Worksite Microgrids. Smart Cities 2025, 8, 101. [Google Scholar] [CrossRef]
  38. PJSC “Rosseti Moscow Region” Summarizes the Work of Electric Vehicle Charging Stations in 2024. Available online: https://xn--80aoda2algca.xn--p1ai/pao-rosseti-moskovskij-region-podvelo-itogi-raboty-zaryadnyx-stancij-dlya-elektromobilej-za-2024-god/ (accessed on 25 February 2025). (In Russian).
  39. Baek, K.; Lee, E.; Kim, J. A Dataset for Multi-Faceted Analysis of Electric Vehicle Charging Transactions. Sci. Data 2024, 11, 262. [Google Scholar] [CrossRef] [PubMed]
  40. Level-3-EV-Charging-Dataset. Available online: https://github.com/DESL-EPFL/Level-3-EV-charging-dataset (accessed on 21 March 2024).
  41. Siddique, C.; Afifah, F.; Guo, Z.; Zhou, Y. Data Mining of Plug-in Electric Vehicles Charging Behavior Using Supply-Side Data. Energy Policy 2022, 161, 112710. [Google Scholar] [CrossRef]
  42. Jonas, T.; Daniels, N.; Macht, G. Electric Vehicle User Behavior: An Analysis of Charging Station Utilization in Canada. Energies 2023, 16, 1592. [Google Scholar] [CrossRef]
  43. Energetics, EV WATTS Charging Station Dashboard Q4-23’. Available online: https://www.energetics.com/evwatts (accessed on 25 March 2024).
  44. Roy, B.; Ivanic, Z.; Windover, P.; Ruder, A.; Shirk, M. New York State EV Charging Station Deployment. World Electr. Veh. J. 2016, 8, 877–887. [Google Scholar] [CrossRef]
  45. Voronin, V.A.; Nepsha, F.S. Enhancing the Process for Connecting EV Charging Stations to the Power Grid. In Proceedings of the 2024 IEEE 3rd International Conference on Problems of Informatics, Electronics and Radio Engineering (PIERE), Novosibirsk, Russian, 15–17 November 2024; pp. 1240–1244. [Google Scholar] [CrossRef]
  46. Visakh, A.; Selvan, M. Smart Charging of Electric Vehicles to Minimize the Cost of Chargingand the Rate of Transformer Aging in a Residential Distribution Network. Turk. J. Electr. Eng. Comput. Sci. 2022, 30, 927–942. [Google Scholar] [CrossRef]
  47. van Sambeek, H.L.; Zweistra, M.; Hoogsteen, G.; Varenhorst, I.A.M.; Janssen, S. GridShield—Optimizing the Use of Grid Capacity during Increased EV Adoption. World Electr. Veh. J. 2023, 14, 68. [Google Scholar] [CrossRef]
  48. Boyko, E.; Byk, F.; Ilyushin, P.; Myshkina, L.; Suslov, K. Methods to Improve Reliability and Operational Flexibility by Integrating Hybrid Community Mini-Grids into Power Systems. Energy Rep. 2023, 9, 481–494. [Google Scholar] [CrossRef]
  49. Voronin, V.; Nepsha, F.; Ilyushin, P. Determining Volt/Var Characteristics of Electric Vehicle Charging Station Inverters for Voltage Regulation in Distribution Networks. World Electr. Veh. J. 2024, 15, 553. [Google Scholar] [CrossRef]
  50. Guia, T.; M’Hamdi, B.; Khechekhouche, A. Electric vehicle charging stations load impact on the distribution network. J. Eng. Exact Sci. 2024, 10, 20813. [Google Scholar] [CrossRef]
  51. Pierro, G.D.; Bitsanis, E.; Tansini, A.; Bonato, C.; Martini, G.; Fontaras, G. Fuel Cell Electric Vehicle Characterisation under Laboratory and In-use Operation. Energy Rep. 2024, 11, 611–623. [Google Scholar] [CrossRef]
  52. Jia, C.; Liu, W.; He, H.; Chau, K.T. Health-Conscious Energy Management for Fuel Cell Vehicles: An Integrated Thermal Management Strategy for Cabin and Energy Source Systems. Energy 2025, 333, 137330. [Google Scholar] [CrossRef]
  53. Dai, S.; Shen, P.; Deng, W.; Yu, Q. Hydrogen Energy in Electrical Power Systems: A Review and Future Outlook. Electronics 2024, 13, 3370. [Google Scholar] [CrossRef]
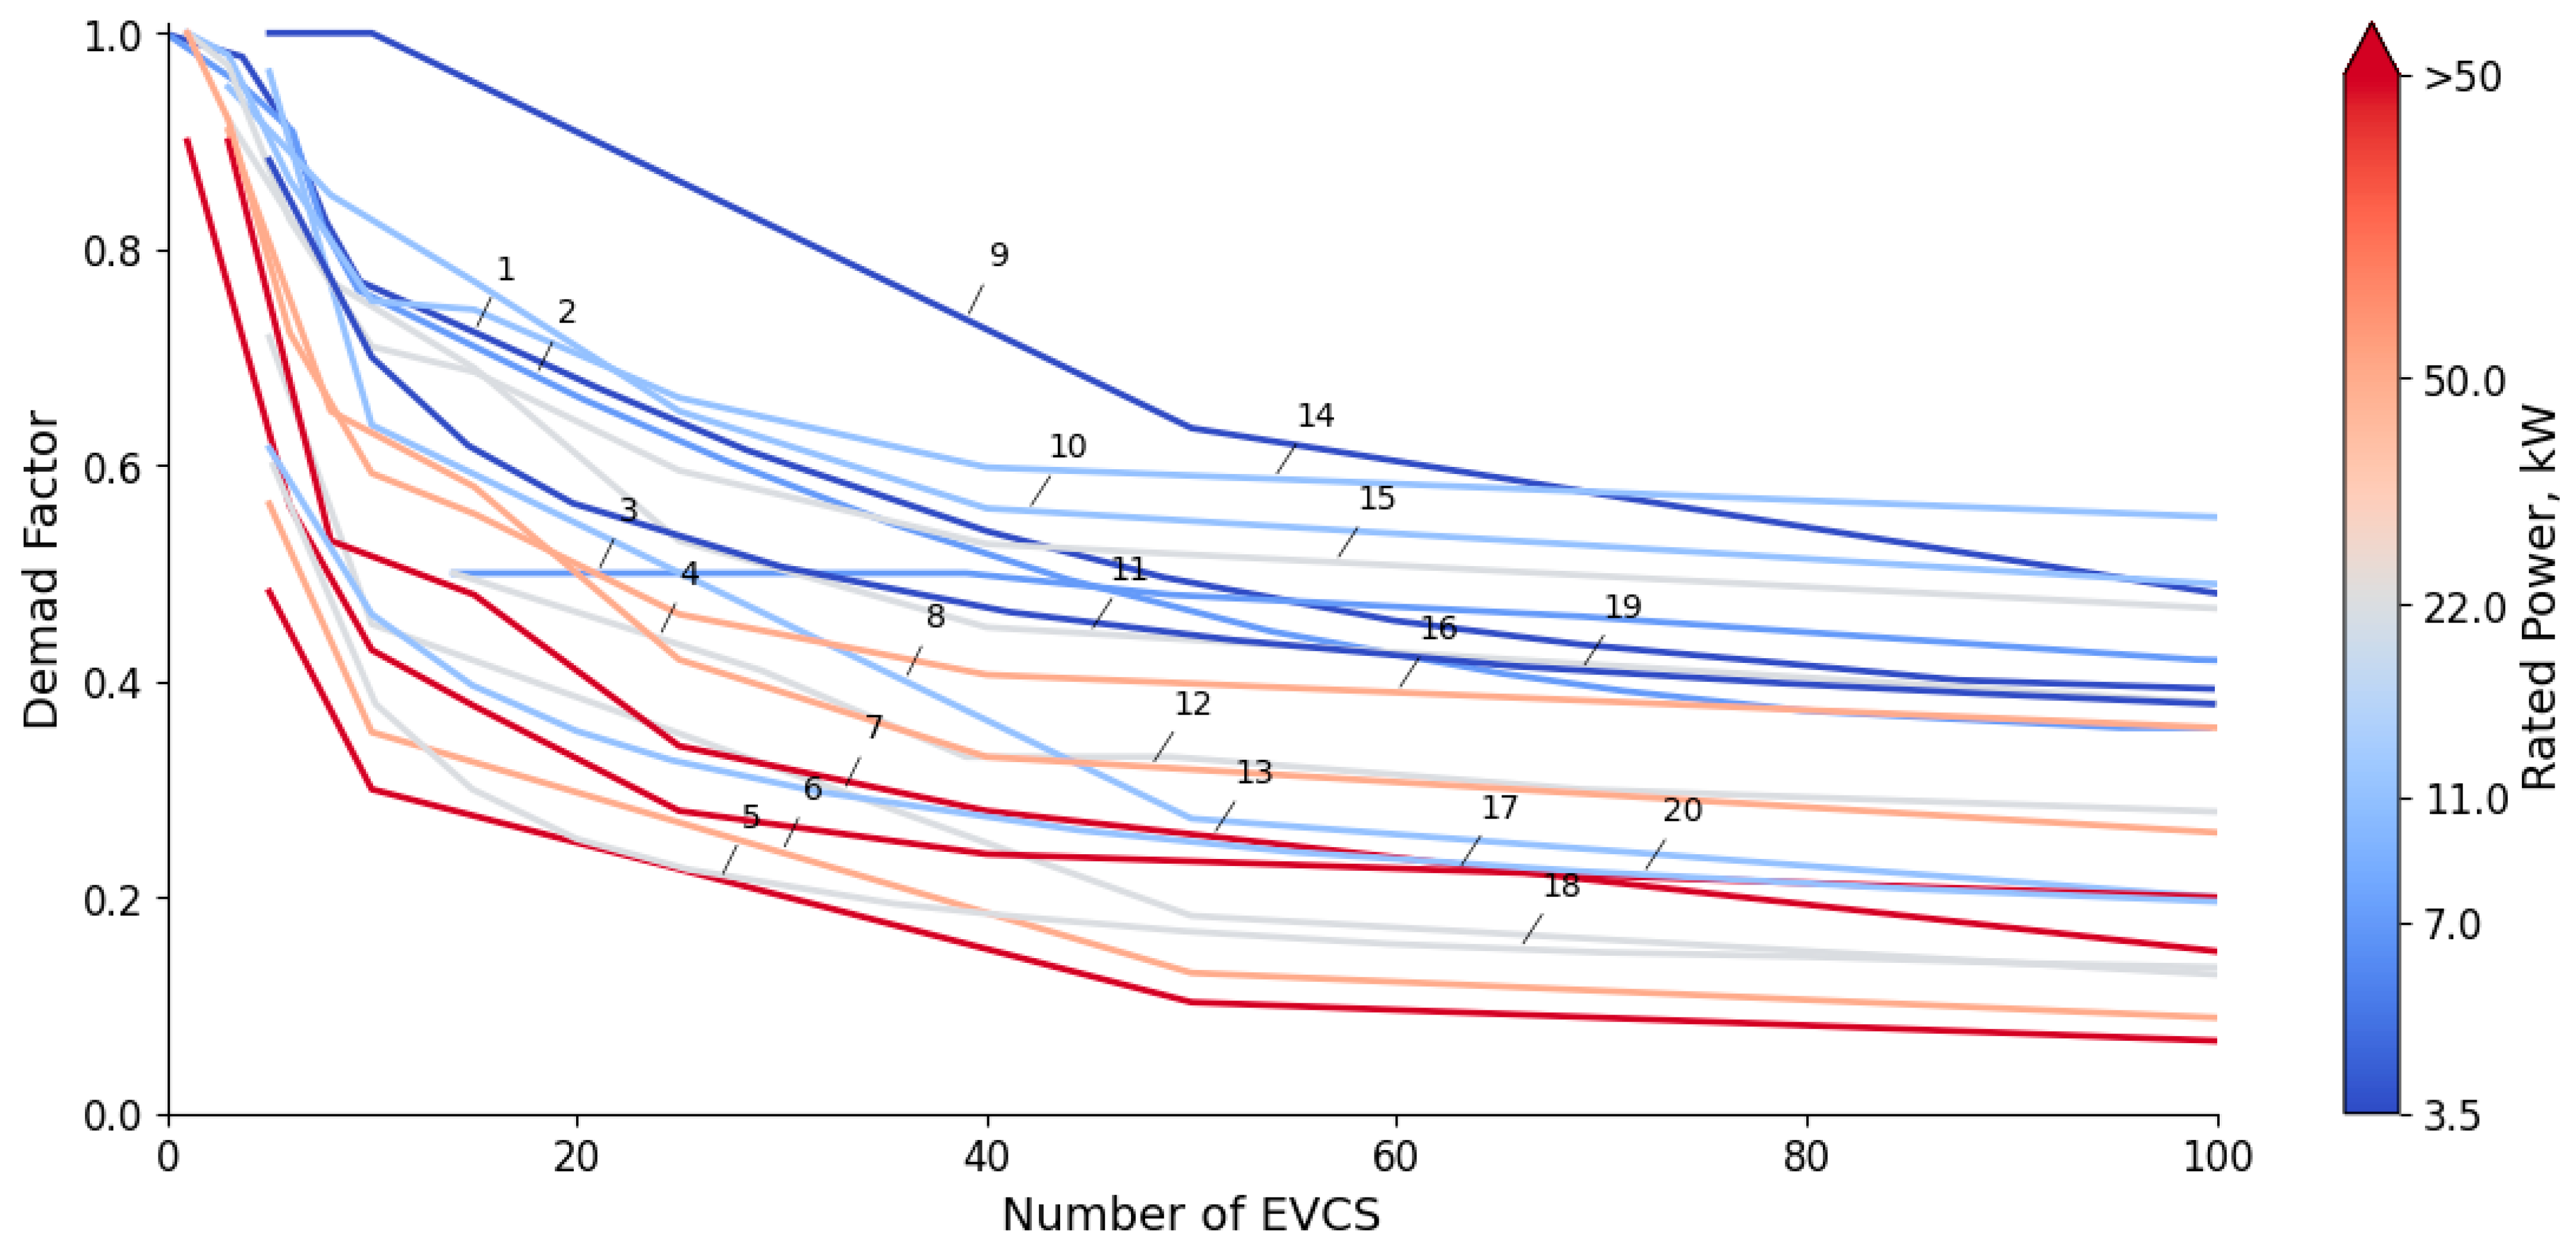
Figure 1. The DF versus number and rated power of EVCS according to [19]—1, 2; [21]—3, 4; [20]—5, 6, 7, 8, 9; [29]—10, 11, 12, 13; [26]—14, 15, 16, 17; [13]—18, 19, 20.
Wevj 16 00537 g001
Figure 2. Effect of derivative and key factors on the DF (the effect of a factor on the change in DF is indicated in parentheses).
Wevj 16 00537 g002
Figure 3. Flowchart of the algorithm for modeling of EVCS power consumption profiles.
Wevj 16 00537 g003
Figure 4. Probability distributions used in this paper: (a) EV plug-in time probability distribution; (b) charging session duration probability distribution; (c) EV initial SOC probability distribution.
Wevj 16 00537 g004
Figure 5. High-level workflow of the simulation and analysis methodology.
Wevj 16 00537 g005
Figure 6. The DF versus number and rated power of EVCSs when varying (average number of sessions per day, 2) (a) EV initial SOC; (b) EV plug-in time; (c) EV fleet; (d) session duration; average daily sessions for slow (e) and fast (f) EVCSs.
Wevj 16 00537 g006
Figure 7. Feature importance diagram affecting the power consumption of EVCSs.
Wevj 16 00537 g007
Figure 8. Average SF values when summing the consumption profiles of two EVCS groups: (a)—plug-in time distribution; (b)—initial SOC distribution; (c)—session duration distribution.
Wevj 16 00537 g008
Figure 9. Visualization of the prediction error of a regression model: (a) actual vs. predicted; (b) residuals vs. predicted.
Wevj 16 00537 g009
Table 1. A review of papers on EVCS demand factor research.
Ref.DescriptionFactorsResults
[13]Home charging, slow AC EVCSs, Monte Carlo simulation (based on the Danish National Travel Survey and plug-in behavior data from >10,000 Nissan Leafs)Number of EVs (5–100), EVCS power (3.7–22 kW), EV battery capacity (24–60 kWh), charging behavior
-
DF = 0.6–0.25 for 5–100 EVs;
-
DF = 0.38–0.2 for EVCS power of 3.7–11 kW;
-
Charging behavior affects DF no more than 2–3%.
[14]Public charging, AC EVCSs (11 kW, 22 kW), real-world data from roaming maps (26,951 connectors observed, subsample of 1562 connectors with 45,487 charge events), Dec 2019–Mar 2020Number of EVCSs (1–1000), consumption per session (8–60 kWh), charging control strategy
-
DF = 1–0.1 for 1–1000 EVCSs;
-
DF ranges from 0.2–0.25 to 0.35–0.5 for a consumption per session of 8–60 kWh (1000 EVCSs);
-
Charging control strategy affects DF from 0.1–0.2 to 0.2–0.4 (1000 EVCS).
[15]Home, workplace, public, and fast charging stations, simulation modeling (based on Finnish NHTS 2016 data: 12,773 respondents, 40,321 trips)EVCS power (3.68–100 kW), location type, air temperature
(−20–15 °C)
-
Home—DF = 0.088–0.281;
-
Workplace—DF = 0.152–0.438;
-
Shopping—DF = 0.033–0.085;
-
Hotel—DF = 0.107–0.33;
-
Fast EVCSs—DF = 0.016–0.168.
[16]Home and workplace charging, 11 kW AC EVCSs, real data (Danish National Travel Survey, 2006–2019) + Monte Carlo simulation (24,252 resident EVs + 34,818 visitor EVs)Charge management by reducing the price during certain hours of the day
-
For uncontrolled charging—DF = 0.085–0.124 (home); DF = 0.168–0.27 (workplace);
-
Controlled charging—DF = 0.948 (home); DF = 0.862 (workplace).
[17]Home charging, slow AC EVCSs, real-world data from smart meters in 300 Belgian households (Dec 2022–Dec 2023)EVCS power (2.7–11 kW), average daily consumption (0–10… >30 kWh), power grid scheme (number of consumers from 12 to 69)
-
3.5 kW—DF = 0.41–0.92;
-
7 kW—DF = 0.21–0.58;
-
11 kW—DF = 0.15–0.4.
[18]Home charging, slow AC EVCSs, Monte Carlo simulation (based on travel data in Stockholm)EVCS power (3.7 and 11 kW), number of EVCSs (5–50)
-
DF = 0.6–0.4 for 5–50 EVCSs (3.7 kW);
-
DF = 0.4–0.25 for 5–50 EVCSs (11 kW).
[19]Home charging, slow AC EVCSs, Monte Carlo simulation (based on real UK field trial data from ~200 EVs over 1 year, extended to 3000 EVs)EVCS power (3.7 and 7 kW), number of EVCSs (1–3000), season of the year
-
DF = 0.8–0.45 for 10–100 EVCSs (3.7 kW);
-
DF = 0.85–0.38 for 10–100 EVCSs (7 kW);
-
In winter, DF is 52–74% higher.
[20]Private and public charging, stochastic simulation (based on mobility data from 316,000 individuals and >1 million routes in Germany, 2008–2018).EVCS power (3.7–350 kW), number of EVCSs (1–500), city size
-
DF = 1–0.27 for 5–500 EVCSs (3.7 kW);
-
DF = 0.72–0.06 for 5–500 EVCSs (22 kW);
-
DF = 0.46–0.02 for 5–500 EVCSs (350 kW);
-
The size of the city influences by an average of 18.1% (the smaller the city, the higher the DF).
[22]Home/public charging, AC/DC EVCSs, real-world monitoring and synthetic data (modeling based on German mobility patterns, simultaneity factors)Number of EVs (10–10,000), EVCS power (3.7–11 kW), EVCS type (home, workplace, public)DF ranges from 0.6–0.8 to 0.1–0.2 for 10–10,000 EVs (EVCS power 3.7–11 kW)
[23]Home charging, slow AC EVSEs, real data from 216 Tesla households in Norway (Nov 2020–Mar 2021), including temperature and electricity price dataGeographical location (mountainous, hilly, flat area), time of day and day of the week, charging price, air temperature
-
DF = 0.13–0.15 for uncontrolled charging;
-
DF = 0.32 for smart charging;
-
Time of day: DF > 0.3 at 2 a.m., DF < 0.1 at 10 a.m.
[30]Home charging, AC EVCSs. Real data: residential load from 112 homes (2015, Salt Lake City), EV charging from 8000 vehicles (INL, 2011–2013).Number of EVs (1–6)
-
DF = 0.3 for 2 EVs;
-
DF < 0.2 for 3 EVs;
-
DF = 0.1 for 4 EVs;
-
DF < 0.1 for more than 5 EVs.
[31]Private, public, and fast EV charging points, Monte Carlo simulation (based on mobility data from “Mobilität in Deutschland” and real grid data from six German DSOs), 2000 EVs simulated over 1000 weeks (19 years) (EV battery capacity 45 kWh).Number of EVCSs (1–2000), EVCS power (3.7–150 kW)
-
DF = 1–0.19 for 1–2000 EVCSs (3.7 kW);
-
DF = 1–0.03 for 1–2000 EVCSs (150 kW).
[32]Home charging, AC EVCSs, Monte Carlo simulation (based on real data and synthetic household load profiles from a database of 365,000 entries). Simulated days: 1000–100,000.Number of EVCSs (1–10),
EVCSs power (3.7–11 kW)
-
DF = 1–0.6 for 1–20 EVCSs;
-
DF = 0.9–0.7 for EVCS power 3.7–11 kW.
[33]Home/work/shop charging, Monte Carlo simulation (based on Austrian mobility study with 93,175 car trips).Number of EVCSs (1–100), EVCS power (11, 22 kW), location type (home, workplace), charging control strategy, parking duration (0.5–2 h)
-
DF = 0.8–0.1 for 1–100 EVCSs;
-
DF = 0.15–0.1 for EVCS power 11–22 kW (100 EVCSs);
-
DF = 0.15–0.3 for home and workplace (100 EVCS, 11 kW power rating);
-
DF = 0.15–0.21 for parking duration 0.5–2 h (100 EVCS, 11 kW power rating).
[25]Home charging, slow AC EVSEs, simulation modeling (based on historical user behavior and driving profiles), 10,000 EVs (scaled to 15M for analysis).Number of EVCSs (1–50), charging control strategy
-
DF = 0.43 for uncontrolled charging;
-
DF = 0.56 for shifted charging;
-
DF = 0.37 for weighted charging;
-
DF = 0.49 for smoothing charging.
Table 2. Average deviations of DF obtained in different papers.
ReferencesNumber of DF CurvesEVCS Power, kWMean Inter-Curve Deviation (RRMSE), %
[13,19,20]33.515.73 ± 5.90
[19,21]2711.43 ± 0.23
[13,20,26,29]41137.90 ± 17.35
[13,20,21,26,29]52241.12 ± 27.55
[20,26,29]35040.70 ± 30.88
[20,26,29]3>5031.70 ± 19.76
Table 3. Parameters of the most popular EV models in Russia and their charging capabilities.
NoEV ModelBattery Capacity,
kWh
Max and Average Power of Fast Charging, kWOnboard Charger Power, kWRelative Share, %
1Nissan Leaf3950/406.636.8
2Zeekr 00194200/1352225.0
3Tesla Model 3,
Tesla Model Y
57.5170/1001114.47
4Volkswagen ID.452115/70117.89
5Evolute i-PRO *53100/806.67.89
6Moskvich 3E *65.790/67115.26
7Porsche Taycan71223/183112.63
* Parameters of these models are taken as approximate, based on the generalization of data on similar EV models.
Table 4. Coefficients of the multiple linear regression model and Sobol indices.
CoefficientValueseTpS1St
β0977.625 × 10−312.764 × 10−376.59<0.01--
β1−277.223 × 10−34.088 × 10−3−67.79<0.010.2430.242
β2−41.738 × 10−31.281 × 10−3−32.57<0.010.0850.085
β30.389 × 10−30.051 × 10−37.60<0.010.0340.032
β4194.337 × 10−34.031 × 10−348.95<0.010.6180.617
β5−2.714 × 10−60.459 × 10−6−5.91<0.010.0220.023
Table 5. Accuracy of EVCS maximum power calculation.
DatasetNumber of ObservationsRRMSE, %MAPE, %R2, pu
All data193,0258.74 [8.67, 8.80]6.01 [5.99, 6.04]0.987 [0.985, 0.987]
Homogeneous EVCS groups856.93 [5.04, 9.11]4.18 [3.53, 4.82]0.997 [0.995, 0.999]
Two heterogeneous EVCS groups35709.4 [9.10, 9.70]7.51 [7.36, 7.68]0.988 [0.988, 0.989]
Three heterogeneous EVCS groups98,7708.71 [8.65, 8.77]5.96 [5.94, 5.99]0.986 [0.985, 0.986]
Disclaimer/Publisher’s Note: The statements, opinions and data contained in all publications are solely those of the individual author(s) and contributor(s) and not of MDPI and/or the editor(s). MDPI and/or the editor(s) disclaim responsibility for any injury to people or property resulting from any ideas, methods, instructions or products referred to in the content.