Article

A Deep Learning Approach for Real-Time Intrusion Mitigation in Automotive Controller Area Networks

1
Department of Electrical Engineering, Mirpur University of Science and Technology (MUST), Mipur AJK-10250, Pakistan
2
School of Computing and Engineering, University of Huddersfield, Queensgate, Huddersfield HD1 3DH, UK
*
Author to whom correspondence should be addressed.
World Electr. Veh. J. 2025, 16(9), 492; https://doi.org/10.3390/wevj16090492 (registering DOI)
Submission received: 5 July 2025 / Revised: 19 August 2025 / Accepted: 21 August 2025 / Published: 1 September 2025
(This article belongs to the Special Issue Vehicular Communications for Cooperative and Automated Mobility)

Abstract

The digital revolution has profoundly influenced the automotive industry, shifting the paradigm from conventional vehicles to smart cars (SCs). The SCs rely on in-vehicle communication among electronic control units (ECUs) enabled by assorted protocols. The Controller Area Network (CAN) serves as the de facto standard for interconnecting these units, enabling critical functionalities. However, inherited non-delineation in SCs— transmits messages without explicit destination addressing—poses significant security risks, necessitating the evolution of an astute and resilient self-defense mechanism (SDM) to neutralize cyber threats. To this end, this study introduces a lightweight intrusion mitigation mechanism based on an adaptive momentum-based deep denoising autoencoder (AM-DDAE). Employing real-time CAN bus data from renowned smart vehicles, the proposed framework effectively reconstructs original data compromised by adversarial activities. Simulation results illustrate the efficacy of the AM-DDAE-based SDM, achieving a reconstruction error (RE) of less than 1% and an average execution time of 0.145532 s for data recovery. When validated on a new unseen attack, and on an Adversarial Machine Learning attack, the proposed model demonstrated equally strong performance with RE < 1%. Furthermore, the model’s decision-making capabilities were analysed using Explainable AI techinques such as SHAP and LIME. Additionally, the scheme offers applicable deployment flexibility: it can either be (a) embedded directly into individual ECU firmware or (b) implemented as a centralized hardware component interfacing between the CAN bus and ECUs, preloaded with the proposed mitigation algorithm.

Graphical Abstract

1. Introduction

Digital advancement has remarkably revolutionized the automotive industry, transforming paradigm from traditional vehicles to futuristic smart cars (SCs). Along with conventional control mechanisms, these intelligent cars are equipped with sophisticated computation and automation that operate with physical processes. This integration of conventional and advanced features has brought several benefits to passengers and drivers, including meticulous security and safety features. However, the World Health Organization reported about 1.3 million deaths per year from road accidents [1]. The situation is likely to deteriorate further in the coming years as projected by Upstreams Security, a renowned cloud-based cybersecurity company. It has revealed a 60 % increase in cyber-attacks in the auto industry between 2023 and 2024 [2], anticipating a continuous growth in the impact and frequency of cyber-intrusions for the coming year [3].
Stemming from continuously evolving nature of cyber-attacks and threat actors, numerous incidents since 2010 have targeted SCs by exploiting inherent vulnerabilities, as illustrated in Figure 1. By exploiting vulnerabilities and attack surfaces such as telematics, diagnostics, infotainment, and other systems, the hackers succeeded in compromising critical functions including acceleration, braking, engine control. In addition, the adversaries managed to gain unauthorized access to unlock, start, and finally steal vehicles. The “Oz Car Parts” hack by the Stux Team in December 2023 [4], the “Spireon Vehicles” hack by security researchers in 2022 [5], the luxury car heist in London in 2022, and the keyless entry hack in Oakville in 2022 [6] are some well-known real-life cyber-security incidents in smart cars. These incidents necessitate the need to integrate a robust and efficient self-defense mechanism to neutralize and mitigate the impact of cyber-intrusions once detected and identified by the intrusion detection system embedded in the network monitoring unit in smart cars. However, majority of the existing studies [7,8,9,10,11,12,13,14,15] on cybersecurity of SCs have primarily focused on anomaly detection in controller area network, overlooking the mitigation mechanism to reconstruct the original data by removing noise to ensure the continuity of operations. There are only few existing studies [16,17,18,19,20,21] which address the mitigation in smart cars, but their proposed solutions such as isolating the affected node and or blocking the compromised data interrupt the system leading to the disruption in the continuity of operations. To tackle the issue of disruption, a real-time mitigation strategy which not only ensures continuity of operation but is also efficient is proposed in this study.
Smart cars are sophisticated cyber-physical systems that integrate sensors, control units, and intricate communication networks, enabling intelligent features such as obstacle identification, emergency braking, lane keeping, keyless entry, and many other. The realization of smart features is linked with the integration of advanced digital systems including electronic control units (ECUs), networking, and communication modules. ECUs are regarded as brain for various subsystems in SCs. The core functions of ECUs include safety management—traction and stability control, driver assistance—adaptive cruise control, lane keeping, collision avoidance, and control and coordination—steering, braking, engine performance. In addition, communication management, battery and energy management, infotainment and comfort, and security functions are also controlled by ECUs. Using the communication networks, ECUs communicate with each other by transmitting messages over the data bus by employing different network protocols such as controller area network, FlexRay, local interconnect network, and ethernet. Among all, Automotive controller area network (CAN) is a de-facto communication network, exhibiting inherited minimal latency and priority-based transmission nature. CAN connects various ECUs, actuators and sensors, ensuring real-time coordination, control and safety in SCs. However, these components are highly vulnerable to cyber-intrusions through external systems such as infotainment, telematics, human-machine interface, OBD-II port and Wi-Fi connections. Serving as a gateway, these elements streamline the anomaly injections for adversaries, allowing them to intrude the SCs by introducing various attacks, including malfunction, replay, false message injection, fuzzy, and sensor manipulation. A generic representation of automotive communication network along with key vulnerabilities that foster the design and execution of this work, is presented in Figure 2.
However, CAN bus features poor data authentication compared to other protocols, facing a serious challenge of data security and passenger safety. It underscores the necessity to develop a state-of-the-art intrusion mitigation model to reconstruct the input data in real time. Normally, the reconstruction models are deep neural networks-based, consisting of (i) encoder, (ii) latent-space representation, and (iii) decoder. Employing the non-linear transformation, the encoder enables the model to learn the underlying data structure to transform the input into a compact latent space, where the decoder reconstructs the original input by removing noise from the data. By employing various machine learning-based neural network approaches, researchers have conducted numerous studies to propose techniques for the mitigation of intrusions, discussed in subsequent section.

1.1. Related Works

Mitigation techniques usually include blocking anomalies by (a) discarding the compromised data altogether, (b) reconstructing original values by removing noise from the data, or (c) isolating the affected node from the system. However, removing the data or isolating the node disrupts flow of data traffic, and halts normal operation for a considerable time. However, real-time reconstruction of original values ensures the continuity of operations in smart cars. Leveraging machine learning techniques that involve model learning based on the input data pattern, the deep learning models learn compressed latent space representation by employing non-linear transformation on input data to remove noise and reconstruct the original data.
Researchers have investigated different approaches to present various machine learning and deep learning-based intrusion detection and mitigation mechanisms in smart cars [15,16,17,19,20,21,24,25]. Moradi et al. [17], proposed a two-tier defense mechanism based on sensor and fusion-decision to detect and mitigate cyber-intrusions that have compromised the data traffic for in-vehicular communication. Comprising of two processes—sensor validation and sensor estimation—the proposed mechanism employed a fusion-based approach for intrusion detection and then validated the detection accuracy employing Yager’s rule. After detection, the manipulated values were replaced using an LSTM-based deep regressor estimator. The fusion approach utilized (a) RReliefF (Regression RefiefF), mRMR (minimum redundancy maximum relevance), and PCC (Pearson Correlation Coefficient) for marking feature ranking, (b) convolutional autoencoder and (c) trade-off-based detector for detection. The study employed the AEGIS dataset for model training and testing to investigate the impact of false data injections, DoS, and replay attacks in smart cars, and concluded with an appreciable detection accuracy of 99.93 %. However, the study failed to provide clear performance results for the mitigation phase. Khanna et al. [24] proposed a threat mitigation model for vehicular ad hoc networks in smart cars. The model was a combination of k-means clustering to group data of a similar nature and a hybrid model of SVM and Feed-forward for accuracy assessment based on the firefly algorithm. The performance evaluation metrics include true detection rate, jitter, throughput, and packet delivery ratio. These performance evaluators are indicators for threat detection instead of mitigation which normally considers isolating the device, discarding anomalous data, or reconstructing original values by removing noise from the data.
Working on the security of information in cyberspace, Wang [19] introduced a hybrid model for anomaly detection and response generation in communication networks. The study employed CNN and RNN for spatial and temporal analysis utilizing zero trust architecture to ensure network integrity. The results revealed 95.4 % accuracy in anomaly detection including blocking suspicious account and isolation of compromised devices from the network as a mitigation step. Sontakke and Chopade [20] investigated the performance of deep learning-based intrusion detection and mitigation mechanisms proposed for vehicular ad hoc networks. The detection model combined improved particle swarm optimization technique with the deep neural networks for fine model tuning. The mitigation process utilized the BAIT approach to locate the intruder’s position in the network. The attack vectors employed in the study include false message injection—sending bogus fictitious values, and Sybil—creating multiple illegal message identifiers. The simulation results showed outstanding performance in anomaly detection and identifying the adversary’s position with 100 % true detection rate, and the mitigation measure involved isolation of the affecting node (intruder) from the network.
Hidalgo et al. in [21] advocated the efficient use of the SerIoT system in vehicular communication networks for anomaly detection and mitigation. The SerIoT system can monitor real-time network traffic, analyze the data for unusual behavior and irregular patterns, and can take necessary mitigation action in communication networks. Consisting of real and virtual components, the experimental setup included Renault Twizy 80 and Dynacar Environment implemented by using Matlab/Simulink. The study used graph neural network-based multi-layer perceptron technique for detection and mitigation of DoS anomaly in the network. The model proposed block—temporary data blockade, block-list—data blockade for an extended time, block-list MAC—blocking the affected MAC device and Deflect—redirecting the intruder to decoy system as mitigation strategies. The proposed model was evaluated in terms of response time both for detection and mitigation which is fairly low, however, detection accuracy score in correctly detecting the intrusions was missing in the study. Khanapuri et al. [25] presented a DL-based anomaly detection and mitigation controller for the security of smart vehicles platoon. By using CARLA and MATLAB platforms for the simulation setup and keeping the system decentralized, the study utilized local sensor information to identify the malicious actor in the platoon. Preparing the data using Gramian Angular Fields, Short Time Fourier Transform, Time Series to Gray Scale, and Markov Transition Fields, the detection process utilized CNN for identification of flaws. The proposed controller employed Routh Hurwitz Criterion to determine constraints on controller gains for attack mitigation. The study concluded with 96.3 % detection accuracy and increased distance between attacking and normal vehicles as a mitigation measure. To neutralize the impact of false data injection attacks in vehicle platoons, Ahmed et al. [15] introduced a state-space model and unknown input observers (UIOs)-based anomaly detection and mitigation model. The UIOs were used for state estimation, and were implemented with residual function to detect the presence of anomalies in the data. Afterward, the anomalous data was subtracted from the associated input fed to the platoon controller as a mitigation strategy.
Limitation to existing studies: Evident from the literature above and Table 1, the existing studies have primarily focused the first tier of the defense mechanism i.e., anomaly detection, while intrusion mitigation being a critical process to ensure car security and passenger safety, comparatively low attention is paid to present a mitigation strategy against cyber intrusions in SCs. Unfortunately, there are quite limited studies on the topic, addressing the intrusion mitigation in controller area network in smart cars—an area underexplored by the researchers. However, the documented studies in literature suggest to isolate the affected node or block and discard the data completely. Not only disengaging the system, these solutions also halt the continuity of operations resulting in loss of critical information, which is damaging for the commuters in smart cars. To overcome these issues, this study proposes a real-time anomaly mitigation technique based on data reconstruction strategy which operates without interrupting the system’s functionalities. However, to the best of our knowledge, the literature lacks an extensively investigated intrusion mitigation mechanism for smart cars that reconstructs data efficiently in real-time. Fulfilling the gap, this study proposes a novel lightweight AM-DDAE-based intrusion mitigation model to remove anomalous values and reconstruct the original values compromised by cyber-intrusions injected in the CAN-bus of smart cars. The proposed model was rigorously tested for multiple cyber-attacks by employing six different datasets, to validate its effectiveness over a range of intrusions. To check model adaptability to more sophisticated and emerging attack, it is also tested on new unseen attack. In addition, to build the trust of stakeholders on AM-DDAE, Explainable AI techniques are employed to analyse decision making process of the proposed model. Furthermore, leveraging the deep-denoising autoencoder scheme, the proposed method adopts to adjust the momentum dynamically during the model training at each epoch. This strengthens the model learning to capture the underlying pattern more efficiently. Tested for multiple known attack designs, car models, and new unseen attack, the proposed model has achieved < 1% error in original data reconstruction, and is also lightweight consuming 0.145532 s in model execution on average.

1.2. Challenges in Intrusion Mitigation

Real-time mitigation of intrusions in smart cars is crucial to ensure a secure and safe driving experience. Data transfer between different electronic control units through CAN-bus possesses varying nature which brings multiple challenges for the mitigation model to tackle with. The main challenges are:
  • Non-linear complex data handling: CAN-bus data is highly non-linear as the different nodes communicate with each other to perform tasks that differ in functional complexity. Deep-denoising autoencoder (DDAE) models have built-in capability to handle non-linear data comfortably.
  • Robust noise removal: DDAE models are designed to clean the noisy data.However, effective noise filtering is a challenging task to avoid model overfitting and underfitting that often result in loss of significant information, and failure in learning underlying data patterns to generalize well to new data.
  • Gradient handling: Gradient vanishing and divergence is a big challenge in non-linear data where vanishing can slow down model learning, and divergence can accelerate weight updates causing instability in the model.
  • Generalization: With the evolving nature of cyber-intrusions demonstrating new attack vector designs, it is imperative to have an adaptive model to denoise the new unseen data efficiently.

1.3. Motivation

The existing studies mentioned in Section 1.1, propose mitigation strategies either by discarding the data or isolating the affected node from the network causing prolonged interruption in a vehicular communication network. Disrupting the normal data flow, these approaches can cause car immobilization which can be the source of road obstructions, block lanes, rear-end collisions, stress, and panic among drivers leading to unpleasant driving experience. Contrarily, the reconstruction of normal data by removing attacks appears to be a more viable option to ensure safe and continuous SC operation.
Further, data retrieval using an AM-based deep denoising autoencoder presents promising performance while overcoming the associated challenges. Deep-learning based autoencoders are inherently capable of handling non-linear data and learning underlying data patterns efficiently. Adaptive momentum enables the model to achieve a balance between learning efficiency and stability avoiding underfitting and overfitting problems. Rather than using a fixed learning rate and momentum, the AM-DDAE model utilizes optimized parameter values based on the model performance during training, generalizing well for the unseen data.

1.4. Contributions

For a smart car, where cyber-attack detection is crucial, attack mitigation is an integral part of the defense mechanism. In this study, an efficient and robust AM-DDAE-based intrusion mitigation mechanism is presented to reconstruct the original data values manipulated by malicious actions of adversaries on the CAN-bus data through the OBD-II port of the SCs. The proposed AM-DDAE model is extensively investigated for multiple attack vectors, viz DoS, Replay, Spoofing, Fuzzing, Impersonation, and Malfunction, using CAN-bus data from different smart car models such as Hyundai YF Sonata, KIA Soul, Chevrolet Spark, and Genesis g80. The main contributions to the literature are given below:
  • Novel light-weight AM-DDAE model design: Development of a novel adaptive momentum-based deep denoising autoencoder for intrusions mitigation in smart cars, with considerably low computational cost. Additionally, Explainable AI techniques—SHAP and LIME—are incorporated to examine model’s decision-making capabilities.
  • Generalization: Investigation of the proposed mechanism by employing multiple cyber-attacks for different makes of smart cars ensuring the generalizability and applicability of the proposed mechanism over various attack designs and car models.
  • Efficiency and robustness: Analysis of the results revealed a comprehendible performance with 2.87 × 10⁻⁷ mean reconstruction error, less than 1% percentage error and 0.145532 sec average execution time which verifies the robustness and efficiency of the proposed mechanism. The model presented an equally strong performance when further evaluated on a new unseen attack design, and on Adversarial Machine Learning Attack. Additionally, on comparison with Generative Adversarial Networks, the proposed model demonstrated exceedingly high performance with 99 times higher accuracy in intrusions mitigation.
The rest of the paper is organized as follows. Section 2 gives an understanding of potential attack surfaces and cyber-intrusions in a smart car. The proposed AM-DDAE for intrusion mitigation is described in Section 3 followed by the findings of the proposed mechanism in Section 4. Finally, Section 5 concludes the study with the generalizability of the proposed mechanism over different types of smart cars and attacks.

2. The Smart Cars: Potential Attack Surfaces & Cyber-Intrusions

Smart cars are the cars with embedded intelligence that integrate tightly coupled physical devices—sensors and actuators, to the communication and computational network—software and processors. These components communicate with each other to share data and perform intelligent operations like anti-lock braking, engine control, and keyless entry. What makes smart cars smart is their key feature of achieving high speed in a matter of seconds. Fortwo can accelerate to 60 mph from 1 mph in Just 15 s, and is able to handle the high speed efficiently through an anti-lock braking system in emergencies. The infotainment system, powertrain, advanced driving assistance system, GPS, engine temperature and fuel injection control are the prominent intelligent features of smart cars. In addition, smart cars improve luxury driving by enabling connectivity to the internet through the occupant’s mobile phone or by using built-in hardware that provides 4G, and 5G connections. However, over-the-air communication make SCs highly vulnerable to cyber-threats. The various attack surfaces in SCs are diagnostic ports, infotainment systems, sensors, communication networks, over-the-updates, USB connections, and cloud-based services.
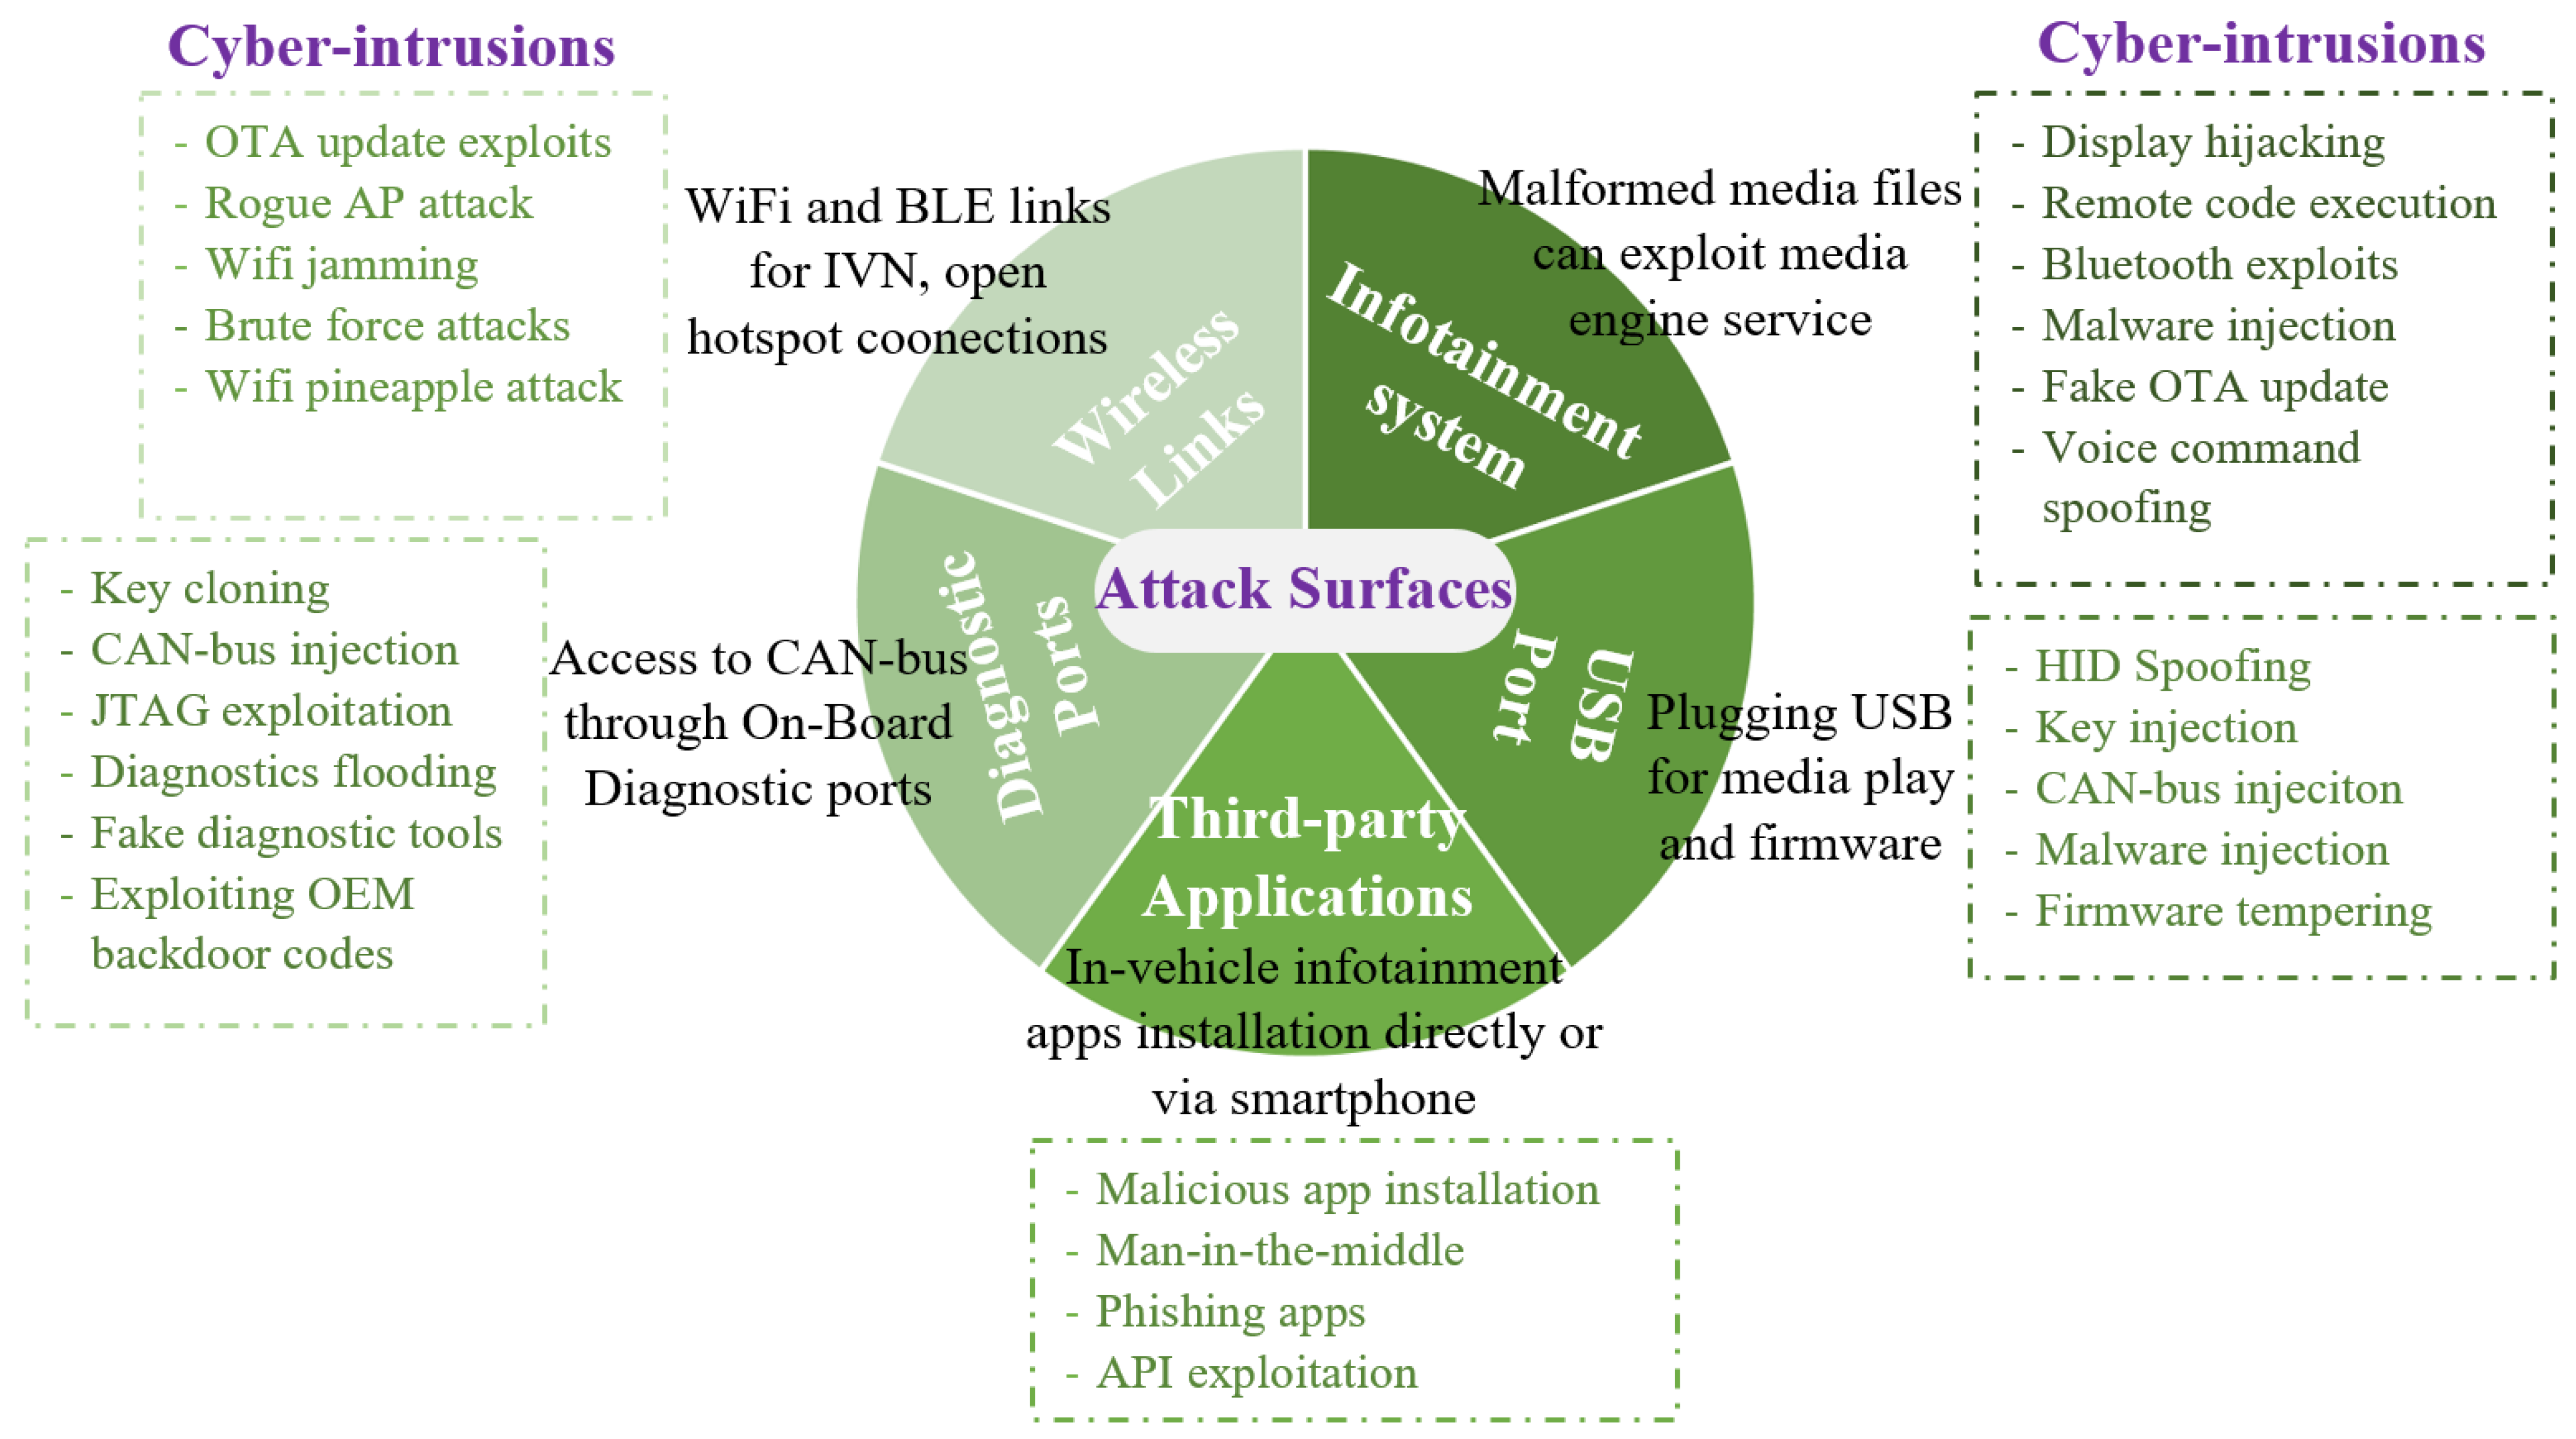
The attack surface is an entry point through which an adversary can gain unauthorized access to the system, either physically or through wireless links. By exploiting potential vulnerabilities in these surfaces, intruders can introduce multiple intrusions demonstrating varying attack designs. The various potential cyber threats in SCs are: malware injections, CAN-bus injections, fake OTA updates, Wifi jamming, key cloning, phishing apps, and many others. Figure 3 describes various potential attack surfaces and threats that disrupt the in-vehicular communication (IVN), reducing the overall car efficiency that may lead to serious threats to the life of the occupants. The current study focuses on the CAN-bus injections which include DoS, fuzzing, spoofing, replay, impersonation, flooding, and malfunction intrusions.
Denial-of-service (DoS) attack is the interruption in normal CAN-bus data flow with the injection of 0 × 000 values, fuzzing is the addition of random noise in the CAN data, replay is the transmission of the same message repeatedly, spoofing is the introduction of spoofed messages, impersonation is the data corruption by hacker impersonating a legitimate user, flooding is the network bottleneck by tempered data, and malfunction is the loss of data integrity by insertion of malicious values.

3. Proposed Methodology

Leveraging digitization, technological advancement has facilitated the driving experience by integrating smart features in the conventional transportation network. However, the smart feature inherits cyber vulnerabilities associated with communication in cyber space. Various mechanisms are proposed for intrusion detection to send alert signals to commuters about the presence of anomalies in the network, but there is still a gap in the literature to remove the intrusion and reconstruct the original data efficiently in smart cars. In this study, a novel lightweight AM-DDAE mechanism is proposed for the reconstruction of original data manipulated by cyber-intrusions in the CAN-bus network in smart cars. The AM-DDAE model utilizes real-time datasets for model training and testing collected from different smart car models.

3.1. Datasets

The behavior of a deep learning-based model is dependent on the data provided for model training to learn the latent space and regenerate the original values by removing noise from the actual data, so the selection of the dataset plays a major role in determining the efficiency of a model. This study utilizes real-time datasets collected from different car models such as the Hyundai YF Sonata, KIA Soul, Chevrolet Spark, and Genesis g80. The database was generated in the Hacking and Countermeasure Research Lab, South Korea by injecting intrusions in CAN-bus through OBD-II port by wireless connection to the data acquisition system. Differing in collection time, attack type, intrusion injection frequency, and car model, the six independent datasets are used for the training and testing of the proposed AM-DDAE mechanism. These are (1) CAN-Intrusion Dataset (OTIDS) generated using KIA Soul, 2017 [26]; (2) Car Hacking Dataset compiled from Hyundai YF Sonata, 2018 [27]; (3) In-vehicle Network Intrusion Detection Challenge Dataset produced with data collected from Chevrolet Spark, KIA Soul and Hyundai Sonata, 2018 [28]; (4) M-CAN Intrusion Dataset derived from Genesis g80, 2022 [29]; (5) B-CAN Intrusion Dataset generated using Genesis g80, 2022 [30] and (6) CAN-FD Intrusion Dataset obtained through Smart cars released in 2021, 2022 [31]. The various characteristics of the datasets including car model, number of attacked samples, normal samples, and attack types are given in Table 2. The attributes of CAN bus dataset are the timestamp, CAN identifier (ID), data length code (DLC), data value, and a flag representing it as normal data or anomalous data. Timestamp represents the time at which data was logged and recorded. CAN ID is an identifier for the CAN message in HEX as 024A. It is either 11-bit identifier—a standard frame or 29-bit identifier—an extended frame depending upon the format used. DLC gives an idea of the length of bytes in the CAN message transmitted to a particular electronic control unit. This value normally ranges from 0 to 8 bytes, however in case of CAN-FD data, its value could extend to 64 bytes. Data value represents the actual information contained in the CAN message to carry out a specific operation either to control the car speed, control the fuel injection rate, control the tyre pressure or any other function. The data value can be 64 bits at maximum for normal CAN messages, while it could increase to 512 bits for CAN-FD. Flag is the final feature of a CAN-bus message which differentiates the data as either attacked or normal. ‘T’ flag shows that the data is compromised by an anomaly while attack-free data is represented by ‘R’ flag. As the CAN-bus enables in-vehicular communication among different ECUs, so all these attributes and features carry substantial information about normal and abnormal traffic flow on CAN-bus, helping the mitigation model to learn the data pattern and mitigate the anomaly from the system once identified by the intrusion detection system. Further, these attributes enable understanding the communication semantics by identifying the sensitive CAN IDs, allowing targeted monitoring and mitigation of intrusions that are perils to safety. Generally, each ECU in a smart car is assigned a unique fixed CAN ID which helps in identifying the compromised ECU when it starts sending data at an unnecessarily high frequency reflecting injection of DoS, flooding or spoofing attack. Similarly, DLC value plays a critical role in knowing anomalous data if there is significant variation in its value as from 2 to 8 or any other. Lastly, actual data value is the most significant in the training of a mitigation model. As an abrupt change in sensor reading, steering angle and or acceleration indicates high chances of intrusion such as spoofing, replay or false message insertion attack. Therefore, the performance of a mitigation model is directly linked with and highly dependent on these features to learn complex patterns in the data, know the contextual relationships and temporal dependencies among messages in the controller area network traffic. Attack injection rate is an important parameter linked to the intensity, CAN bus is manipulated. The original data is logged by taking time interval between attack injections. The Attack injection rate (AIR) is number of packets per second (pps), calculated by dividing the total number of intrusions by time interval between two injections.AIR values for different attack designs are given in Table 2.

3.2. Data Preprocessing

To enhance the model’s stability and convergence, data preprocessing is an integral step in the training of deep-learning models for generating effective latent space representation in DDAE. Normally, preprocessing is performed using either normalization or standardization depending on the nature of the data. For Gaussian-based data distribution, standardization is employed by calculating the mean and variance of the data. Normalization is preferred when data is highly non-Gaussian and it is required to preserve the impact of intrusions in the original data. Given the non-Gaussian data with a significant number of attack samples, normalization is employed in this work to achieve consistency across the range of data. More precisely, the min-max approach is adopted for normalization to adjust the values between 0 and 1 which helps to avoid bias and rescale the complete data proportionally. Mathematically, the normalization process is given as in (1), while (2) explains the transformation to a new scale of 0 and 1.
Z = z z m n z m x z m n
Z = z z m n z m x z m n Y m x Y m n + Y m n
where Z is the normalized data, z is the original data, z m n and z m x represent the minimum and maximum data points, and Y m n and Y m x represent the new minimum and maximum data values on 0–1 scale.

3.3. Attack Design

Attack design depends on the target environment, its architecture, and system awareness by the threat actor. Assuming that the intruder is well-informed of the system and its vulnerabilities injects smartly designed intrusions such as DoS, replay, fuzzy, and spoofing attacks on the CAN-bus through OBD-II port. The attack design for Denial-of-Service is the injection of messages of the highest priority by replacing all non-zero values with zeros in a CAN-bus message, and for a replay attack, it is the transmission of the same data point repeatedly on the bus. In the case of fuzzy intrusion, the attack design is the addition of random data points in network traffic for an arbitrarily chosen CAN ID whereas data manipulation for a specific CAN ID is categorized as a spoofing attack. The attack designs for different attack types are described in (3).
ϵ = [ 0 , 0 , . . . , 0 ] , f o r D o S i n t r u s i o n [ d x , d x , . . . , d x ] , f o r r e p l a y i n t r u s i o n a r b i t r a r y _ C A N _ I D ( r a n d [ d x ] ) , f o r f u z z i n g i n t r u s i o n s p e c i f i c _ C A N _ I D [ d x ] , f o r s p o o f i n g i n t r u s i o n
where d x represents manipulated data points. The input Z changes to Z ^ once the attack vector is injected into the original data, as given in (4).
Z ^ = Z + ϵ

3.4. Proposed AM-Based Deep-Denoising Autoencoder

This study proposes a novel adaptive momentum-based deep denoising autoencoder (AM-DDAE) mechanism for intrusion mitigation by reconstructing original data from the noisy input compromised by cyber-intrusions. Data reconstruction is realized by the model’s ability to understand the data behavior and its trends, which requires data division in an appropriate ratio for model training and testing. In this study, the input data is split as 65% data is used for model training - further divided into 90% training and 10% validation data—and 35 % is used for testing.
The proposed mechanism is a two-step model including (a) intrusion injection and (b) AM-DDAE intrusion mitigation processes independent of intrusion detection system which is a separate component. Intrusion injection involves attack insertion in CAN-bus data by the intruder impersonating an authentic ECU to get illegitimate access to the controller area network through an OBD-II port in smart cars connected via a wireless connection to the data acquisition system. The compromised ECU could be an advanced driver assistance system, power train-, body-, engine-control module, or any other. The normal and attacked data is then fed to the AM-DDAE intrusion mitigation model which is a key component of a network monitoring unit in smart cars. Capturing the incoming traffic, the model performs encoding and decoding on the data based on the model training, updates the parameters including weights, biases, momentum, and learning rate, and finally reconstructs the original data by removing noise from the input data. The pseudocode stating the main points of the proposed mechanism is presented in Algorithm 1. The working of the proposed model is presented in the subsequent section.   
Algorithm 1: AM-DDAE Mechanism for Intrusion Mitigation
  • Data Preparation      input_data = SC_CAN-Bus_data()
  •      norm_data = normalize(input_data)
  •      [train,test] = input.split(input, train_ratio)
  •            train_data = 1:upper_limit → 0.65 * norm_data
  •            test_data = upper_limit+1:end → 0.35 * norm_data
  • Parameters Initialization
  •      def features_number, hiddern_layers_size
  •      def initial_momentum, initial_learning_rate
  •      def batch_size, epochs_number
  •      def weights, biases, activation_function, hiddern_layers_size
  • Training Loop
  •      for i = 1 : epochs_number
  •            learning_rate = learning_rate_scheduler(epoch)
  •            latent_space = encoder(batch_input)
  •            retrieved_output = decoder(latent_space)
  •            loss = compute_loss(batch_input, retrieved_output)
  •            grad = compute_gradients(loss, weights, activation_function)
  • % Weights and Biases Update
  •            weights[layer] = momentum * weights[layer] + learning_rate *
  •            grad.weights[layer]
  •            biases[layer] = momentum * biases[layer] + learning_rate *
  •            grad.biases[layer]
  •            validation_loss = evaluate_model(input, weights, biases)
  • % Momentum Adjustment
  • if epoch > 1:
  •      if validation_loss > prev_validation_loss
  •              momentum = max(0.5, momentum*0.9)
  •      else
  •              momentum = min(0.99, momentum*1.1)
  • Model Testing & Evaluation
  •      test_reconstruction = forward_pass(test_data, weights, biases)
  •      error_calculation = mse(y_test, test_reconstruction)

3.4.1. Working of the Proposed AM-DDAE Mechanism

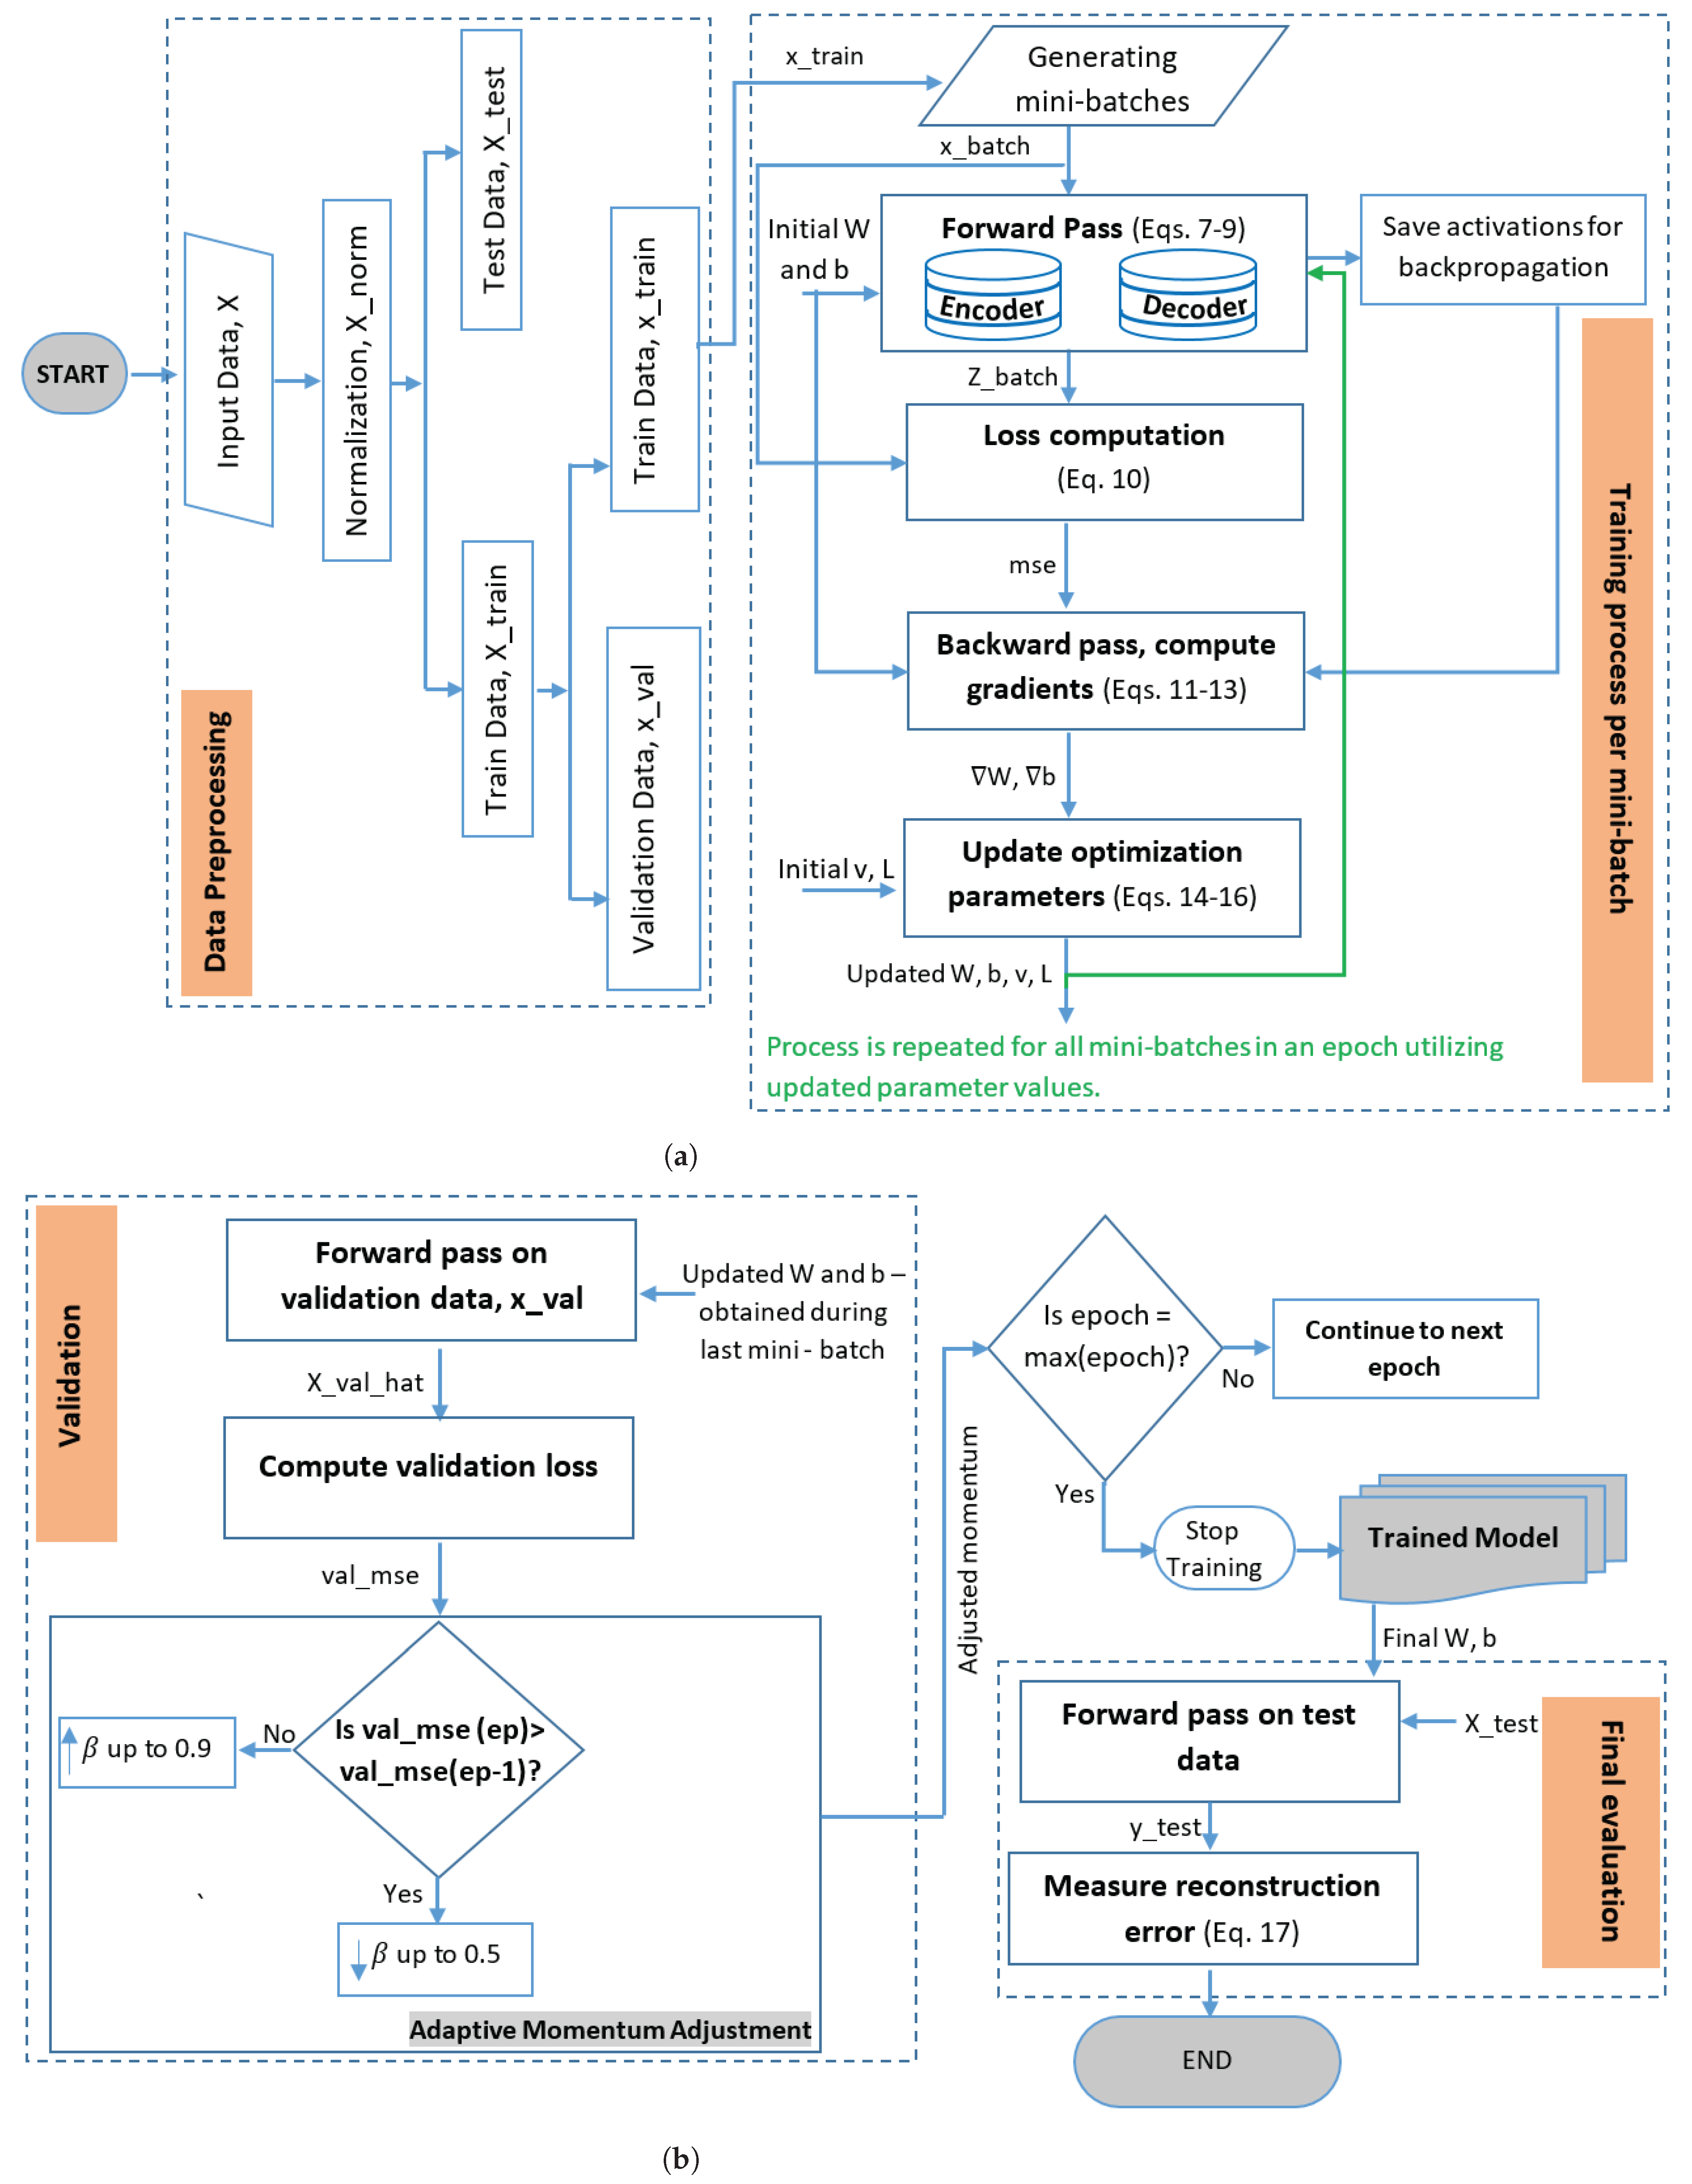
Working of the proposed model involves four steps (i) data preprocessing, (ii) training, (iii) validation and (iv) evaluation. It begins with the (i) normalization of the input data to scale different features within the range. As the large feature values dominating the learning process can negatively impact the model’s training and validation steps, affecting its overall stability. After normalization using min-max technique, the input data (X) is split into training ( x t r a i n ), validation ( x v a l ) and test data ( X t e s t ). (ii) Training utilizes x t r a i n data divided into fixed number of epochs, further splitting each epoch into 16 mini-batches ( x b a t c h ). The model training is an iterative process performed on per-batch concept i.e., the complete training process is executed on one mini-batch and then repeated for all 16 mini-batches in the epoch. Using the x b a t c h and initial values of weights and biases, the forward pass process performs data encoding and decoding. The data is encoded using three layers of encoder, each performing linear transformation to generate pre-activations followed by ReLU function which introduces non-linearity in the data generating activations. During the encoding, output of one layer serves as an input to the next layer transforming input data into compact latent space. This latent representation is fed to a decoder which reverses the encoding process and attempts to reconstruct the original data with minimal reconstruction error. Here after, loss function is computed which helps in determining magnitude and direction of gradient in the subsequent process.
Next, gradients of weights and biases are calculated performing backpropagation in the backward pass process by using loss function, initial weights and biases values and activations produced during the forward pass. At the end of the training process per-batch, these gradients values, initial velocity and learning rate are used to update the optimization parameters generating updated weights, biases, velocity and learning rate. These updated values are then used in the next iteration, and the process continues until the training by all mini batches i.e., one epoch. Upon completion of training by an epoch, the model performs (iii) validation. Validation is conducted by employing forward pass process on validation data, using weights and biases produced during the last mini-batch training. This process outputs reconstructed value, x v a l h a t . Following the hierarchy, validation loss is the computed which is used to adjust momentum needed for enhance learning and improved convergence. If validation loss for the current epoch is greater than the last epoch, momentum is decreased but not below 0.5 and increased up to 0.99 if loss decreases. The limit 0.5 – 0.99 is set to avoid diminishing impact by the previous updates, and divergence by overshoot of the minima. The final step in the process is (iv) evaluation. Once validation for the epochs is executed, the model performs final evaluation by employing forward pass on the test data using weights and biases obtained during the last epoch. This process generates retrieved output as y t e s t used to calculate reconstruction error which builds an understanding of the model’s performance. The higher value of error shows inaccuracy in the model, whereas a lower error value demonstrates robustness and reliability of the developed model. Finally, the working of the proposed model ends with the measurement of reconstruction error. The data flow and interaction between different components of the proposed model are presented in Figure 4. The data preprocessing and training process are represented in Figure 4a, whereas Figure 4b shows validation and the final evaluation processes. The architecture of the proposed mechanism is presented in the following subsection.

3.4.2. Architecture of the Proposed AM-DDAE Mechanism

The architecture of the proposed mechanism based on the deep-denoising autoencoder technique consists of multiple processes which include forward pass, backward pass, update of the optimization parameters and performance metrics. These processes are explained below in detail.
Forward Pass: A function responsible for the computational flow of data among the encoder, latent-space, and decoder of the proposed AM-DDAE mechanism. It is an iterative process to reduce the loss function to its minimum value to provide an efficient reconstruction of the original input. While inputting the data to the encoder, (5) and (7) serve to transform the input into the latent space by applying a non-linear activation function which is then fed to the decoder component. During decoding, (8) and (9) are used to generate the reconstructed values utilizing the final values of weights and biases.
Encoder: Normally, encoding is the process of converting the given data into a new data format. The proposed AM-DDAE, is the transformation of input data with added noise into compressed representation employing a non-linear transformation. Initially, a linear transformation is employed as given in (5) generating pre-activation output, x for each layer, i of the input data.
x = Z ^ · W i T + b i
where W and b are weights and biases.
Describing the strength of links between layers, weights measure the impact of a neuron from the previous layer on the neuron of the next layer. Weight matrix, W R m × n is generally represented as in (6):
W = w 1 , 1 w 1 , 2 w 1 , n w 2 , 1 w 2 , 2 w 2 , n w m , 1 w i , 2 w m , n ,
where m and n are the number of neurons in the current and previous layers respectively.
Biases are the offset values included in the weighted sum of input, allowing the model to learn displacements in data distribution.
Next, non-linearity is introduced in x using the Rectified Linear Unit (ReLU) function to create a compact representation of Z ^ . ReLU is a non-linear activation function, enabling the model to learn intricate patterns in the data and represent them in latent space to effectively remove noise from the input. The normal functioning of ReLU is as given in (7).
f ( x ) = max ( 0 , x )
For values x > 0, the output is x itself allowing smooth flow for gradient computation in back-propagation during the backward pass process, whereas, for x ≤ 0, the output is ‘0’, to avoid diminishing gradients.
The choice of ReLU in this work is linked with its high computational efficiency as its processing involves a simple comparison of incoming data x with ’0’ rendering low computational cost and making it suitable for large datasets. During each subsequent layer, the data size reduces progressively extracting the most relevant features for intrusion mitigation by bypassing the less significant features such as noise. This process ends with the development of latent space presenting a noise-tolerant compact representation of the input data.
Latent-space representation: It is a final and highly compact presentation of the given data generated by the encoder. It reduces data size and computational cost while enabling effective storage. The most prominent feature of latent-space representation is that it serves as a base for the process of the decoder to retrieve the attack-free original input.
Decoder: Decoding is the regeneration of encoded data back to the original format. In the proposed AM-DDAE, working as the reversal of the encoder and expanding the latent space back to the original data size, the decoder retrieves the initial input by removing noise and eliminating the impact of intrusions on the input data. The reconstruction process for each decoder layer j is given in (8) and (9). Equation (8) produces the intermediate output, x, for each internal layer, whereas (9) presents the original data reconstruction, Z , by the final decoder layer.
x = latent representation · W j T + b j
Z = latent representation · W d e c o d e r T + b d e c o d e r
where W and b are weights and biases. Note that the order of the weight matrix is reversed W R n × m , because starting from the output layer, the decoder functions in reverse order compared to the encoder.
Architecture of the proposed model is portrayed in Figure 5 encoder, decoder and dense layer or the latent space for the proposed methodology along with the number of neurons at each layer. The methodology employs adaptive momentum strategy which is dynamically adjusted according to the validation loss along with Forward pass and Backward pass processes. The data flows from encoder to latent space and then to decoder during Forward pass, and the error calculated by loss function flows from decoder to latent space to encoder during backward pass to update weights for the next epoch. It is an iterative process until training is completed for all epochs. The adaptive momentum value is incorporated to Backward process after the 3rd hidden layer propagating across all layers towards encoder.
Loss Function: The proposed model aims to find the optimal parameters W , b during training, that could help to reduce the reconstruction error by calculating the loss function. Normally, neural networks utilize mean-squared error (mse) as a loss function to compute the loss during training. Mean-squared error is a measure of the squared difference between reconstructed and original values, calculated using (10). For larger differences, the model is reiterated to improve the learning by focusing on more meaningful features that effectively reduce the mse value generating a well-generalized latent space.
mse = 1 N i = 1 N ( z i z i ) 2
where z and z are original and reconstructed values respectively, and N represents the total number of observations.
This study aims at reducing the reconstruction error between original and reconstructed values, that allows focused optimization by minimizing reconstruction loss which is directly aligned with the goal of Denoising—removing noise from the data.
Backward Pass: A function processing backward to compute the gradients for weights and biases using the error value ( δ ) as given in (11). These gradients help the model identify the amount of change required to update the parameters using gradient descent to obtain the minimum value for the loss function.
δ = ( Z Z )
Negative sign indicates that the gradient is descending in the direction of low reconstruction error.
The basic steps involved in the backward pass process are (i) calculation of error value using (11), (ii) calculation of weights- and biases-gradients using latent-space activations and error signal for encoder, (iii) calculation of weights- and biases-gradients using activations from previous layer and error signal for decoder, and (iv) application of derivative of activation function to tune error signal in every layer. The weights- W and biases- b gradients are calculated using (12) and (13) which propagate backward from the output layer to the input layer. W calculation utilizes delta and activations from previous layers, while b is a measure of the mean of deltas from all previous layers.
W i = δ T · activation i 1 N
b i = 1 N j = 1 N δ j
Adaptive Momentum: In this study, an adaptive momentum (AM) strategy is employed to automatically adjust weights and biases in relevance to validation loss for model optimization. AM is adjusted for each iteration to avoid instability in the proposed AM-DDAE model. During training, if the validation loss increases, momentum drops to a minimum value of 0.5, while it increases to a maximum of 0.99 in the case of a decrease in validation loss. The selection of 0.5 as lower limit is connected to the fact that values below 0.5 give less weight to the past gradients. On the other hand, the values greater than 0.99 may destabilize the learning process and overshoot the optimal point. The momentum updates gradient descent by adding a small value in the current update from the previous update, ensuring to overcome local minima. It helps in reducing the convergence rate by enabling the optimizer to move quickly through flat regions, minimizing oscillations by averaging updates, and addressing over-fitting issues by ensuring stability in the model. Velocity vector—combined effect of previous updates on the current update—is used to update the parameters by considering AM coefficient, C, into account. The equations governing the update process are given in (14) and (15). Equation (14) calculates velocity for each parameter which is then updated using (15) by computing the updated velocities.
v t = C v t 1 + L P
P t = P t 1 v t
where, v t —updated velocity, C—momentum coefficient, v t 1 —previous velocity, L—learning rate, P —gradient of updating parameter, P t —current updated parameter and P t 1 —previous updated parameter.
Learning Rate: Controlling the step size to update the parameters, the learning rate determines the value to scale the gradients for smooth, stable, and fast model convergence. Normally, the learning rate is static—a fixed value during complete training, or dynamically adjusted based on the predefined learning rate L 0 , the number of epochs E, and the decay factor λ as given in (16).
L = L 0 1 + λ · E
In this work, the learning rate is updated by adjusting the decaying factor based on the number of epochs. Starting with an initial rate of 0.01 for the 1–10 epochs, the rate is decayed by 0.933, subsequently adjusted to 0.005 for 11–20 epochs, and then to 0.001 for higher epochs. The selection of decaying factor—0.933—for the proposed AM-DDAE depends on its efficiency in reconstructing the original data.
In addition, training of the proposed model without utilizing an early stopping technique is helpful that allows model to train for maximum number of epochs, enabling robust learning of the complex and subtle features. Furthermore, it observes degradation trends and long-term training behavior.
Summarizing the working of the proposed AM-DDAE model, training of encoder and decoder is an iterative process carried out jointly by reducing the mean-squared error between given input and retrieved output. Encoding, latent-space representation, and decoding are performed during forward pass. Backward pass computes gradients in relevance to weights and biases by performing backpropagation. Optimization is achieved by adjusting the weights and biases to ensure accelerated convergence and stability through adaptive momentum and learning rate schedulers. Lastly, model efficiency is determined by measuring reconstruction error between input data and reconstructed output which is explained in the next subsection.

3.4.3. Error Metrics

The proposed AM-DDAE model is aimed at regenerating the original input by removing intrusions injected into the normal data. The most efficient way to determine the reconstruction accuracy is by analyzing the deviation in reconstructed value from the original value, i.e., performing a simple comparison between original input data and retrieved de-noised output. This comparison is possible by calculating absolute error which is considered as the maximum error possible by any model. It is a measure of the difference between input and output values, calculated as given in (17).
A b s o l u t e E r r o r = z p , q z p , q
where p represents data points and q represents feature number for the z input and z denoised output.
Error ratio, another performance indicator, determines the relative reconstruction error reflecting the model’s ability to learn and understand the input data and how accurately the input data is *represented as denoised output. It is calculated using (18).
E r r o r R a t i o p , q = | z p , q z p , q | | z p , q |
Standard deviation (std) plays a critical role in evaluating the model’s performance while underlining its consistency level. A high std value indicates large variations in reconstruction errors across the samples which shows high inconsistency in the model’s performance. Contrarily, the low std value is a measure of model’s consistency and competency to retrieve and reconstruct the original data points with high accuracy. Std is measured by using (19).
σ = 1 m 1 j = 1 m μ j μ ¯ 2
where,
μ j = 1 n i = 1 n z z
and
μ ¯ = 1 m j = 1 m μ j
μ j is an array of the mean of absolute errors per-sample and μ ¯ is the mean of all μ j .

4. Results and Discussions

Generally, to analyze the reconstruction performance of a model in reconstructing original data from attacked or compromised data, the best evaluation metric is the absolute error, which calculates the difference between the original and reconstructed data. Trained on six independent datasets, the proposed model is tested and evaluated by calculating absolute error, error ratio, and standard deviation. Training cost and validation costs for determining how well the model is learning and its generalizability on unseen data are also investigated in this study. The different simulation parameters used for optimal model training to avoid over-fitting and under-fitting problems are given in Table 3.

4.1. Error Metrics

Reconstruction error (RE) is a gauge to measure the model’s efficiency and accuracy in data retrieval. A high RE indicates significant deviation in the output from the input reflecting poor performance by the model. The low error shows a higher correlation between the input and output, revealing an excellent model learning with low variation in the reconstructed data. Error ratio (ER) is a relative error which provides scale-independent measure of the difference between actual and predicted value. A small ER demonstrates the model’s ability to output the data proportionally close to the input, acting as an insightful indicator in mitigation models. Standard deviation (std) is another performance indicator for the mitigation model, which answers the question that how much the values deviate from the mean. A low std value shows tight clustering around mean, reflecting high consistency and reliability of the model. The mathematical relation for these metrics are given in (17)–(19).
The proposed model is extensively trained, validated and tested by employing all the six independent datasets, each comprising of 500,000 samples per attack design. However, looking at the paper length, the results for the best 5 and the worst 5 reconstructed data points along with corresponding reconstruction error and error ratio are presented here. Table 4, Table 5, Table 6, Table 7, Table 8 and Table 9 present the simulation results for different datasets and attack designs.
Table 4 enumerates the original data value, reconstructed value, reconstruction error and error ratio for three different intrusions i.e., DoS, fuzzy and impersonation from Dataset 1. The results are presented for the best and worst cases scenarios, also providing mean reconstruction error and standard deviation for each case. For DoS intrusion, the best-reconstructed error is 6.5297 × 10⁻⁸ with 8.6722 × 10⁻⁸ error ratio. A substantially low error ratio is reported for fuzzy and impersonation intrusions, the corresponding values are 4.999 × 10⁻⁹ and 9.0795 × 10⁻⁷ for the best cases, and are 1.7792 × 10⁻¹ and 2.0983 × 10⁻² for the worst cases. In particular, the model showed improved performance in the mitigation of intrusions against fuzzy attacks compared to DoS and impersonation anomalies. The probable reason of the superior results could be that fuzzy intrusion—injecting random values—compromises data largely and generates highly anomalous data, which is easier for the AM-DDAE model to detect and reconstruct. Furthermore, the fuzzy samples are probably (i) more balanced and distinct compared to other anomalous data, which enables enhanced resilience. Overall, the model showed exceptional performance in data reconstruction and generated extremely low mean reconstruction error and standard deviation—on the order of 10−4—reflecting the high accuracy and robustness of the proposed AM-DDAE model.
More insight into the model performance can be gained from Table 5 which depicts results for DoS, fuzzy, spoofing (gear) and spoofing (RPM) intrusions introduced in the Car Hacking dataset for CAN-bus. Reconstruction error which is the performance defining parameter for AM-DDAE model is extremely low for all the four cases, even in the case of worst data reconstruction. RE value ranges between 0.018601 and 0.015228 for the worst case in mitigating DoS attack. This value drops to 1.44 × 10⁻⁷ for the best data reconstruction, revealing the exceptional efficiency by AM-DDAE model to learn and reproduce normal data. Similarly, for fuzzy, spoofing (gear) and spoofing (RPM) anomalies, the model manifested high accuracy with 3.9921 × 10⁻⁶, 1.6033 × 10⁻⁴ and 1.0828 × 10⁻⁴ average RE, respectively. These low values demonstrate the model’s effectiveness across multiple attack designs. Similarly, Table 6 illustrates the reconstruction results for In-vehicle intrusion dataset. RE and ER score for all the intrusions are exceedingly low, ranging between 10−12 to 10−2. To combat flooding attack, the model achieved 2.871 × 10⁻⁷ average RE with 1.2391 × 10⁻⁵ standard deviation. While tackling the fuzzy and malfunction intrusions, RE ranges from 10−11 to 10−2, while it ranges between 10−8 and 10−2 for replay attack. It is evident that RE is comparatively high for replay attack as compared to other anomalies, this is due to the fact that replay attack sends same normal data repeatedly producing slight variations in normal data pattern, complicating the data differentiation and model learning. However, the proposed model succeeded in efficiently reproducing the original data compromised by replay attack with RE as low as 10−2.
Simulation results to mitigate the impact of DoS and fuzzing anomalies on the M-CAN data are presented in Table 7. RE and ER scores confirms the consistency of the AM-DDAE model to reconstruct the original data with considerably high accuracy. For the optimal case in DoS, RE are strikingly small ranging between 1.43 × 10⁻⁶ and 7.15 × 10⁻⁶ and ER ranges from 2.02 × 10⁻⁴ to 4.57 × 10⁻⁵. Nevertheless. the results are also appreciable for the worst case, reporting 1.163 × 10⁻² maximum RE and 1.1816 × 10⁻² maximum ER. The model showed an improved performance for fuzzing intrusion exhibiting 3.33 × 10⁻⁹ maximum RE and 8.51 × 10⁻⁸ maximum ER. Similarly, Table 8 shows simulation results for B-CAN data compromised by DoS and fuzzing intrusions. The model portrayed comprehensible outcomes such as reconstructing 0.2 original value as 0.1999999 with 1.5 × 10⁻¹¹ RE and 7.3 × 10⁻¹¹ ER as the best case for DoS. While for worst case, 0.2509803 was reconstructed as 0.2346066 featuring 1.6374 × 10⁻² RE and 6.5239 × 10⁻² ER. Nevertheless, these trivially low values are a demonstration of the model’s strength and robustness. A similar pattern is observed for fuzzing intrusion where maximum RE is 3.76 × 10⁻⁹ with 1.47 × 10⁻⁸ ER in the optimal data regeneration, and 1.026 × 10⁻² RE with 3.7375 × 10⁻¹ ER in the case of poor data regeneration.
Lastly, Table 9 displays the results for CAN-FD data compromised by flooding, fuzzing, and malfunction attacks. Aligned with the model’s performance for the previous cases, the AM-DDAE proved its effectiveness to reproduce the CAN-FD data compromised by flooding, fuzzing and malfunction attacks. It is observed that RE for optimal data in all the three cases is remarkably low falling in the order of 10−11, 10−10 and 10−9, and for the instances of poorly reconstructed data, the RE is reduced to the order of 10−2.
Summarizing the above, these extremely low RE, ER and standard deviation scores indicate consistency, robustness and reliability of the proposed AM-DDAE model over a diverse range of intrusions.
Besides absolute RE, percentage RE is also calculated which makes performance results independent of data scale, making them easily interpretable. Table 10 demonstrates the percentage RE for multiple attack designs. It is noticeable that percentage RE is exceptionally low, less than 1% for all the used cases, ranging between 1.3271 × 10⁻⁵ and 9.0666 × 10⁻⁵. It signifies remarkable delivery by the proposed AM-DDAE model to reconstruct data accurately and efficiently.

4.2. Training and Validation Cost

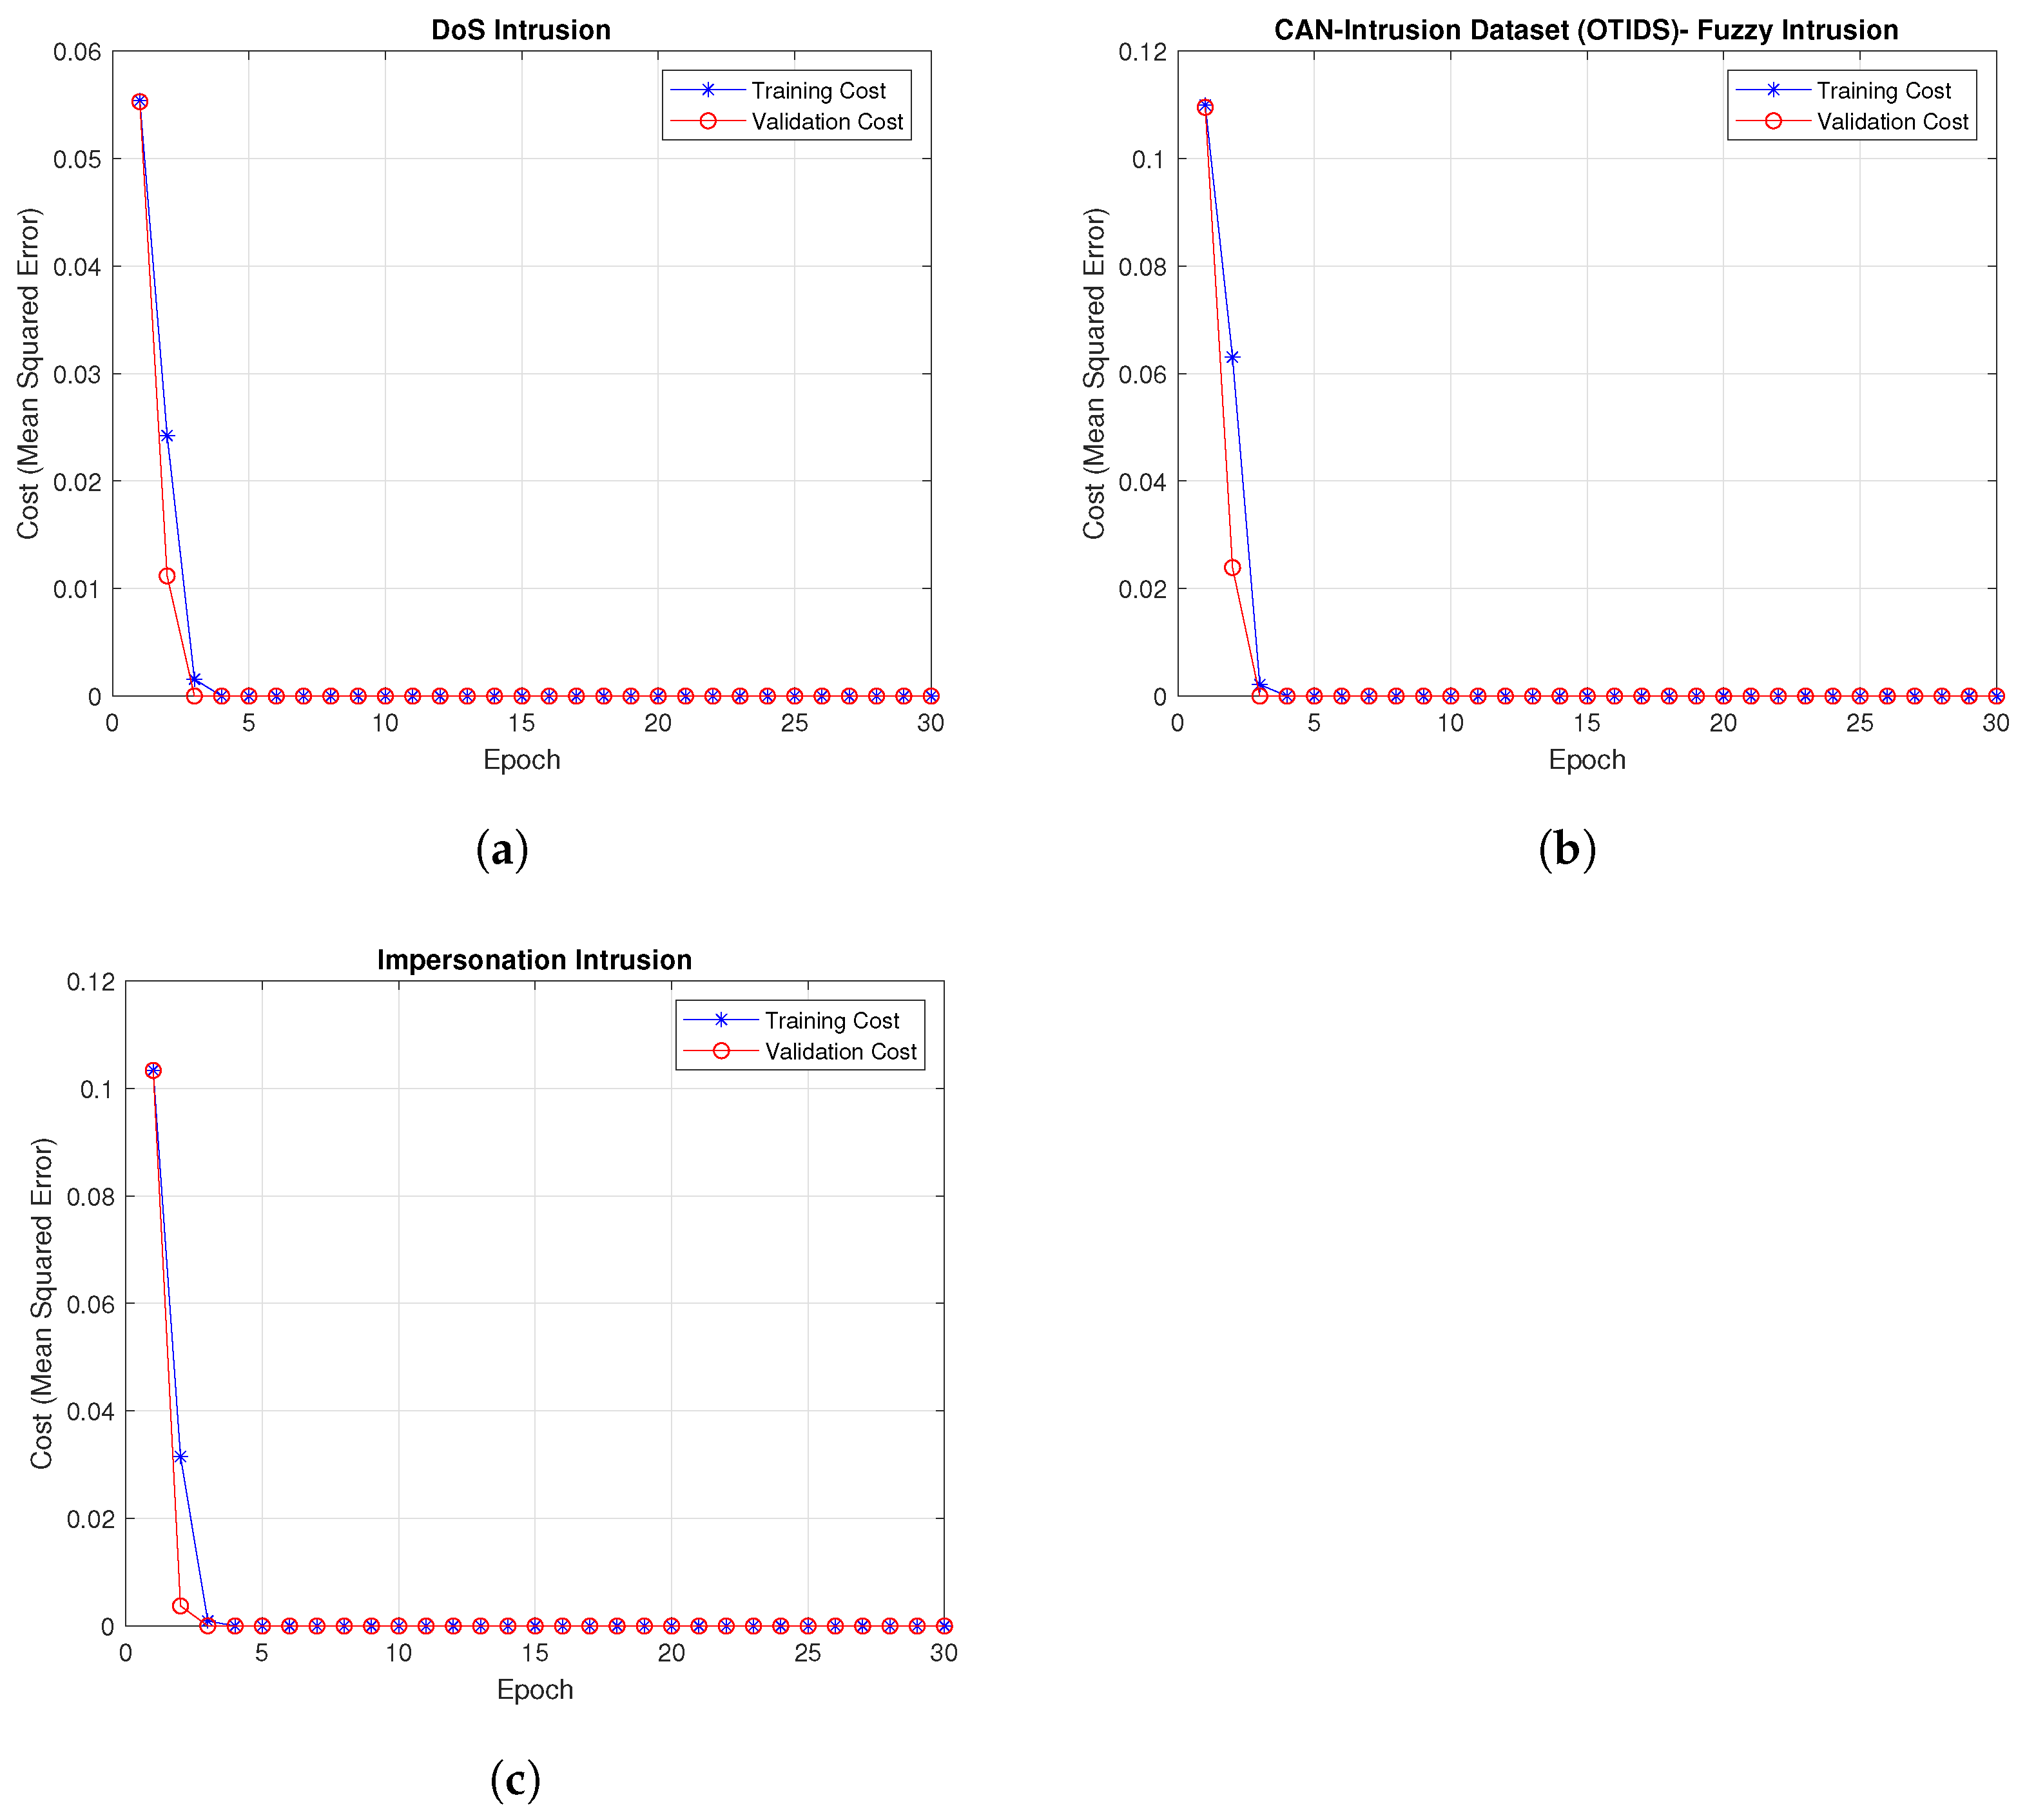
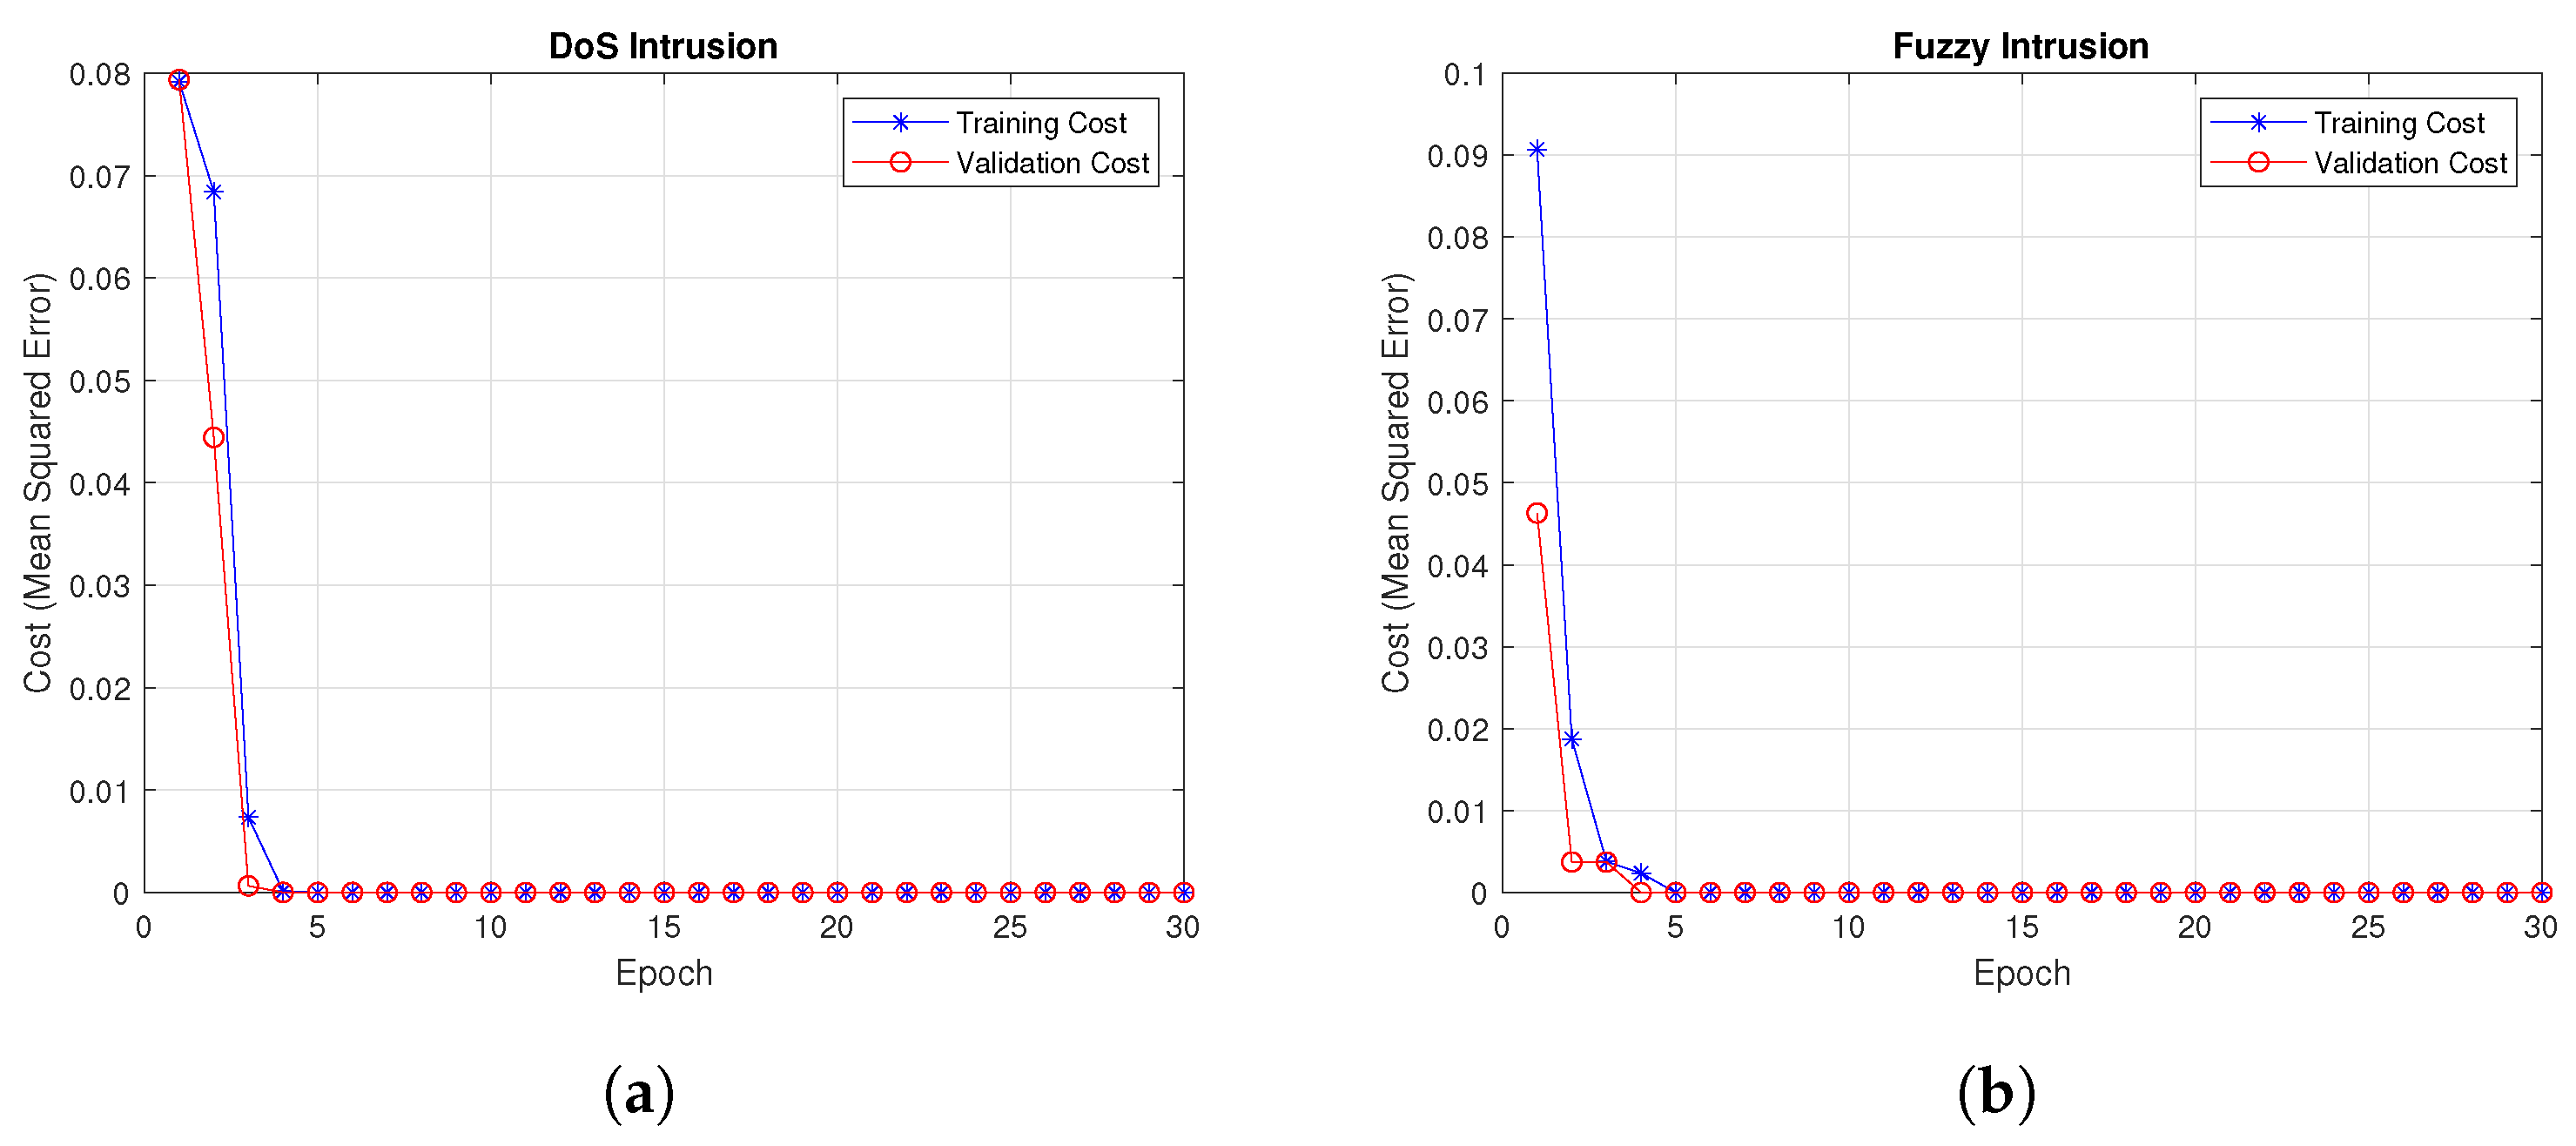
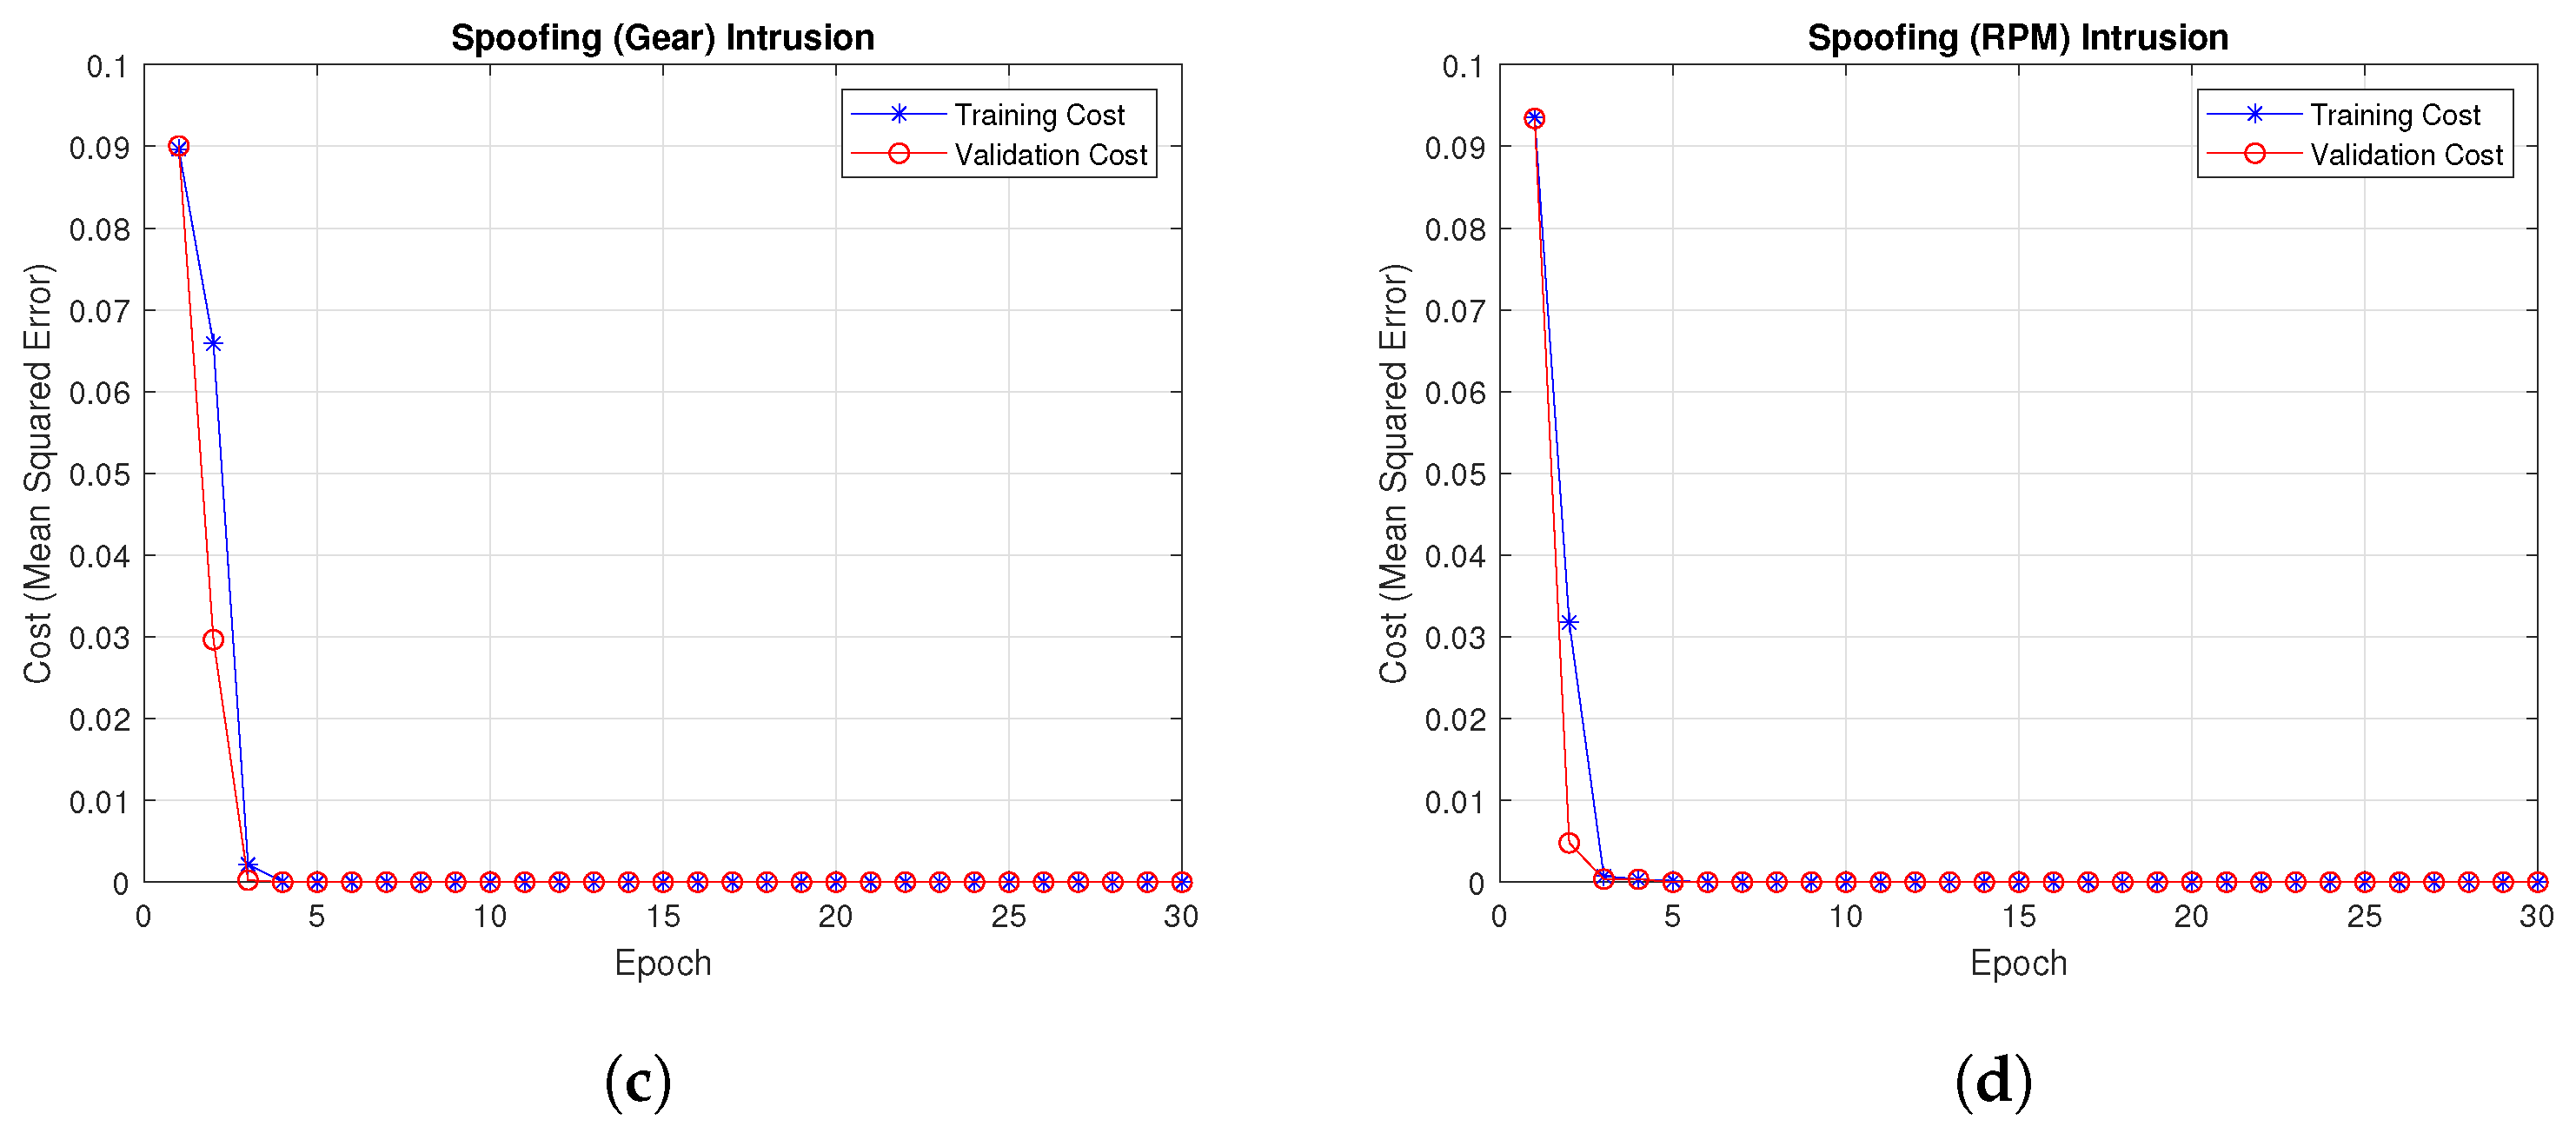
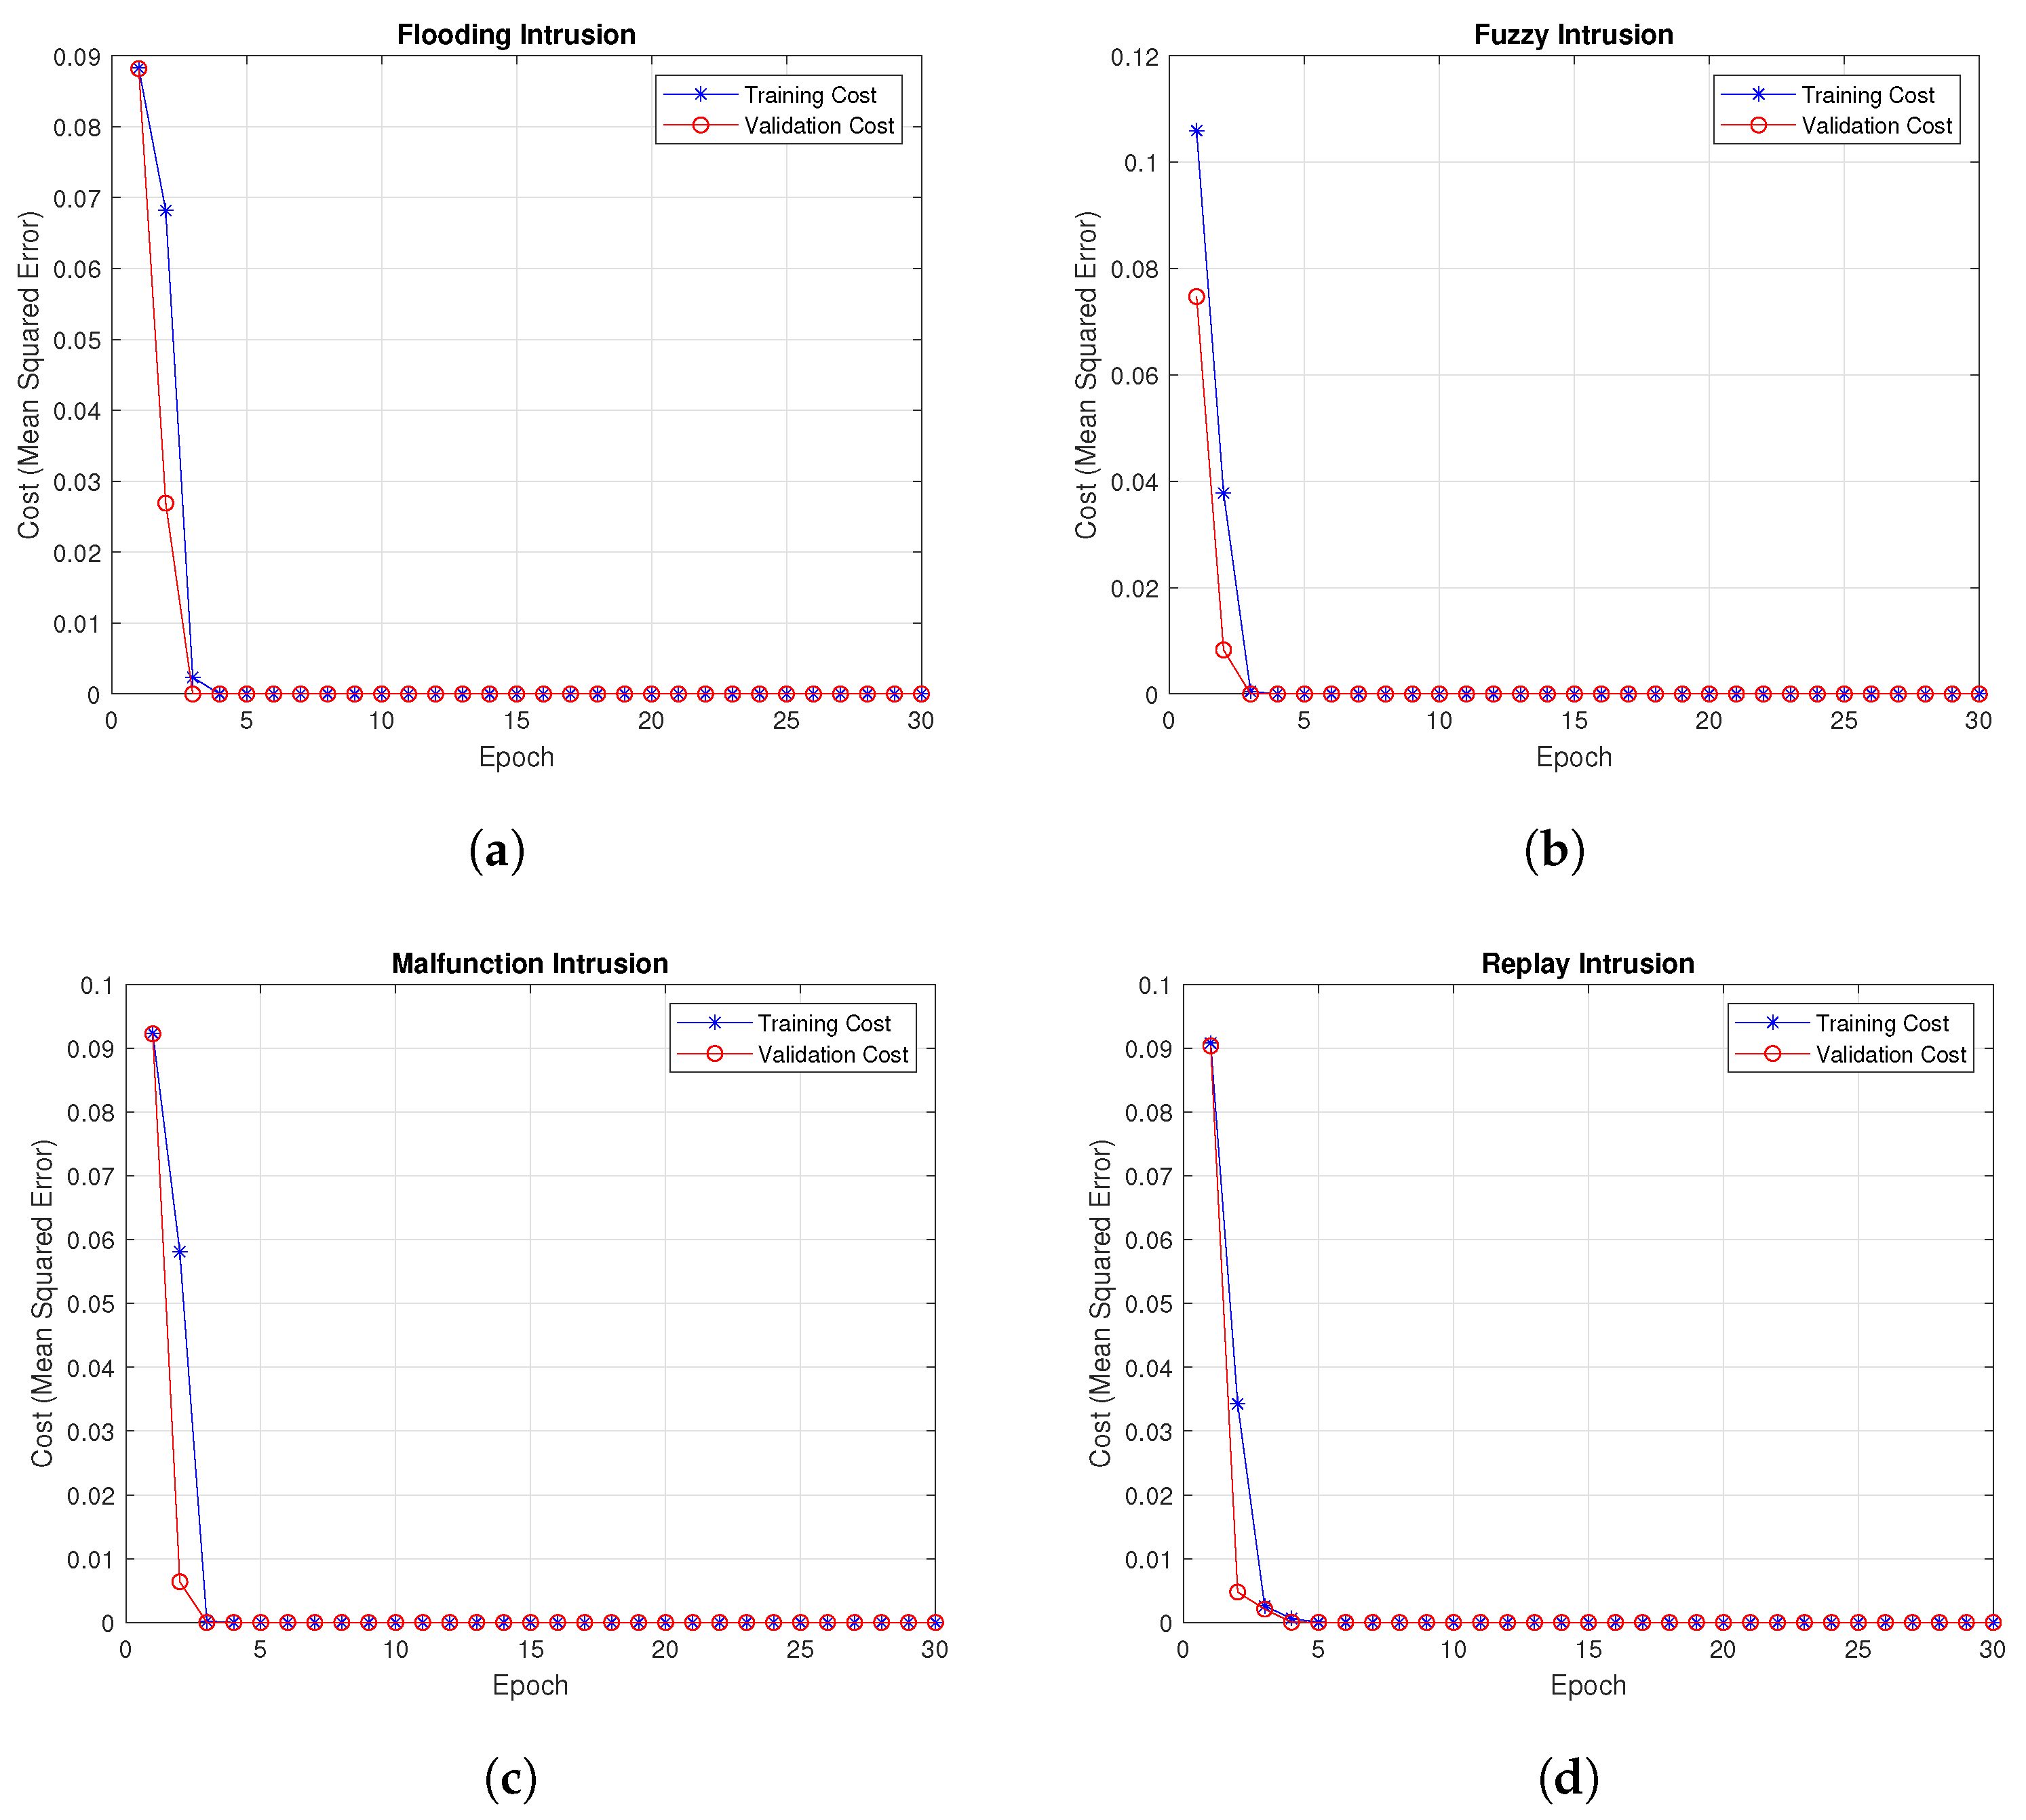
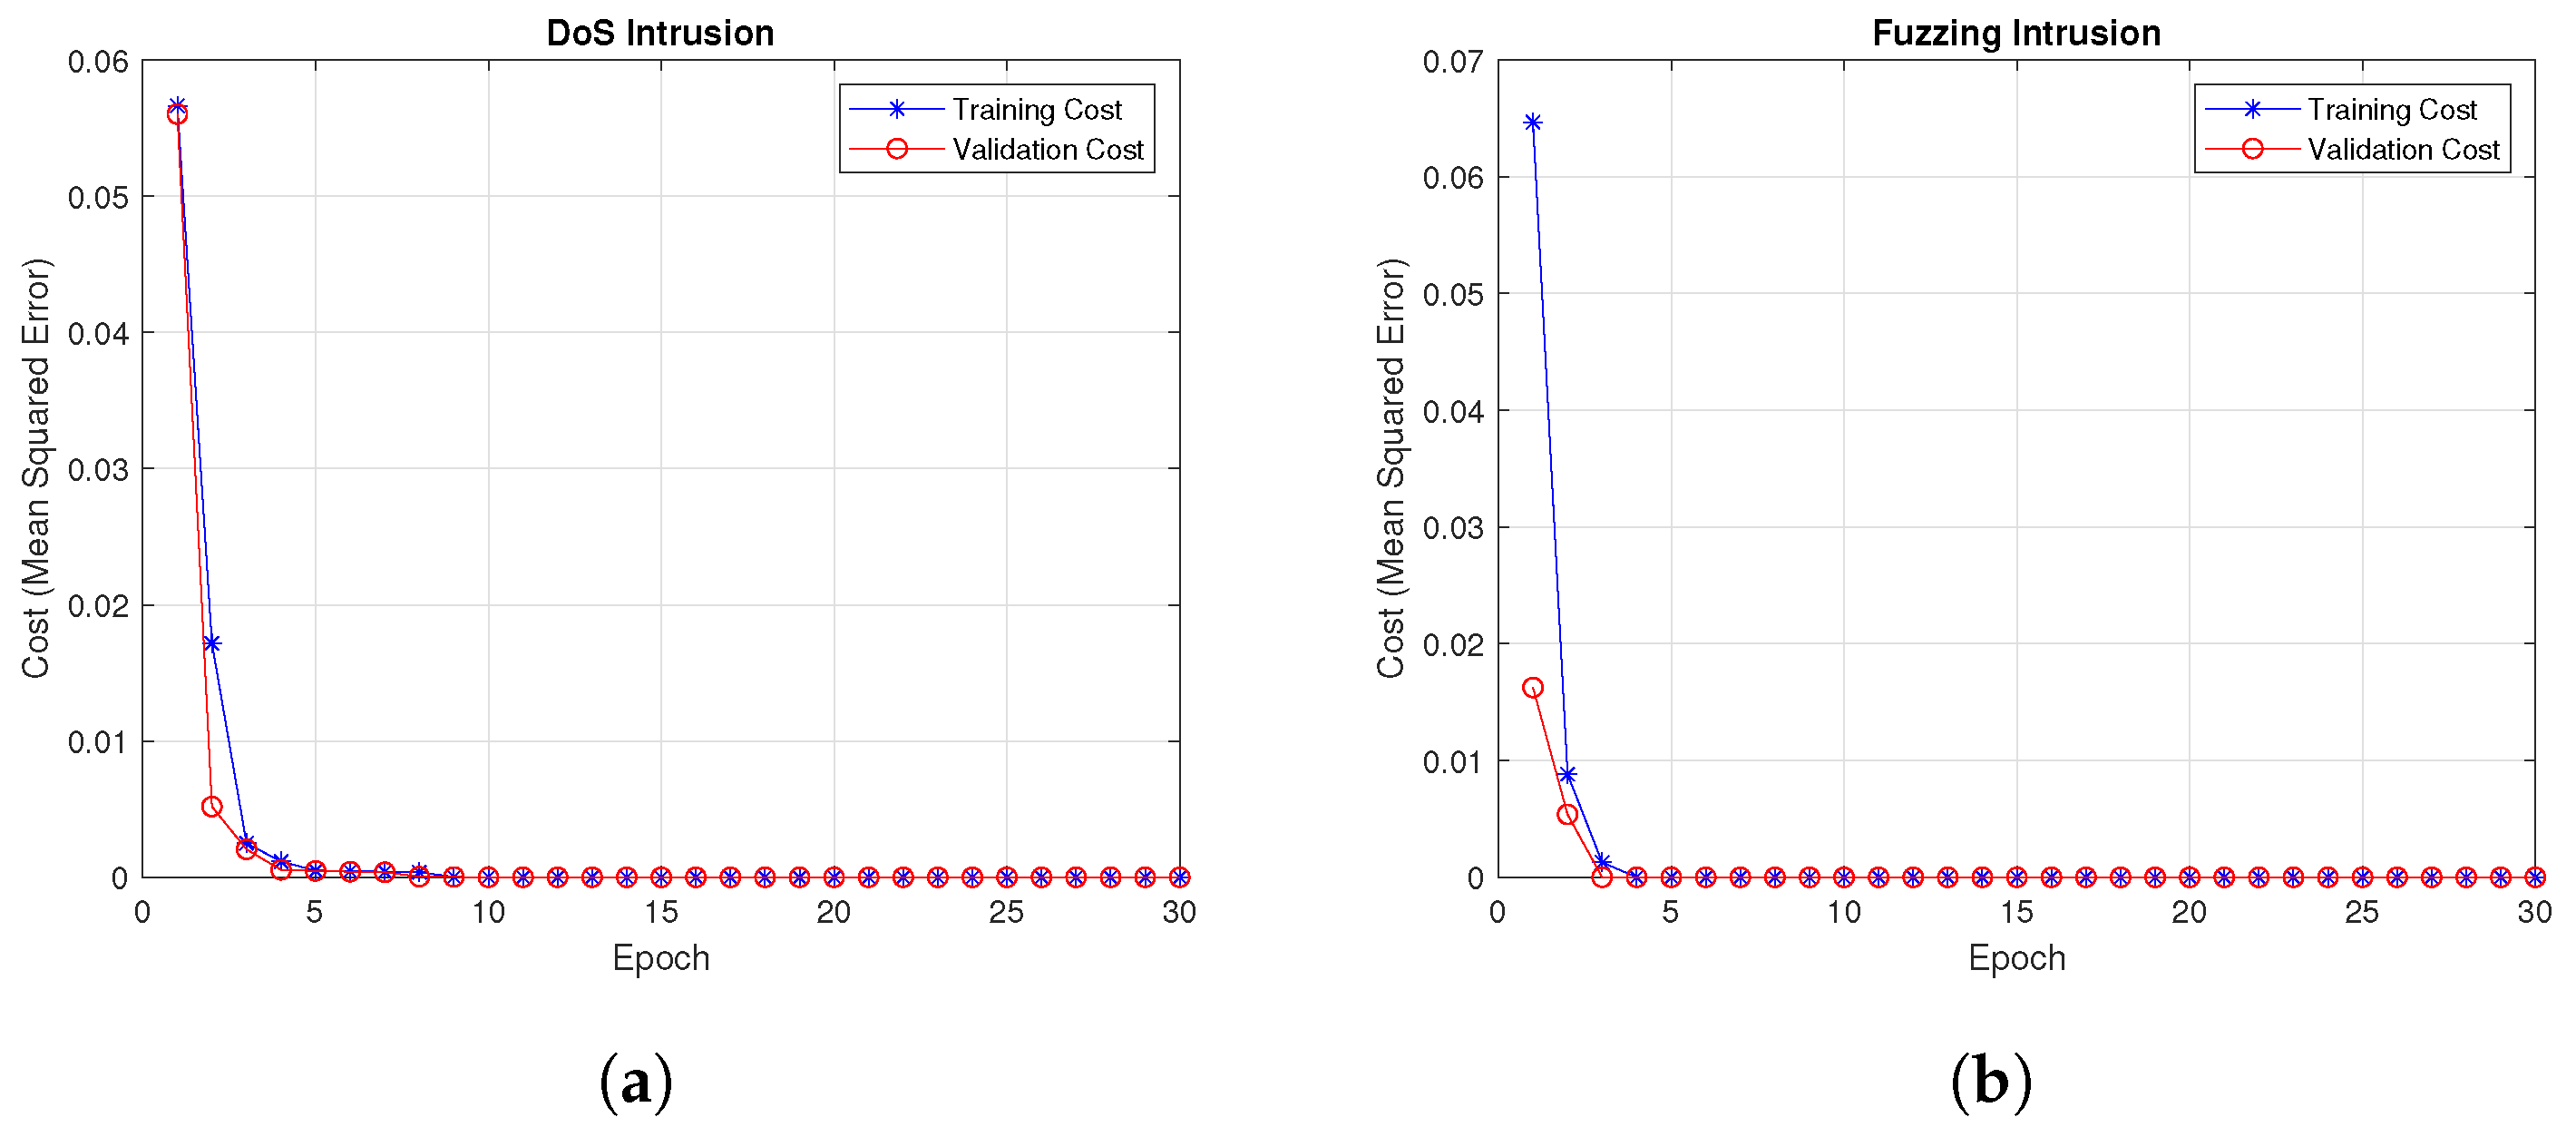
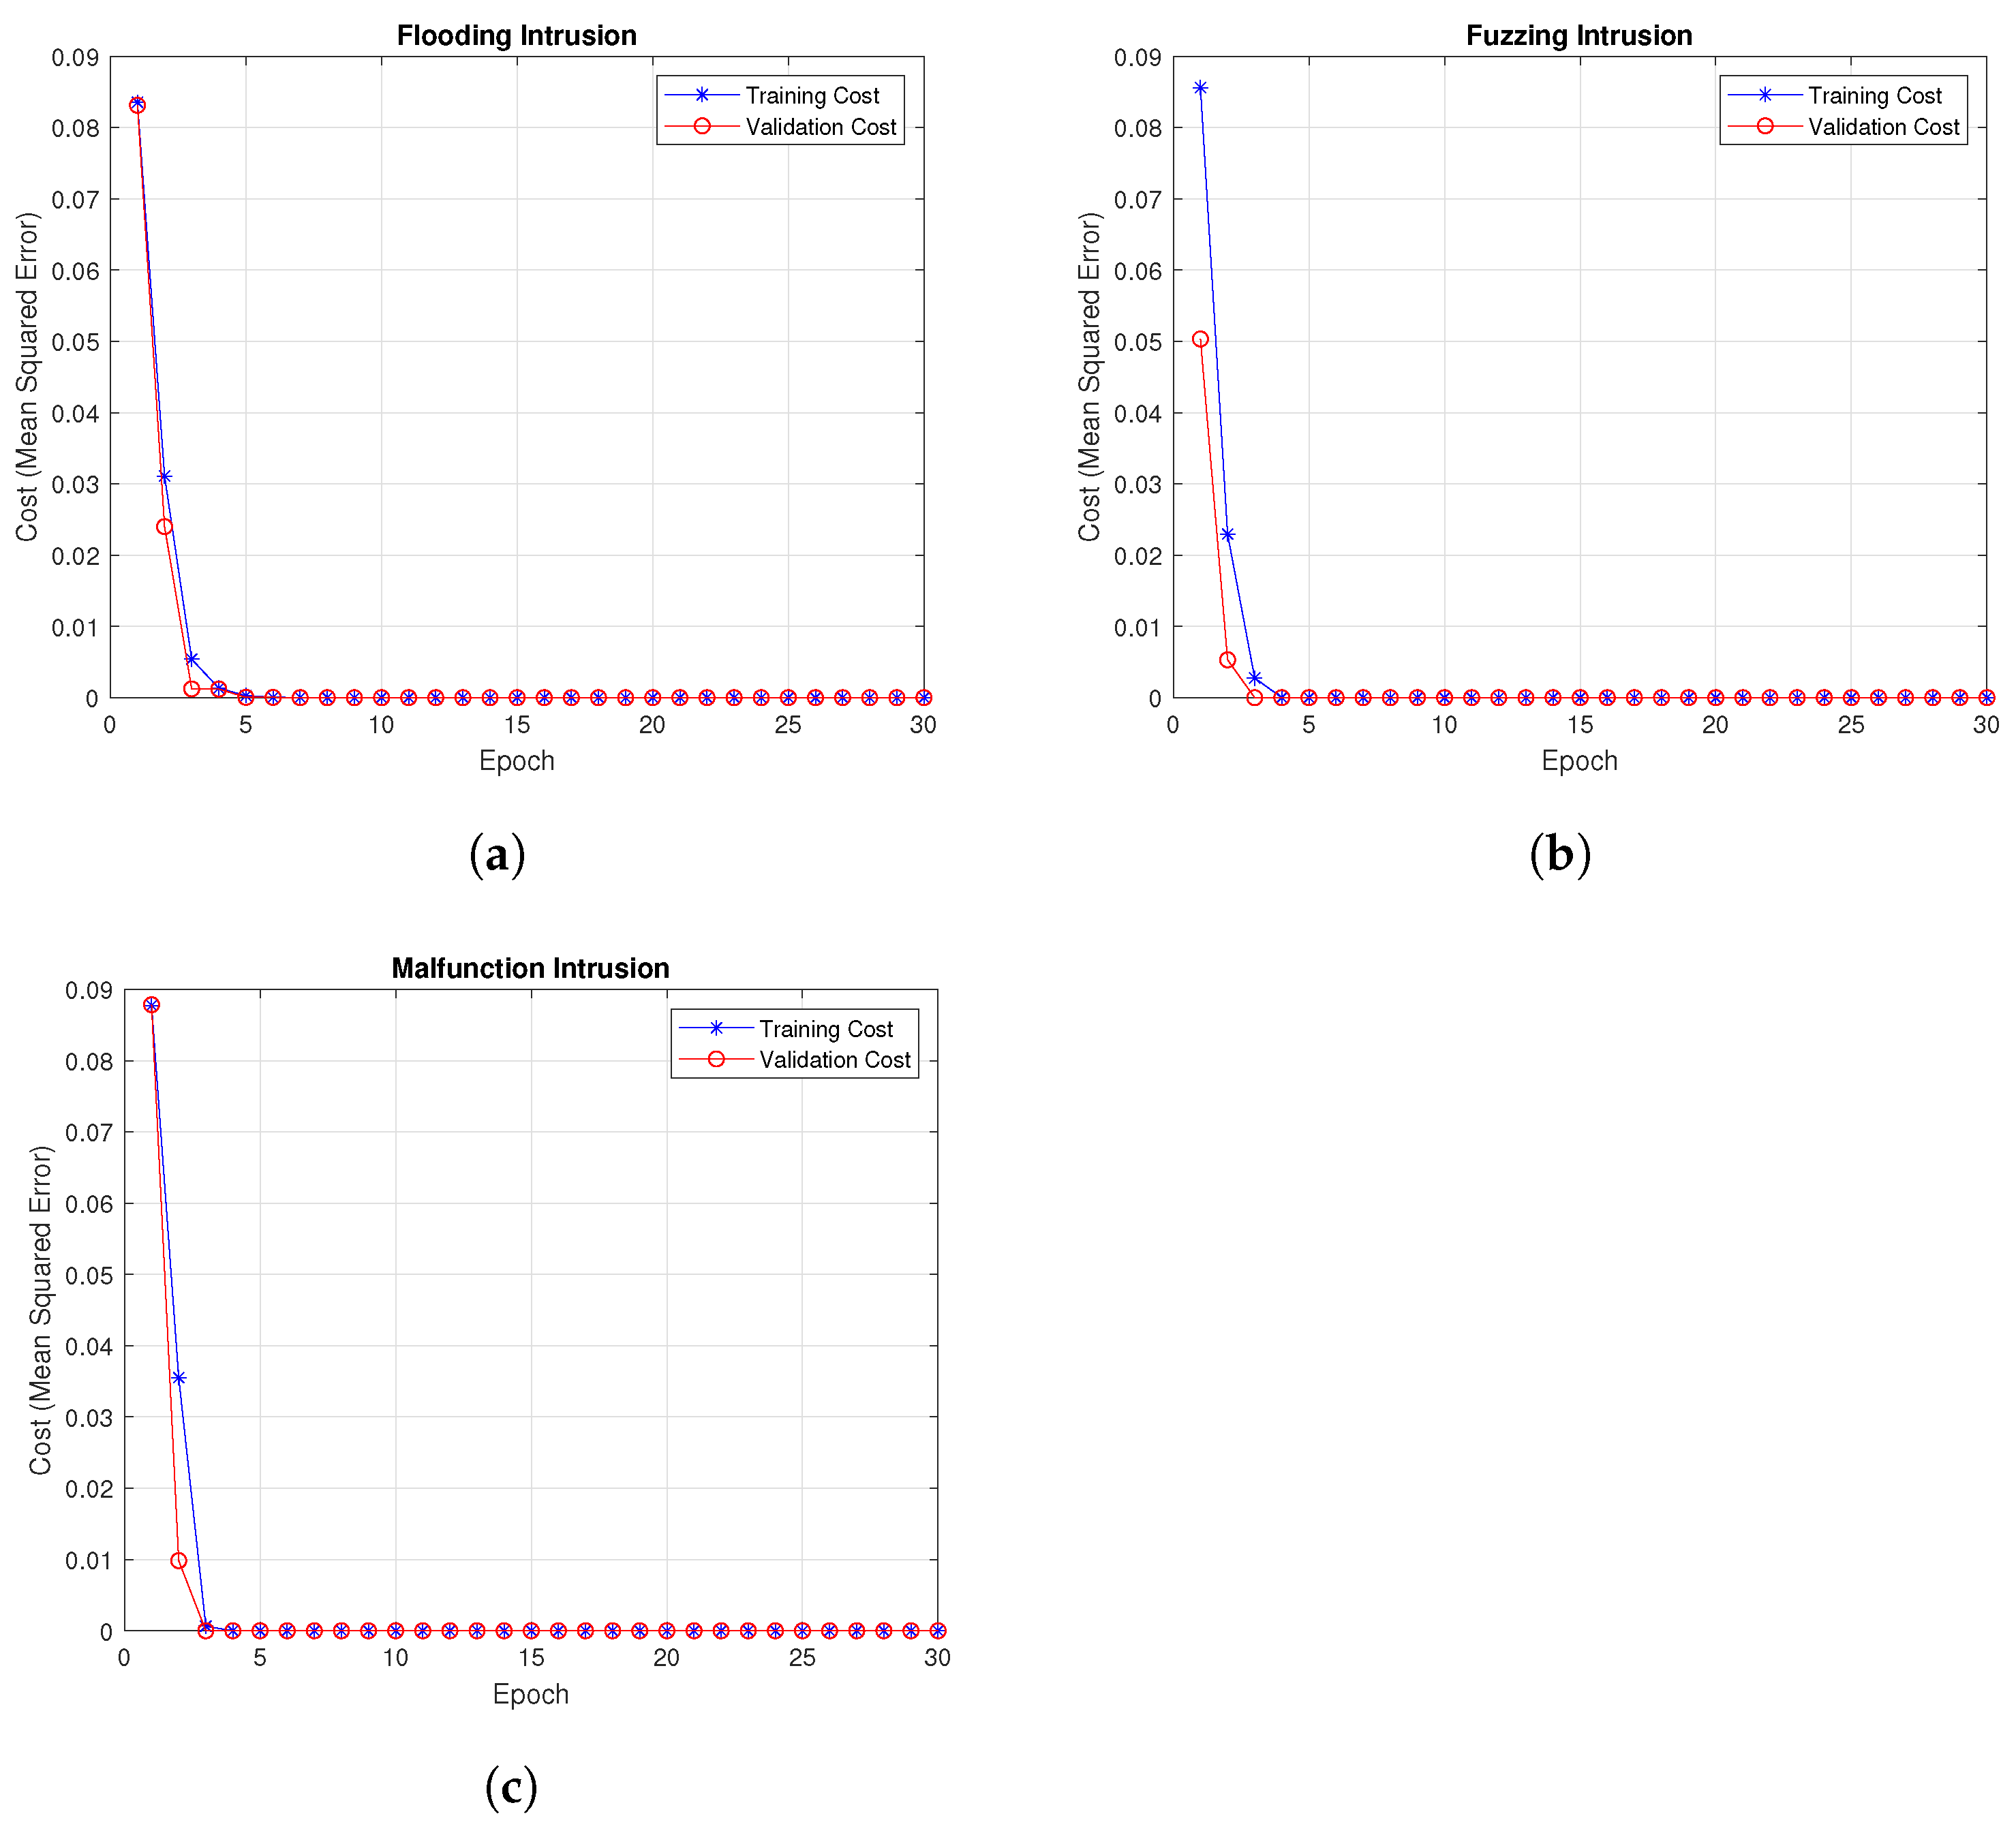
Training Cost (TC) is a measure of model’s learning explaining how well the model learns the underlying data pattern to remove noise and reconstruct the original values, while Validation Cost (VC) explains the degree of model’s generalizability describing its validation for unseen data. TC and VC are calculated using mean-squared error using training data for TC and validation data for VC. The choice of mse is linked to its built-in feature, in its effectiveness in gradient-based model optimization and data reconstruction.
Simulation curves of VC and TC for all the attack designs are given in Figure 6, Figure 7, Figure 8, Figure 9, Figure 10 and Figure 11. Figure 6 visualizes TC and VC curves for multiple anomalies in Car-Intrusion dataset (OTIDS). At the start, the TC and VC values are comparatively high. However, as the learning proceeds, the curves start converging towards zero value reflecting stability gain by the proposed model. An anlogous pattern is observed for the Car Hacking and In-vehicle Intrusion Detection datasets in Figure 7 and Figure 8, where staring values are slightly less than 0.1 for all the used cases. Furthermore, a similar pattern is evident for M-CAN, B-CAN and CAN-FD datasets in Figure 9, Figure 10 and Figure 11. However, for fuzzy intrusion, VC is slightly lower than TC at the start in all the cases. The possible reason could be the statistical variation between training and validation data. Despite this difference, the proposed model learns underlying pattern effectively, attains stabilization and converges following several epochs. As a whole, the proposed AM-DDAE model converges towards zero after few epochs are elapsed, showing comprehensible performance to attain steady convergence with no signs of overfitting.

4.3. Computational Time

Deep-denoising autoencoder models are generally considered heavyweight with high computational cost in data processing. However, employing the shallow architecture for deep-denoising autoencoders, this study proposed a lightweight AM-DDAE for intrusion mitigation and data reconstruction. The simulation results presented extra-ordinarily low inference time to retrieve normal data from anomalous data compromised by various attacks. Table 11 shows the computational time for different attack scenarios. It is discernible that the execution time in all the cases is less than a second, averaging to 0.145532 s. The possible reason for this low computational time is linked with the fact that training is performed once, and there after new incoming data is directly evaluated, and recovered if any compromised data is found. Besides execution time, Amortized time (AT) is another significant parameter to evaluate computational efficiency of a model. It measures the average computational cost per instance or task when the total cost is distributed across many instances or tasks. For smart cars, the model can be invoked repeatedly depending on varying environmental factors and driving behavior. Thus, amortized time is calculated by dividing the total computational cost by the number of estimated usage. Equation (20) is used for the calculation of AT. The corresponding results are presented in Table 11 for various estimated usages. It is discernible that the execution time reduces considerably as the frequency of usage increases reflecting the practical viability effectiveness of the proposed model in an extensive operating environment.
C o s t A M = T t o t N
where T t o t is the total execution time and N is the number of usages.
The computational platform for the development of the proposed AM-DDAE model utilized an Intel(R) Core(TM) i7-1165G7 @ 2.80 GHz CPU and 1.30 GHz GPU computational machine with 12.0 GB RAM. The proposed model was implemented completely in a custom Matlab (R2023a) code by utilizing its native control structures and matrix operations, with no use of built-in Neural Network Frameworks or Deep Learning Toolbox. All the deep learning components including forward pass, backward pass, parameter initialization and optimizer updates were performed manually. However, Statistics and Machine Learning toolbox was used for data preprocessing and numerical computation. In addition, utilizing the same machine as mentioned, Jupyter Notebook 6.4.8 was used to implement XAI techniques using Python 3.

4.4. Adaptability of the Proposed AM-DDAE Model to Unseen Attack

Analysis of the model’s adaptability to new, unseen is crucial, ensuring its long-term viability. To fulfil the purpose, the proposed AM-DDAE model is tested with new unseen data – UNSW-NB 15 dataset generated by security researchers in Cyber Range Lab of Australian Center for Cyber Security. Interestingly, the model has successfully reconstructed original data compromised by a new attack i.e., ‘Exploits’. The corresponding simulation results are highlighted in Table 12.
The proposed model yielded a trivially small percentage RE i.e., 0.3744 (less than 1%) for the unseen Exploits intrusion, which reflects a high accuracy and efficiency exhibited by the AM-DDAE model in reconstructing original data affected by new unseen attack. In addition, the proposed model is incredibly lightweight in mitigating anomalies for the new unseen attacks. While mitigating unseen Exploits attack, the model consumed 0.058369 s to denoise and regenerate the clean data.
To support efficacy of the proposed model, a comparison is conducted between seen and unseen data, as highlighted in Table 13 shows performance comparison of the proposed AM-DDAE model between seen data and unseen data. Seen data means same dataset is used for training, validation and test. Unseen means model is trained on one type of dataset and tested on another unseen dataset. The reconstruction error and execution time are compared between the two categories, as these are significantly low for unseen data same as observed in previous cases. This reveals that the proposed model behaves and performs equally well for known seen data and new unseen data, enhancing its generalizability and adaptability to new data.

4.5. Decision-Making Process of the Proposed Model Through Explainable AI

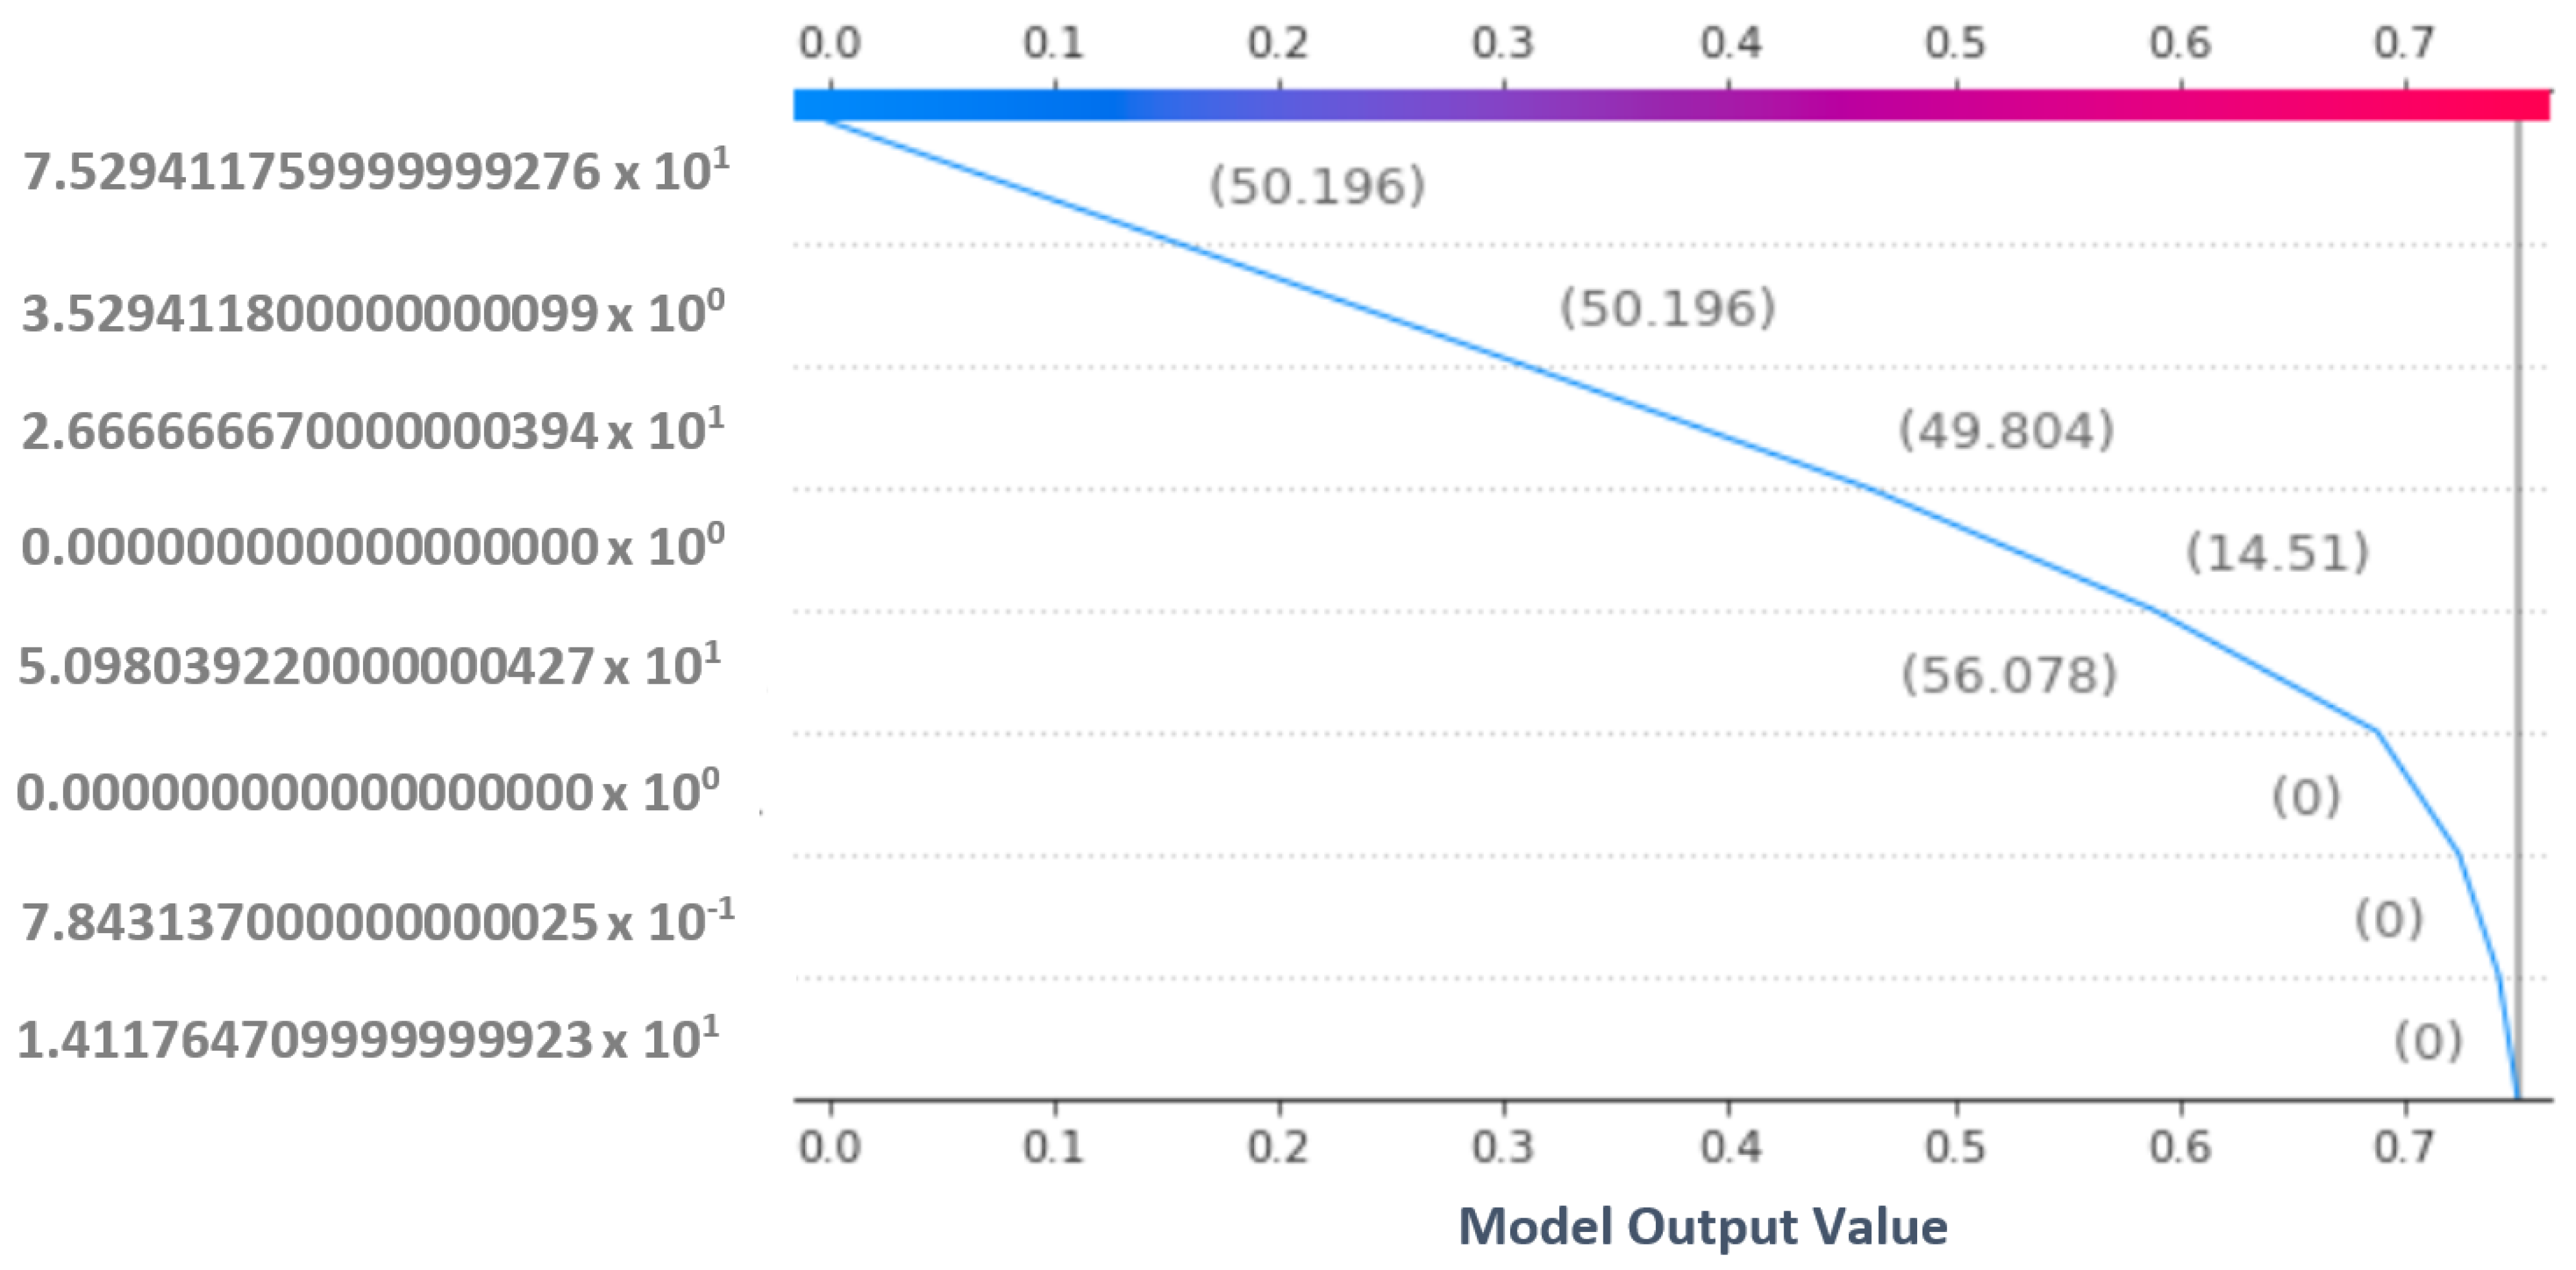
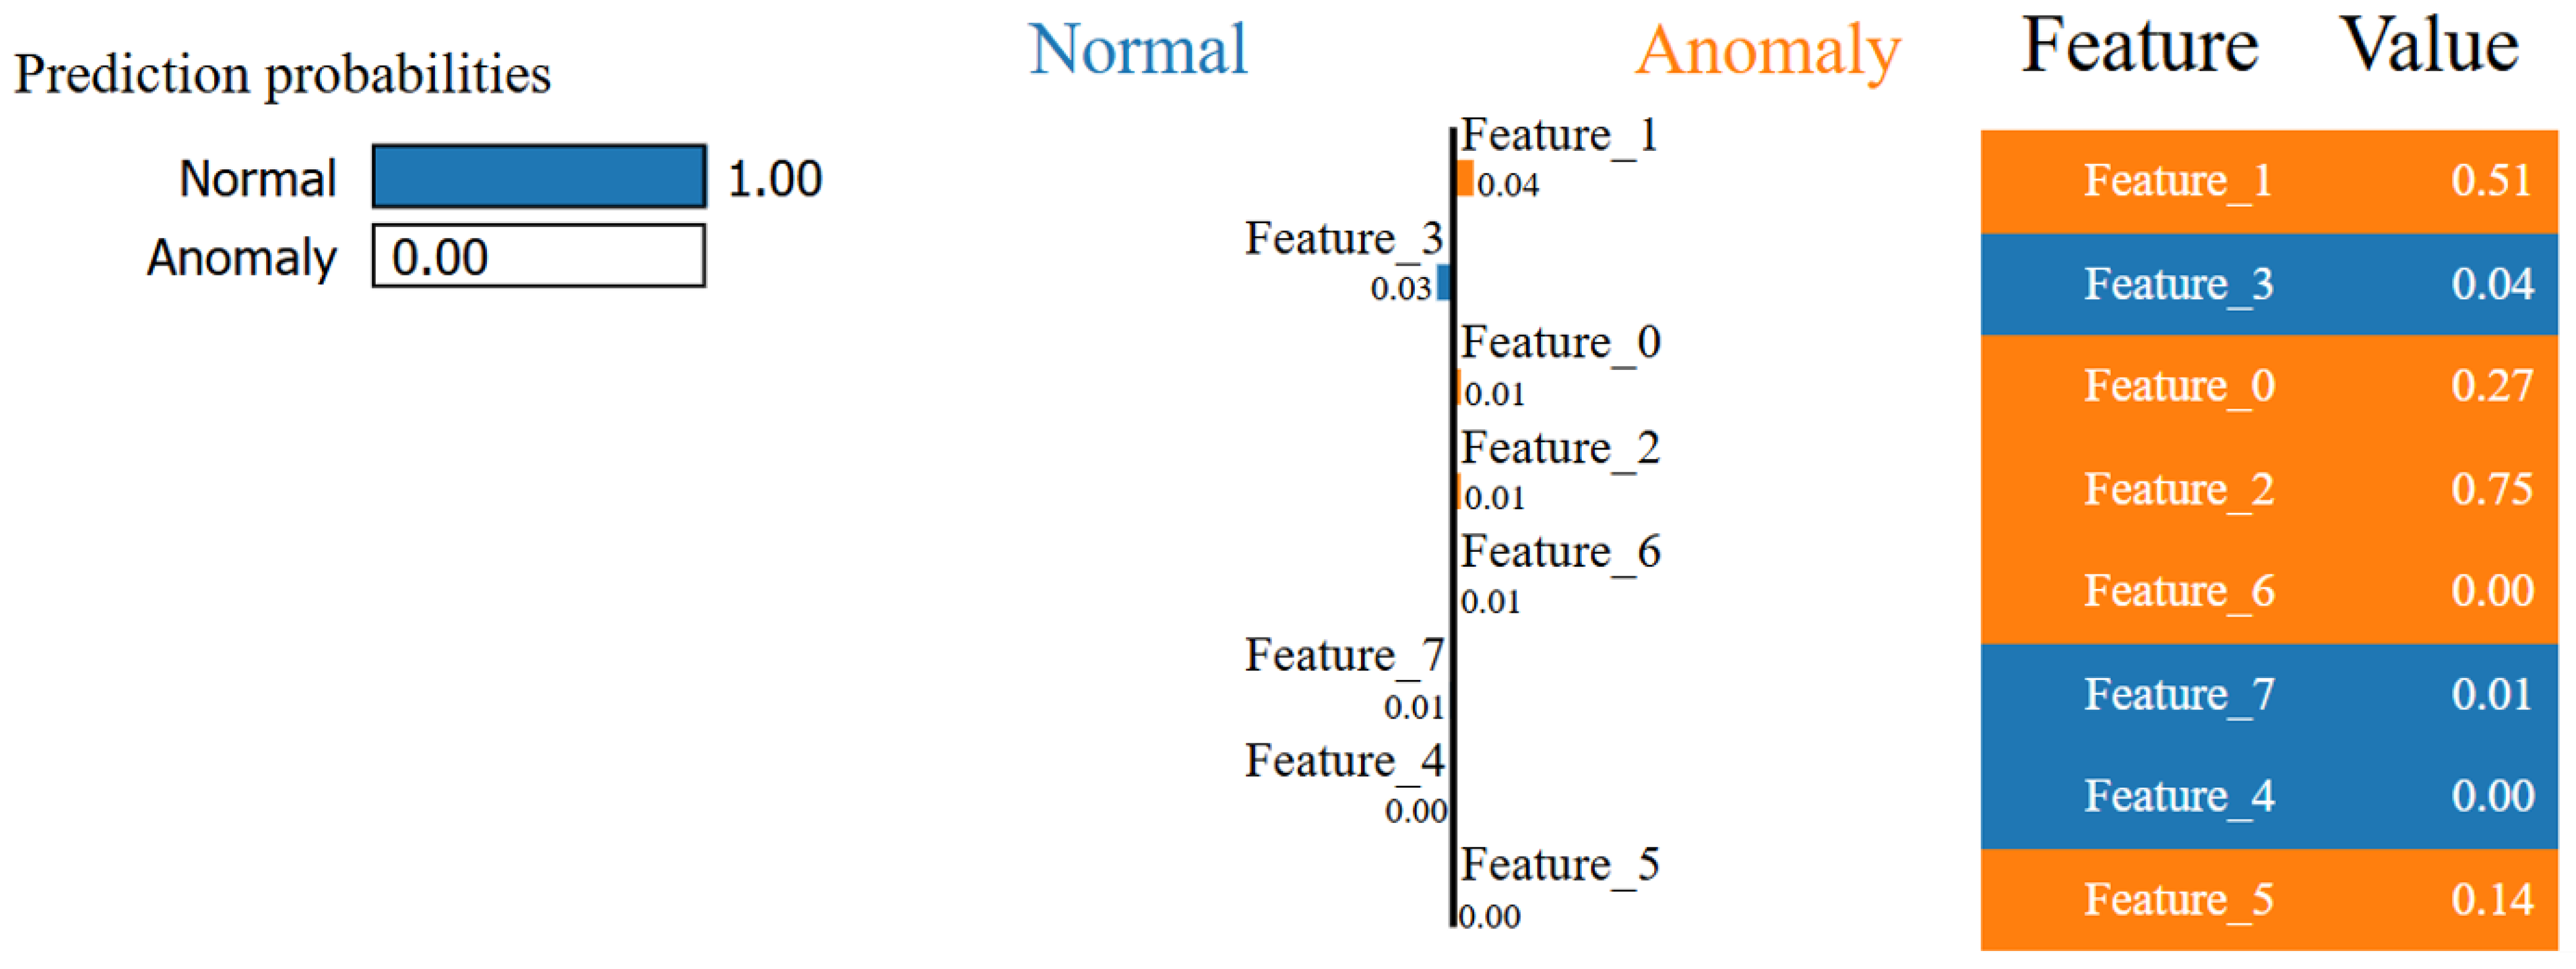
Explainable AI (XAI) are advanced techniques aiming to open the black box of AI models. They make the decision-making process of AI models more transparent and interpretable by highlighting key features and factors and identifying potential biases significant in determining the outcome of a model. Among various, Shapley Additive Explanations (SHAP) and Locally Interpretable Mode-Agnostic Explanations (LIME) are the two prominent techniques used to explain the model’s strategic evaluation. SHAP is a model-agnostic method but its Shapely values have model-specific priorities making it a model-dependent method offering both global and local explanation elucidating the role of features for all scenarios and for a specific scenario. SHAP works by assigning contribution value (CV) to each feature towards defining the final accuracy score. A high CV indicates high impact, whereas a feature with low CV highlights minimal contribution by the particular feature. LIME is a pure model-agnostic technique offering only local explanation for a specific instance. LIME assigns probability to the subject matter, coefficient value i.e., weight and normally assign colors to highlight role of each feature to differentiate between two possible outcomes of a specific instance. To build the trust of stakeholders in the proposed model, this study implements both SHAP and LIME based XAI techniques to interpret the model’s latent space and reconstruction process. Latent space is a compressed form of input data fed to the encoder, reconstruction process includes decoder which takes compressed latent data to reconstruct the original input. If the reconstructed values are close to the input, reconstruction error is low and vice versa. The simulation results for SHAP and LIME are presented in Figure 12 and Figure 13.
Figure 12 shows SHAP decision plot between model output (reconstruction error) and actual feature values. The values in parenthesis are original feature values before scaling. Starting from the left (the initial base value), the plot continuously proceeds to the right towards red, an indicator used to highlight the positively increasing contribution in generating final output. Not only this, the reconstruction error is consistently low indicating that the model is effectively capturing the underlying data pattern in its latent representation and accurately regenerating it through the decoder. This reflects the model’s strong ability to compress the data into meaningful lower-dimensional features while preserving critical information. The decoder successfully utilizes these latent features to reproduce the original input with minimal loss, demonstrating that the encoder, latent space and decoder have achieved reliable mapping that reflects good reconstruction quality.
Figure 13 presents LIME summary plot. As the input data is normalized between 0 and 1, the probability score of outcome is 0 for anomalous data and 1 for normal data. The blue bars are indicator of high negative contribution towards data reconstruction with increased RE, while orange bars are indication of features that positively contributed towards anomaly mitigation with low RE. For instance, Feature_1 and Feature_2 with values 0.51 and 0.75 reflect their high relevancy in data regeneration and intrusion mitigation, suggesting a slight deviation in their value will impact the outcome significantly. Conversely, Feature_7 and Feature_8 with 0.01 and 0.04 values are inclined towards zero, demonstrating minimal relevance in reconstruction process. Features with intermediate values though represent low impact but still influence the reconstruction process depending upon the model’s weight.
The simulation results for SHAP and LIME provide an insight into model’s latent decision-making process and reconstruction process. Majority of the bars are Orange in LIME decision plot, and for SHAP majority features are inclined towards red, an indicator that most influential features are working together to reconstruct data positively. Experts in the field can interpret which feature values initiate and trigger intrusion mitigation that ensure model alignment with anomaly patterns in the automotive controller area network. Furthermore, these explanations indicate how RE values of specific features corresponding to CV and the observed deviations in the feature values impact mitigation process. This transparency not only validates the proposed model’s reasoning, but also helps stakeholders to interpret and trust the mitigation model.
Important to note that, the CAN dataset used in this study contains 08 x Features per message which correspond to 08 x Data bytes. The HCRL does not provide the exact physical parameters represented by each feature, probably due to proprietary reasons. However, it is perceived that these features could be wheel speed, brake status, throttle position, tyre pressure, internal temperature, engine speed, or any other ECU signal. Nevertheless, these features are any ECU signal, and the proposed model has learnt the latest space effectively generating output with <1% error, despite the missing information of physical parameters.

4.6. Results and Analysis of Adversarial Machine Learning Attack

To support the effectiveness of the proposed model, a new adversarial machine learning attack is employed along with several other attack designs. The adversarial attack is perturbed by adding Gaussian noise scaled by feature range to CAN bus data. Maintaining the physical plausibility, the attack is reproducible and scalable to even larger datasets. The simulation results are presented in Table 14, manifesting that the model performed appreciably well in data reconstruction with 4.2402 × 10⁻⁵ mean RE, and 0.084789 s execution time against an emerging attack, reflecting its high applicability and adaptability for a range of sophisticated and new attacks.
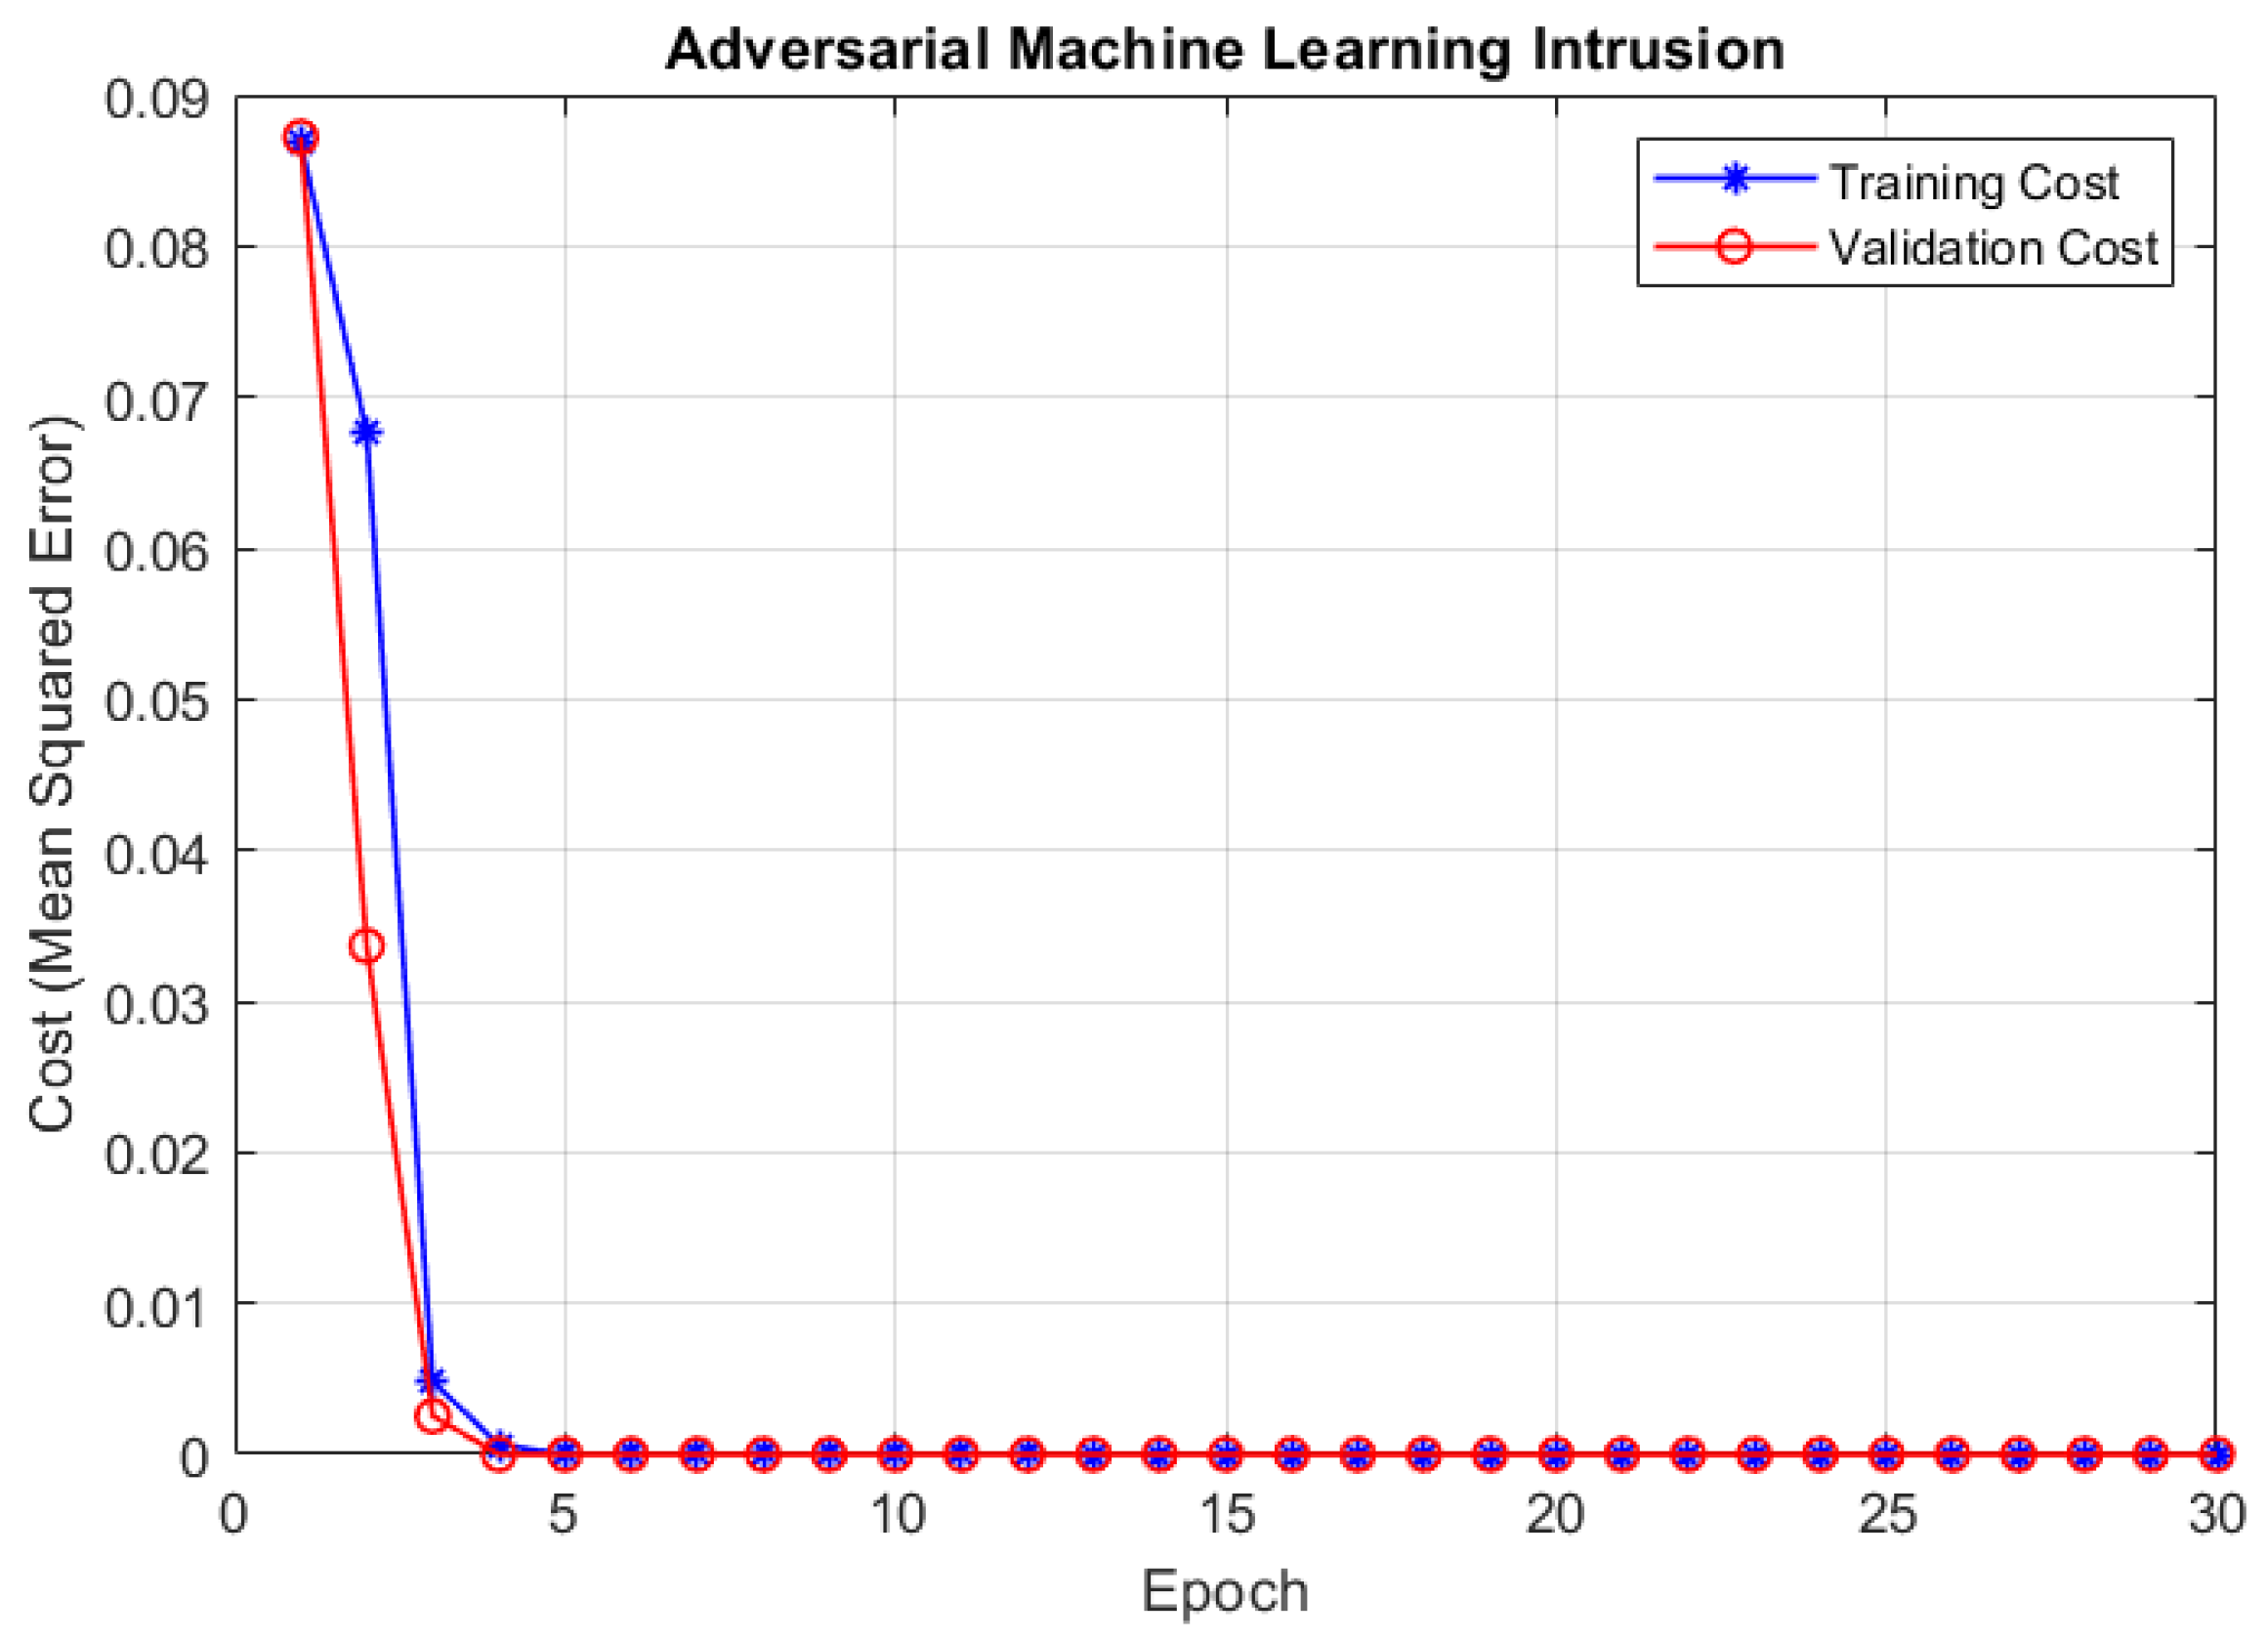
Figure 14 shows TC and VC curves for the adversarial machine learning attack. The model showed comparatively high values around 0,09 at the start, where after a sharp decline is observed as the learning progresses, highlighting the apprehensible generalization by the model, and finally converges to zero after few epochs, depicting attainment of steady state.

4.7. Comparison with Generative Adversarial Networks

A comprehensive comparison with Generative Adversarial Networks (GANs) has been conducted to further demonstrate the effectiveness of the proposed method. Both AM-DDAE and GANs models are extensively evaluated on six HCRL-generated datasets, which follow widely accepted data collection and attack simulation standards, effectively serving as a standardized benchmark for performance evaluation. Performance comparison results are highlighted in Table 15 and Table 16. It is evident from Table 15 that the mean RE by the AM-DDAE is significantly low compared to GANs where its value is approximately 99 times higher for all the used cases. The probable reason to this incredibly high difference could be the instability associated with generator and discriminator due to min-max game in GANs. Furthermore, the reliance on random latent vectors to produce outcome could be another possible reason of increased RE in GANs. Table 16 reflects execution time comparison between AM-DDAE and GANs. Similar to previous scenario, GANs consumed substantially high time, approximately 97 times, to generate output. The extended processing time is due to the fact of use of two networks (generator and discriminator) in GANs. Furthermore, adversarial evaluation – generating random samples from latent space and then feeding through discriminator – in GANs increases computational cost. In summary, the comparative analysis confirms the superior performance and robustness of the proposed approach.
In addition, Table 17, Table 18, Table 19, Table 20, Table 21 and Table 22 present simulation results of the GANs evaluated by employing the same six datasets used to test the proposed model. It is evident that despite GANs performed outstanding in all the cases with appreciable efficiency to reconstructed data. However, the reconstruction error and error ratio are low compared to the proposed model for every attack design, reflecting dominant performance of proposed AM-DDAE model over GANs.

4.8. Comparison with Existing Studies

This study proposes a novel mechanism for intrusions mitigation in controller area network in smart cars. The existing literature proposes various mitigation techniques, including isolation of compromised node from the system, blockade of data temporarily or for extended time, deflection of intruder to the decoy system, and data reconstruction. Excluding data reconstruction, all other techniques interrupt the normal functioning of smart cars over a duration, which could be damaging for commuters and other vehicles on road. To avoid interruption, the proposed mechanism based on deep-denoising autoencoder reconstructs data on real-time ensuring continuity of operations. In data reconstruction methods, percentage reconstruction error and execution time are key performance indicators for comparative analysis.
Performance comparison of various studies including details of methods and mitigation strategy is presented in Table 23. Investigating intrusion detection and mitigation for smart intersection system in in-vehicular communication, Hidalgo et al. [21] used graph neural network base multilayer perceptron technique. The study reported 0.0466 s execution time to apply mitigation strategy which includes data blockade and diversion of intruder to the decoy system. Applying the BAIT approach along with deep neural network for anomlay detection and mitigation in vehicular adhoc network, Sontakke and Chopade [20] adopted node isolation as a mitigation strategy. Working on a vehicle platoon, Khanapuri et al. [25] proposed CNN and Routh Hurwitz Criterion for selection of controller gains-based intrusion detection and mitigation technique. Like node isolation from the network, the study employed increased vehicle spacing as a mitigation strategy. In another study, Shirazi et al. [32] proposed LSTM based mitigation mechanism for controller area network in smart cars. Adopting data reconstruction as the mitigation strategy, the study reported less then 6% error between the reconsttructed value and acutal value. The proposed AM-DDAE-based intrusions mitigation mechanism used real-time data reconstruction as a mitigation technique. Comparatively, this study showed outstanding performance with less than 1% reconstruction error and execution time ranging between 0.0877 and 0.2807 s for all the used cases employed in the model development.

4.9. Impacts of the Proposed Mechanism on End-Users

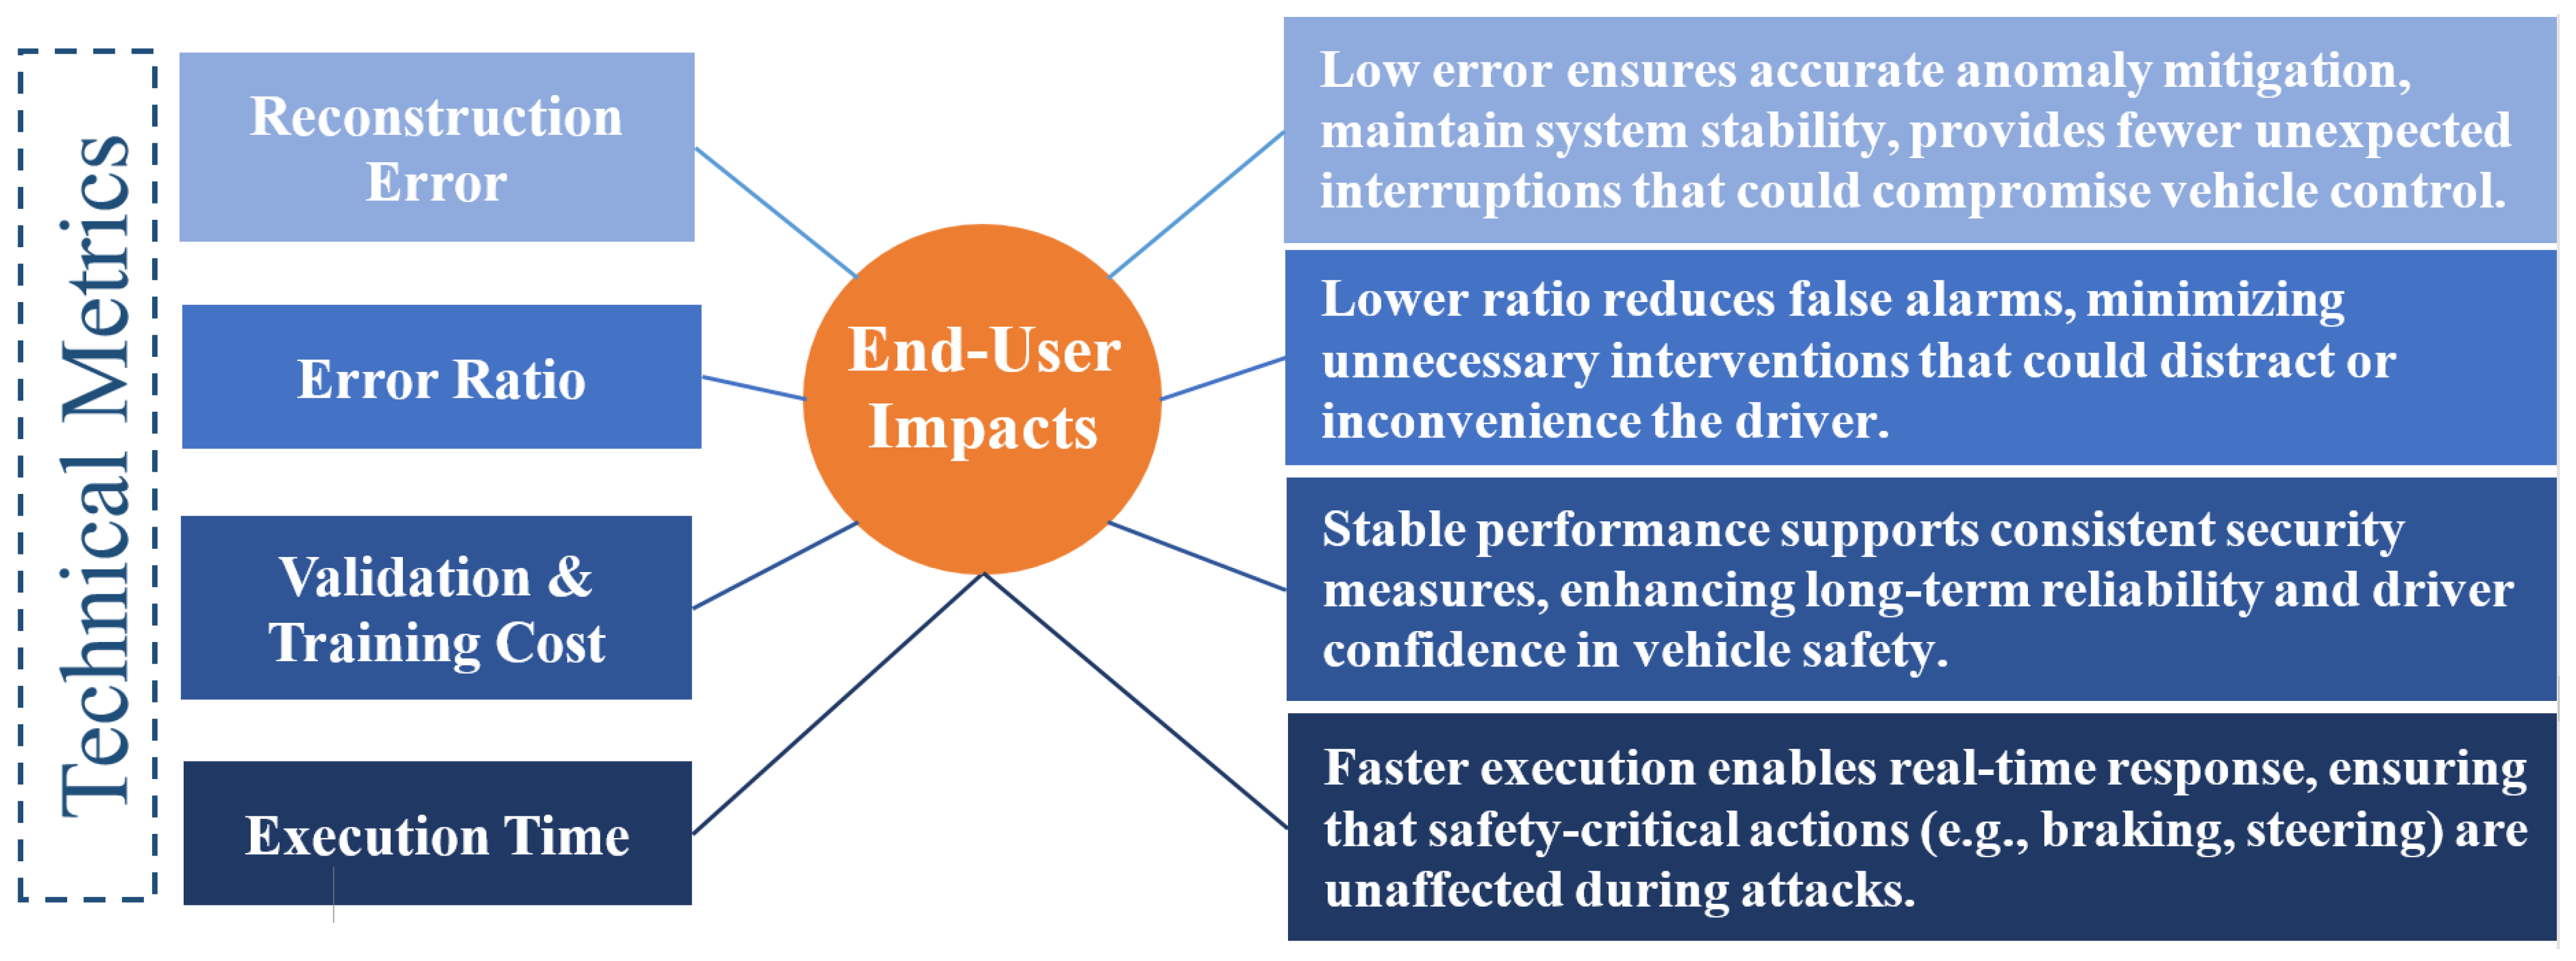
Restricted with the technical aspect of a vehicle safety, this study provides technical evaluation metrics of the proposed model for mitigating the impact of intrusions on SCs, which are quantified by measuring reconstruction error, error ratio, validation and training cost, and execution time. These metrics are direct measure of vehicle performance and safety, however, they do not directly quantify end-user impact, and related to driver trust and safety indirectly. A small RE secures system from instability and unexpected interruptions, lower ER minimizes false alarms, minimized VC and TC provide stable performance, enhancing long-term reliability, and low execution time ensure faster real-time response. Some major impacts on end-user by the proposed model are highlighted in Figure 15.

4.10. Integration of Proposed Model with Existing Security Frameworks

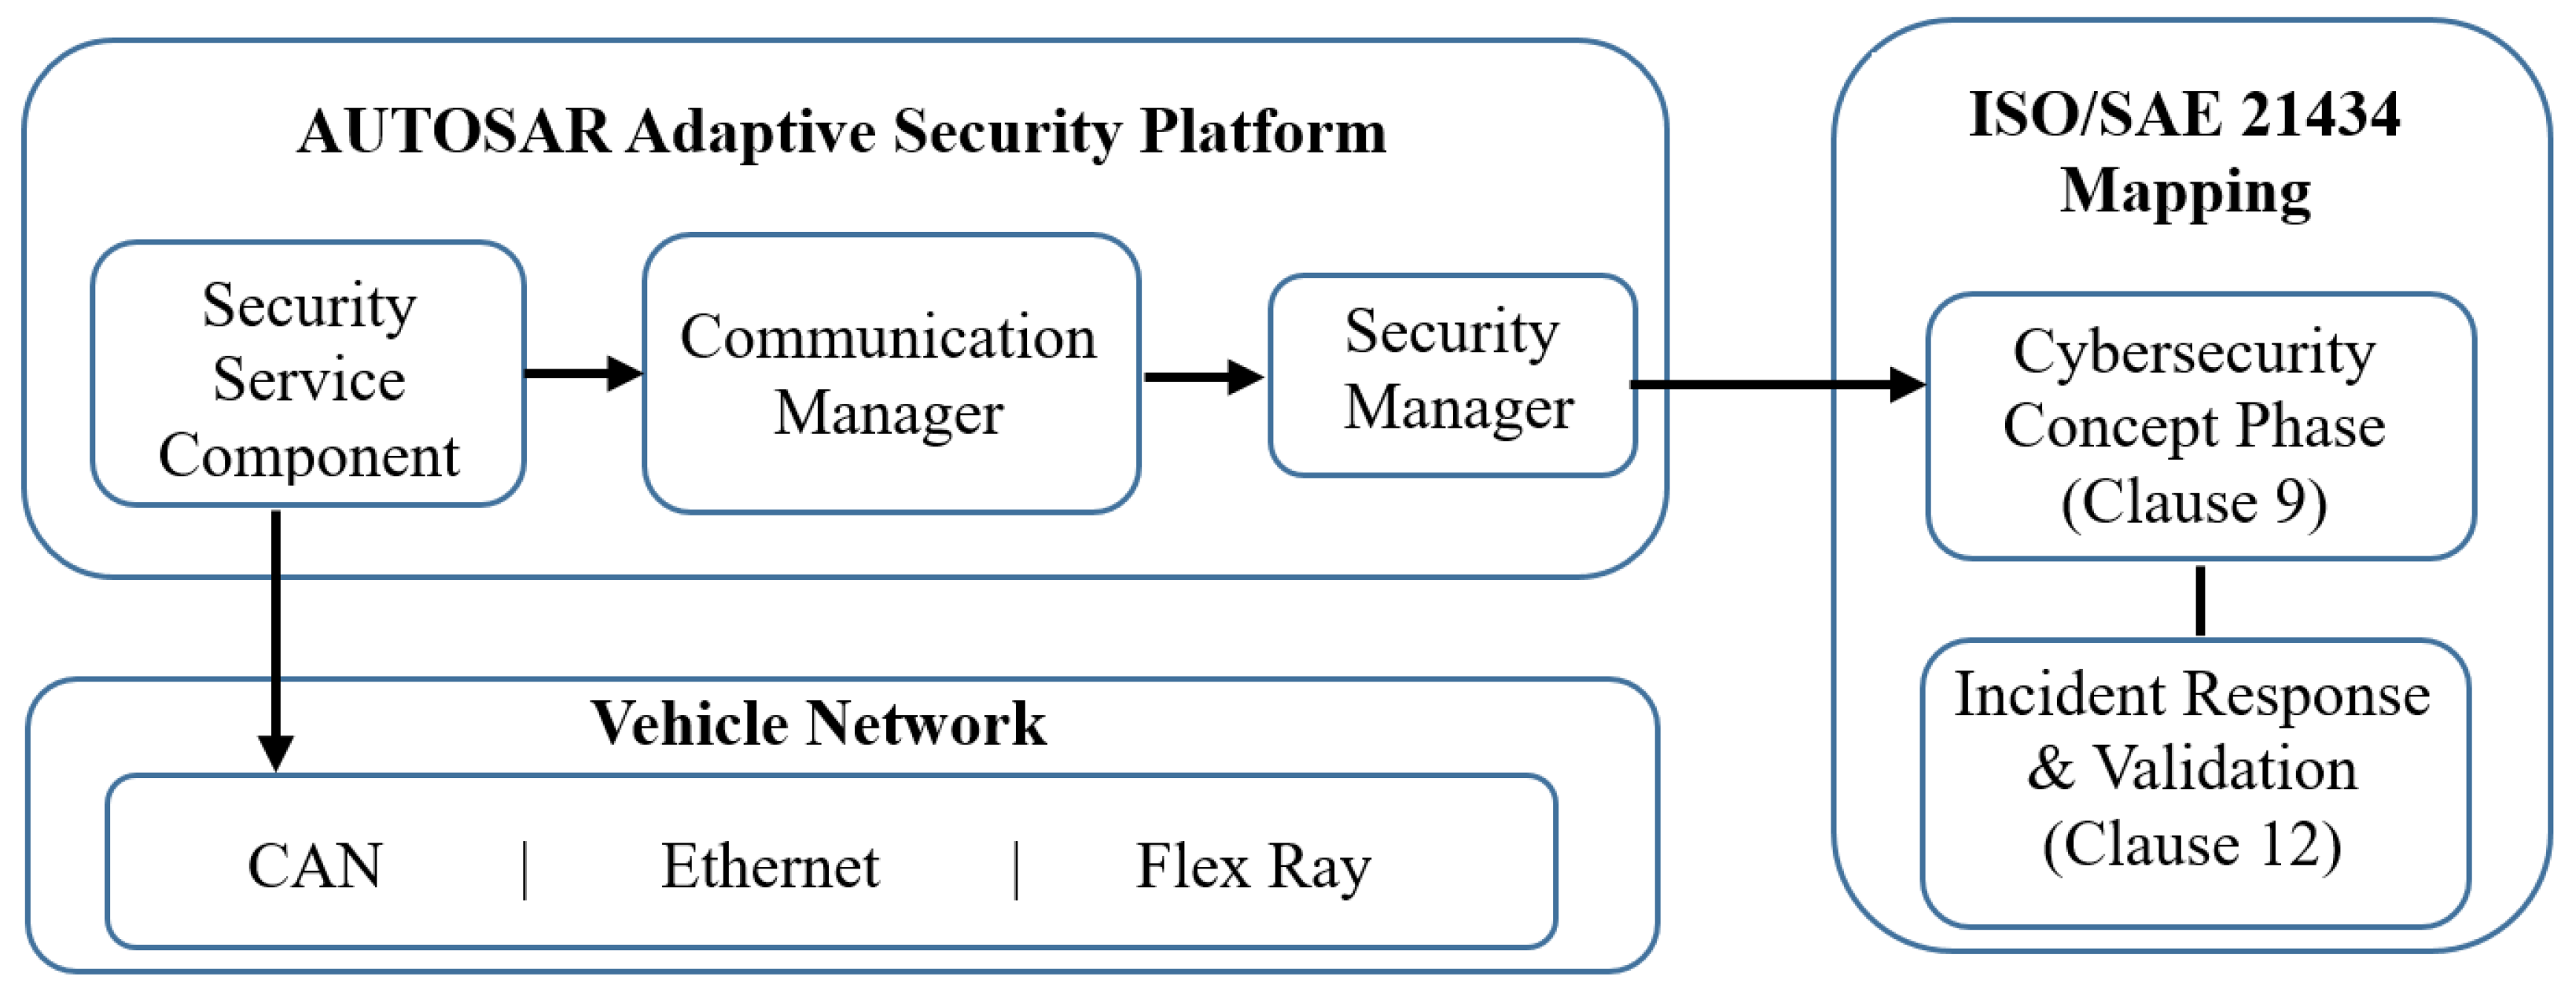
To ensure the compatibility and scalability of the proposed model with the industry standards, the proposed AM-DDAE can be embedded into the existing automotive security frameworks, such as AUTOSAR, ISO.SAE 21434 to enhance security and safety of SCs and commuters. The proposed model can be integrated with intrusion detection and mitigation layer within the AUTOSAR’s adaptive framework to function as a Security Service Component without compromising Runtime Environment specifications. Considering ISO/SAE 21434, the model can be added during Cybersecurity concept phase, in accordance with Threat Analysis and Risk Assessment findings. The mitigation logs can support cybersecurity validation and incident readiness. This modular integration of the proposed model with AUTOSAR platform linked with ISO/SAE 21434 processes is portrayed in Figure 16. This approach highlights the model compatibility, its deployment across automotive architectures, and its scalability to future standards and vehicle platform.

4.11. Advantages of the Proposed Mechanism

The proposed scheme offers several key benefits that ensure model’s effectiveness and practicality in intrusion mitigation. The proposed model is based on deep denoising autoencoder that compresses input into the latent space by capturing the effective features, thus reduces noise from the data leading to robust feature learning. It is also lightweight. Once trained, any new data are directly subjected to testing and evaluation.
Furthermore, it enables real-time response by quickly mitigating the intrusions as they are injected in the system, minimizing damage. It also reduces down-time by reconstructing compromised data in real-time, ensuring continuity of functions.
Lastly, it offers reliability and adaptability in tackling emerging attacks, while considering with the continuously evolving nature of intrusions.

4.12. Limitations and Future Scope

The proposed approach offers a novel approach for intrusions mitigation; however, it has certain limitations which opens new directions for the future work.
At first, there is limited flexibility in momentum optimization i.e., momentum adaptability is confined between 0.5–0.99 which may not be ideal for all types of data. Use of meta-learning momentum for optimal selection of momentum coefficient or a dynamic momentum based on gradient behavior during training will improve model learning.
Secondly, training proceeds for a fixed number of epochs ignoring the possible issue of overfitting during the process that may lead to potential loss in efficiency, increased computational cost and limited generalization. Incorporation of early stopping regularization technique will enhance model performance and generalization.
Furthermore, the reconstructive objective is based on a single loss metric without considering multi-objective learning. Integration of regularization loss will optimize feature learning.
Lastly, the model performs epoch-wise validation over entire validation data, overlooking detailed learning patterns. Using mini batches for validation will provide faster feedback allowing optimized dynamic adjustments of parameters, enhancing overall model performance.

5. Conclusions

The integration of digital advancement into the conventional transport network has shifted the paradigm from traditional cars to futuristic smart cars. These intelligent cars are equipped with sophisticated electronics, computing, and control to offer luxury and intelligent features like keyless entry, anti-lock braking, fuel injection control, advanced driver assistance system, and others. The in-vehicular communication is established through different networks primarily using the CAN-bus network for data transfer among different ECUs. However, because of the delineating nature of data encryption and authentication, CAN-bus data is highly prone to cyber intrusions. To secure promised CAN-bus data, this study proposed the adaptive momentum-based deep-denoising autoencoder for intrusion mitigation and attack-free data reconstruction. The proposed model was tested using real-time CAN-bus data from different car models. The model achieved remarkably high performance with less than 1 % reconstruction error when tested on both benchmark datasets with known attacks, and on new unseen attack. Comparative analysis highlighted the proposed model’s superiority over GANs in intrusion mitigation. The outstanding model performance is the result of the use of an adaptive momentum strategy which enabled the model to adjust and update the weights in each succeeding layer following the change in validation cost for model training. The state-of-the-art model’s performance verified by utilizing multiple attack designs introduced on real-time data from different smart cars, signifies its generalization and applicability to new unseen attacks for any new car model.

Author Contributions

Conceptualization, Z.A.K. and S.A.; methodology, S.A., Z.A.K. and A.K.; software, A.K.; validation, S.A. and A.K.; formal analysis, Z.A.K., S.A. and A.K.; investigation, A.K.; resources, Z.A.K. and S.A.; data curation, A.K.; writing—original draft preparation, A.K., S.A. and Z.A.K.; writing—review and editing, A.K., S.A. and Z.A.K.; visualization, A.K.; supervision, Z.A.K. and S.A.; funding, A.K. All authors have read and agreed to the published version of the manuscript.

Funding

This research received no external funding.

Data Availability Statement

The data presented in this study are openly available in Hacking and CounterMeasure Research Lab, South Korea at https://ocslab.hksecurity.net/Datasets.

Conflicts of Interest

The authors declare no conflicts of interest.

Abbreviations

The following abbreviations are used in this manuscript:
AMAdaptive MomentumAIArtificial Intelligence
APAccess PointAPIApplication Programming Interface
CANController Area NetworkCNNConvolutional Neural Network
DDAEDeep Denoising AutoencoderDLDeep Learning
DoSDenial of ServiceECUsElectronic Control Units
ETIEvent-triggered IntervalFDLFederal Deep Learning
FLFederated LearningGANGenerative Adversarial Network
GPSGlobal Positioning SystemHIDHuman Interface Display
IDIdentifierIDMSIntrusion Detection and Mitigation System
IDSIntrusion Detection SystemIVNIn-Vehicular Network
JTAGJoint Test Action GroupLSTMLong-short Term Memory
MACMedia Access ControlMLMachine Learning
OBDOn-Board DiagnosticsOTAOver-the-Air
REReconstruction ErrorReLURectified Linear Unit
RNNRecurrent Neural NetworkSCsSmart Cars
SDMSelf-defence MechanismSerIoTSecure and Safe Internet of Things
SSMState-Space ModelSVMSupport Vector Machine
UIOsUnknown Input ObserversUSBUniversal Serial Bus

References

  1. Alsaade, F.W.; Al-Adhaileh, M.H. Cyber attack detection for self-driving vehicle networks using deep autoencoder algorithms. Sensors 2023, 23, 4086. [Google Scholar] [CrossRef] [PubMed]
  2. Upstream. Upstream’s 2025 Global Automotive Cybersecurity Report Executive Summary. 2025. Available online: https://upstream.auto/ty-2025-gacr-executive-summary/ (accessed on 19 August 2025).
  3. Upstream. 2025 Predictions: The Future of Automotive Cybersecurity. 2025. Available online: https://upstream.auto/ty-2025-predictions/ (accessed on 19 August 2025).
  4. SOCRadar. Major Cyber Attacks Targeting the Automotive Industry. 2024. Available online: https://socradar.io/major-cyber-attacks-targeting-the-automotive-industry/ (accessed on 10 November 2024).
  5. Ionut Arghire. 16 Car Makers and Their Vehicles Hacked via Telematics, APIs, Infrastructure. 2023. Available online: https://www.securityweek.com/16-car-makers-and-their-vehicles-hacked-telematics-apis-infrastructure/ (accessed on 6 June 2024).
  6. SLNT. Under the Hood: The Modern Reality of Car Hacking. 2024. Available online: https://slnt.com/blogs/insights/under-the-hood-the-modern-reality-of-car-hacking (accessed on 10 November 2024).
  7. Zhou, X.; Wu, Y.; Lin, J.; Xu, Y.; Woo, S. A Stacked Machine Learning-Based Intrusion Detection System for Internal and External Networks in Smart Connected Vehicles. Symmetry 2025, 17, 874. [Google Scholar] [CrossRef]
  8. Tanksale, V. Intrusion detection system for controller area network. Cybersecurity 2024, 7, 4. [Google Scholar] [CrossRef]
  9. Alfardus, A.; Rawat, D.B. Machine Learning-Based Anomaly Detection for Securing In-Vehicle Networks. Electronics 2024, 13, 1962. [Google Scholar] [CrossRef]
  10. Bari, B.S.; Yelamarthi, K.; Ghafoor, S. Intrusion detection in vehicle controller area network (can) bus using machine learning: A comparative performance study. Sensors 2023, 23, 3610. [Google Scholar] [CrossRef] [PubMed]
  11. Shahriar, M.H.; Xiao, Y.; Moriano, P.; Lou, W.; Hou, Y.T. ANShield: Deep Learning-Based Intrusion Detection Framework for Controller Area Networks at the Signal-Level. IEEE Internet Things J. 2023, 10, 22111–22127. [Google Scholar] [CrossRef]
  12. Cheng, P.; Xu, K.; Li, S.; Han, M. TCAN-IDS: Intrusion detection system for internet of vehicle using temporal convolutional attention network. Symmetry 2022, 14, 310. [Google Scholar] [CrossRef]
  13. Moulahi, T.; Zidi, S.; Alabdulatif, A.; Atiquzzaman, M. Comparative performance evaluation of intrusion detection based on machine learning in in-vehicle controller area network bus. IEEE Access 2021, 9, 99595–99605. [Google Scholar] [CrossRef]
  14. Kavousi-Fard, A.; Dabbaghjamanesh, M.; Jin, T.; Su, W.; Roustaei, M. An evolutionary deep learning-based anomaly detection model for securing vehicles. IEEE Trans. Intell. Transp. Syst. 2020, 22, 4478–4486. [Google Scholar] [CrossRef]
  15. Ahmed, N. Detection, Identification, and Mitigation of False Data Injection Attacks and Faults in Vehicle Platooning. Ph.D. Thesis, Lakehead University, Thunder Bay, ON, Canada, 2023. Available online: https://knowledgecommons.lakeheadu.ca/handle/2453/5254 (accessed on 12 December 2024).
  16. Hassan, S.M.; Mohamad, M.M.; Muchtar, F.B. Advanced intrusion detection in MANETs: A survey of machine learning and optimization techniques for mitigating black/gray hole attacks. IEEE Access 2024, 12, 150046–150090. [Google Scholar] [CrossRef]
  17. Moradi, M.; Kordestani, M.; Jalali, M.; Rezamand, M.; Mousavi, M.; Chaibakhsh, A.; Saif, M. Sensor and Decision Fusion-based Intrusion Detection and Mitigation Approach for Connected Autonomous Vehicles. IEEE Sens. J. 2024, 24, 20908–20919. [Google Scholar] [CrossRef]
  18. Samani, M.A.; Farrokhi, M. Adverse to Normal Image Reconstruction Using Inverse of StarGAN for Autonomous Vehicle Control. IEEE Access 2025, 13, 77305–77316. [Google Scholar] [CrossRef]
  19. Wang, K. Leveraging Deep Learning for Enhanced Information Security: A Comprehensive Approach to Threat Detection and Mitigation. Int. J. Adv. Comput. Sci. Appl. 2024, 15, 964. [Google Scholar] [CrossRef]
  20. Sontakke, P.V.; Chopade, N.B. Optimized Deep Neural Model-Based Intrusion Detection and Mitigation System for Vehicular Ad-Hoc Network. Cybern. Syst. 2023, 54, 985–1013. [Google Scholar] [CrossRef]
  21. Hidalgo, C.; Vaca, M.; Nowak, M.P.; Frölich, P.; Reed, M.; Al-Naday, M.; Mpatziakas, A.; Protogerou, A.; Drosou, A.; Tzovaras, D. Detection, control and mitigation system for secure vehicular communication. Veh. Commun. 2022, 34, 100425. [Google Scholar] [CrossRef]
  22. Eric Schädlich. The Most Influential Automotive Hacks. 2024. Available online: https://dissec.to/general/the-most-influential-automotive-hacks/ (accessed on 4 February 2025).
  23. Majumdar, A.R.C. 42 Luxury Cars Stolen over Four Weeks in Oakville. 2021. Available online: https://www.oakvillenews.org/local-news/42-luxury-cars-stolen-over-four-weeks-oakville-ontario-8486515 (accessed on 4 February 2025).
  24. Khanna, H.; Kumar, M.; Bhardwaj, V. An Integrated Security VANET Algorithm for Threat Mitigation and Performance Improvement Using Machine Learning. SN Comput. Sci. 2024, 5, 1089. [Google Scholar] [CrossRef]
  25. Khanapuri, E.; Chintalapati, T.; Sharma, R.; Gerdes, R. Learning based longitudinal vehicle platooning threat detection, identification and mitigation. IEEE Trans. Intell. Veh. 2021, 8, 290–300. [Google Scholar] [CrossRef]
  26. HCRL. CAN Dataset for Intrusion Detection (OTIDS). Available online: https://ocslab.hksecurity.net/Dataset/CAN-intrusion-dataset (accessed on 1 March 2024).
  27. HCRL. Car-Hacking Dataset. Available online: https://ocslab.hksecurity.net/Datasets/car-hacking-dataset (accessed on 1 March 2024).
  28. HCRL. In-Vehicle Network Intrusion Detection Challenge. Available online: https://ocslab.hksecurity.net/Datasets/datachallenge2019/car (accessed on 1 March 2024).
  29. HCRL. M-CAN Intrusion Dataset. Available online: https://ocslab.hksecurity.net/Datasets/m-can-intrusion-dataset (accessed on 1 March 2024).
  30. HCRL. B-CAN Intrusion Dataset. Available online: https://ocslab.hksecurity.net/Datasets/b-can-intrusion-dataset (accessed on 1 March 2024).
  31. HCRL. CAN-FD Intrusion Dataset. Available online: https://ocslab.hksecurity.net/Datasets/can-fd-intrusion-dataset (accessed on 1 March 2024).
  32. Shirazi, H.; Pickard, W.; Ray, I.; Wang, H. Towards resiliency of heavy vehicles through compromised sensor data reconstruction. In Proceedings of the Twelfth ACM Conference on Data and Application Security and Privacy, Baltimore, MD, USA, 24–27 April 2022; pp. 276–287. [Google Scholar]
Figure 1. A comprehensive overview of various cyber-intrusions exploiting multiple attack surfaces and vulnerabilities in smart cars over the past decade. Adapted from [22,23].
Wevj 16 00492 g001
Figure 2. Representation of automotive controller area network with key vulnerabilities.
Wevj 16 00492 g002
Figure 3. An overview of various potential attack surfaces and attack types in smart cars.
Wevj 16 00492 g003
Figure 4. Flowchart of the proposed mechanism. (a) Data Preprocessing and Model Training. (b) Validation and Final Evaluation.
Wevj 16 00492 g004
Figure 5. Architecture of the proposed methodology, highlighting the integration of adaptive momentum.
Wevj 16 00492 g005
Figure 6. Validation and training costs for (a) DoS (b) Fuzzy and (c) Impersonation intrusions in Dataset 1.
Wevj 16 00492 g006
Figure 7. Validation and training costs for (a) DoS (b) Fuzzy (c) Spoofing (Gear) and (d) Spoofing (RPM) intrusions in Dataset 2.
Wevj 16 00492 g007aWevj 16 00492 g007b
Figure 8. Validation and training costs for (a) Flooding (b) Fuzzy, (c) Malfunction and (d) Replay intrusion in Dataset 3.
Wevj 16 00492 g008
Figure 9. Validation and training costs for (a) DoS and (b) Fuzzing intrusions in Dataset 4.
Wevj 16 00492 g009
Figure 10. Validation and training costs for (a) DoS and (b) Fuzzing intrusions in Dataset 5.
Wevj 16 00492 g010
Figure 11. Validation and training costs for (a) Flooding (b) Fuzzing and (c) Malfunction intrusions in Dataset 6.
Wevj 16 00492 g011
Figure 12. SHAP decision plot to visualize the decision-making process of the proposed model.
Wevj 16 00492 g012
Figure 13. LIME local explanation plot of the proposed model.
Wevj 16 00492 g013
Figure 14. Training and Validation Costs of Adversarial Machine Learning Attack.
Wevj 16 00492 g014
Figure 15. End-User Impacts of the proposed model.
Wevj 16 00492 g015
Figure 16. Modular Integration of the proposed model with AUTOSAR adaptive platform linked to ISO/SAE 21434 processes.
Wevj 16 00492 g016
Table 1. A comprehensive summary of existing studies conducted to develop the self-defense mechanism against cyber-intrusions in smart cyber-physical systems.
ReferencePurposeStrengthsWeaknessesYearCategory
[7]Stacked Machine Learning (ML) based intrusion detection system (IDS) for automotive networks99.99 % Detection AccuracyUndefined car, Heavyweight2025Detection
[8]ML based IDS for automotive controller area network0.9968 Specificity, 0.9948 SensitivityNo description about accuracy measure and computational time2024
[9]DL based IDS for automotive networks95 % Detection AccuracyLimited to single attack type; no detail about computational time2024
[10]ML based IDS for automotive controller area network99.9% Detection accuracyHeavyweight2023
[11]DL based IDS for automotive controller area network0.952 Area under the curveNo description about computational time, undefined car2023
[12]ML based IDS for automotive controller area network0.9998 F1-scoreHeavyweight2022
[13]ML based IDS for automotive controller area network98.5269 % Detection accuracyHeavyweight2021
[14]GAN based IDS for automotive controller area network96.84 % Hit rateUndefined car, limited to single attack type; no detail about computational time2020
[18]starGAN based image reconstruction for autonomous vehcile control22.21 PSNR, 0.92 SSIMHeavyweight, limited object detection2025Mitigation
[19]DL based intrusion mitigation for information security in cyberspace95.4 % Detection accuracy; Compromised data blockade, Affected node isolationNo real-time data reconstruction2024
[20]DL based IDMS for vehicular ad hoc networks100 % True detection rate; Affected node isolationNo real-time data reconstruction2023
[21]SerIoT system for vehicular communication networksCompromised data blockade, Deflection to decoy systemNo real-time data reconstruction2022
[25]DL based IDMS for vehicle platoons96.3 % Detection accuracy, Gap Widening between vehicles for mitigationNo real-time data reconstruction2021
Acronyms are defined in “Abbreviations” section.
Table 2. A comprehensive summary of six different datasets employed in this work. (Labels: 1 for attack, 0 for normal).
DatasetAttack TypeAttack Injection
Rate (pps)
Volume (Number of Samples)TargetsSample Rate
(Samples/s)
AttackNormal
1DoS-2,244,0412,369,868CAN bus traffic-
Fuzzy-
Impersonation-
2DoS3333.32,331,51715,226,830ECUs, Gear, RPM Gauge
Fuzzy2000.02563.28
Spoofing (Gear)1000.0-
Spoofing (RPM)1000.01922.46
3Flooding-1,253,5088,114,265ECUs, random and specific CAN IDs-
Fuzzy-
Malfunction-
Replay-
4DoS4000.0500,0002,452,620Multimedia communication devices13,667.88
Fuzzing10,000.0
5DoS4000.0500,0007,530,786Low-speed communication devices5576.93
Fuzzing10,000.0
6Flooding10,000.01,630,4735,490,129CAN bus1977.945
Fuzzing5000.0
Malfunction1000.0
Table 3. Simulation parameters for the proposed AM-DDAE mechanism.
Parameters                                         Values               
Total samples per dataset500,000
Training Samples per dataset325,000
Test Samples per dataset175,000
Hidden Layers3
Total Neurons in Hidden Layers104
Latent Space size8
Loss Functionmse
Activation Function Input/Outputrelu
Initial Momentum0.89
Initial Learning Rate0.01
Number of Epochs30
Table 4. A representation of the retrieved data for the best and worst cases from Dataset 1, including various attack designs.
DoS Intrusion
Optimal Reconstructed Data
Original Value0.75294110.76078430.76470580.74901960.7568627
Reconstructed Value0.75294120.76078440.76470610.74901920.7568622
Reconstruction Error6.53 × 10−88.48 × 10−82.69 × 10−73.86 × 10−74.64 × 10−7
Error Ratio8.67 × 10−81.12 × 10−73.52 × 10−75.15 × 10−76.14 × 10−7
Poor Reconstructed Data
Original Value0.27058820.30980390.27843130.27450980.8470588
Reconstructed Value0.26526170.30445190.27304920.26909890.8386531
Reconstruction Error5.32 × 10−35.35 × 10−35.38 × 10−35.41 × 10−38.41 × 10−3
Error Ratio0.0196850.0172750.019330.0197110.0099234
Reconstruction Error ( μ ± σ ) = (1.3695± 1.7307) × 10−4
Fuzzy Intrusion
Optimal Reconstructed Data
Original Value0.84705880.84705880.67843130.96862740.5647058
Reconstructed Value0.84705880.80784310.67843140.96862750.5647059
Reconstruction Error4.23 × 10−91.34 × 10−82.54 × 10−83.20 × 10−83.43 × 10−8
Error Ratio4.99 × 10−91.65 × 10−83.74 × 10−83.31 × 10−86.08 × 10−8
Poor Reconstructed Data
Original Value0.02745090.92941170.02745090.98431370.0549019
Reconstructed Value0.03380430.92281750.03428770.97520790.0646703
Reconstruction Error6.35 × 10−36.59 × 10−36.83 × 10−39.10 × 10−39.76 × 10−3
Error Ratio0.231440.00709510.249050.00925090.17792
Reconstruction Error ( μ ± σ ) = (1.0999 ± 0.6405) × 10−4
Impersonation Intrusion
Optimal Reconstructed Data
Original Value0.05098030.04313720.85490190.06274500.0078431
Reconstructed Value0.05098030.04313730.85490180.06274520.0078429
Reconstructed Error4.63 × 10−86.80 × 10−81.38 × 10−71.48 × 10−71.82 × 10−7
Error Ratio9.08 × 10−71.57 × 10−61.62 × 10−72.36 × 10−62.32 × 10−5
Poor Reconstructed Data
Original Value0.98823520.98431370.92941170.99607840.9921568
Reconstructed Value0.98374100.98978510.93523170.97856700.9713379
Reconstruction Error4.49 × 10−35.47 × 10−35.82 × 10−31.75 × 10−22.08 × 10−2
Error Ratio0.00454780.00555870.0062620.017580.020983
Reconstruction Error ( μ ± σ ) = (1.4127 ± 1.9858) × 10−4
Table 5. A representation of the retrieved data for the best and worst cases from Dataset 2, including various attack designs.
DoS Intrusion
Optimal Reconstructed Data
Original Value0.09019600.96862740.07058820.98431370.9686274
Reconstructed Value0.09019610.96862730.07058850.98431340.9686271
Reconstruction Error1.0 × 10−71.40 × 10−72.65 × 10−72.65 × 10−72.82 × 10−7
Error Ratio1.11 × 10−61.44 × 10−73.75 × 10−62.69 × 10−72.91 × 10−6
Poor Reconstructed Data
Original Value0.06274500.08627450.09411760.10588230.0823529
Reconstructed Value0.07797330.10169760.11067520.12287660.1009537
Reconstruction Error0.0152280.0154230.0165580.0169940.018601
Error Ratio0.24270.178770.175920.16050.22587
Reconstruction Error ( μ ± σ ) = (2.5156 ± 5.1545) × 10−4
Fuzzy Intrusion
Optimal Reconstructed Data
Original Value0.09411760.13333330.58823520.98039210.9490196
Reconstructed Value0.09411760.13333330.58823520.98039210.9490196
Reconstruction Error3.94 × 10−115.34 × 10−111.07 × 10−101.40 × 10−101.88 × 10−10
Error Ratio4.18 × 10−104.0 × 10−101.83 × 10−101.43 × 10−101.98 × 10−10
Poor Reconstructed Data
Original Value0.15294110.03921560.02745090.07450980.0470588
Reconstructed Value0.15560890.04334650.03279770.08290020.0592805
Reconstruction Error0.00266780.00413090.00534680.00839040.012222
Error Ratio0.0174430.105340.194780.112610.25971
Reconstruction Error ( μ ± σ ) = 3.9921 × 10−6 ± 4.0126 × 10−5
Spoofing (Gear) Intrusion
Optimal Reconstructed Data
Original Value0.06274500.03529410.12549010.05490190.0274509
Reconstructed Value0.06274500.03529410.12549020.05490210.0274511
Reconstruction Error1.34 × 10−102.48 × 10−87.49 × 10−81.50 × 10−71.67 × 10−7
Error Ratio2.14 × 10−97.03 × 10−75.97 × 10−72.74 × 10−66.11 × 10−6
Poor Reconstructed Data
Original Value0.99215680.99607840.89803920.96470580.9686274
Reconstructed Value0.99770371.00176040.90373460.97071190.9600952
Reconstruction Error0.00554690.0056820.00569540.00600610.0085322
Error Ratio0.00559070.00570440.0063420.00622580.0088085
Reconstruction Error ( μ ± σ ) = (1.6033 ± 1.4613) × 10−4
Spoofing (RPM) Intrusion
Optimal Reconstructed Data
Original Value0.04313720.03529410.12549010.09803920.0745098
Reconstructed Value0.04313730.03529410.12549020.09803920.0745097
Reconstruction Error4.84 × 10−85.20 × 10−85.45 × 10−86.95 × 10−87.67 × 10−8
Error Ratio1.12 × 10−61.47 × 10−64.34 × 10−77.09 × 10−71.03 × 10−6
Poor Reconstructed Data
Original Value0.07058820.94901960.98431370.93333331.0
Reconstructed Value0.06637710.94469700.97938250.93333330.9946695
Reconstruction Error0.00421110.00432250.00493120.00519850.0053304
Error Ratio0.0596570.00455470.00500980.00556980.0053304
Reconstruction Error ( μ ± σ ) = (1.0828 ± 1.3339) × 10−4
Table 6. A representation of the retrieved data for the best and worst cases from Dataset 3, including various attack designs.
Flooding Intrusion
Optimal Reconstructed Data
Original Value0.95294110.95686270.92941170.84705880.9411764
Reconstructed Value0.95294110.95686270.92941170.84705880.9411764
Reconstruction Error1.6 × 10−121.9 × 10−122.0 × 10−126.2 × 10−128.7 × 10−12
Error Ratio1.7 × 10−122.0 × 10−122.1 × 10−127.3 × 10−129.2 × 10−12
Poor Reconstructed Data
Original Value0.96862740.01960780.00392150.02352940.9960784
Reconstructed Value0.96862360.01961200.00393400.02359140.9944053
Reconstruction Error3.78 × 10−64.17 × 10−61.25 × 10−56.20 × 10−51.67 × 10−3
Error Ratio3.91 × 10−60.000212850.00319250.00263760.0016797
Reconstruction Error ( μ ± σ ) = 2.871 × 10−7 ± 1.2391 × 10−5
Fuzzy Intrusion
Optimal Reconstructed Data
Original Value0.60784310.84705880.69019600.62745090.8666666
Reconstructed Value0.60784310.84705880.69019600.62745090.8666666
Reconstruction Error1.0 × 10−112.2 × 10−113.4 × 10−116.0 × 10−116.4 × 10−11
Error Ratio1.7 × 10−112.6 × 10−114.9 × 10−119.6 × 10−117.3 × 10−11
Poor Reconstructed Data
Original Value0.02352940.12549010.07843130.01176470.0235294
Reconstructed Value0.01791770.13135830.08643770.02119430.0363473
Reconstruction Error0.0128180.00942970.00800640.00586810.0056116
Error Ratio0.544760.801520.102080.0467620.23849
Reconstruction Error ( μ ± σ ) = 1.1844 × 10−6 ± 9.7876 × 10−5
Malfunction Intrusion
Optimal Reconstructed Data
Original Value0.92156860.87058820.32941170.76470580.3764705
Reconstructed Value0.92156860.87058820.32941170.76470580.3764705
Reconstruction Error1.9 × 10−111.1 × 10−101.9 × 10−112.1 × 10−102.2 × 10−10
Error Ratio2.1 × 10−111.3 × 10−105.9 × 10−112.8 × 10−105.8 × 10−11
Poor Reconstructed Data
Original Value0.99215680.13333330.84705880.00784310.0705882
Reconstructed Value0.99116990.13437090.84566690.01103560.0952084
Reconstruction Error0.000986880.00103760.00139190.00319250.02462
Error Ratio0.000994680.00778240.00164320.407050.34879
Reconstruction Error ( μ ± σ ) = 8.9644 × 10−7 ± 1.1129 × 10−4
Replay Intrusion
Optimal Reconstructed Data
Original Value0.03137250.06274500.01960780.27058820.0352941
Reconstructed Value0.03137240.06274520.01960770.27058800.0352939
Reconstruction Error8.47 × 10−81.08 × 10−71.12 × 10−71.63 × 10−71.78 × 10−7
Error Ratio2.70 × 10−61.73 × 10−65.75 × 10−76.04 × 10−75.07 × 10−6
Poor Reconstructed Data
Original Value0.99215680.04313720.99607840.07450980.0156862
Reconstructed Value0.99806450.04916851.00284590.09400160.0395505
Reconstruction Error5.90 × 10−36.03 × 10−36.76 × 10−31.94 × 10−22.38 × 10−2
Error Ratio0.00595440.139820.00679410.26161.5213
Reconstruction Error ( μ ± σ ) = (2.8144 ± 2.9713)  × 10−4
Table 7. A representation of the retrieved data for the best and worst cases from Dataset 4, including various attack designs.
DoS Intrusion
Optimal Reconstructed Data
Original Value0.03137250.00392150.02745090.32941170.0352941
Reconstructed Value0.03137390.00392480.02744660.32940510.0353012
Reconstruction Error1.43 × 10−63.32 × 10−64.28 × 10−66.63 × 10−67.15 × 10−6
Error Ratio4.57 × 10−58.47 × 10−41.55 × 10−42.01 × 10−52.02 × 10−4
Poor Reconstructed Data
Original Value0.01176470.00392150.99215680.02352940.9843137
Reconstructed Value0.01412850.00113750.99547680.02987120.9959440
Reconstruction Error0.00236390.0027840.003320.00634180.01163
Error Ratio0.200930.709930.00334620.269530.011816
Reconstruction Error ( μ ± σ ) = (1.2052 ± 2.9518)  × 10−4
Fuzzing Intrusion
Optimal Reconstructed Data
Original Value0.03921560.01960780.36470580.09803920.4274509
Reconstructed Value0.03921560.01960780.36470580.09803920.4274510
Reconstruction Error3.33 × 10−93.71 × 10−98.45 × 10−91.32 × 10−83.09 × 10−8
Error Ratio8.51 × 10−81.89 × 10−72.31 × 10−81.35 × 10−77.23 × 10−8
Poor Reconstructed Data
Original Value0.10588230.07058820.08627450.05098030.0431372
Reconstructed Value0.09955270.07718580.09593140.06084570.0280398
Reconstruction Error0.00632970.00659760.00965690.00986530.015097
Error Ratio0.059780.0934660.111930.193510.34999
Reconstruction Error ( μ ± σ ) = 2.6575 × 10−5 ± 1.1231 × 10−4
Table 8. A representation of the retrieved data for the best and worst cases from Dataset 5, including various attack designs.
DoS Intrusion
Optimal Reconstructed Data
Original Value0.20.20784310.26666660.72156860.6352941
Reconstructed Value0.19999990.20784310.26666660.72156860.6352941
Reconstruction Error1.5 × 10−111.2 × 10−106.3 × 10−101.13 × 10−91.55 × 10−9
Error Ratio7.3 × 10−115.6 × 10−102.36 × 10−91.56 × 10−92.44 × 10−9
Poor Reconstructed Data
Original Value0.11372540.015686270.05098030.49803920.2509803
Reconstructed Value0.11613850.01835320.05626500.49207090.2346066
Reconstruction Error0.0024130.0026670.00528460.00596820.016374
Error Ratio0.0212180.170020.103660.0119830.065239
Reconstruction Error ( μ ± σ ) = 9.9053 × 10−6 ± 4.4062 × 10−5
Fuzzing Intrusion
Optimal Reconstructed Data
Original Value0.01568620.49411760.04313720.03921560.2549019
Reconstructed Value0.01568620.49411760.04313720.03921560.2549019
Reconstruction Error7.8 × 10−101.50 × 10−92.56 × 10−93.19 × 10−93.76 × 10−9
Error Ratio5.0 × 10−83.04 × 10−95.93 × 10−88.15 × 10−81.47 × 10−8
Poor Reconstructed Data
Original Value0.00392150.01176470.00392150.015686270.0274509
Reconstructed Value0.00867510.01708160.01000460.02216090.0171910
Reconstruction Error0.00475360.00531690.00608310.00647460.01026
Error Ratio1.21220.451941.55120.412760.37375
Reconstruction Error ( μ ± σ ) = (1.5741 ± 5.9155) × 10−5
Table 9. A representation of the retrieved data for the best and worst cases from Dataset 6, including various attack designs.
Flooding Intrusion
Optimal Reconstructed Data
Original Value0.93725490.39607840.400.83137250.6117647
Reconstructed Value0.93725490.39607840.39999990.83137250.6117647
Reconstruction Error4.66 × 10−113.50 × 10−103.75 × 10−109.26 × 10−102.66 × 10−9
Error Ratio4.97 × 10−118.83 × 10−109.39 × 10−101.11 × 10−94.35 × 10−9
Poor Reconstructed Data
Original Value0.14117640.14117640.06666660.37254900.8509803
Reconstructed Value0.02717980.14666010.07318020.38303860.8329448
Reconstruction Error0.00365040.00548360.00651360.010490.018036
Error Ratio0.155140.0388420.0977040.0281560.021194
Reconstruction Error ( μ ± σ ) = (4.9234 ± 7.7279) × 10−5
Fuzzing Intrusion
Optimal Reconstructed Data
Original Value0.20392150.22745090.59607840.34117640.1019607
Reconstructed Value0.20392150.22745090.59607840.34117640.1019607
Reconstruction Error5.43 × 10−96.24 × 10−96.52 × 10−97.03 × 10−98.65 × 10−9
ER2.66 × 10−82.74 × 10−81.09 × 10−82.06 × 10−88.48 × 10−8
Poor Reconstructed Data
Original Value0.00784310.09803920.04705880.03137250.9490196
Reconstructed Value0.01559060.10679750.06523270.053957680.9110684
Reconstruction Error0.00774750.00875830.0181740.0225850.037951
Error Ratio0.987810.0893350.38620.71990.03999
Reconstruction Error ( μ ± σ ) = (5.4577 ± 1.7709)  × 10−4
Malfunction Intrusion
Optimal Reconstructed Data
Original Value0.33725490.59215680.27058820.11764700.7450980
Reconstructed Value0.33725490.59215680.27058820.11764700.7450980
Reconstruction Error3.23 × 10−104.2 × 10−105.9 × 10−101.12 × 10−91.24 × 10−9
Error Ratio9.6 × 10−107.1 × 10−102.18 × 10−99.53 × 10−91.66 × 10−9
Poor Reconstructed Data
Original Value0.02352940.06666660.00392150.00784310.8196078
Reconstructed Value0.02617960.06964580.00772270.01447440.7989199
Reconstruction Error0.00265020.00297920.00380120.00663130.020688
Error Ratio0.112630.0446880.969290.845490.025241
Reconstruction Error ( μ ± σ ) = (8.7937 ± 4.3163)  × 10−5
Table 10. Percentage reconstruction error in data reconstruction by the proposed model.
DatasetIntrusionsPercentage RE (%)
1Dos7.5182 × 10−5
Fuzzy7.1871 × 10−5
Impersonation4.3145 × 10−5
2Dos4.267 × 10−5
Fuzzy9.0666 × 10−5
Spoofing (Gear)3.9214 × 10⁻⁵
Spoofing (RPM)2.2653 × 10⁻⁵
3Flooding1.3271 × 10−5
Fuzzy4.6938 × 10−5
Malfunction9.0317 × 10−5
Replay1.6254 × 10−5
4Dos2.1384 × 10−5
Fuzzing2.0139 × 10−5
5Dos2.0518 × 10−5
Fuzzing3.7491 × 10−5
6Flooding1.4678 × 10−5
Fuzzing1.7889 × 10−5
Malfunction7.5370 × 10−5
Table 11. Execution and amortized time by the proposed model for different attack designs under study.
DatasetIntrusionExecution Time (s)Estimated UsageAmortized Time (s)
1Dos0.128403500.002568
1000.001284
2000.000642
Fuzzy0.118190500.002364
1000.001182
2000.000591
Impersonation  0.136582500.002732
1000.001366
2000.000683
2Dos0.119429500.002389
1000.001194
2000.000597
Fuzzy0.140763500.002815
1000.001408
2000.000704
Spoofing (Gear)0.085770500.001715
1000.000858
2000.000429
Spoofing (RPM)0.115697500.002314
1000.001157
2000.000578
3Flooding0.106050500.002121
1000.001061
2000.000530
Fuzzy0.118164500.002363
1000.001182
2000.000591
Malfunction0.151347500.003027
1000.001513
2000.000757
Replay0.117029500.002341
1000.001170
2000.000585
4Dos0.207910500.004158
1000.002079
2000.001040
Fuzzing0.132068500.002641
1000.001321
2000.000660
5Dos0.094069500.001881
1000.000941
2000.000470
Fuzzing0.148530500.002971
1000.001485
2000.000743
6Flooding0.145511500.002910
1000.001455
2000.000728
Fuzzing0.273372500.005467
1000.002734
2000.001367
Malfunction0.280700500.005614
1000.002807
2000.001404
Table 12. Representation of original data reconstruction by AM-DDAE tested on new unseen data and attack type.
Unseen-Exploits-Intrusion
Best Reconstructed Data
Original Value0.0588235290.0196078430.0392156860.33333487157540.352941176
Reconstructed Value0.0588235925723010.0196080346949000.0392152257888630.3333348715754100.352949442591866
Reconstruction Error6.3572 × 10−81.9169 × 10−74.6021 × 10−71.5386 × 10−68.266 × 10−6
Error Ratio1.0807 × 10−69.7764 × 10−61.1735 × 10−54.6157 × 10−62.3422 × 10−5
Worst Reconstructed Data
Original Value0.1764705880.2941176470.2745098040.0784313730.901960784
Reconstructed Value0.1644137272576180.2819435741291030.2621189849203150.0922232807806750.883810436014474
Reconstruction Error0.0120570.0121740.0123910.0137920.01815
Error Ratio0.0683220.0413920.0451380.175850.020123
Reconstruction Error ( μ ± σ ) = 7.9501 × 10−4 ± 4.8 × 10−2
Table 13. Performance comparison between known Seen and new Unseen Data.
ParametersSeen DataUnseen Data
Mean Reconstruction Error<1%<1%
Execution Time (s)0.1455320.058369
Table 14. A representation of the retrieved data for the best and worst cases for Adversarial Machine Learning Attack.
Adversarial Machine Learning Atta
Best Reconstructed Data
Original Value0.0517552423754520.0100635519059730.0132964057553030.0105717727912500.005831583183491
Reconstructed Value0.0517552423774560.0100635514301360.0132964062995680.0132964062995680.005831583896953
Reconstruction Error2.0032 × 10−124.7584 × 10−105.4427 × 10−106.2462 × 10−107.1346 × 10−10
Error Ratio3.8705 × 10−114.7283 × 10−84.0933 × 10−85.9083 × 10−81.2234 × 10−7
Worst Reconstructed Data
Original Value0.9048894864176330.9212777432741210.9518338684639140.0489139220430000.900990803938693
Reconstructed Value0.9032078267498400.9194510946241410.9497694949458110.0512685958436000.897338065778924
Reconstruction Error0.00168170.00182660.00206440.00235470.0036527
Error Ratio0.00185840.00198270.00216880.0481390.0040541
Reconstruction Error ( μ ± σ ) = (4.2401 ± 7.1352) × 10−5
Table 15. Performance comparison of the proposed model with GANs (Mean RE).
DatasetAttack TypeMeanREDifference
AM-DDAE (Proposed)GANs
1DoS0.000136950.10240.102263
Fuzzy0.000109990.18120.18109
Impersonation0.000141270.16640.166259
2DoS0.000251560.14730.147048
Fuzzy0.0000399210.20230.20226
Spoofing (Gear)0.000160330.18670.18654
Spoofing (RPM)0.000108280.16640.166292
3Flooding0.000028710.18200.181971
Fuzzy0.0000118440.17920.179188
Malfunction0.000896440.14980.148904
Replay0.000281440.18620.185919
4DoS0.000120520.11970.119579
Fuzzing0.000265750.13300.132734
5DoS0.0000990530.16490.164801
Fuzzing0.0000157410.14850.148484
6Flooding0.0000492340.16720.167151
Fuzzing0.000545770.16560.165054
Malfunction0.0000879370.18940.189312
Table 16. Performance comparison of the proposed model with GANs (Execution T).
DatasetAttack TypeExecutionTime (s)Difference
AM-DDAE (Proposed)GANs
1DoS0.12840316.84416.7156
Fuzzy0.11819013.78613.66781
Impersonation0.13658211.08110.94442
2DoS0.11942911.19111.07157
Fuzzy0.14076311.01210.87124
Spoofing (Gear)0.08577011.20811.12223
Spoofing (RPM)0.11569714.44514.3293
3Flooding0.10605010.74310.63695
Fuzzy0.11816410.91310.79484
Malfunction0.15134710.98510.83365
Replay0.11702912.50012.38297
4DoS0.20791010.98510.77709
Fuzzing0.13206812.38212.24993
5DoS0.09406910.71710.62293
Fuzzing0.14853010.81610.66747
6Flooding0.14551110.69010.54449
Fuzzing0.27337211.03810.76463
Malfunction0.28070010.87710.5963
Table 17. Representation of original data reconstruction by GANs for Dataset 1.
DoS Intrusion
Best Reconstructed Data
Original Value0.0039215690.0196078430.0118110240.0156862750.007843137
Reconstructed Value0.00393570.01963960.01171150.01550160.0074881
Reconstruction Error0.0000140930.0000317630.0000995670.000184670.00035506
Error Ratio0.00359360.00161990.00840.0117730.04527
Worst Reconstructed Data
Original Value0.9843137250.9764705880.9763779530.9803921570.996078431
Reconstructed Value0.01183490.00376260.00255300.00399000.0050469
Reconstruction Error0.972480.972710.973820.97640.99103
Error Ratio0.987980.996150.997390.995930.99493
Reconstruction Error ( μ ± σ ) = 0.1024 ± 0.1356
Fuzzy Intrusion
Best Reconstructed Data
Original Value0.0196078430.6156862750.2980392160.313725490.635294118
Reconstructed Value0.01963160.61577150.29778310.31345250.6355679
Reconstruction Error0.0000238040.0000851970.000256080.000273010.00027379
Error Ratio0.0012140.000138380.000859210.000870210.00043096
Worst Reconstructed Data
Original Value0.8156862750.9647058820.8784313730.8039215690.894117647
Reconstructed Value0.11804840.22837160.13549890.03014020.0755604
Reconstruction Error0.697640.736330.742930.773780.81856
Error Ratio0.855280.763270.845750.962510.91549
Reconstruction Error ( μ ± σ ) = 0.1812 ± 0.0665
Impersonation Intrusion
Best Reconstructed Data
Original Value0.0491071430.0627450980.0401785710.0705882350.074509804
Reconstructed Value0.04902250.06283230.04038820.07083140.0747580
Reconstruction Error0.0000846360.0000871530.000209590.000243140.00024823
Error Ratio0.00172350.0013890.00521650.00344450.0033316
Worst Reconstructed Data
Original Value0.9285714290.9764705880.9254901960.9151785710.988235294
Reconstructed Value0.05403810.09940460.03557210.01958870.0857598
Reconstruction Error0.874530.877070.889920.895590.90248
Error Ratio0.941810.89820.961560.97860.91322
Reconstruction Error ( μ ± σ ) = 0.1664 ± 0.0695
Table 18. Representation of original data reconstruction by GANs for Dataset 2.
DoS Intrusion
Best Reconstructed Data
Original Value0.0078431370.047058820.0047846890.0196078430.003968254
Reconstructed Value0.00758610.04656960.00372330.01833250.0024771
Reconstruction Error0.000257060.000489240.00106140.00127540.0014912
Error Ratio0.0327750.0103960.221820.0650430.37578
Worst Reconstructed Data
Original Value0.9682539680.9843137250.9790575920.9882352940.996078431
Reconstructed Value0.00896330.00640300.0009805550.00616390.0012052
Reconstruction Error0.959290.977910.978080.982070.99487
Error Ratio0.990740.993490.9990.993760.99879
Reconstruction Error ( μ ± σ ) = 0.1473 ± 0.1349
Fuzzy Intrusion
Best Reconstructed Data
Original Value0.1176470590.113725490.0352941180.0666666670.074509804
Reconstructed Value0.11765970.11370340.03521240.06654760.0746459
Reconstruction Error1.2592 × 10−52.2083 × 10−58.1761 × 10−51.191 × 10−41.3612 × 10−4
Error Ratio0.000107030.000194180.00231660.00178650.0018268
Worst Reconstructed Data
Original Value0.9803921570.9490196080.9294117650.9450980390.976470588
Reconstructed Value0.13129010.09843430.07265540.05529330.0850940
Reconstruction Error0.84910.850590.856760.88980.89138
Error Ratio0.866080.896280.921830.941490.91286
Reconstruction Error ( μ ± σ ) = 0.2023 ± 0.0922
Spoofing (Gear) Intrusion
Best Reconstructed Data
Original Value0.0047846890.0196078430.1780104710.0047846890.062745098
Reconstructed Value0.00469320.01971560.17812140.00452820.0623568
Reconstruction Error9.1474 × 10−51.0777 × 10−41.1096 × 10−42.5652 × 10−43.8834 × 10−4
Error Ratio0.0191180.00549630.000623340.0536130.0061891
Worst Reconstructed Data
Original Value0.913725490.9294117650.9647058820.9764705880.945098039
Reconstructed Value0.00920110.00494510.03224660.04014720.0066587
Reconstruction Error0.904520.924470.932460.936320.93844
Error Ratio0.989930.994680.966570.958890.99295
Reconstruction Error ( μ ± σ ) = 0.1867 ± 0.0849
Spoofing (RPM) Intrusion
Best Reconstructed Data
Original Value
Reconstructed Value
Reconstruction Error0.0000515940.000064440.000175540.000193880.00023951
Error Ratio0.000365460.0000730320.00139890.006180.0016965
Worst Reconstructed Data
Original Value0.9803921570.9568627450.9843137250.9882352940.996078431
Reconstructed Value0.13350450.10354330.12783260.07530570.0731756
Reconstruction Error0.846890.853320.856480.912930.9229
Error Ratio0.863830.891790.870130.92380.92654
Reconstruction Error ( μ ± σ ) = 0.1664 ± 0.0739
Table 19. Representation of original data reconstruction by GANs for Dataset 3.
Flooding Intrusion
Best Reconstructed Data
Original Value0.0352941180.0901960780.113725490.0313725490.058823529
Reconstructed Value0.03529110.09033480.11328900.03183390.0593143
Reconstruction Error2.979 × 10−60.000138720.000436490.000461350.00049074
Error Ratio8.4404 × 10−50.0015380.00383810.0147060.0083427
Worst Reconstructed Data
Original Value0.9764705880.944881890.9254901960.8784313730.933333333
Reconstructed Value0.11553260.08268480.05912950.00640160.0128098
Reconstruction Error0.860940.86220.866360.872030.92052
Error Ratio0.881680.912490.936110.992710.98628
Reconstruction Error ( μ ± σ ) = 0.1820 ± 0.0704
Fuzzy Intrusion
Best Reconstructed Data
Original Value0.113725490.2352941180.0117647060.113725490.074509804
Reconstructed Value0.11384610.23542720.01192600.11350590.0747396
Reconstruction Error0.000120630.000133070.000161340.000219590.00022975
Error Ratio0.00106070.000565540.0137140.00193090.0030835
Worst Reconstructed Data
Original Value0.9254901960.9215686270.9372549020.972549020.956862745
Reconstructed Value0.03050220.01601210.01732640.04220580.0169412
Reconstruction Error0.894990.905560.919930.930340.93992
Error Ratio0.967040.982630.981510.95660.9823
Reconstruction Error ( μ ± σ ) = 0.1792 ± 0.0819
Malfunction Intrusion
Best Reconstructed Data
Original Value0.0039215690.0117647060.0470588240.0235294120.007843137
Reconstructed Value0.00392370.01174930.04696120.02339830.0076827
Reconstruction Error2.1172  × 10−61.545  × 10−59.7598  × 10−51.3112  × 10−41.6041  × 10−4
Error Ratio0.000539890.00131320.0020740.00557270.020453
Worst Reconstructed Data
Original Value0.9803921570.9843137250.9882352940.9921568630.996078431
Reconstructed Value0.00531270.00146390.000215690.0006848630.000068583
Reconstruction Error0.975080.982850.988020.991470.99601
Error Ratio0.994580.998510.999780.999310.99993
Reconstruction Error ( μ ± σ ) = 0.1498 ± 0.1219
Replay Intrusion
Best Reconstructed Data
Original Value0.0784313730.0666666670.1450980390.109803920.188235294
Reconstructed Value0.07843920.06665690.14511170.10982430.1882974
Reconstruction Error7.8329 × 10−69.7348 × 10−61.3626 × 10−52.0415 × 10−56.2127 × 10−5
Error Ratio9.9869 × 10−51.4602  × 10−49.391  × 10−51.8592  × 10−43.3005  × 10−4
Worst Reconstructed Data
Original Value0.93725490.972549020.9568627450.9682539680.988235294
Reconstructed Value0.01485760.04983300.02277600.03022230.0374357
Reconstruction Error0.92240.922720.934090.938030.9508
Error Ratio0.984150.948760.97620.968790.96212
Reconstruction Error ( μ ± σ ) = 0.1862 ± 0.0866
Table 20. Representation of original data reconstruction by GANs for Dataset 4.
DoS Intrusion
Best Reconstructed Data
Original Value0.0039215690.0078431370.0235290.0156862750.011764706
Reconstructed Value0.00386290.00738470.0230810.01485260.0133527
Reconstruction Error0.0000586370.000458480.000448050.000833710.001588
Error Ratio0.0149520.0584560.0190420.0531490.13498
Worst Reconstructed Data
Original Value0.933333330.9411764710.972549020.9803921570.992156863
Reconstructed Value0.00384650.0000563495850.00536840.00256280.00071916
Reconstruction Error0.929490.941120.951060.977830.99144
Error Ratio0.995880.999940.97790.997390.99928
Reconstruction Error ( μ ± σ ) = 0.1197 ± 0.2124
Fuzzing Intrusion
Best Reconstructed Data
Original Value0.0156862750.0666666670.0117647060.0784313730.039215686
Reconstructed Value0.01572290.06652900.01196250.07865580.0396165
Reconstruction Error0.0000366240.000137690.00019780.000224440.00040083
Error Ratio0.00233480.00206540.0168130.00286170.010221
Worst Reconstructed Data
Original Value0.9843137250.9254901960.9803921570.9411764710.949019608
Reconstructed Value0.08744060.02020500.06267580.01174040.0030840
Reconstruction Error0.896870.905290.917720.929440.94594
Error Ratio0.911170.978170.936070.987530.99675
Reconstruction Error ( μ ± σ ) = 0.1330 ± 0.1266
Table 21. Representation of original data reconstruction by GANs for Dataset 5.
DoS Intrusion
Best Reconstructed Data
Original Value0.0627450980.0156862750.1254901960.2470588240.02745098
Reconstructed Value0.06306260.01605700.12500650.24754640.0269227
Reconstruction Error0.00031750.000370740.000483730.000487580.00052826
Error Ratio0.00506010.0236350.00385470.00197350.019244
Worst Reconstructed Data
Original Value0.9882352940.9411764710.9490196080.972549020.976470588
Reconstructed Value0.05186270.00240550.00853310.01784990.0201059
Reconstruction Error0.936370.938770.940490.95470.95636
Error Ratio0.947520.997440.991010.981650.97941
Reconstruction Error ( μ ± σ ) = 0.1649 ± 0.1176
Fuzzing Intrusion
Best Reconstructed Data
Original Value0.0196078430.0039215690.0078431370.0352941180.02745098
Reconstructed Value0.01964790.00383760.00759300.03559000.0271260
Reconstruction Error4.0042 × 10−58.4005 × 10−52.5012 × 10−42.9588 × 10−43.2499 × 10−4
Error Ratio0.00204210.0214210.031890.00838330.011839
Worst Reconstructed Data
Original Value0.9764705880.9529411760.9490196080.9411764710.996078431
Reconstructed Value0.05886850.03463830.01459340.00252640.0112039
Reconstruction Error0.928480.929390.934430.938650.98487
Error Ratio0.950850.975290.984620.997320.98875
Reconstruction Error ( μ ± σ ) = 0.1485 ± 0.1205
Table 22. Representation of original data reconstruction by GANs for Dataset 6.
Flooding Intrusion
Best Reconstructed Data
Original Value0.0103092780.2039215690.2549019610.513725490.062992126
Reconstructed Value0.01032110.20394850.25497080.51393070.0627497
Reconstruction Error1.1863 × 10−52.6959 × 10−56.8798 × 10−52.0519 × 10−42.4246 × 10−4
Error Ratio1.1507 × 10−31.322 × 10−42.699 × 10−43.9941 × 10−43.849 × 10−3
Worst Reconstructed Data
Original Value0.9254901960.9960629920.9686274510.9686274510.994845361
Reconstructed Value0.16427680.15147290.12381520.10418140.0170993
Reconstruction Error0.761210.844590.844810.864450.97775
Error Ratio0.82250.847930.872170.892440.98281
Reconstruction Error ( μ ± σ ) = 0.1672 ± 0.0667
Fuzzing Intrusion
Best Reconstructed Data
Original Value0.0509803920.486274510.0078431370.0039215690.482352941
Reconstructed Value0.05101230.48634410.00792230.00382790.4824857
Reconstruction Error3.1953 × 10−56.9589 × 10−57.9206 × 10−59.3645 × 10−51.328 × 10−4
Error Ratio0.000626760.000143110.0100990.0238790.00027532
Worst Reconstructed Data
Original Value0.9450980390.9843137250.9921568630.9882352940.996078431
Reconstructed Value0.06889750.07480870.05657990.03747010.0152394
Reconstruction Error0.87620.909510.935580.950770.98084
Error Ratio0.92710.9240.942970.962080.9847
Reconstruction Error ( μ ± σ ) = 0.1656 ± 0.0715
Malfunction Intrusion
Best Reconstructed Data
Original Value0.427450980.3215686270.2627450980.0101522840.403921569
Reconstructed Value0.42744710.32157830.26283000.01004350.4038029
Reconstruction Error3.8994 × 10−69.667 × 10−68.4951 × 10−51.0877 × 10−41.1867 × 10−4
Error Ratio9.1224 × 10−63.0062 × 10−53.2332 × 10−41.0713 × 10−22.9379 × 10−4
Worst Reconstructed Data
Original Value0.9529411760.9803921570.9843137250.9607843140.97254902
Reconstructed Value0.04796260.07424920.06926970.04534110.0385420
Reconstruction Error0.904980.906140.915040.915440.93401
Error Ratio0.949670.924270.929630.952810.96037
Reconstruction Error ( μ ± σ ) = (8.7937 ± 4.3163)  × 10−5
Table 23. Performance comparison of the proposed mechanism with the existing studies.
ReferenceSystemMethodMitigation StrategyPerformance Metrics
Percentage ErrorExecution Time (s)
Hidalgo et al. [21]IVN—smart intersectionGNN-MLPBlock, deflect intruder to decoy system-0.0466
Sontakke & Chopade [20]Vehicular ad-hoc networkDNN-BAIT approachNode isolation--
Khanapuri et al. [25]Vehicle platoonCNN—Routh-Hurwitz CriterionGap widening between vehicles--
Shirazi et al. [32]CAN-busLSTMData Reconstruction<6-
This studyCAN-busAM-DDAEData Reconstruction<10.08577–0.2807
Disclaimer/Publisher’s Note: The statements, opinions and data contained in all publications are solely those of the individual author(s) and contributor(s) and not of MDPI and/or the editor(s). MDPI and/or the editor(s) disclaim responsibility for any injury to people or property resulting from any ideas, methods, instructions or products referred to in the content.