Abstract
Within urban tunnels, the lane boundary lines are typically solid, thereby prohibiting lane changes and overtaking. The establishment of a mobile operation zone in the slow lane can pose significant driving safety hazards not only to the slow lane within the tunnel but also to the middle and overtaking lanes at the tunnel exit. This article adopts the method of simulation of the establishment of an urban expressway three-lane VISSIM model, and selects the road traffic volume and speed of moving work zone as the independent variable parameters. Then, the influence range of a low-speed vehicle on the rear vehicles in the middle lane and slow lane and the traffic risk caused by a low-speed vehicle are analyzed. The results show that, irrespective of the variations in traffic volume and moving operation zone speed, the traffic flow within a 150 m range after the tunnel section was significantly influenced. This was because queuing and congested vehicles from the slow lane exited the tunnel, causing vehicles to change lanes and overtake in a concentrated manner. The moving operation zone has a substantial impact on the traffic flow in the slow lane. Under different moving operation zone speed conditions, the speed change trend of the following vehicles is consistent. When the moving operation zone speed was 5 km/h and the traffic volume exceeded 1200 pcu/h, the traffic flow behind the operation zone was directly affected, and within an observable longitudinal distance of 500 m, this impact did not dissipate. The research results can provide a scientific basis for the operation and management of urban tunnel low-speed vehicles.
1. Introduction
Road traffic safety risks are intricately associated with traffic flow conditions. As traffic flow transitions from free flow to stable flow, then to unstable flow, and ultimately to forced flow, the safety risks during driving manifest distinct patterns of variation [1,2,3,4]. In the free flow state, traffic volume remains at a relatively low level, and the mutual interference among vehicles is minimal. Drivers typically operate their vehicles at the maximum speed permitted by the road environment, taking into account the vehicle’s performance capabilities [5,6]. When approaching the entrance or exit of an urban tunnel, due to the unique environmental changes within the tunnel, drivers experience alterations in their psychological and physiological states. This leads to frequent acceleration and deceleration, causing substantial disparities in driving speeds within urban tunnel segments and thereby posing certain traffic safety hazards [7,8,9], as shown in Figure 1. In non-free flow states, as traffic volume escalates, the mutual interference and interaction among vehicles intensify, and driving speeds decline significantly. The prevalence of car-following and lane-changing maneuvers gradually increases [10,11,12]. The associated following risks and lane-changing risks both have a substantial impact on road traffic safety.
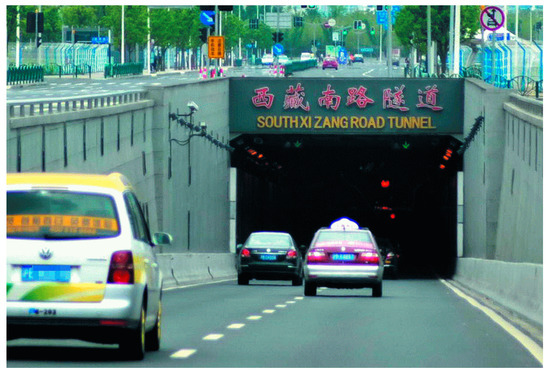
Figure 1.
The entrance section of an urban tunnel.
Road sweeping vehicles are specialized equipment designed for urban road sanitation, typically operating at low speeds ranging from 5 to 15 km/h to ensure cleaning efficiency and operational safety. Due to their significantly reduced speed compared to normal traffic flow, these vehicles may temporarily impede surrounding traffic, particularly during peak hours or in constrained road sections, potentially causing localized congestion. While significant research has been conducted on expressway maintenance work zones—encompassing section division, traffic flow characteristics, risk analysis, and management strategies—existing studies have predominantly focused on stationary work zones, leaving moving work zones substantially underexplored [13,14]. This paper therefore investigates moving work zones on urban roads, analyzing their influence range and traffic risk variations under different operational conditions through simulation. The study aims to provide theoretical support for managing urban road maintenance activities [15,16,17].
On the open stretches of urban expressways, the lane boundary lines are dashed. This configuration permits lane changes and overtaking maneuvers. The presence of a mobile operation zone exerts a substantial influence on the relevant lane. Moreover, the impact on other lanes is contingent upon the speed of the mobile operation zone and the traffic volume. Within urban tunnels, the lane boundary lines are typically solid, thereby prohibiting lane changes and overtaking [18,19,20]. The establishment of a mobile operation zone in the slow lane can pose significant driving safety hazards not only to the slow lane within the tunnel but also to the middle and overtaking lanes at the tunnel exit.
In the field of research on driving safety risks in road work zones, statistics indicate that the fatality rate of traffic accidents in highway maintenance work zones is three times higher than in other areas. Li et al. [21] established a risk assessment model for highway construction work zones based on a collision severity index. Meng et al. [22] analyzed the influencing factors of driving risks in highway construction work zones and proposed the use of crash avoidance deceleration rates to measure rear-end collision risks in these zones. Shakouri et al. [23] studied the impact of the location and traffic volume of highway maintenance work zones on driver workload using a driving simulator. To minimize the traffic impact of highway work zones, Helen et al. [24] proposed a reversible lane system. Du et al. [25] introduced an improved control strategy for highway maintenance work zones based on a nonlinear traffic flow model. Ge et al. [26] and Wu et al. [27] proposed methods for determining the length of highway maintenance work zones. Wu Biao et al. [28] developed a multiple regression model for single-vehicle driving risks and traffic flow parameters in fixed highway work zones. Peng Yuhua et al. [29] established a VISSIM simulation model for highway maintenance work zones and proposed a method for determining the length of work zones on four-lane highways. Wu Jiangling et al. [30] estimated the impact level of accidents in maintenance work zones and developed an optimization model for the layout of highway construction zones aimed at controlling accident costs. Yu Renjie et al. [31] proposed a method for determining the placement of speed limit signs in highway construction zones based on vehicle queue length and drivers’ short-term memory factors. Zhou Yuming et al. [32] created a VISSIM simulation model for the Shanghai–Nanjing Expressway construction work zones, conducted a comprehensive analysis of factors affecting traffic organization, and developed predictive models for traffic delays and the number of traffic conflicts. Meng Xianghai et al. [33,34] studied the traffic conflict characteristics in half-closed construction zones on bidirectional four-lane highways and proposed reasonable lengths for the upstream transition zones based on vehicle queuing characteristics. Researchers worldwide have conducted extensive studies on traffic flow characteristics, driving risk assessment, and management control strategies for road work zones. However, the focus has primarily been on fixed work zones, while the impact scope and variations in driving safety risks for mobile work zones, commonly seen in urban roads, remain unclear.
2. Simulation Model
The urban traffic flow was simulated by leveraging the VISSIM 7.0 software. The road layout was modeled after a three-lane urban expressway prototype, where the lane width was precisely set at 3.5 m and the design speed was designated as 80 km/h. Within the tunnel, the lane boundaries were configured as solid lines. This configuration was implemented to strictly prohibit lane changes and overtaking maneuvers. Conversely, for the remaining road sections outside the tunnel, dashed lines were utilized for lane demarcation. At the transition section of the tunnel entrance, a deceleration zone was established. Additionally, an expected speed decision point was incorporated at the tunnel exit. The Wiedemann 99 vehicle-following model was selected for this simulation. Regarding the driver’s reaction time, an initial value of 600 ms was set. Taking into account the transmission delay of the vehicle braking system, the overall driver reaction time was calibrated to 1 s. In the context of the urban tunnel transition section, due to the significant disparity in light intensity between the interior and exterior of the tunnel entrance, the driver’s reaction time needed to be adjusted accordingly. Specifically, the dark adaptation time, which is typically longer, was set at 1 s, while the light adaptation time was set at 0.6 s. Consequently, the total driver reaction time at the entrance of the urban tunnel was determined to be 2 s, and at the exit, it was set at 1.6 s [25,26,27,28,29,30,31,32,33,34,35,36,37].
The study adopts four traffic volume levels (800, 1200, 1600, and 2000 pcu/h) based on urban expressway service level standards. For moving work zone (MW) operations, three speed scenarios (5, 10, and 15 km/h) are simulated to evaluate their impacts. The VISSIM simulation model configuration is presented in Figure 2, with the yellow-colored vehicle agents representing simulated moving work vehicles operating in the rightmost travel lane.
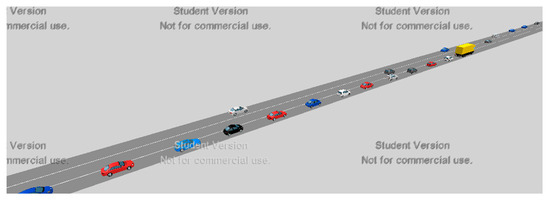
Figure 2.
VISSIM simulation model.
3. Results and Discussion
At the entrance area of urban tunnels, speed limit signs, lane indication signals, and lane-change prohibition markings are typically installed. These are designed to enable vehicles to select the appropriate lanes in advance and to prohibit lane changing once the vehicles enter the tunnel. Throughout the entire length of the tunnel, lane changing is strictly prohibited. Moreover, overtaking, parking, and reversing are categorically forbidden. In the event of special circumstances, road users should abide by the instructions displayed on the variable information board. At the exit section of the tunnel, the speed limit is gradually relaxed, the normal lane-use regulations are reinstated, and lane changing for overtaking purposes is permitted.
Due to the fact that the lane-dividing lines within the tunnel are white solid lines, lane changing and overtaking are strictly prohibited. Consequently, a significant number of vehicles in the following and platooning positions have formed queues behind the slow lane moving work zone. When drivers notice the queuing congestion in the slow lane during the transition section prior to the tunnel, they can opt to shift to the middle lane or the overtaking lane to avoid the congestion. Otherwise, once inside the tunnel, they must drive in the slow lane at a reduced speed and queue up until the moving operation vehicles exit the tunnel. After the moving operation vehicles leave the tunnel, the lane-dividing lines revert to dashed lines, permitting lane changing and overtaking, and most of the following vehicles will then choose to change lanes and overtake. Traffic flow speed data collection points were established for the sections before, within, and after the tunnel.
3.1. Middle Lane
As depicted in Figure 3, Figure 4 and Figure 5, when the traffic volume was 800 pcu/h, the traffic was in a free-flow state, and the establishment of the moving operation zone did not impose a substantial interference on the pre-tunnel sections. The sections within the tunnel were also minimally affected. There are likely two contributing factors: firstly, since lane changing and overtaking are not allowed in the tunnel and the moving operation zone is set in the slow lane, the middle lane remains largely unaffected; secondly, the relatively low traffic volume is consistent with the situation in the pre-tunnel sections. If this hypothesis holds true, then as the traffic volume increases, the traffic flow in the middle lane of the tunnel sections should be significantly impacted.
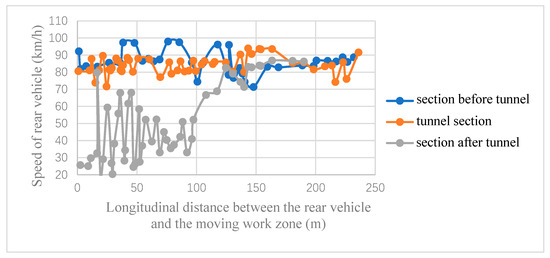
Figure 3.
Speed chart when the speed of the moving work area is 5 km/h and the traffic volume is 800 pcu/h.
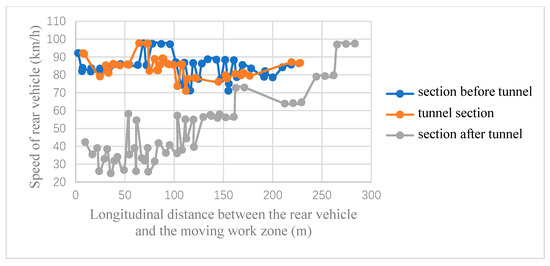
Figure 4.
Speed chart when the speed of the moving work area is 10 km/h and the traffic volume is 800 pcu/h.
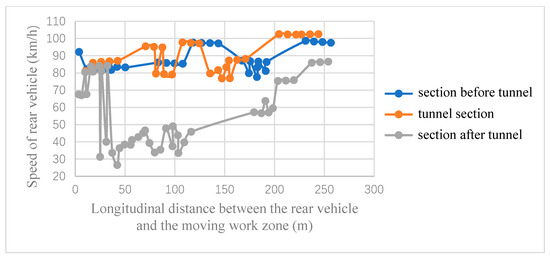
Figure 5.
Speed chart when the speed of the moving work area is 15 km/h and the traffic volume is 800 pcu/h.
To validate this hypothesis, the input simulated traffic volume was further increased to 1200 pcu/h, and the resulting speed statistics are presented in Figure 6, Figure 7 and Figure 8. The speed statistics for the pre-tunnel sections are generally consistent with the simulation results of urban roads. Specifically, when the mobile work zone operated at 15 km/h, the middle lane exhibited negligible disruption. In contrast, at a reduced speed of 5 km/h, the middle lane experienced indirect effects due to lane-changing maneuvers from the slow lane. This interaction induced noticeable speed fluctuations in the traffic flow within a 150 m longitudinal distance behind the work zone. When the moving operation zone speed was 10 km/h, the traffic flow in the middle lane of the tunnel sections also exhibited fluctuations, presumably due to the slight alteration in the traffic flow state resulting from the increased driving reaction time of drivers approaching the tunnel section.
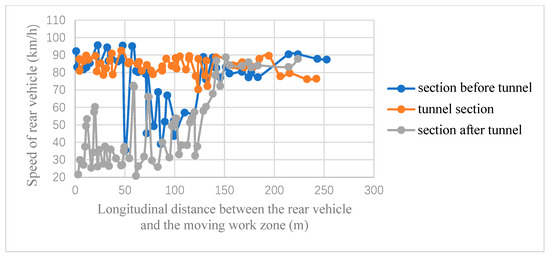
Figure 6.
Speed chart when the speed of the moving work area is 5 km/h and the traffic volume is 1200 pcu/h.
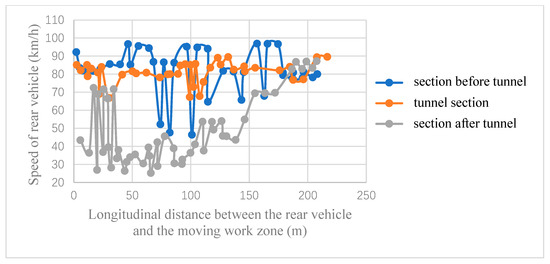
Figure 7.
Speed chart when the speed of the moving work area is 10 km/h and the traffic volume is 1200 pcu/h.
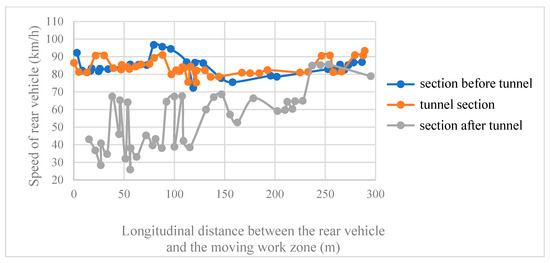
Figure 8.
Speed chart when the speed of the moving work area is 15 km/h and the traffic volume is 1200 pcu/h.
When the traffic volume was further increased to 1600 pcu/h, the speed statistics results are shown in Figure 9, Figure 10 and Figure 11. As the traffic volume rose, the traffic flow in the middle lane was significantly disrupted. The sections within the tunnel remained in a normal and stable fluctuating state and were not affected by the moving operation zone in the slow lane. Irrespective of the variations in traffic volume and moving operation zone speed, the traffic flow within a 150 m range after the tunnel section was significantly influenced. This was because queuing and congested vehicles from the slow lane exited the tunnel, causing vehicles to change lanes and overtake in a concentrated manner.
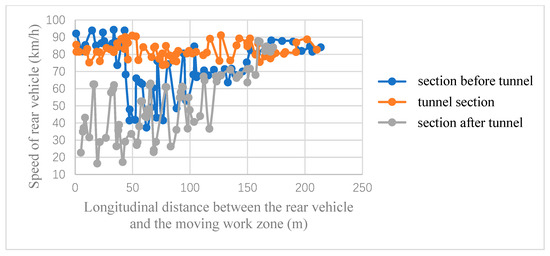
Figure 9.
Speed chart when the speed of the moving work area is 5 km/h and the traffic volume is 1600 pcu/h.
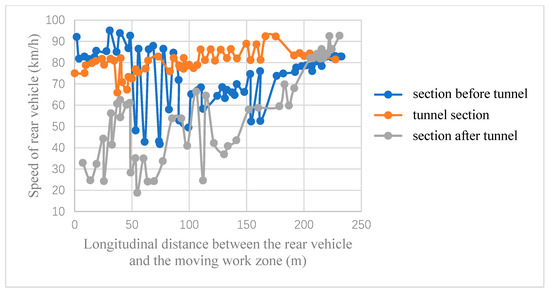
Figure 10.
Speed chart when the speed of the moving work area is 10 km/h and the traffic volume is 1600 pcu/h.
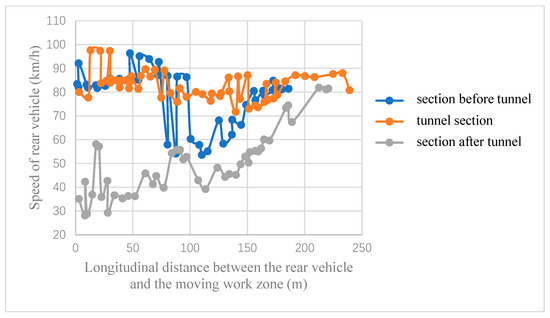
Figure 11.
Speed chart when the speed of the moving work area is 15 km/h and the traffic volume is 1600 pcu/h.
3.2. Overtaking Lane
As illustrated in Figure 12 and Figure 13, traffic flow in the overtaking lane remains indirectly affected by the mobile work zone within a 150 m longitudinal distance upstream of the tunnel entrance, particularly under conditions of high traffic volume and low work zone speeds. This influence persists until the work zone speed increases to 15 km/h, as demonstrated in Figure 14. At this point, the traffic flow in the overtaking lane basically no longer depends on the influence of the mobile operation zone in the slow lane. The traffic flow in the overtaking lane inside the tunnel remains the same as that in the middle lane, as the tunnel interior prohibits lane changes. Therefore, it is not affected by the mobile operation zone. When the traffic volume is 2000 pcu/h, even if the speed of the mobile operation zone increases to 15 km/h, the rear section of the tunnel is still affected by the mobile operation zone. The reason for this is speculated to be the queuing and accumulated vehicles behind the mobile operation zone in the slow lane at the tunnel entrance, which cause a large number of lane changes and overtaking phenomena, and combined with a large traffic volume, this causes significant disturbance to the traffic flow in the overtaking lane.
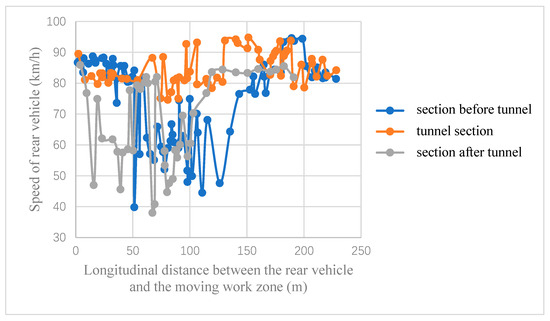
Figure 12.
Speed chart when the speed of the moving work area is 5 km/h and the traffic volume is 2000 pcu/h.
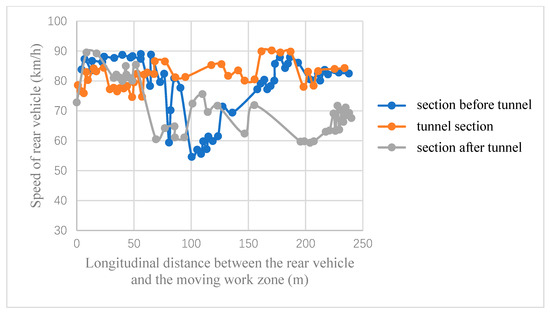
Figure 13.
Speed chart when the speed of the moving work area is 10 km/h and the traffic volume is 2000 pcu/h.
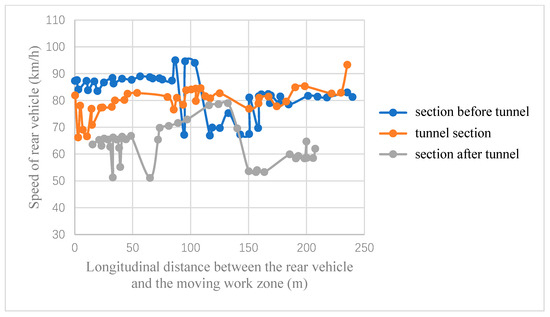
Figure 14.
Speed chart when the speed of the moving work area is 15 km/h and the traffic volume is 2000 pcu/h.
Due to the presence of solid white lane lines within the tunnel prohibiting lane changes and overtaking, analysis of traffic speed data reveals that neither the overtaking lane nor the middle lane is affected by the mobile work zone in the slow lane when traffic volume reaches 2000 pcu/h. Consequently, subsequent speed statistics for the overtaking lane inside the tunnel will exclude considerations of internal traffic flow disturbances.
From Figure 15 and Figure 16, it can be seen that although the traffic volume on the road has further decreased, the traffic flow in the overtaking lane of the tunnel section still receives indirect influence from the moving operation area on the slow lane. Of the vehicles queuing and accumulating behind the moving operation area on the slow lane inside the tunnel, after the lane boundary line at the tunnel exit changes to a dotted line allowing lane changing and overtaking, most of them choose to change lanes and overtake. This has caused the disturbed state of the traffic flow in the overtaking lane. Considering the low-speed vehicles inside the tunnel causing the queuing and accumulation of vehicles behind which then choose to change lanes and overtake at the tunnel entrance, this problem of traffic flow disorder in the tunnel section after the tunnel has indeed required the attention of tunnel managers.
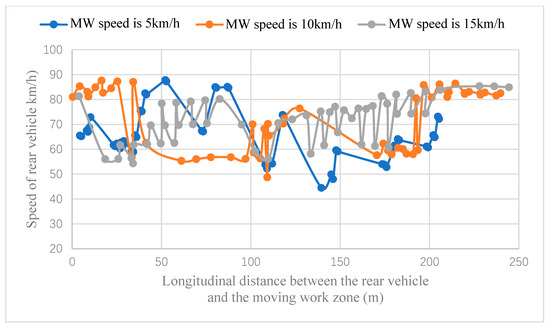
Figure 15.
Speed statistics of the overtaking lane after the tunnel when the traffic volume is 1600 pcu/h.
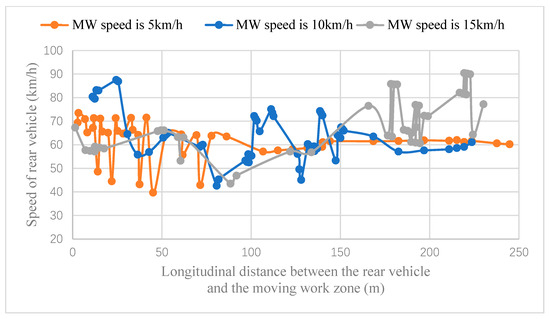
Figure 16.
Speed statistics of the overtaking lane after the tunnel when the traffic volume is 1200 pcu/h.
3.3. Slow Lane
The simulation results of the post-tunnel sections indicated that the disturbed traffic flow state was mainly attributable to queuing and congested vehicles from the slow lane in the moving operation zone behind the tunnel exit. Therefore, the analysis of traffic flow speed in the middle lane of the slow lane for the post-tunnel sections was not reiterated, and the focus was placed on the simulation of the sections within the tunnel. The speed statistics of the middle lane of the slow lane under different traffic volume conditions within the tunnel are presented in Figure 17, Figure 18, Figure 19 and Figure 20. Evidently, the moving operation zone has a substantial impact on the traffic flow in the slow lane. Under different moving operation zone speed conditions, the speed-change trend of the following vehicles is consistent. When the moving operation zone speed was 5 km/h and the traffic volume exceeded 1200 pcu/h, the traffic flow behind the operation zone was directly affected, and within an observable longitudinal distance of 500 m, this impact did not dissipate.
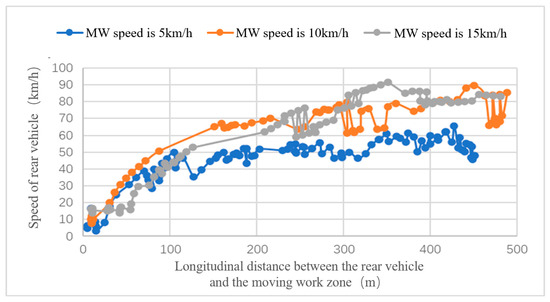
Figure 17.
Speed statistics of the slow lane in the tunnel when the traffic volume is 2000 pcu/h.
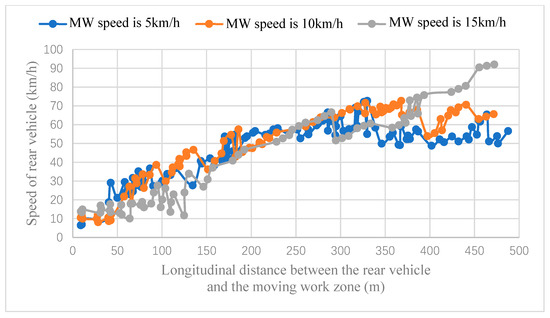
Figure 18.
Speed statistics of the slow lane in the tunnel when the traffic volume is 1600 pcu/h.
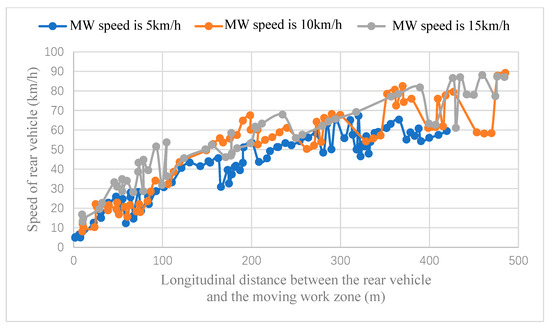
Figure 19.
Speed statistics of the slow lane in the tunnel when the traffic volume is 1200 pcu/h.
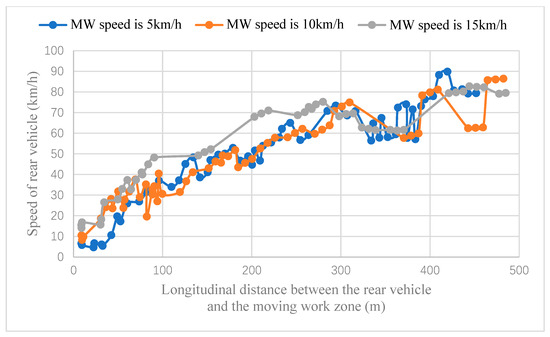
Figure 20.
Speed statistics of the slow lane in the tunnel when the traffic volume is 800 pcu/h.
The influence range of the moving operation zone in the tunnel has been significantly expanded. The primary reason is that overtaking and lane changing are prohibited in the tunnel, and rear vehicles can only choose to follow and queue, thereby generating a congestion wave that continuously propagates rearward, further disrupting the traffic flow within the tunnel.
A comparative analysis of speed distribution patterns in the slow lane reveals a consistent inverse relationship between the mobile work zone speed and following traffic flow velocity at equivalent longitudinal positions. This speed suppression effect is most pronounced under maximum traffic volume conditions (2000 pcu/h), as clearly demonstrated in Figure 17. The influence of work zone speed diminishes progressively with reduced traffic demand, becoming negligible at lower volumes. Specifically, when the traffic volume decreases to 800 pcu/h, the speed profiles show virtually identical patterns for work zone speeds of 5 km/h and 10 km/h, as evidenced in Figure 20.
4. Traffic Risk Analysis of Moving Work Zone
In this section, the speeds of vehicles exhibit significant variability, and traffic accidents predominantly result from rear-end collisions. Consequently, the car-following theory is employed to conduct an analysis of driving risks. The car-following model computes the critical acceleration by taking into account the relative speed and distance between the leading and following vehicles, and subsequently assesses the risk associated with a single vehicle.
Nevertheless, in the context of actual traffic flow, the car-following model overlooks the potentially high-risk situations of vehicles traveling at relatively high speeds when the relative speed and distance are relatively small. Guo et al. [38] built upon the early UTSC-1 limit following model in the United States and put forward a method for calculating the critical acceleration value to evaluate the car-following risk of a single vehicle. The calculation formula of this indicator is shown in Equation (1).
where denotes the critical acceleration value; (m) and (m), respectively, represent the position of the front and rear vehicle at time (s); and represent the speeds of the leading vehicle and the following vehicle at time ; and is the safe stopping distance, which is 1 m. The risk index corresponding to the critical acceleration value for driving is presented in Table 1 [39].

Table 1.
Comparison table of the critical acceleration and traffic risk index.
To evaluate the overall driving risk of the section, the concept of the average risk level is introduced, as shown in Equation (2).
where represents the average driving risk level; and , respectively, denote different risk levels and their frequencies; and is traffic volume.
Utilizing Equations (1) and (2) along with the data presented in Table 1, the average driving risks of the rear sections within the mobile operation area under diverse working conditions were computed. The resultant statistical data are presented in Table 2.

Table 2.
Average driving risk statistics in tunnel.
Within the tunnel, lane boundaries are demarcated by white solid lines, which strictly prohibit lane-changing and overtaking maneuvers. The traffic flow in the left and middle lanes remains unaffected by the right-lane moving operation zone during normal circumstances. However, once the vehicles queued up at the rear end of the tunnel and behind the right-lane moving operation zone exit the zone, a significant number of them opt to change lanes and overtake. This behavior disrupts the traffic flow in the left and middle lanes. Lane-changing behavior is identified as a major driving risk factor. For the purpose of simplifying the calculation process, the risk associated with lane-changing behavior is temporarily excluded in this analysis.
In this section, the focus is mainly on analyzing the following-distance driving risk within the slow lane of the tunnel. The critical acceleration value method is employed to assess the risk of single-vehicle following. Based on Equations (1) and (2), and Table 1, with the parking safety distance set at 1 m and the driver’s reaction time set at 1.6 s, the average driving risk of the right-lane section within the tunnel under various conditions is calculated. The statistical results are presented in Table 2. The first column in the table represents the internal sections of the tunnel, and the longitudinal distance from the moving work area ahead. It should be noted that due to the limited sampling quantity at the data collection points under a traffic volume of 800 pcu/h, the driving risk values for this traffic volume are not incorporated into the calculation.
As can be observed from Table 2, when a moving operation zone is present, the overall driving risk in the slow lane of the tunnel is relatively high, with all risk values exceeding five. When the traffic volume reaches 2000 pcu/h, the traffic flow approaches a relatively saturated state, and vehicles are predominantly in a following–driving mode. Consequently, the braking deceleration is relatively small, resulting in an average driving risk value that is lower compared to the other two conditions.
When the traffic volume is 1600 pcu/h, the average driving risk value increases. It is hypothesized that this is because the traffic flow transitions from a forced state to an unstable state at this point. Drivers frequently adjust the vehicle speed and the inter-vehicle distance, which leads to a significant increase in the average critical acceleration value. When the traffic volume further decreases to 1200 pcu/h, although the driving risk value decreases, it still remains at a relatively high level.
A horizontal comparison reveals that when the traffic volume is 2000 pcu/h, the average driving risk value increases with the increasing speed of the moving operation zone. It is speculated that in the forced state, a relatively high-speed moving operation zone may be one of the contributing factors causing traffic flow disturbances. In contrast, under the other two conditions, the higher the speed of the moving operation zone, the smaller the average driving risk value.
5. Conclusions
Owing to the influence of tunnel environmental factors and road boundaries, the impact of low-speed vehicles on the open sections and tunnel sections of urban expressways varies substantially. On the open sections of urban expressways, when drivers detect that the traffic flow speed in the adjacent lane is lower, they tend to attempt lane changing for overtaking purposes. Consequently, the risk associated with lane changing is relatively high. When the traffic volume on the road is low, the impact of low-speed vehicles on a three-lane urban expressway is relatively minor.
In contrast, for the tunnel sections, the scenario is entirely different. Since drivers are restricted from changing lanes to overtake, their sensitivity to traffic volume changes is diminished. The effect of traffic volume is mainly manifested at the entrance and exit sections of the tunnel. Moreover, the driving risks in these sections are already relatively high, which further exacerbates the driving safety risks within the tunnel.
To summarize, lane changing and overtaking are prohibited within the tunnel, and the left and middle lanes are not directly affected by the right-lane moving operation zone inside the tunnel. However, the lane-changing and overtaking behaviors of vehicles after they exit the right-lane moving operation zone at the rear of the tunnel queue disrupt the traffic flow in the left and middle lanes. When a moving work zone exists in the tunnel, the driving risk is relatively high.
Considering that the driving risk in the tunnel associated with the moving work zone is at a relatively high level, it is recommended that the operating hours of moving work vehicles in urban tunnels be scheduled during the night when the tunnel is closed for maintenance. Alternatively, during the working period, the lane where the moving operation zone is located should be temporarily closed to ensure the safety of tunnel driving.
This research paper constructs a simulation model that takes into account moving work zones. The input variables encompass parameters such as the driver’s reaction time, the following vehicle model, traffic volume, and the speed within the moving work zones. Corresponding operational conditions for moving work vehicles in urban tunnels are presented. It should be noted that, owing to the constraints of experimental conditions, the settings related to driver behavior and reaction time in this paper are predominantly based on relevant literature references. In the subsequent phase, the laboratory plans to acquire equipment such as eye trackers and physiological and psychological testing instruments. Through driving experiments, in-depth research will be conducted on driving behavior and reaction times in tunnel sections. Additionally, the factor of the moving work vehicle’s audio equipment will be incorporated into the study. Specifically, an exploration will be carried out to understand how the auditory sense impacts the driving behavior of following drivers. Furthermore, there is still a need for further investigation into how right-hand drive vehicles may affect the research conclusions of this article.
Author Contributions
Conceptualization, S.F. and J.M.; methodology, S.F.; software, S.F.; validation, W.L. and J.M.; formal analysis, S.F. and W.L.; investigation, W.L.; resources, S.F.; data curation, L.S.; writing—original draft preparation, S.F.; writing—review and editing, S.F. and W.L.; visualization, L.S.; supervision, J.M.; project administration, J.M.; funding acquisition, S.F. All authors have read and agreed to the published version of the manuscript.
Funding
This research was funded by the Jiangsu Vocational College of Electronics and Information, Grant No. SG1050325002, and the Huaian Municipal Science and Technology Plan Project, Grant No. 2025.
Data Availability Statement
The datasets, models, and code generated or utilized in this study have been archived in a public repository in compliance with funder data retention policies. Additional supporting data can be provided by the corresponding author upon reasonable request.
Conflicts of Interest
The authors declare no conflict of interest.
References
- Yu, Y.; Weng, J.; Zhu, W. Optimizing Strategies for the Urban Work Zone with Time Window Constraints. Sustainability 2019, 11, 4218. [Google Scholar] [CrossRef]
- Luo, G.; Zou, F.; Guo, F.; Liu, J.; Cai, X.; Cai, Q.; Xia, C. An over-the-horizon potential safety threat vehicle identification method based on ETC big data. Heliyon 2023, 9, e20050. [Google Scholar] [CrossRef]
- Ekmekci, M.; Woods, L.; Dadashzadeh, N. Effects of road width, radii and speeds on collisions at three-arm priority intersections. Accid. Anal. Prev. 2024, 199, 107522. [Google Scholar] [CrossRef]
- Yadav, A.K.; Velaga, N.R. Investigating the effects of driving environment and driver characteristics on drivers’ compliance with speed limits. Traffic Inj. Prev. 2021, 22, 201–206. [Google Scholar] [CrossRef]
- Luo, Y.; Yu, W.; Lu, J.; Chen, Y.; Ngoduy, D. A dynamic and stochastic perspective on time headway in traffic oscillations and its implications for traffic safety. Accid. Anal. Prev. 2025, 220, 108146. [Google Scholar] [CrossRef] [PubMed]
- Brown, H.; Sun, C.; Cope, T. Evaluation of Mobile Work Zone Alarm Systems. Transp. Res. Rec. 2015, 2485, 42–50. [Google Scholar] [CrossRef]
- Calvi, A.; Benedetto, A.; De Blasiis, M.R. A driving simulator study of driver performance on deceleration lanes. Accid. Anal. Prev. 2012, 45, 195–203. [Google Scholar] [CrossRef] [PubMed]
- Fang, Y.; Chen, J.; Peng, Z. The effect of moving bottlenecks on a two-lane traffic flow. Chin. Phys. B 2013, 22, 108902. [Google Scholar] [CrossRef]
- Li, Q.R.; Pan, Y.X.; Chen, L.; Cheng, C.G. Influence of the Moving Bottleneck on the Traffic Flow on Expressway. Appl. Mech. Mater. 2011, 97–98, 480–484. [Google Scholar] [CrossRef]
- Osman, A.A.; Turan, A.; Wolfgang, G.; Thomas, E. Development of a precast slim temporary concrete safety barrier STCSB 50 for work zone applications. J. Transp. Saf. Secur. 2019, 11, 287–304. [Google Scholar]
- Su, B.; Hu, J.; Zeng, J.; Wang, R. Traffic Safety Improvement via Optimizing Light Environment in Highway Tunnels. Int. J. Env. Res. Public. Health. 2022, 19, 8517. [Google Scholar] [CrossRef]
- Huang, Z.; Smirnova, M.N.; Smirnov, N.N.; Zhu, Z. Analyzing work zone effects on vehicular flow on an annular freeway with a tunnel. Fundam. Res. 2022, 5, 748–755. [Google Scholar] [CrossRef]
- Meng, Y.; Wang, L.; Zhang, Y.; Li, B.; Liu, Z.; Qing, G.; Chen, F. Driving visual information in highway tunnel entrances: A computational method based on optical flow and color quantification. Traffic Inj. Prev. 2025, 1–9. [Google Scholar] [CrossRef]
- Zhang, T.; Chen, F.; Huang, Y.; Song, M.; Hu, X. Analysis of Car-Following Behaviors under Different Conditions on the Entrance Section of Cross-River and Cross-Sea Tunnels: A Case Study of Shanghai Yangtze River Tunnel. Int. J. Env. Res. Public. Health 2022, 19, 11975. [Google Scholar] [CrossRef] [PubMed]
- Chen, Y.; Du, Z.; Xu, J.; Luo, S. Driving characteristics of static obstacle avoidance by drivers in mountain highway tunnels—A lateral safety distance judgement. Accid. Anal. Prev. 2025, 210, 107845. [Google Scholar] [CrossRef] [PubMed]
- Yan, Y.; Dai, Y.; Li, X.; Tang, J.; Guo, Z. Driving risk assessment using driving behavior data under continuous tunnel environment. Traffic Inj. Prev. 2019, 20, 807–812. [Google Scholar] [CrossRef]
- Zhou, Y.; Wei, J.; Chen, Z.; Wang, Y.; Zhang, M. Traffic organization of expressway maintenance work zone with multi-factors. J. Change Univ. 2020, 40, 99–108. [Google Scholar]
- Zhang, T.; Chen, Z.; Chen, F.; You, K. A study on lane-changing risk evolution of vehicle group based on potential field model in the freeway tunnel approach section. Traffic Inj. Prev. 2025, 26, 83–91. [Google Scholar] [CrossRef]
- Rubie, E.; Haworth, N.; Yamamoto, N. Passing distance, speed and perceived risks to the cyclist and driver in passing events. J. Saf. Res. 2023, 87, 86–95. [Google Scholar] [CrossRef] [PubMed]
- Han, L.; Du, Z.; He, S. The evaluation of eye-catching effect in freeway tunnel entrance zone based on fixation behavior characteristics. Traffic Inj. Prev. 2024, 25, 122–132. [Google Scholar] [CrossRef]
- Li, Y.; Bai, Y. Development of crash-severity-index models for the measurement of work zone risk levels. Accid. Anal. Prev. 2008, 40, 1724–1731. [Google Scholar] [CrossRef]
- Meng, Q.; Weng, J. Evaluation of rear-end crash risk at work zone using work zone traffic data. Accid. Anal. Prev. 2011, 43, 1291–1300. [Google Scholar] [CrossRef]
- Shakouri, M.; Ikuma, L.; Aghazadeh, F.; Punniaraj, K.; Ishak, S. Effects of work zone configurations and traffic density on performance variables and subjective workload. Accid. Anal. Prev. 2014, 71, 166–176. [Google Scholar] [CrossRef]
- Helen, W.; Justin, G.; Dijana, C.; Riegelhuth, G. Traffic flow at a freeway work zone with reversible median lane. Transp. Res. Procedia 2016, 15, 257–266. [Google Scholar] [CrossRef]
- Du, S.; Razavi, S. Variable speed limit for freeway work zone with capacity drop using discrete-time sliding mode control. J. Comput. Civ. Eng. 2019, 33, 11–15. [Google Scholar] [CrossRef]
- Ge, H.; Yang, Y. Research on calculation of warning zone length of freeway based on micro-simulation model. IEEE Access 2020, 15, 76532–76540. [Google Scholar] [CrossRef]
- Wu, K.; Zhong, L. A method for determining length of freeway work zone based on classification of service level. Adv. Mater. Res. 2013, 2592, 491–497. [Google Scholar] [CrossRef]
- Wu, B.; Xu, H.; Dai, T.; Song, C. Simulation-based evaluation model for driving risk in highway work zones. J. Transp. Syst. Eng. Inf. Technol. 2013, 13, 151–156. [Google Scholar]
- Peng, Y.; Wang, X.; Lyu, J.; Wang, W.; Zhang, H. Determination method for length of highway maintenance work zones based on level of service. China J. Highw. Transp. 2016, 29, 130–136. [Google Scholar]
- Wu, J.; Zhang, S.; Singh, A.; Zhou, B. Layout optimization of highway construction zones based on traffic accident cost control. J. Change Univ. 2017, 37, 97–103. [Google Scholar]
- Yu, R.; Ma, R.; Han, H.; Yan, Y.; Wang, J. Determination method for speed limit sign placement in highway construction zones. J. Traffic Transp. Eng. 2013, 13, 91–98. [Google Scholar]
- Zhou, Y.; Wei, J.; Chen, Z.; Yang, N. Traffic organization in highway maintenance zones considering multiple factors. J. Chang. Univ. 2020, 40, 99–108. [Google Scholar]
- Meng, X.; Zheng, L.; Bi, H.; Guan, Z.Q.; Xu, H.Q. Traffic characteristics and conflict analysis in half-closed construction zones of highways. China J. Highw. Transp. 2013, 26, 140–146. [Google Scholar]
- Meng, X.; Xu, H.; Wang, H.; Yao, H. Rear-end conflict analysis in highway construction zones based on TTC and DRAC. J. Transp. Inf. Saf. 2012, 30, 6–10. [Google Scholar]
- Wu, B.; Xu, H.; Dai, T.; Song, C. Simulation evaluation model on driving risk of expressway work zone. J. Transp. Syst. Eng. Inf. Technol. 2013, 13, 151–156. [Google Scholar]
- Peng, Y.; Wang, X.; Lyu, J.; Wang, W.; Zhang, H. Length determination method for expressway maintenance work zone based on service level. China J. Highw. Transp. 2016, 29, 130–136. [Google Scholar]
- Fang, S.; Shen, L.; Ma, J.; Xu, C. Study on the Design of Variable Lane Demarcation in Urban Tunnels. Sustainability 2022, 14, 5682. [Google Scholar] [CrossRef]
- Guo, Z.; Dai, Y.; Zhou, X. Critical safety speed and its application research on risk characteristic section of expressway tunnel (tunnel group). China J. Highw. Transp. 2010, 23 (Suppl. S1), 116–122. [Google Scholar]
- Fang, S.; Ma, J. Influence Range and Traffic Risk Analysis of Moving Work Zones on Urban Roads. Sustainability 2021, 13, 4196. [Google Scholar] [CrossRef]
Disclaimer/Publisher’s Note: The statements, opinions and data contained in all publications are solely those of the individual author(s) and contributor(s) and not of MDPI and/or the editor(s). MDPI and/or the editor(s) disclaim responsibility for any injury to people or property resulting from any ideas, methods, instructions or products referred to in the content. |
© 2025 by the authors. Published by MDPI on behalf of the World Electric Vehicle Association. Licensee MDPI, Basel, Switzerland. This article is an open access article distributed under the terms and conditions of the Creative Commons Attribution (CC BY) license (https://creativecommons.org/licenses/by/4.0/).