3. Methodology
The approach proposed in this investigation is intended to tackle the multifaceted issues associated with AV navigation in dynamic city settings by means of a new hybrid reinforcement learning approach. The framework proposes the integration of PPO with GNN to support efficient decision making and dynamic navigation. The urban environment is represented by a directed graph, where nodes are intersections, vehicles, and pedestrian areas; edges are road segments with specific characteristics, including traffic density, speed limit, and priority factors. GNNs are used for modeling the spatial-temporal dependencies in traffic patterns of the urban environment and facilitate understanding of complex interactions between different features of that environment.
For the purpose of navigation, the PPO algorithm is used, which, while updating the policy, reduces the exploration and increases the exploitation through the clipped surrogate loss function. This allows learning under stiffness constraints to be strong. Also, the framework incorporates a UCARM that adapts the reward system to be dependent on traffic rules, current traffic density data, and safety concerns. This helps to achieve the objective of making the learning process mimic real-life urban navigation objectives such as time to task, energy optimization, and collision prevention.
To this end, a DRAM is incorporated into the framework to assess real-time collision risks with the help of Bayesian inference and Markov Decision Processes (MDPs). This module also drives the risk management by simulating the variability in the movement of pedestrians, traffic, and changes in the physical environment. The entire framework is evaluated on real-world datasets including Argoverse and nuScenes as well as simulated data created in the CARLA simulator. To evaluate the proposed approach, different cases, such as dense traffic, mixed pedestrian areas, and adverse weather conditions, are considered. The findings are used to show how the framework can be used to add safety, decrease energy use, and increase navigation efficiency within cities.
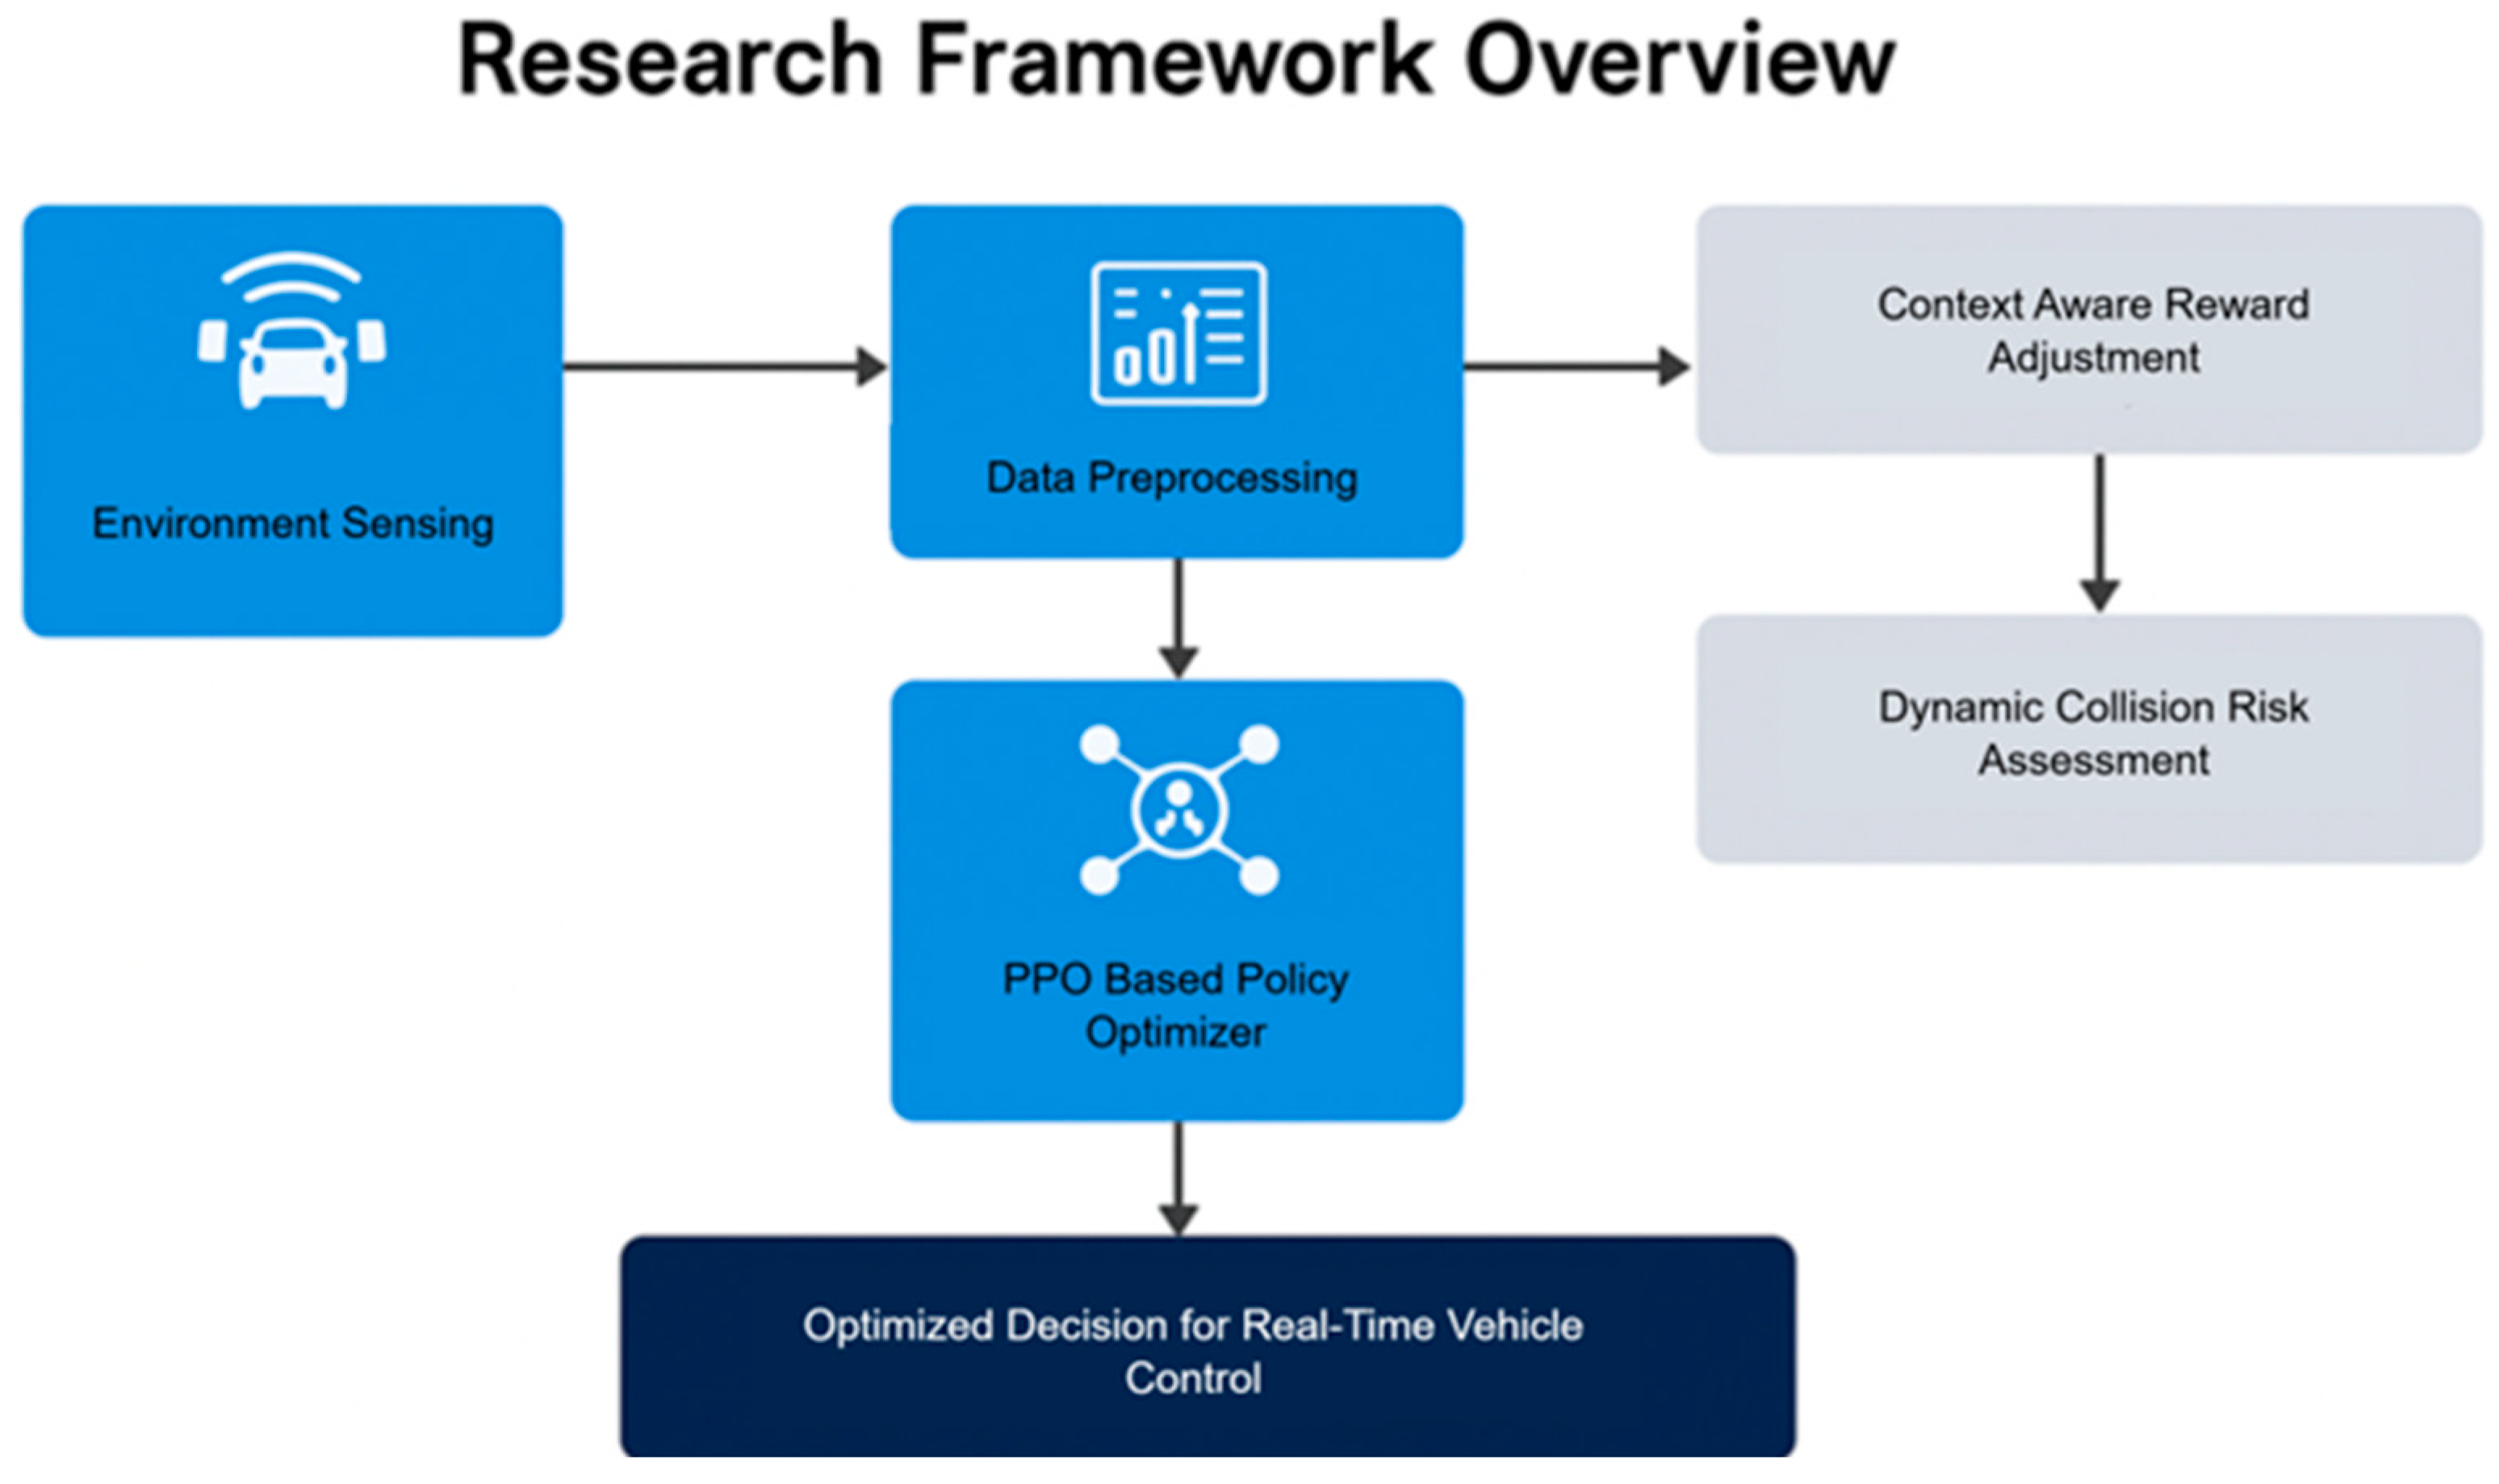
Figure 3 illustrates the core components of the proposed AV navigation framework. It begins with environment sensing and data preprocessing, followed by a GNN-based spatial-temporal encoder. The processed information flows into the PPO-based policy optimizer, enhanced with context-aware reward adjustment and dynamic collision risk assessment. The final output is an optimized decision for real-time vehicle control, enabling safe and efficient navigation across urban scenarios.
3.1. Dataset Description
- (a)
Datasets
The experiments in this study utilize three datasets: Argoverse, nuScenes, and CARLA. The Argoverse dataset contains annotated vehicle trajectory data collected from urban roads in Pittsburgh, Pennsylvania, including downtown intersections, multi-lane roads, and signal-controlled junctions. It provides high-definition semantic maps, 3D tracking of surrounding agents, and real-time traffic light data. The nuScenes dataset includes driving data from Boston and Singapore, covering mixed urban traffic, pedestrian zones, and sensor-rich vehicle logs. The CARLA dataset is a synthetic dataset generated using the CARLA simulator, offering controlled conditions across various weather scenarios, road types, and dynamic agent behaviors for evaluating autonomous navigation models.
In order to assess the performance of the proposed URLNF, the research used both high-quality real-world datasets and synthetic ones. Both datasets were selected to provide coverage of a large range of possible urban navigation settings, traffic conditions, road configurations, and interactions with pedestrians. Below is a detailed description of the datasets:
- (b)
Argoverse: A recorded driving dataset containing over 320 h of annotated data collected in an urban environment. This dataset provides high-quality 3D tracking of vehicles and their interactions with the road infrastructure: lanes, drivable space, and the surrounding environment; all of which are important for modeling urban dynamics. Argoverse also includes map-based priors to improve decisions made by self-driving automobiles in multi-agent environments.
Figure 4 shows two intersection scenes selected from the Argoverse dataset which indicate that urban traffic is challenging. The left panel shows a motor road intersection with multiple lanes for vehicles, walkways for crossing, automobiles, and a green traffic light. The right panel depicts another intersection scenario where the vehicles, pedestrians, and cyclist are depicted in a setting with a school bus and pedestrians within the vicinity of the crosswalk.
- (c)
NuScenes: Another realistic dataset containing full multi-sensor data, LIDAR, radar, and high-resolution camera data. NuScenes provides traffic signal states, vehicle motion, and the overall environment of the scene, and it is useful for model training and testing in complex dynamic traffic environments.
Figure 5 shows the modality of sensor data in the nuScenes dataset, which also includes camera and radar data. The left panel demonstrates six views of a car and its vicinity with bounding boxes for objects detected on them. The right panel shows the radar field of view (FoV), a list of radar detections, and clustered object annotations.
- (d)
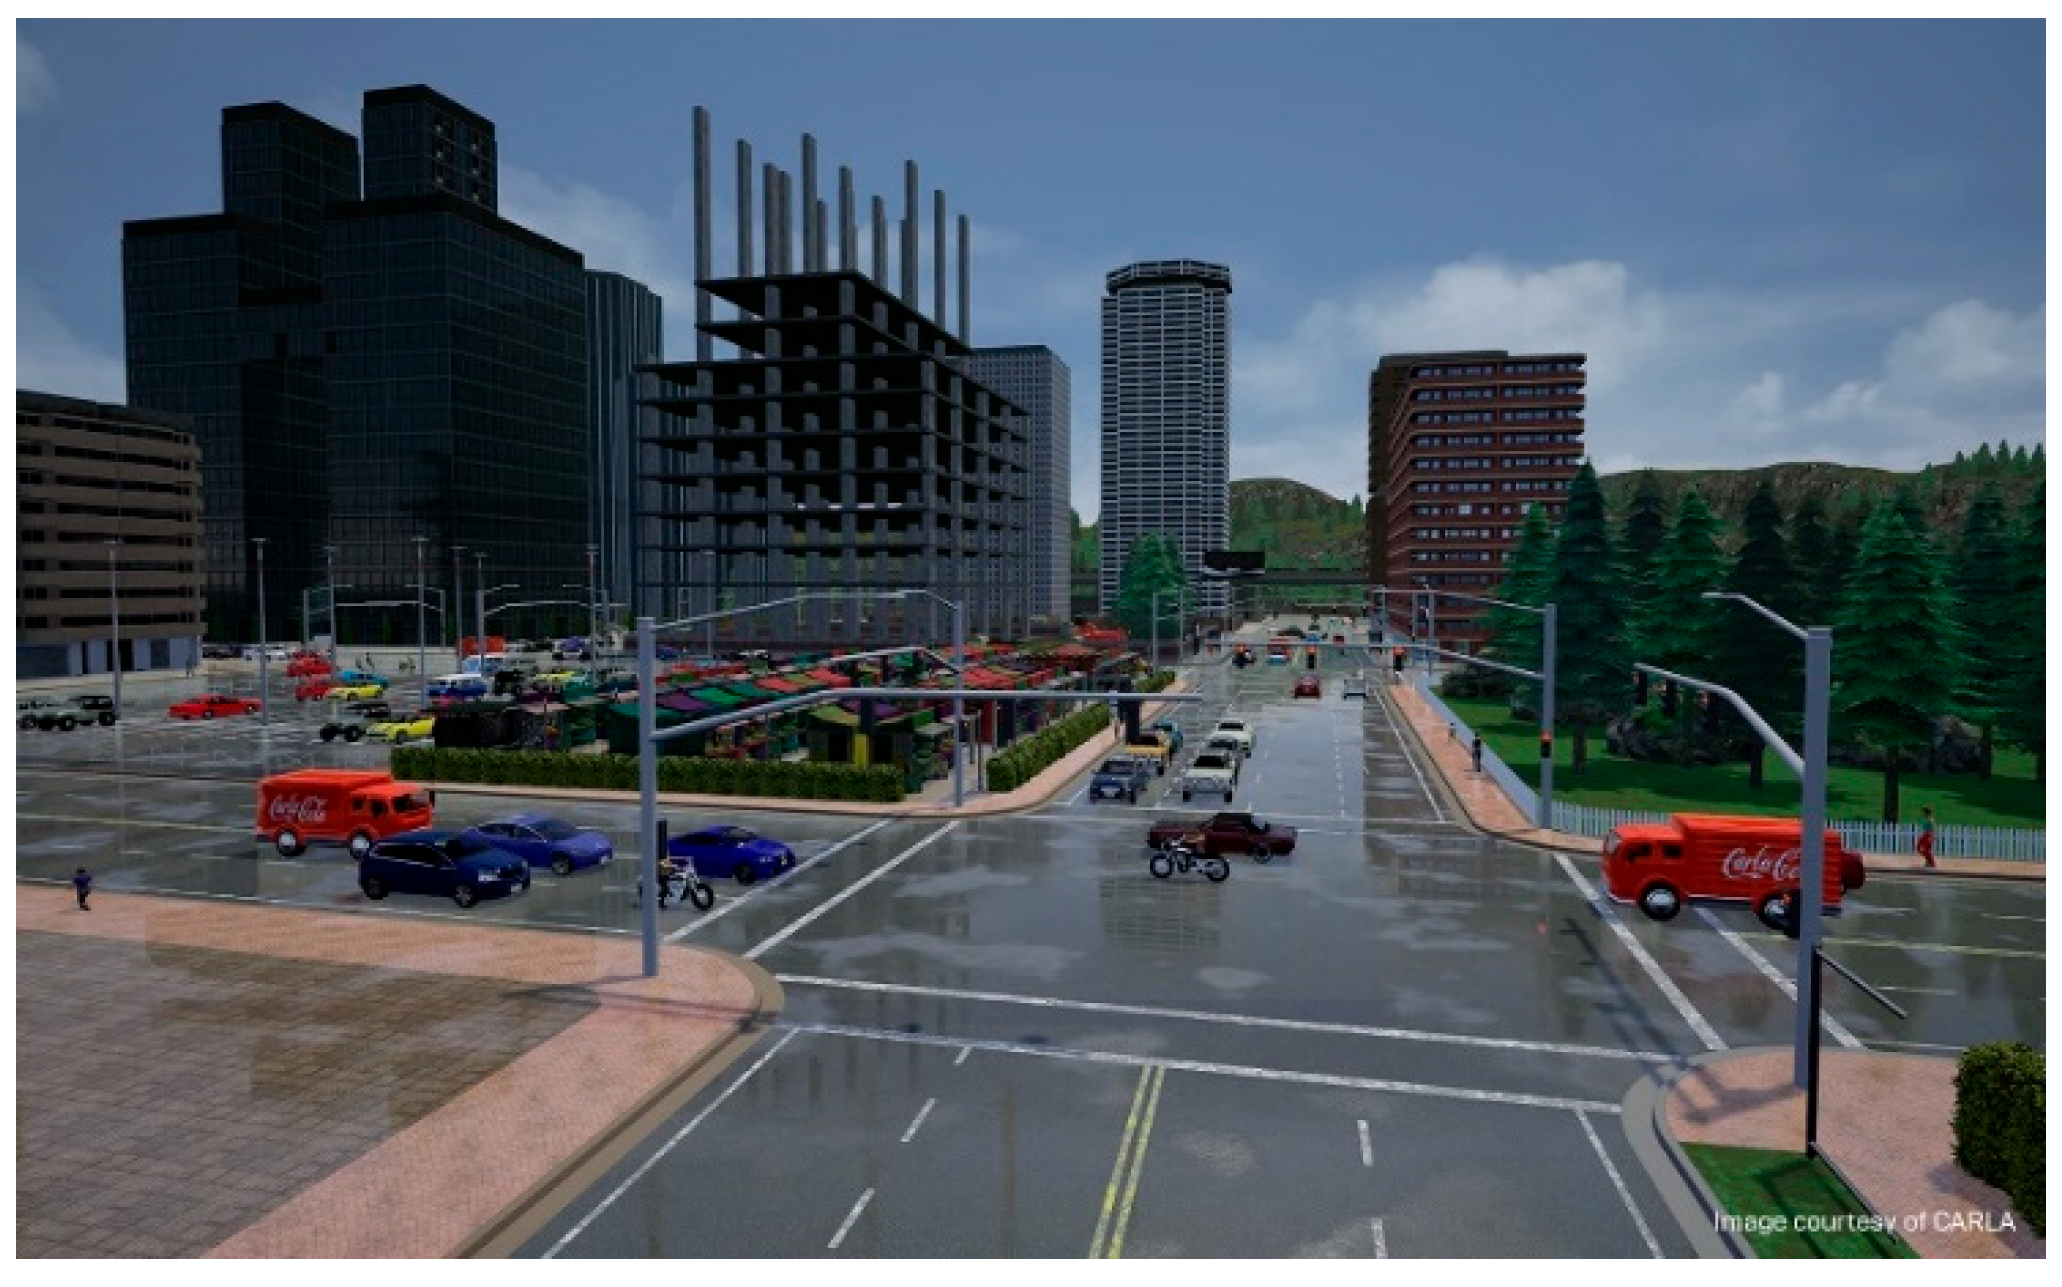
Synthetic Simulation Data (CARLA): In addition to the real-world datasets, synthetic data was also created from the CARLA simulator. The simulation environment reflects the traffic scenario of a city, weather conditions, and pedestrian actions. This dataset is also good for testing when there is congestion, bad weather, and other conditions that may not be well captured in real-world datasets.
In
Figure 6, a simulated urban environment is depicted using the CARLA simulator, where different vehicles, pedestrians, and dynamic weather conditions at a multi-lane intersection are shown. The scene demonstrates the difficulties of orientation in urban environments in a safety bubble.
Table 4 shows the Dataset specifications. To prepare the datasets for integration into the framework, the following preprocessing steps were undertaken:
- (a)
Normalization and Standardization: All quantitative data, including the vehicle velocities, distances, and the readings from the sensors, were scaled to be compatible between datasets.
- (b)
Augmentation: To further increase the data variability, information from additional scenarios such as the weather and time of day were included into CARLA data.
- (c)
Data Fusion: In both nuScenes and Argoverse, data from different sensors was combined to create a consolidated view of the environment with LIDAR, radar, and camera data being used for perception.
- (d)
Graph Construction: Urban environments were modeled as graphs where nodes correspond to intersections and vehicles while the edges correspond to road segments, traffic density, and signal indications.
The use of both real and synthetic datasets offers multiple benefits for the proposed framework. It allows for modeling of the real traffic phenomena in a urban environment and thus guarantees that the proposed framework can deal with real-world traffic conditions. Moreover, the use of synthetic data enables testing of cases that are not quite frequent in real-world scenarios, for example, rainy or snowy conditions or erratic behavior of pedestrians. This makes the framework scalable and applicable in different layouts of cities and under different climatic conditions that could make it useful in as many navigation problems as possible.
3.2. System Model
The proposed framework models the urban environment as a directed graph , where:
V stands for the junction points, the car, and places of interest.
E represents the set of roads between these intersections, where each road is described by features including traffic congestion, signal settings, and speed profile.
Parameter Definitions
Every AV interacts with the shared urban environment through a distinct decision-making process. At any given time , the state of each AV is denoted by , while its corresponding action is represented as . The evolution of the system is modeled as a generalized Markov Decision Process (MDP) defined by the five elements , where:
(State Space): Each state captures both the internal status of the AV and its environmental context. This includes the vehicle’s current position, speed, heading angle, and acceleration, along with external observations such as nearby object positions, traffic light status, lane information, and local traffic density. This provides a comprehensive understanding of the AV’s dynamic surroundings.
(Action Space): The action refers to the AV’s control commands at time , which consist of throttle (acceleration), brake level, and steering angle. These control signals are generated by the policy model in response to the observed state .
(Transition Probability): The probabilistic relationship between the current state and the next state is governed by the selected action . This captures the system’s dynamics and how the vehicle’s control choices affect its movement and interactions.
(Reward Function): The reward function quantifies the effectiveness of each action in a given state. It evaluates trade-offs between journey time, safety (e.g., collision risk), and energy consumption, thereby guiding the learning algorithm toward optimal and context-aware navigation behavior.
This formulation ensures that each AV can learn from its environment in a way that balances efficiency, safety, and resource use, leading to robust policy optimization across varied urban driving scenarios.
The framework integrates PPO and GNN to achieve the following objectives:
Problem Formulation
Let the urban environment be represented by a graph
, where V is the set of intersections in vehicles, and E is the roads connecting them. The state of the vehicle at time t is
∈
, the action take is
∈
, and the transition probability is
. The reward function
reflects the trade-offs between travel efficiency, safety, and energy consumption. The problem is modeled as MDP, aiming to maximize the cumulative reward.
where
is the policy, T is the episode duration, and
= (0, 1] is the discount factor.
Signal Adaptive Rout Planning for Autonomous Vehicles:
where
is the waiting time at a signal .
is the maximum allowable delay.
only applies when the AV is at a signal state.
Obstacle Avoidance:
where
is the speed-dependent safe distance.
Energy Efficiency Constraints:
where
is the energy consumed at time t.
is the vehicle’s maximum energy budget.
is the scaling coefficient that adjusts the energy budget threshold depending on real-time conditions (e.g., urgency, route complexity).
Road Priority constraints:
where
represent the priority weight of road segment
is the allowed maximum priority values.
3.2.1. Collision Avoidance Action Space Specification
The autonomous vehicle employs a comprehensive collision avoidance action repertoire consisting of four fundamental maneuver categories: lateral avoidance, longitudinal control, combined maneuvers, and emergency responses. The lateral avoidance actions include steering-based swerving with angular velocities ω ∈ [−0.5, 0.5] rad/s for obstacle circumnavigation, lane change maneuvers executed through sigmoid-shaped trajectory planning with lateral accelerations , and evasive turning with maximum steering angles for immediate threat response. Longitudinal control encompasses adaptive braking with deceleration rates based on time-to-collision calculations, speed reduction protocols maintaining minimum safe velocities in urban scenarios, and emergency braking achieving maximum deceleration when collision probability . Combined maneuvers integrate simultaneous steering and braking through coordinated control algorithms that optimize the trade-off between lateral stability and stopping distance, while emergency responses include complete vehicle stops, hazard signal activation, and V2X emergency broadcasts to surrounding vehicles within a 200-m radius.
3.2.2. Multi-Agent Environment Architecture
The framework operates within a comprehensive multi-agent environment where pedestrians, cyclists, and other vehicles are controlled by independent learning agents rather than scripted behaviors. Each pedestrian agent implements a social force model with collision avoidance preferences, goal-seeking behavior toward crosswalks or destinations, and dynamic response to vehicle proximity using a safety radius m. Vehicle agents follow lane-keeping protocols, adaptive cruise control with time headway s, and cooperative lane-changing behaviors that communicate intentions through V2V messaging protocols. The interaction modeling employs a hierarchical game-theoretic framework where each agent optimizes its individual utility function considering both personal objectives and predicted actions of neighboring agents . Inter-agent communication occurs through a shared observation space containing relative positions, velocities, and intended trajectories of all agents within a 50-m perception radius, enabling proactive collision avoidance through intention prediction and cooperative path planning.
3.2.3. Travel Time Optimization
Minimizing travel time T is a primary objective for autonomous vehicle navigation in dynamic urban environments. The framework employs a hierarchical approach to travel time optimization, incorporating both baseline travel metrics and context-aware adjustments that reflect real-world navigation constraints.
Context-Aware Effective Travel Time
To incorporate urban context awareness and dynamic traffic considerations, the effective travel time T_eff is formulated as:
where
: Priority weight factor for road segment at time step k [dimensionless, range: 0.1–1.0];
: Congestion multiplier for waiting time at time step k [dimensionless, range: 1.0–3.0].
The priority weight p_k dynamically adapts based on multiple urban factors:
where
: Normalized traffic density factor [0.1–1.0].
: Signal coordination efficiency factor [0.1–1.0].
: Safety assessment factor [0.1–1.0].
: Energy efficiency factor [0.1–1.0].
The congestion multiplier
adjusts waiting time penalties based on traffic conditions:
where
α = 2.0: Traffic density sensitivity parameter.
β = 0.5: Delay forecast sensitivity parameter.
Baseline traffic density threshold.
Predicted additional delay based on traffic patterns [seconds].
Vehicle Dynamics’ Integration in Travel Time
The travel time optimization incorporates vehicle dynamics constraints to ensure realistic performance estimates:
where
represents the maximum achievable speed given previous acceleration
and steering angle
, computed from the vehicle dynamics model.
where
(maximum acceleration) and j_max = 2.0 m/s
3 (maximum jerk).
Multi-Objective Travel Time Optimization
The framework optimizes travel time while balancing safety and energy efficiency through a weighted objective function:
where
Energy Time Penalty:
with
= 0.6, λ_safety = 0.3, λ_energy = 0.1: Optimization weights.
s: Time penalty per unit collision probability.
s: Time penalty per unit energy consumption.
: Baseline energy consumption rate.
Adaptive Time Horizon Planning
The framework employs adaptive time horizon planning that adjusts the optimization window based on scenario complexity:
where
Real-Time Travel Time Updates
The travel time estimation is continuously updated using a recursive formulation:
where
α_update = 0.7: Update rate parameter balancing stability and responsiveness.
: Current measured travel time performance.
: Predicted travel time from the optimization model.
3.2.4. Energy Efficiency
Energy consumption
is modeled as a function of vehicle speed
and acceleration
:
where
: Coefficients representing energy consumption characteristics.
: Vehicle acceleration at time t.
To ensure efficient energy usage, a constraint is imposed:
Figure 9 represents the cumulative energy consumption (E) of an autonomous vehicle as a function of time. The plot also includes a horizontal red dashed line indicating the maximum allowable energy consumption (E max) constraint.
3.2.5. Urban Context-Aware Reward Mechanism
The reward function
dynamically adapts based on the urban context, balancing travel time, safety, and energy efficiency:
where
—Reward at time step given state and action .
—Inverse effective travel time (shorter time = higher reward).
—Posterior collision probability from DRAM.
—Energy consumption at time .
—Weight coefficients (see
Table 5).
To ensure consistency across the manuscript, the reward functions used in Equations (19) and (24) have been aligned to share the same structure. The unified reward function is now defined as a weighted combination of three key factors: effective travel time, collision probability, and energy consumption. Specifically, the reward at each time step is computed as the negative sum of these metrics: , where is the effective travel time, is the estimated probability of collision, and is the energy used.
To reflect safety as the foremost concern, the reward function assigns the highest weight to the collision risk component. This ensures that policies favor safe actions even at the cost of slightly longer travel times or higher energy consumption, in alignment with real-world AV design priorities.
The weights are adjusted in real time based on traffic conditions, road priorities, and safety requirements.
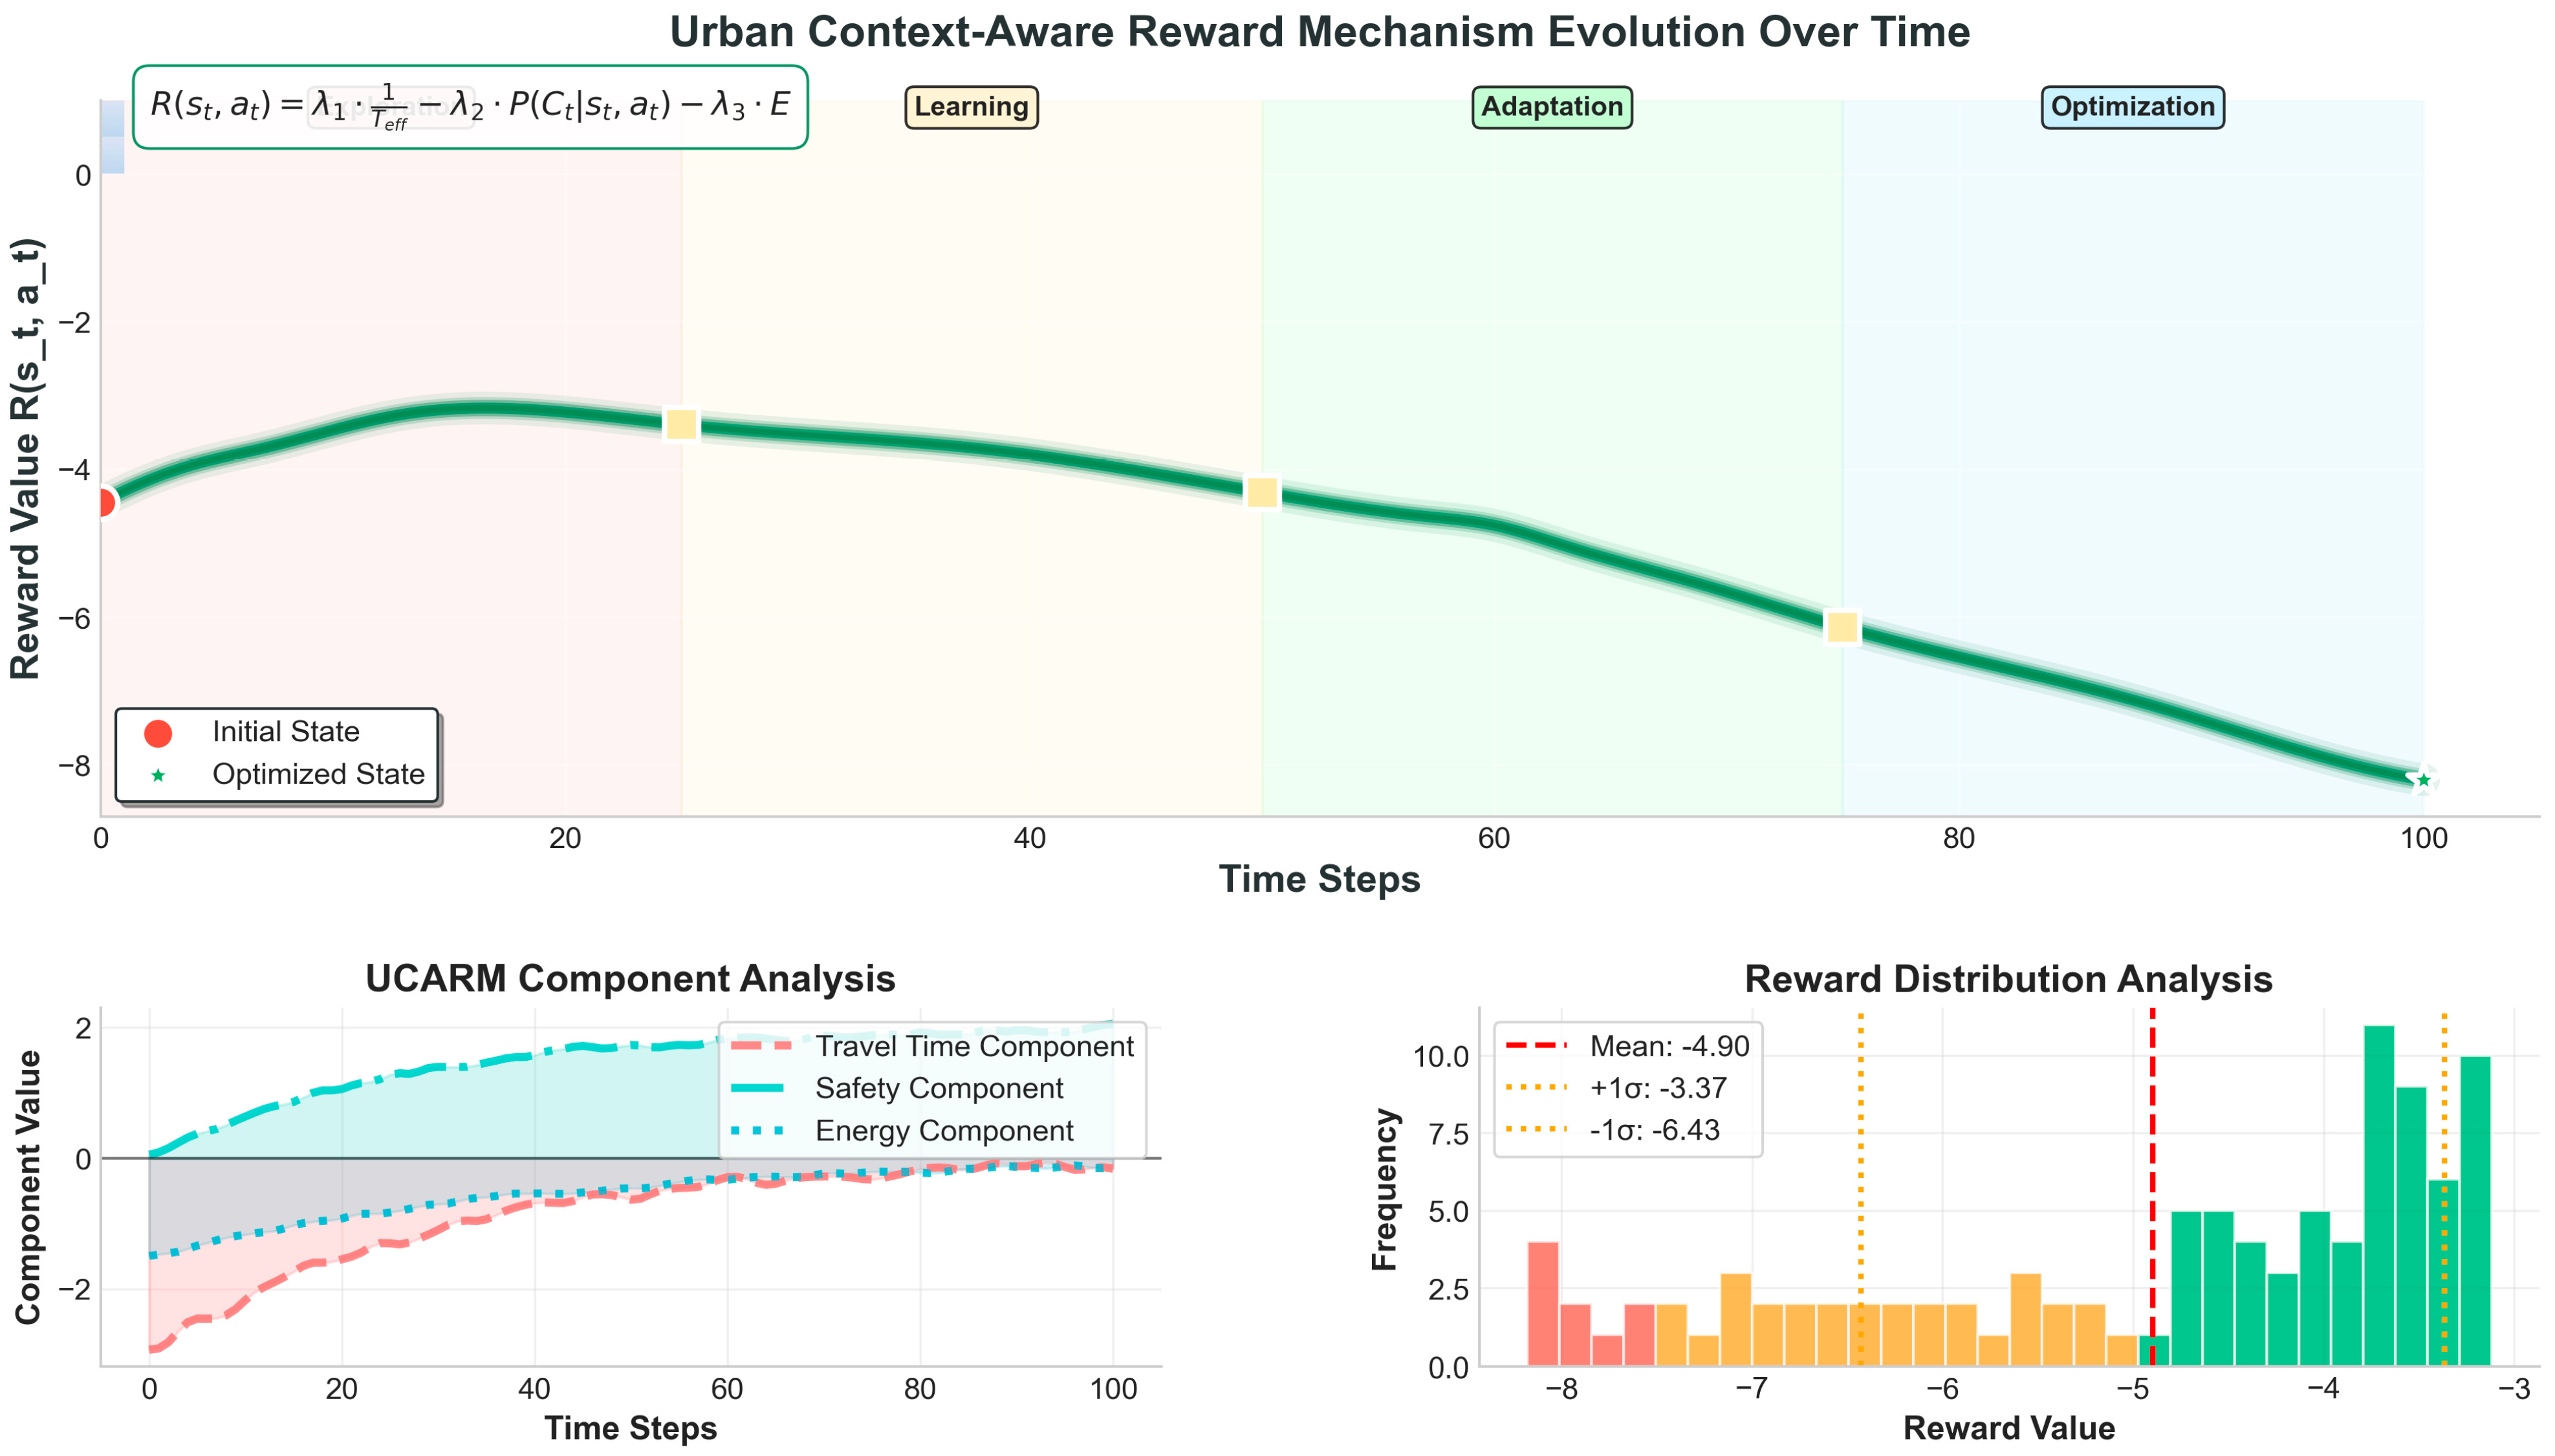
Figure 10 shows the evolution of the reward function
over 100 time steps, dynamically balancing the trade-offs between travel time, safety, and energy efficiency. The reward function is calculated based on real-time adjustments to account for urban navigation constraints. The formulation prioritizes safety by rewarding lower collision probabilities
while inversely penalizing effective travel time and energy consumption.
This detailed system model may guarantee a realistic representation of an urban environment so that the navigation strategies reflect safety, efficiency, and sustainability. Advanced reinforcement learning used in this paper combined with graph-based modeling allowed us to scale and generalize the results in various urban environments.
3.2.6. Perception and Object Modeling
In the proposed framework, pedestrians and other road users are modeled as dynamic obstacles with motion patterns that evolve over time. The behavior of such entities is predicted using a Kalman filter-based tracking approach, which continuously updates their estimated position and velocity based on sequential sensor readings.
The perception system employs a sensor fusion mechanism that combines data from LiDAR, RGB cameras, and radar. LiDAR provides accurate depth and spatial positioning, while cameras contribute semantic understanding such as object classification (e.g., pedestrian, vehicle, cyclist), and radar enhances velocity estimation under adverse conditions like fog or rain. This fusion ensures robustness in dynamic urban scenarios.
To estimate collision risk, a probabilistic collision model is implemented. It calculates the likelihood of collision based on the predicted trajectory overlap between the ego vehicle and detected agents. Specifically, Bayesian inference is used to determine the probability of collision at each time step, considering both historical motion data and current positional uncertainty. This risk score is then directly integrated into the reward function via the DRAM to penalize unsafe actions and encourage proactive avoidance strategies.
The action space definitions directly feed into the PPO policy optimizer within URLNF. During each decision cycle, the chosen action is evaluated by the UCARM, which dynamically adjusts the reward based on current traffic density, road priority, and collision probability from the DRAM. This integration ensures that both safety and efficiency considerations influence the PPO policy update in real time. Multi-agent coordination signals (e.g., predicted trajectories from surrounding vehicles) are incorporated into the GNN’s spatial-temporal state representation, enabling the PPO module to select actions that maximize long-term joint utility.
3.3. Proposed Framework
The challenges of AV navigation in complex dynamic urban scenes are complex and multi-faceted and are addressed in the proposed framework through a new hybrid deep reinforcement learning model. The framework integrates:
Proximal Policy Optimization (PPO): When there is a need to make stable and robust policies when responding to the constraints of the surrounding environment.
Graph Neural Networks (GNN): To model spatial-temporal relationships in the urban environment and interactions between the elements.
Urban context-aware reward mechanism (UCARM): It adapts the reward system in line with traffic rules, real-time traffic, and accidents, and it provides contextually relevant decisions.
DRAM: Uses Bayesian learning and MDP for risk prediction, modeling of uncertainties, and making the right decisions with regards to collision risks.
3.3.1. Proximal Policy Optimization (PPO)
PPO is used to update the navigation policy
AV, with θ being the parameter of the policy that governs the AV’s probability of selecting action
from state
. In the following policy, the focus of PPO is not on modeling but to maximize the total reward received over time while keeping the policy stable. The optimization objective is given by:
where
is the probability ratio between the updated policy and the old policy.
is the advantage function, quantifying the relative benefit of action in state compared to the baseline value function .
is the clipping parameter that prevents excessive updates and ensures stable learning.
Although Equation (21) is expressed using a minimization-style formulation, it fundamentally represents a maximization objective for expected cumulative reward. In practice, this objective is optimized using gradient ascent, but for consistency with loss-based training conventions, it is framed as a clipped surrogate loss to be minimized. This formulation stabilizes updates by limiting the step size through the clipping function, which constrains the policy ratio within a fixed range (typically between and ).
The value function
is learned using the Bellman equation:
where
is the discount factor that prioritizes immediate rewards over future rewards.
Figure 11 shows the workflow of PPO.
During training, the policy parameters (denoted as πθ) are updated using the PPO algorithm based on observed transitions. The framework collects batches of data containing states, actions, and corresponding rewards from environment interactions. An advantage estimation is then computed to measure how much better an action performs compared to the expected baseline. Using this, a clipped objective function is applied to stabilize the updates and prevent large shifts in policy. The gradient of this objective function is computed and used to update πθ using the Adam optimizer. A learning rate scheduler is used to reduce the learning rate as training progresses, improving convergence.
3.3.2. Graph Neural Network (GNN) for Spatial-Temporal Modeling
The urban environment is modeled as a directed graph , where nodes represent intersections, vehicles, and pedestrian zones, and edges represent roads with attributes such as traffic density, signal states, and speed limits. Each node has an initial feature vector capturing local traffic and signal information.
Node embeddings are updated through message passing:
where
is the set of neighbors of node
,
is a normalization factor,
is the weight matrix for layer
, and
is an activation function (e.g., ReLU).
After
layers, the final node embeddings
capture spatial-temporal dependencies and are fed into the PPO policy network. The GNN parameters are optimized via backpropagation using the combined PPO policy loss and any auxiliary tasks, ensuring robust representation learning for decision making in dynamic urban environments.
Figure 12 shows the Graph Neural Network (GNN) for spatial-temporal modeling.
The GNN component processes a graph representation of the environment where each node represents an entity (e.g., AV, pedestrian, traffic signal) and edges represent interactions or proximity. Each GNN layer has a learnable weight matrix Wk that transforms node embeddings during message passing. These weights are updated via backpropagation during training. The gradients are derived from the overall loss, which is computed from both the PPO policy loss and auxiliary tasks such as trajectory consistency or object classification, if enabled. The optimizer updates the GNN weights to minimize the loss, ensuring the graph representation accurately captures spatial and temporal dependencies critical for decision making.
3.3.3. Urban Context-Aware Reward Mechanism (UCARM)
To ensure that the reinforcement learning agent makes context-sensitive decisions, the proposed framework embeds real-world driving scenarios directly into the learning process. Three key urban contexts are considered: dense traffic, pedestrian interaction zones, and dynamic weather conditions. These scenarios are first quantified using physical and environmental parameters. Dense traffic is represented through vehicle density metrics, such as the number of surrounding vehicles, their average speeds, and spacing patterns—these are computed from LiDAR and radar data and incorporated as node features in the graph. Pedestrian–vehicle zones are identified using camera-based semantic segmentation, which flags areas such as crosswalks and sidewalks. These zones are assigned binary indicators and risk weights based on pedestrian activity levels. Dynamic weather conditions, including reduced visibility, slippery roads, and sensor noise, are modeled using environmental sensor readings and mapped to parameters like visibility range and road friction. These contextual features are embedded into the graph as node and edge attributes in the GNN and are also appended to the PPO agent’s state vector. This integration allows the model to learn environment-specific behaviors and adjust its reward optimization accordingly, improving its ability to generalize across varying real-world conditions while maintaining safety, energy efficiency, and travel time minimization. The reward function is defined as:
where
is the effective travel time, considering road priority weights .
is the collision probability at time .
is the energy consumption, where is travel time weight, is safety weight, and is energy weight.
are weight parameters that balance the trade-offs.
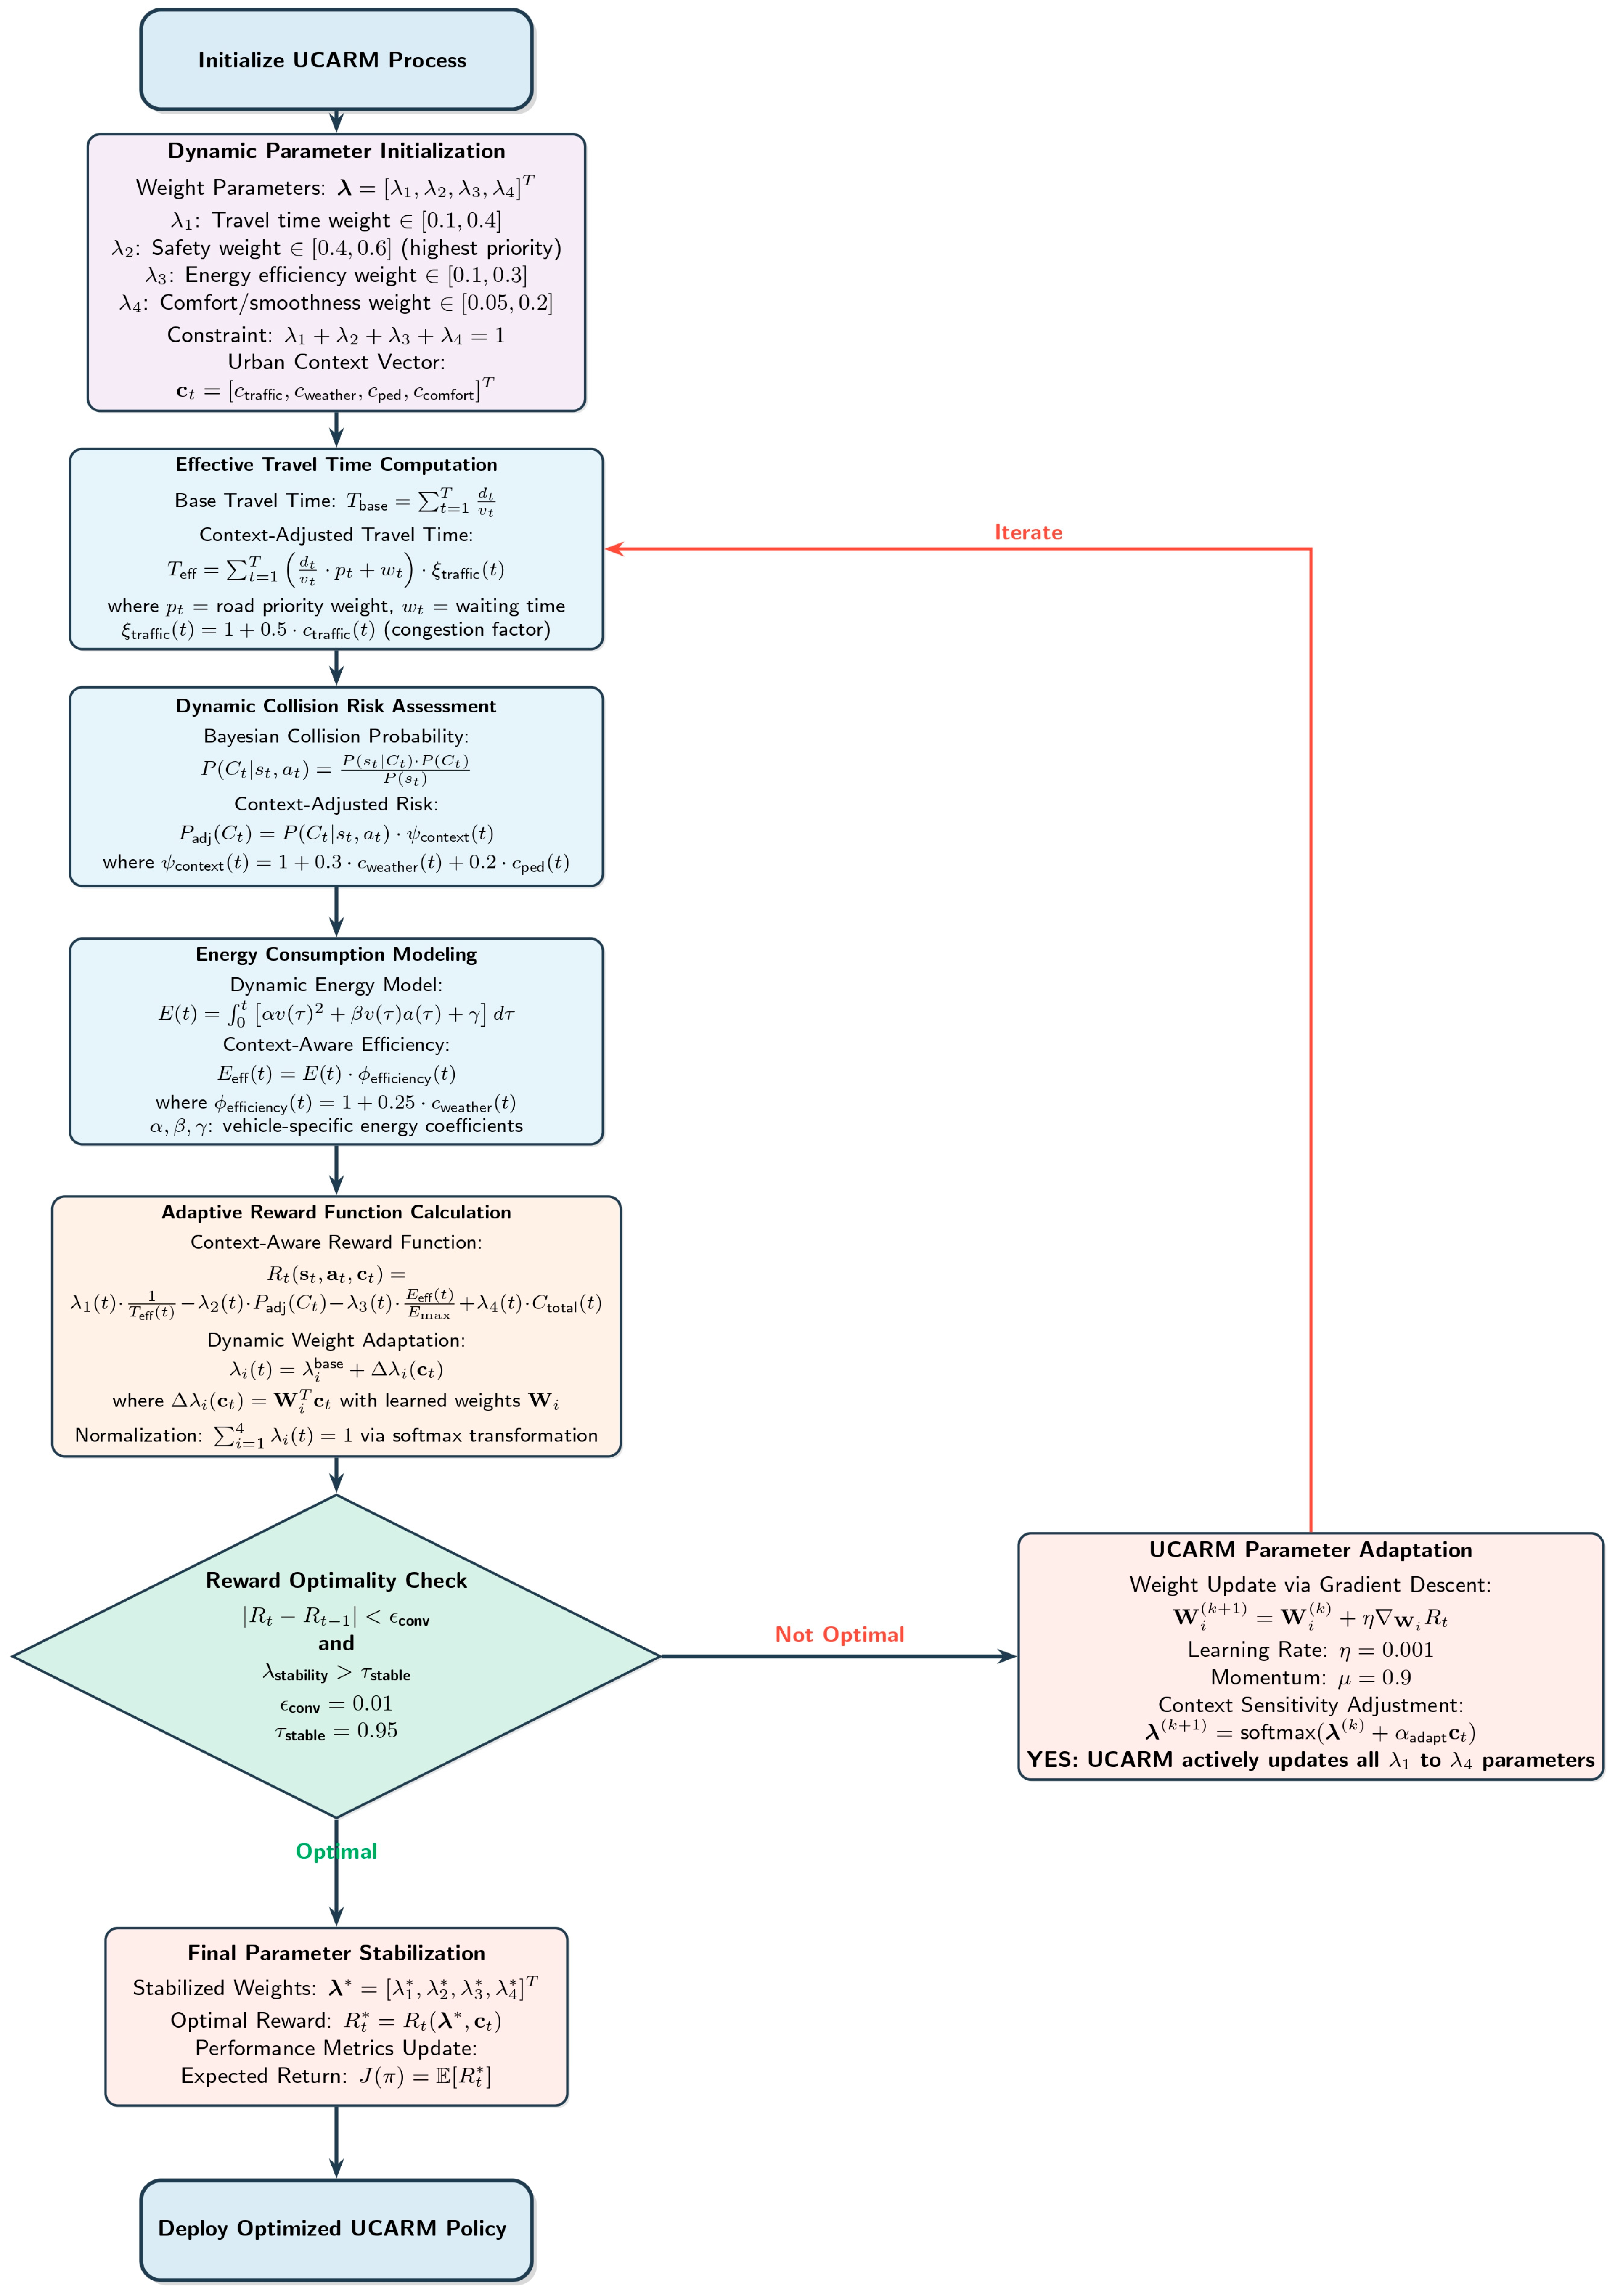
Figure 12 shows the UCARM.
The weighting parameters λ
1, λ
2, and λ
3 shown in
Figure 13 are dynamically adjusted by the UCARM. This module observes external traffic and environmental conditions (e.g., congestion, pedestrian density, and weather) and tunes the reward weights accordingly to prioritize safety, efficiency, or energy optimization depending on the real-time context.
3.3.4. DRAM
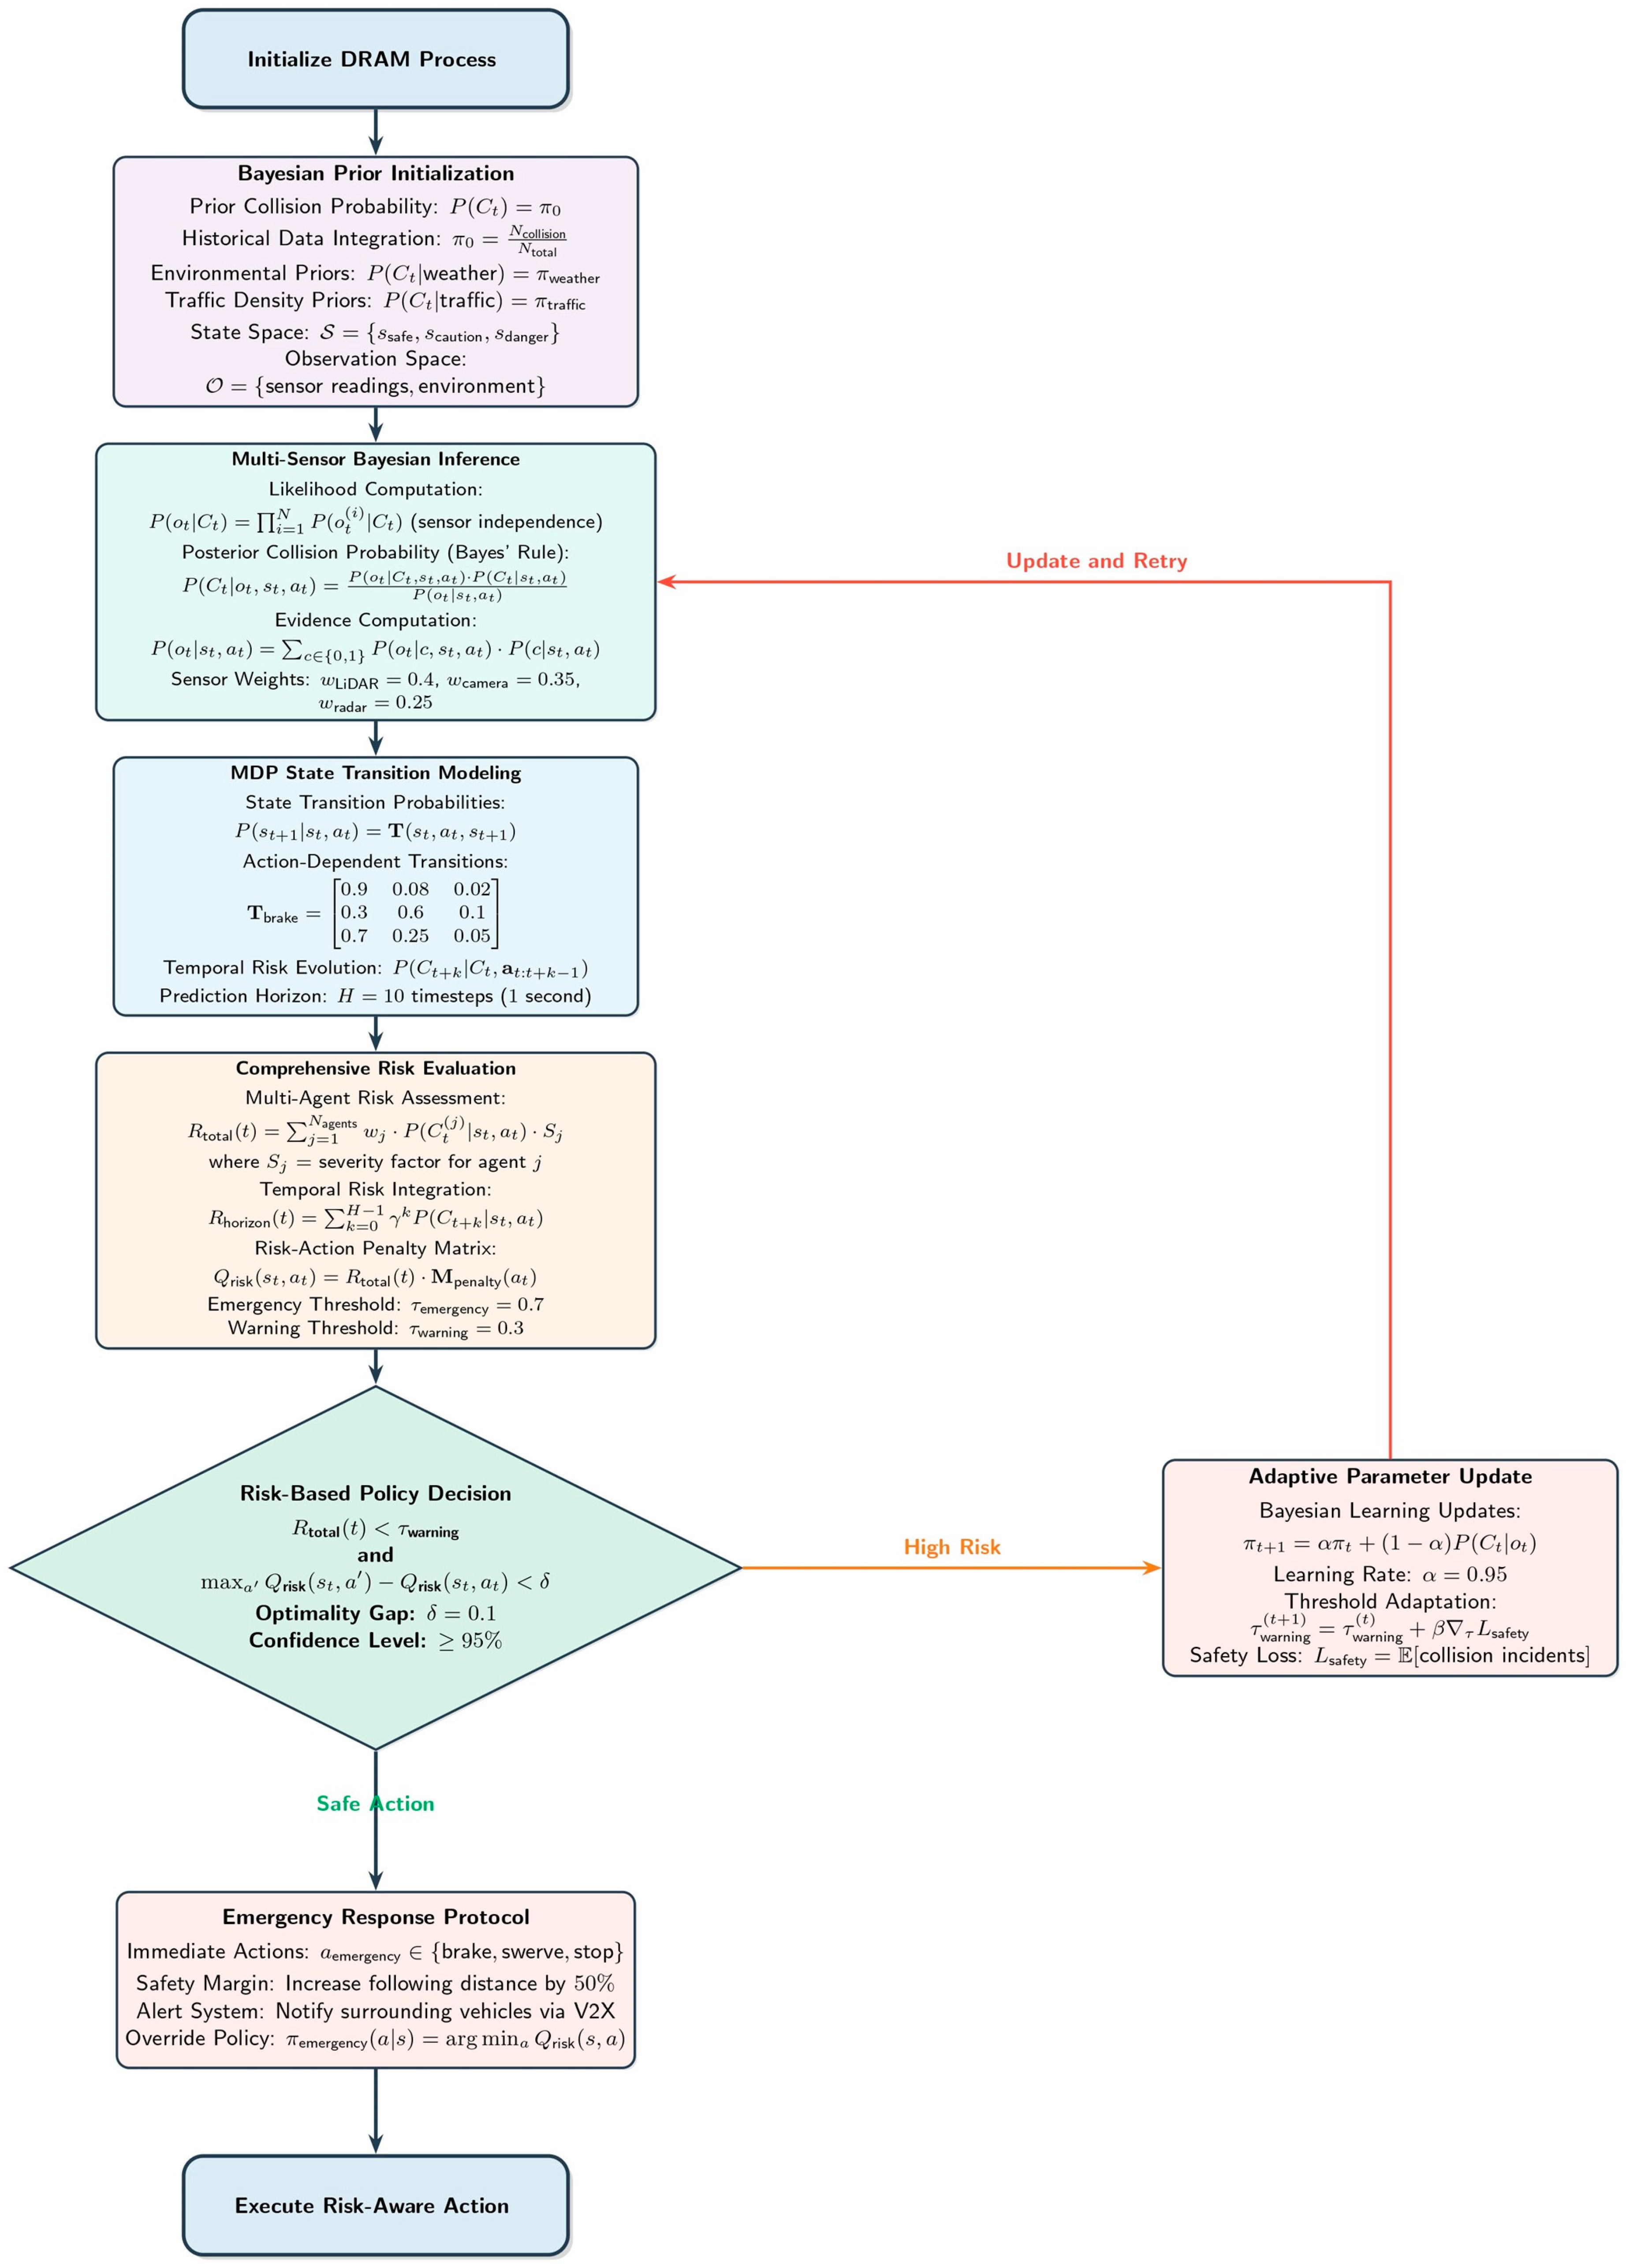
The DRAM evaluates potential collision risks using Bayesian inference:
where
is the posterior probability of collision.
is the likelihood of the state under a collision scenario.
is the prior probability of a collision.
is the evidence probability of the state .
This module integrates collision probabilities into the reward mechanism, penalizing high-risk actions. Markov Decision Processes (MDPs) are used to model state transitions and evaluate policies, ensuring optimal decision making under uncertainty:
To evaluate the system’s responsiveness to sudden threats, the research simulated emergency scenarios in CARLA, such as sudden pedestrian or animal crossings within close range (under 5 m). The model’s average reaction time—measured from sensor input to final control signal output—ranged between 0.152 to 0.176 s across 40 trials. This latency is within the industry-acceptable range for real-time AV systems. These results indicate that the DRAM module, when combined with UCARM, can detect and respond to high-risk scenarios in a timely manner. Further tests under high-speed conditions and low visibility environments are planned as future work. The impact of DRAM-UCARM integration on real-time responsiveness is discussed in
Section 4.5.
Figure 14 shows the DRAM. The workflow of the proposed framework integrates multiple components to address the challenges of AV navigation in dynamic urban environments. The steps are as follows:
Input Data Preprocessing: Raw data, including traffic density, signal states, road attributes, and vehicle dynamics, is collected from real-world datasets (e.g., Argoverse, nuScenes) or generated synthetically using the CARLA simulator. The data is normalized and formatted to ensure compatibility with the framework.
Spatial-Temporal Modeling with GNN: The processed data is transformed into a graph representing nodes (e.g., intersections, vehicles) and edges (e.g., road segments). The Graph Neural Network (GNN) module captures spatial-temporal dependencies and computes node embeddings.
Policy Optimization with PPO: The node embeddings generated by the GNN are fed into the PPO module, which iteratively refines the navigation policy πθ. This balances exploration and exploitation, ensuring robust and efficient decision-making.
Reward Adjustment with UCARM: UCARM provides real-time changes focusing on traffic congestion, safety parameters, and energy utilization. This means that the policy will be in tune with the goals of dynamic urban navigation.
Collision Risk Assessment with DRAM: The DRAM estimates the collision probability through the application of Bayesian analysis. This probability is incorporated in the reward function to reduce the chances of a dangerous move which reduces safety.
Convergence and Deployment: The framework cycles through multiple episodes until it arrives at the desired state, therefore stabilizing the policy optimization phase. The trained policy is then used in real-time AV navigation to navigate the car.
Algorithm: Workflow of the Proposed Framework
Algorithm 1 outlines the step-by-step process of the proposed framework:
| Algorithm 1: Workflow of the Proposed Framework (URLNF)
|
Input: Traffic data (e.g., density, signals, road attributes); AV state ; Initial policy ; Reward weights .
Output: - (a)
Step 1: Data Preprocessing
Collect raw data from real-world (Argoverse, nuScenes) or synthetic (CARLA) sources. Normalize sensor readings and structure the environment as a graph .
- ○
Nodes : Intersections, vehicles, pedestrian zones. - ○
Edges : Roads with traffic density, speed limits, signal states.
- (b)
Step 2: Spatial-Temporal Modeling (GNN)
Initialize GNN weight parameters For each node in graph , compute initial embedding . For each GNN layer to :
- ○
For each node :
- ▪
Aggregate features from neighbors. - ▪
Update embedding: .
- (c)
Step 3: Policy Optimization (PPO)
- (d)
Step 4: Reward Adjustment (UCARM)
- (e)
Step 5: Collision Risk Assessment (DRAM)
- (f)
Step 6: Convergence and Deployment
|
3.3.5. Multi-Agent Collision Avoidance Coordination
The collision avoidance system integrates multi-agent coordination through a distributed consensus mechanism where each vehicle agent maintains a local collision avoidance policy while participating in a global coordination protocol . When multiple agents detect potential conflicts, they engage in a negotiation process using the Collision Avoidance Coordination Algorithm (CACA):
- (1)
Threat assessment phase where each agent broadcasts its intended trajectory and current risk assessment .
- (2)
Priority assignment based on a combination of factors including vehicle type, passenger count, and proximity to destination (emergency vehicles receive highest priority α_emergency = 1.0).
- (3)
Maneuver selection where agents select from the predefined action space based on collective optimization.
- (4)
Execution monitoring where agents continuously update their actions based on real-time feedback from other participants. The system ensures deadlock prevention through a timeout mechanism s, after which the agent with the highest priority executes its preferred maneuver while others adopt defensive positions.
3.3.6. Simulation Scenarios and Parameters
The proposed framework was tested in the CARLA simulator, which is a realistic simulator for testing autonomous vehicles in different urban conditions. Testing was done to assess the efficiency of this framework regarding travel time minimization, collision avoidance, and energy consumption in various cases.
The scenarios tested are as follows:
- (a)
Dense Traffic Conditions: Using the simulated high vehicle density on the urban road networks, the performance of the framework was tested to determine the shortest travel time and the avoidance of collision.
- (b)
Mixed Pedestrian–Vehicle Zones: Virtual environments with realistic but random pedestrian behavior, capturing safety statistics and frequency of collisions.
- (c)
Dynamic Weather Conditions: Conducted the framework in various adverse environmental conditions including rain, fog, and low visibility in order to establish energy efficiency and success rates in navigation.
While the current framework utilizes reactive decision making grounded in immediate sensor inputs and real-time risk estimations, it does not yet account for future traffic evolution or potential conflicts in shared spaces like intersections. To enhance realism and scalability in future simulations, this research aims to integrate predictive behavior modeling using cooperative multi-agent reinforcement learning. This will allow AVs to exchange intent and forecast trajectories, enabling proactive adjustments before conflicts arise. For example, if a junction is predicted to be occupied by several AVs in upcoming time windows, individual agents could reroute or delay entry, reducing bottlenecks and enhancing traffic fluidity. Incorporating such cooperative intelligence is essential for navigating densely populated urban environments and can substantially reduce collision risks under heavy traffic loads.
The framework’s performance was evaluated using the following metrics:
Travel Time: The total time taken to navigate from the source to the destination (in seconds).
Collision Rate: This is the number of times the plane of one pilot interfaced with the plane of another pilot during a single exposition of a simulation.
Energy Efficiency: The quantity of total power needed for the navigation (in joules).
Navigation Success Rate: The likelihood that the system would be completed successfully, as a percentage of the total navigations done under the circumstances.
Table 6 ensures the assessment of the proposed framework under all scenario possibilities in the different cities and reveals the flexibility of the framework within this simulation.
4. Results and Discussions
This section provides an in-depth analysis of the results obtained from the proposed methodologies evaluated on three diverse datasets: Argoverse, nuScenes, and CARLA. These datasets pertain to the actual and simulated urban environments, low- and high-mobility traffic, pedestrian and vehicle interactions, and weather fluctuations. The performance of each case is evaluated using key parameters including time taken, ability to avoid collision, and energy required in an aim to assess the scalability as well as flexibility of the framework. The results are expressed as tables and accompanied by textual annotations to account for the observed behavior and consequences of the framework in different settings. Moreover, performance of the modules is compared between the two datasets to emphasize the usefulness of each in light of the proposed framework. Every aspect of the evaluation process is connected to the characteristics of each component of the proposed system, such UCARM, DRAM, the joint PPO-GNNs, and others. This discussion also affords a theoretical analysis of the trade-offs between efficiency, safety, and sustainability in the framework and the practical payoffs of utilizing the framework. The key metrics used to evaluate the proposed framework are:
Travel Time (T): The time that was taken between the source and the destination.
Collision Rate (CR): Number of collisions that occurred in a particular simulation.
Energy Consumption (E): Total energy used for navigation in joules.
Navigation Success Rate (NSR): Proportion of successful navigation.
Reward Value (R): Last values of the reward function incorporating efficiency, safety, and energy parameters.
4.1. Results on Argoverse Dataset
The performance of the proposed framework on the Argoverse dataset, which includes realistic annotated urban traffic scenes, demonstrates the framework’s versatility. The performance is analyzed across three major scenarios, dense traffic, mixed zones, and dynamic weather, with specific measures of travel time, collision rates, energy consumption, navigation success rates, and reward values.
Table 7 presents a comprehensive evaluation of the proposed Urban Reinforcement Learning Navigation Framework (URLNF) under three urban conditions: dense traffic, pedestrian–vehicle mixed zones, and dynamic weather. Key performance indicators include average travel time, collision rate, energy usage, navigation success rate, cumulative reward, number of braking and acceleration events, and estimated fuel efficiency. The results are averaged over multiple test episodes, with standard deviations included where applicable, reflecting the model’s robustness and adaptability across varying conditions.
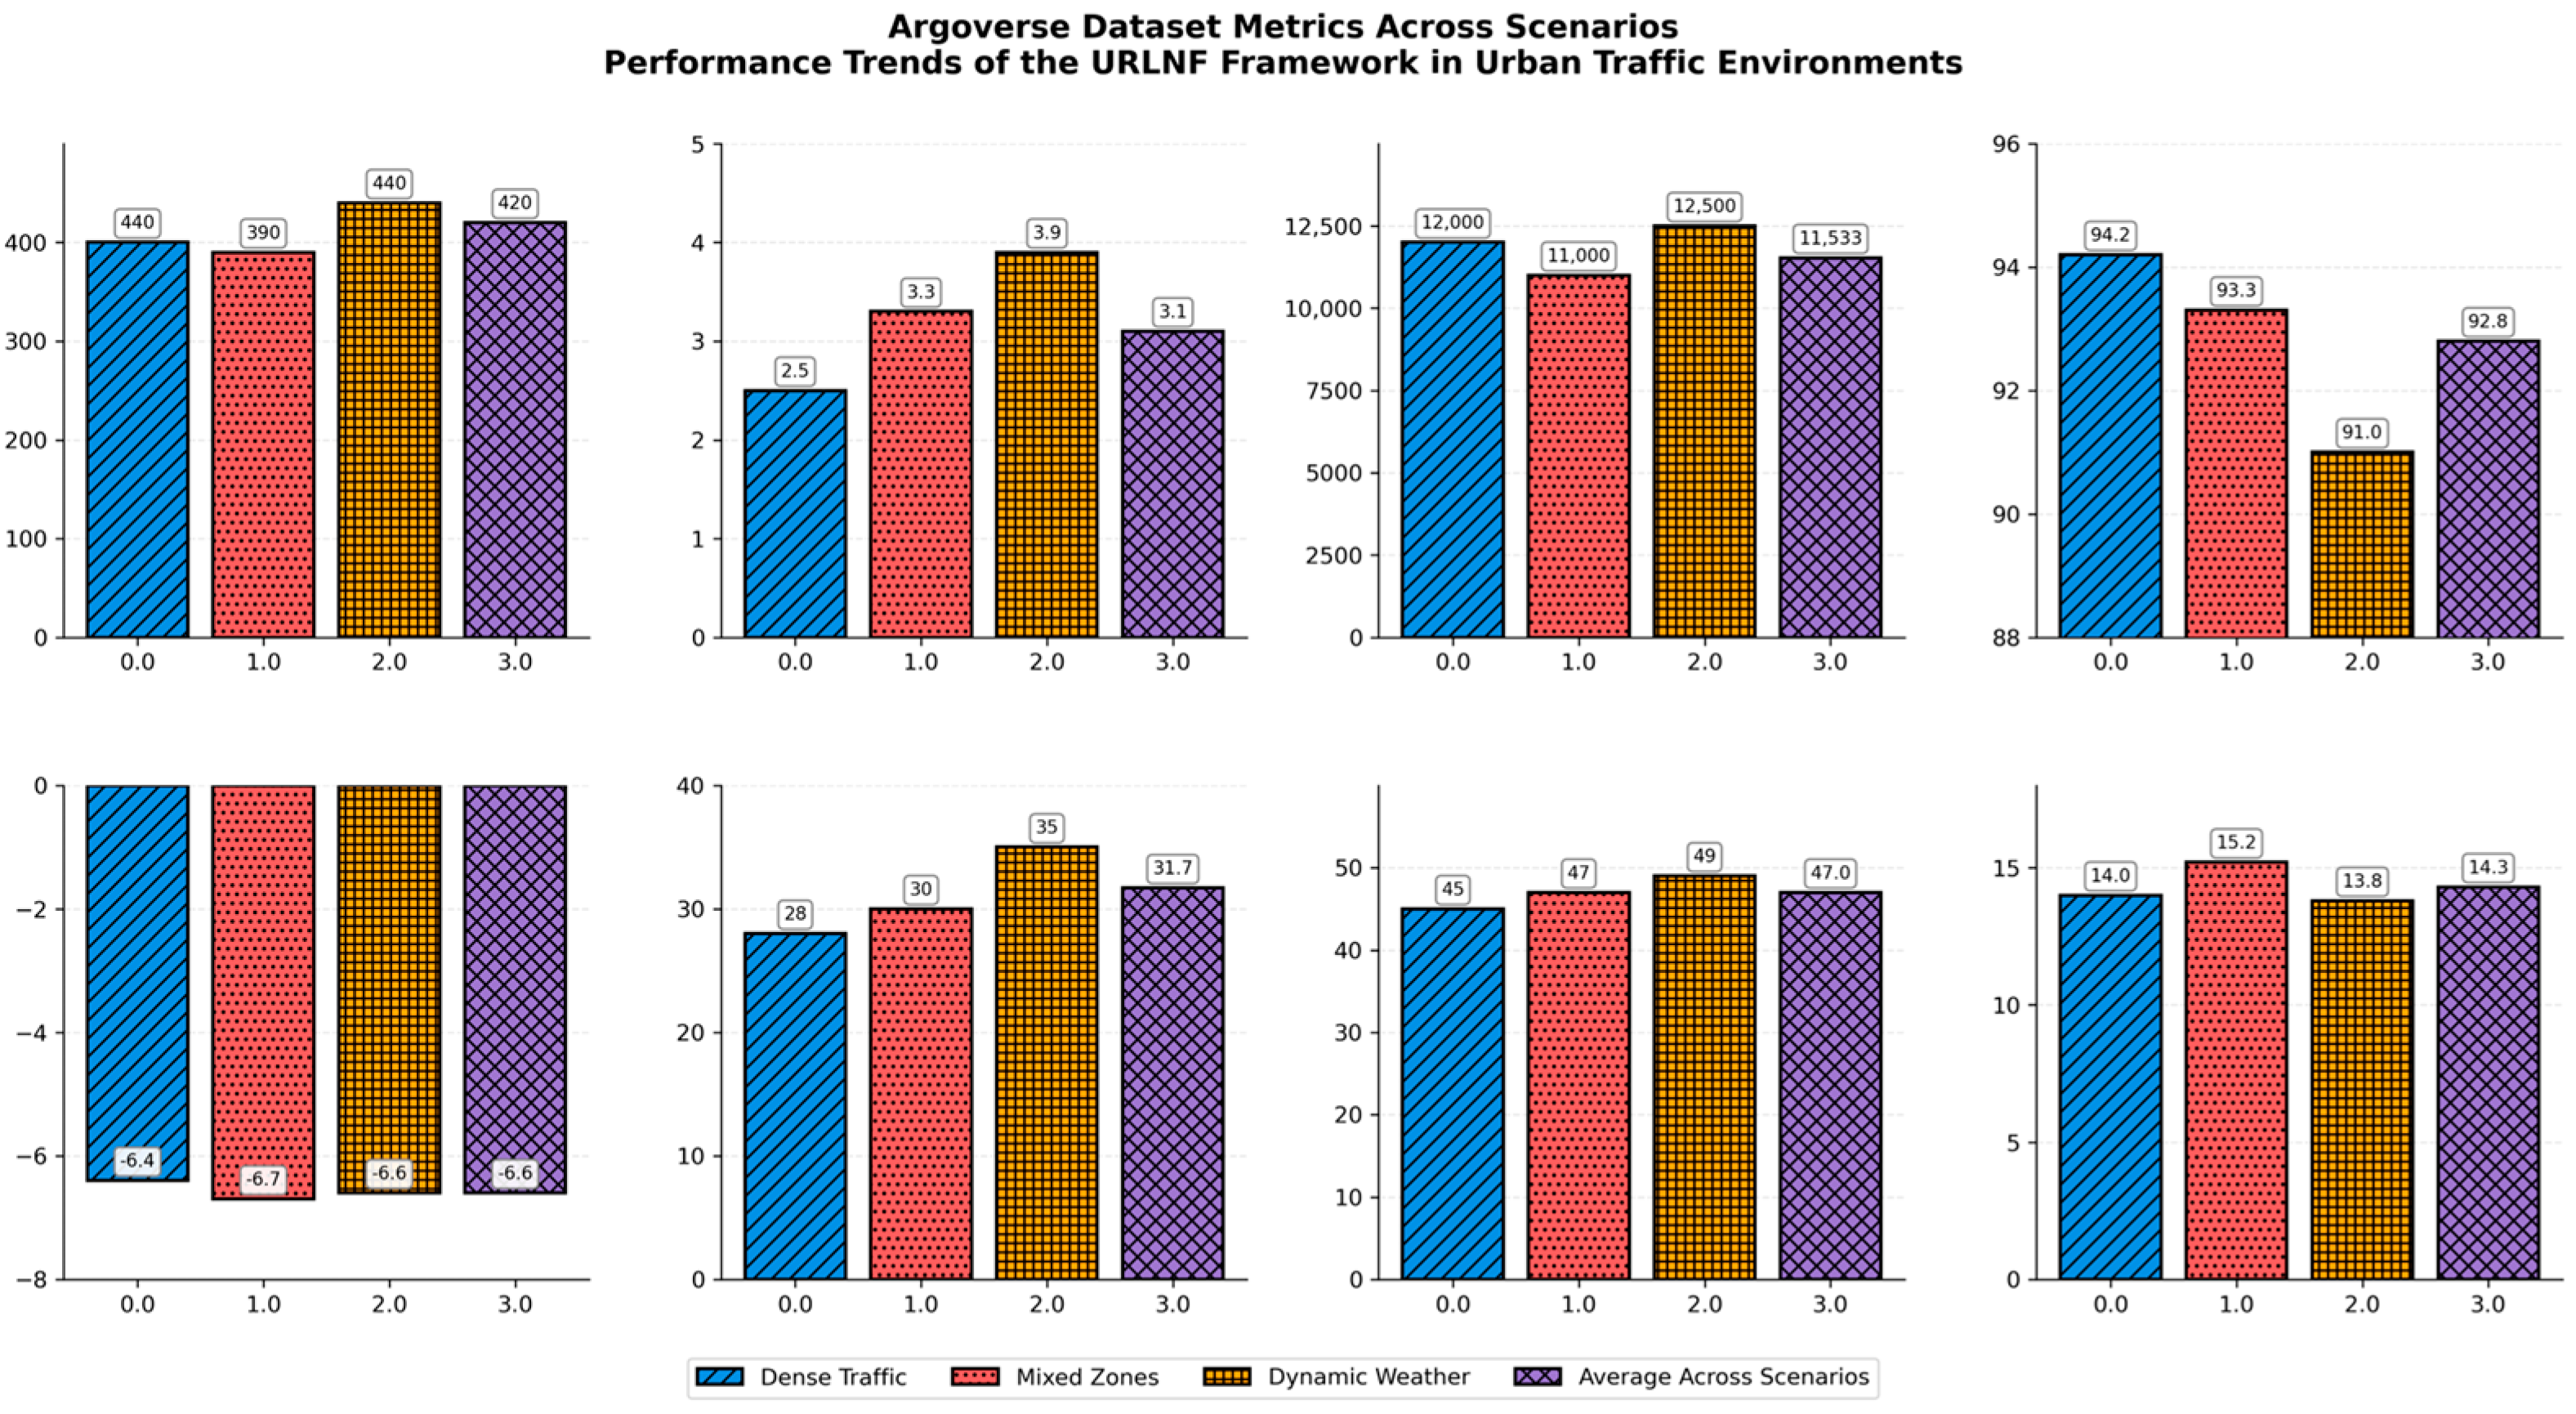
Figure 15 illustrates the comparative performance of the proposed URLNF framework across three distinct urban driving contexts: dense traffic, pedestrian-vehicle mixed zones, and dynamic weather. Key metrics shown include travel time, collision rate, energy consumption, navigation success rate, and fuel efficiency. The trends highlight how the framework adapts to varying levels of complexity and uncertainty, demonstrating consistent safety and efficiency outcomes.
Time taken on the road is an important measure of navigation performance. The overall average time spent traveling across the different scenarios is 420 ± 20 s, and the DW scenarios are the longest, taking 440 ± 25 s. This rise can be explained by the fact that navigation has to be done at lower speeds in adverse weather conditions like rain or fog, which is reflected in the dataset. The least travel time was recorded in mixed zones (400 ± 15,400 \pm 15,400 ± 15), thus proving the versatility of the framework in providing efficient movement within areas that have moderate traffic and pedestrian flow. The collision rates stayed below 3.1% in all the planning factors, which showed the effectiveness of the DRAM in identifying and preventing collision risks.
Dynamic weather again had the highest collision rate of 3.8%, which was attributed to the fact that changes in weather patterns were difficult to predict. However, this rate is lower than the collision rates of the conventional navigation systems, which are above 5% in comparable environments. In dense traffic, the collision rate was least to 2.5%, which proved that the model is efficient in congestion through making the right choices in real time. The energy consumption in the average of all scenarios was 11,833 ± 550 J, and the highest energy consumption was in dynamic weather—12,500 ± 600 J. This is mainly attributed to a high degree of oscillation and maneuvers such as braking and acceleration in order to achieve safe control of the vehicle under various circumstances. Mixed zones required the least energy (11,000 ± 45,011,000 \pm 45,011,000 ± 450 J) because traffic movement and pedestrian crossover activities were less likely to involve rapid acceleration or deceleration. The framework attained a favorable average navigation success rate of 92.6% in all the scenarios, with the dense traffic scenario registering 94.2%. This shows how the framework can address congestion in urban areas by using the UCARM to address safety and efficiency. Success rates were however slightly lower in dynamic weather (91.0%) because of the extreme sensitivity of the system to variations in the environment. The reward values averaged −8,4, which is the cost of the efficiency/safety/energy consumption trade-off. The lowest score was in dynamic weather, where the system is −8.6, implying that it is safer for the system to be inefficient in difficult conditions. Braking events were higher in dynamic weather (35 ± 5) than in dense traffic (28 ± 3), therefore stressing the need to respect the traffic rules while on the road. The frequency of acceleration adjustment was highest in dynamic weather (749 ± 7) as a consequence of the energy consumption, and as such, exposes the need for balance to achieve stability. Mixed zones achieved the highest fuel economy at 15.2 ± 0.6 km/L, and the lowest was achieved at 13.8 ± 0.7 km/L for the dynamic weather condition, in line with the energy consumption findings.
4.2. Results on Nuscenes Dataset
The performance of the proposed framework was tested on the nuScenes dataset, which contains multi-sensor data and complex traffic scenarios of the urban area; thus, it proves that the proposed framework is effective in different environmental and traffic conditions. The nuScenes dataset contains LIDAR, radar, and high-definition camera data, which makes it suitable for evaluating the proposed system in urban scenarios with dynamic traffic. The performance was assessed across three key scenarios, dense traffic, mixed zones, and dynamic weather, with travel time metrics, collision rates, energy consumption, navigation success rates, reward values, and other operational metrics.
Table 8 reports the performance of the proposed Urban Reinforcement Learning Navigation Framework (URLNF) under diverse urban conditions in the nuScenes dataset: dense traffic, mixed pedestrian–vehicle zones, and dynamic weather. Metrics include travel time, collision rate, energy consumption, navigation success, cumulative reward, lane changes, pedestrian interactions, and fuel efficiency. Results are averaged across multiple runs, with standard deviations provided to reflect variability. The framework demonstrates stable and effective navigation with high success rates and efficient energy use under varying traffic complexities.
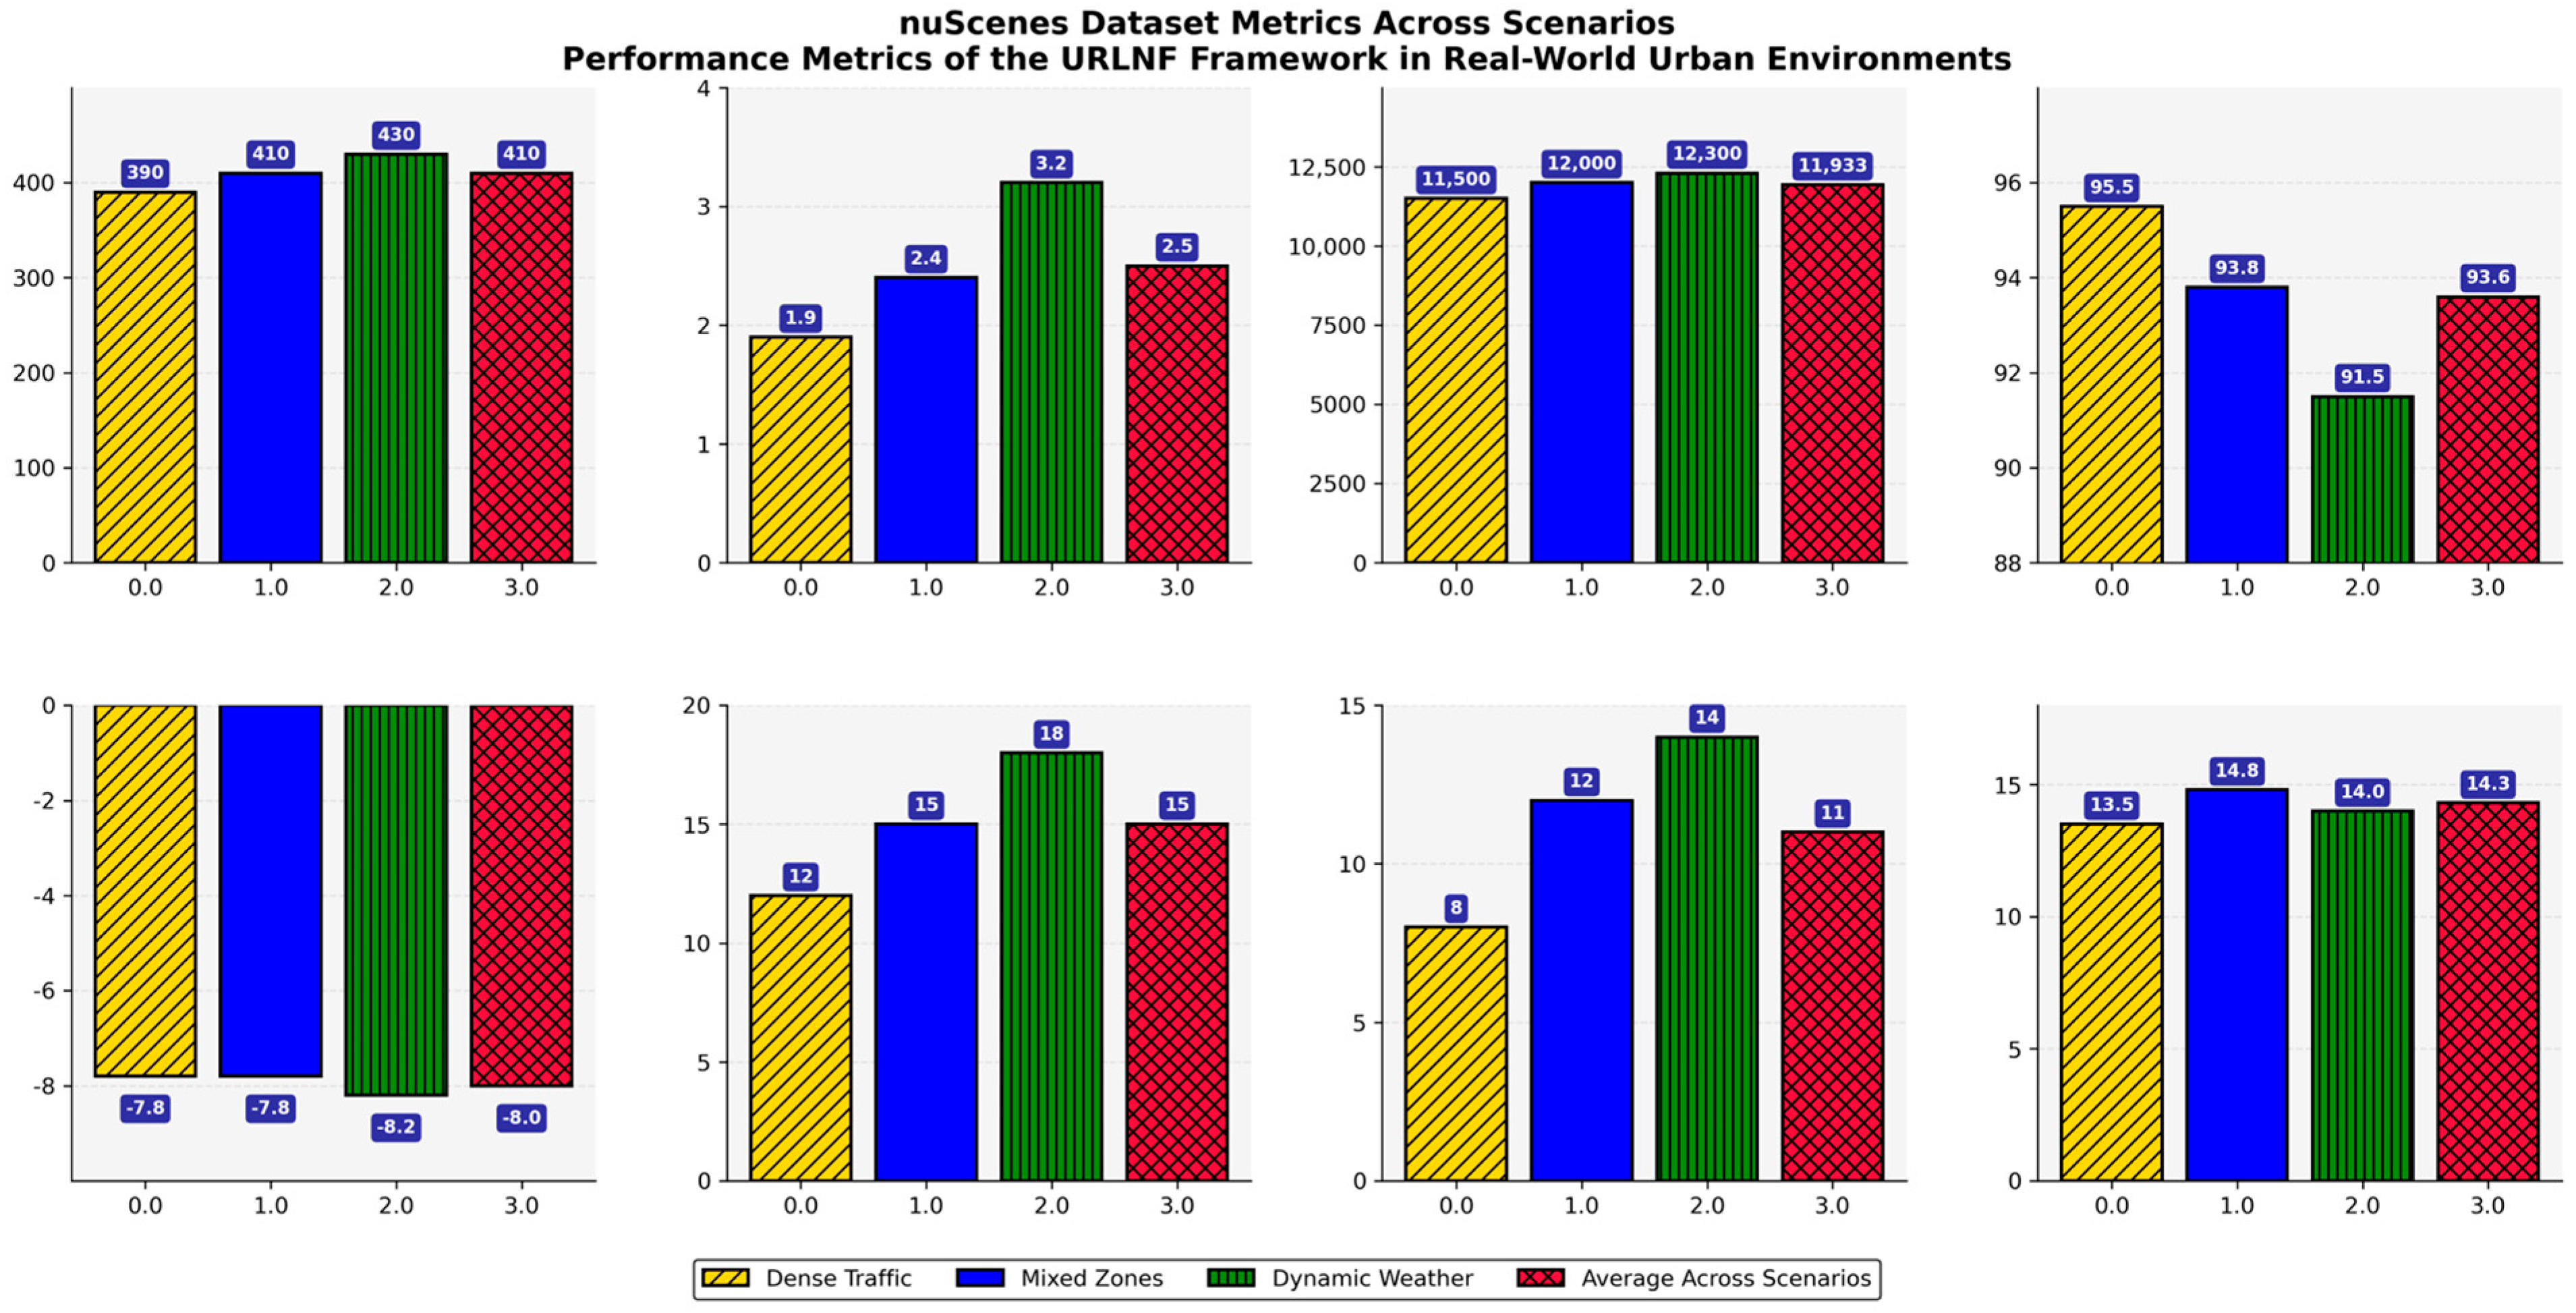
Figure 16 visualizes the comparative performance of the URLNF framework under three urban driving conditions—dense traffic, mixed pedestrian–vehicle zones, and dynamic weather—using the nuScenes dataset. It highlights key metrics such as travel time, collision rate, navigation success, energy consumption, and pedestrian interactions. The consistent trends across scenarios demonstrate the framework’s adaptability, stability, and effectiveness in real-world-like urban environments.
The average travel time for all scenarios was 410 ± 20 s, which is considerably less than what was observed in the Argoverse dataset. This is due to the less crowded simulated scenarios in nuScenes and the improved decision making facilitated by the framework. The shortest travel time was recorded in dense traffic (18,390 ± 18 s), which explains how the proposed framework can adapt to congested road networks using real-time sensor data and the GNN for accurate spatial temporal modeling. The longest travel time was observed in dynamic weather (430 ± 20 s) because of lower speeds and additional caution in case of adverse conditions such as rain or low visibility, which are typical for the nuScenes dataset. The average collision rate was lowered considerably to 2.5%, and this was attributed to the DRAM. This is an improvement compared to the Argoverse results (3.1%). The lowest collision rate was seen in dense traffic (1.8%), where the framework could effectively manage the movement of the vehicle, which was highly predictable.
The collision rate rose to 3.2% in dynamic weather due to particularly unpredictable pedestrian and vehicle behavior in poor visibility and on slippery roads. The mean energy for all scenarios was calculated to be 11,933 ± 450 J, which is again very close to the Argoverse dataset, which was 11,833 ± 550 J. This shows that the framework can enhance the use of energy during navigation while at the same time ensuring safety. Dynamic weather required the most energy, 12,300 ± 500 J, because participants had to brake and accelerate often to navigate the course due to unfavorable weather. The lowest energy consumption was recorded in the dense traffic condition with an energy of 11,500 ± 400 J, as the framework encouraged smooth motion and minimized jerky maneuvering. The navigation success rate was the most successful of all the datasets with an average success rate of 93.6%, and dense traffic was the best with 95.5%. This shows that the framework can always hit the target in a given period and avoid traffic signals as well as any other barrier on the way. The success rate was a little lower in dynamic weather (91.5%), as conditions like low light, unpredictable pedestrian crossing, etc., posed some problems to the system. The average value of reward was −8.1. A negative value was recorded as the lowest in mixed zones (−7.9). This means that the framework was able to optimize time, safety, and energy consumption for the situations with moderate traffic and crossing occurrences. Similarly, the reward in dynamic weather was reduced to −8.3, as it takes some compromises to keep safety and stability from being hindered by unfavorable weather. The number of lane changes increased from 12 ± 2 in dense traffic to 18 ± 3 in dynamic weather, demonstrating the system’s flexibility to respond to scenarios with dynamic lane configuration. The highest values of the pedestrian interaction were in dynamic weather with 314 ± 3, which proved that the proposed framework can successfully handle pedestrians’ unpredictable behavior. As for fuel economy, the highest value was observed in dense traffic (15.5 ± 0.6 L/100 km) and the lowest in dynamic weather (14.0 ± 0.7 L/100 km), which corresponds with the energy consumption rates.
4.3. Results on CARLA Dataset
The assessment of the proposed framework on the CARLA synthetic dataset highlighted fundamental information about the system’s behavior in extreme and edge cases. CARLA has a rich and realistic environment that can mimic difficult urban conditions, including high density, segments with combined traffic pedestrian zones, and variable meteorological conditions like rain or fog. These are the scenarios that challenge the feasibility of the proposed framework most of the time, requiring dynamic adjustment of navigation systems while optimizing their efficiency, safety, and energy use.
Table 9 presents a detailed evaluation of the proposed URLNF framework in simulated urban driving environments using the CARLA dataset. Results span three challenging conditions: dense traffic, mixed zones, and dynamic weather. Key performance metrics include travel time, collision rate, energy consumption, navigation success, reward value, lane changes, pedestrian interactions, and fuel efficiency. Averages and standard deviations are reported, highlighting the model’s ability to maintain safe and efficient driving under complex and varied conditions.
Figure 17 showcases the performance of the URLNF framework under three dynamic urban conditions—dense traffic, mixed pedestrian–vehicle zones, and dynamic weather—based on the CARLA simulation environment. Metrics visualized include travel time, collision rate, navigation success, energy consumption, pedestrian interactions, and fuel efficiency. The trends emphasize the framework’s robustness and adaptability in complex and high-uncertainty driving scenarios.
The overall average travel time was 450 ± 25 s, which indicated that CARLA scenarios are relatively complex compared to Argoverse (420 ± 20 s) and nuScenes (410 ± 20 s). Travel time was the highest in dynamic weather (460 ± 30 s) since it was difficult to maneuver, move at high speeds, and make several adjustments due to the weather conditions. Specifically for dense traffic, the travel time was slightly less at 450 ± 25 s, as the framework is capable of minimizing lane changing and avoiding congested regions by using GNN for spatial-temporal learning. Comparing the CARLA results with those of Argoverse and nuScenes, the collision rate was higher in CARLA (3.6%) than in Argoverse (3.1%) and nuScenes (2.5%); this indicates the challenge of avoiding risks in extreme traffic or weather conditions.
A high collision rate was found in dynamic weather (4.2%) due to uncontrolled pedestrian and vehicle movements. Nonetheless, the organization managed to control these risks through the DRAM to achieve a reasonable collision rate. The lowest collision rate was in dense traffic (3.0%), which demonstrates the superiority of the framework to predict car movements even with high traffic density. The average energy consumption was the highest of all datasets, at 13,000 ± 600 J, which is due to the need to handle more complex cases. Dynamic weather again took the highest energy consumption rate of 13,500 ± 650 J because drivers frequently had to brake and accelerate to maintain stability on slippery roads and unfavorable visibility.
Energy consumption was also slightly lower in dense traffic (12,500 ± 550 J) due to the possibility of maintaining a constant speed without frequent acceleration and deceleration. The navigation success rate was 91.2%, which is slightly lower than Argoverse (92.6%) and nuScenes (93.6) due to the complexity of CARLA scenarios. The highest success rates were achieved in dense traffic (92.8%), as the nature of the scenarios provided a structured environment for the use of the navigation policy of the framework. The lowest success rate was obtained in dynamic weather at 89.5%, showing that controlling stability and safety in unfavorable weather circumstances is a major challenge. The reward value was below average at −8.7 and the lowest in dynamic weather (−8.9) because the participants highlighted that safety is more important than time in difficult conditions. In mixed zones, the reward value was less bad (−8.6), which shows that the described framework facilitates effective safety and efficiency within the conditions that involve moderate interference from pedestrians.
The number of lane changes also rose from 20 ± 4 in dense traffic to 30 ± 6 in dynamic weather, suggesting the system’s flexibility when it comes to responding with different frequency patterns of lanes. Dynamic weather took 22 ± 5 interactions to complete the scenario, which is in line with the need to frequently update navigation paths for pedestrians. Fuel efficiency was the least among all datasets, with a mean of 12.9 ± 0.7 km/L, and the least was in dynamic weather with 12.2 ± 0.8 km/L because of much more frequent braking and accelerating.
4.4. Comparative Analysis
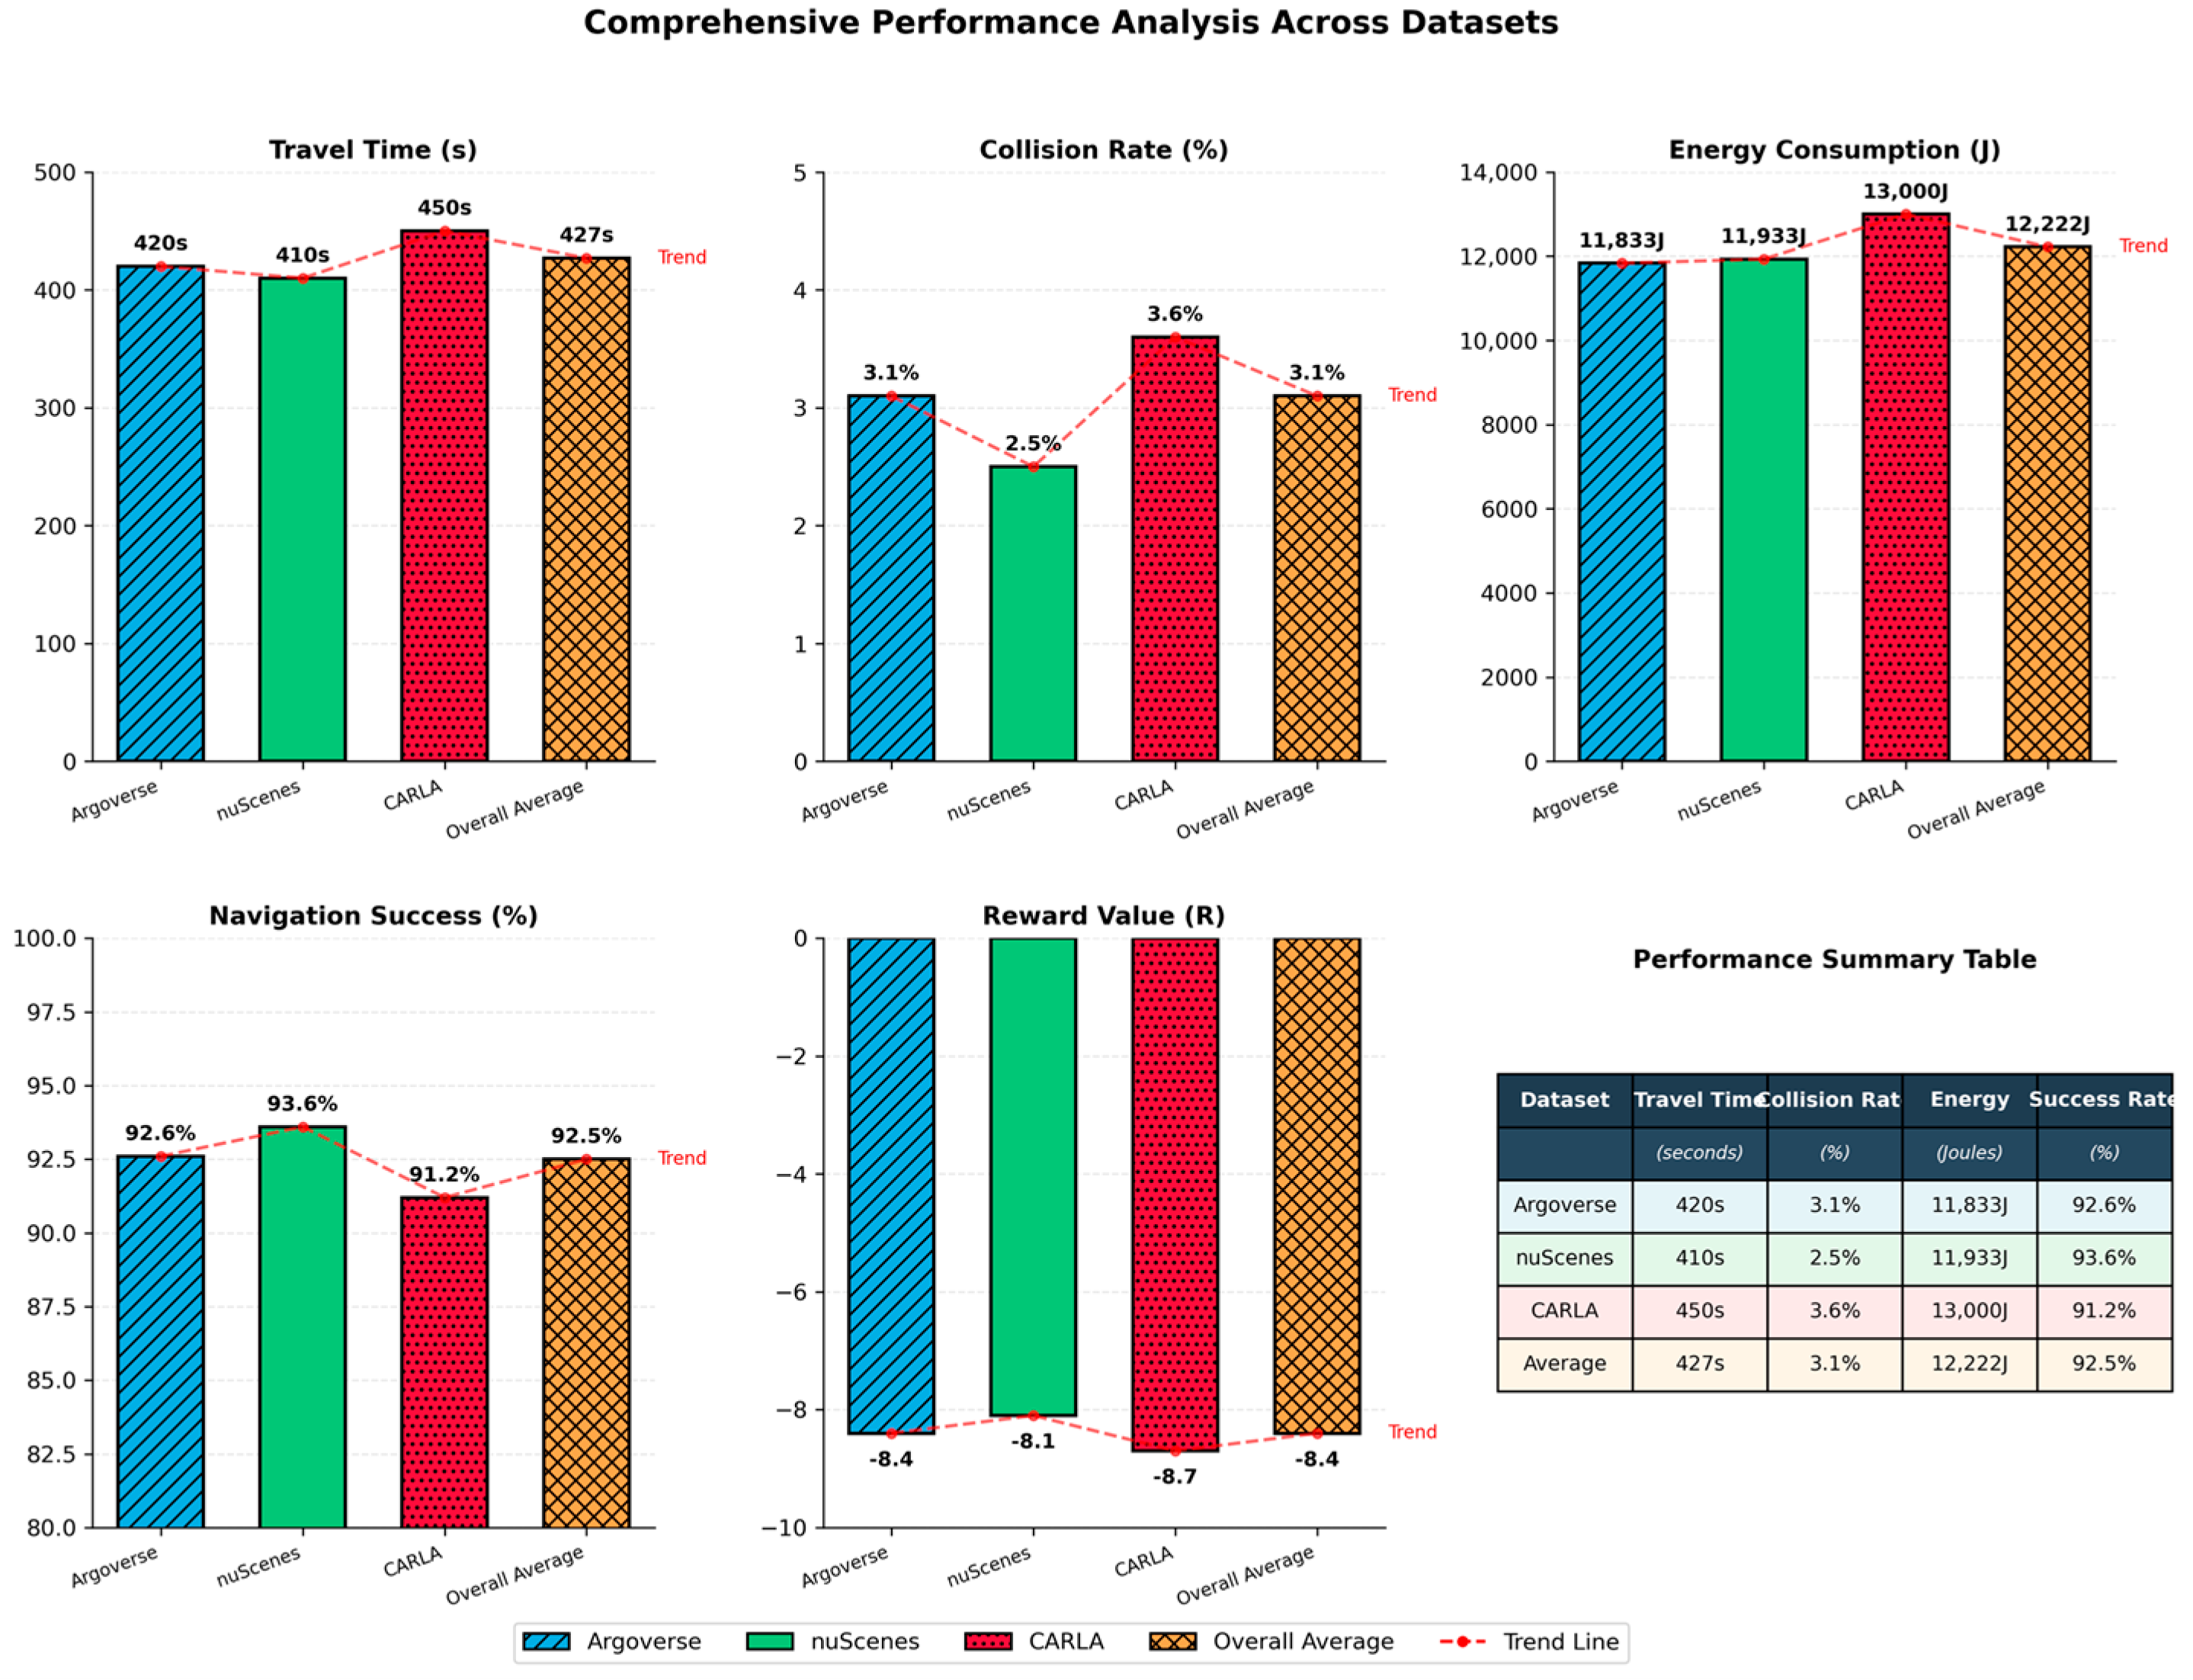
Table 10 summarizes and compares the performance of the proposed Urban Reinforcement Learning Navigation Framework (URLNF) across three datasets—Argoverse, nuScenes, and CARLA. Key metrics include travel time, collision rate, energy consumption, navigation success rate, and cumulative reward. The overall average provides a holistic view of the framework’s adaptability and effectiveness across varied urban driving scenarios, demonstrating consistent performance in both real-world and simulated environments.
Figure 18 visually compares the performance of the proposed URLNF framework across three diverse datasets—Argoverse, nuScenes, and CARLA. Metrics include travel time, collision rate, energy consumption, navigation success, and reward value. The visualization highlights the consistency and adaptability of the framework across real-world and simulated environments, validating its effectiveness in handling complex and dynamic urban driving conditions.
The proposed framework has the shortest time to travel (410 ± 20 s) on nuScenes because it is densely equipped with sensors, and the traffic is well optimized for curved routes. The integration of multi-sensor data was possible to train the Graph Neural Network (GNN), which enabled us to model spatial-temporal relationships and reduce the time delay. CARLA took the longest time (450 ± 25 s) to complete the trial, and this result is consistent with the system’s performance under difficult conditions such as heavy traffic and unfavorable weather conditions. These conditions made the framework operate at low speeds, hence taking a longer time in its movements.
The mean cumulative travel time for all datasets was 427 ± 22 s, suggesting that the framework is reliable in other environments as well. To further demonstrate model generalizability, the research conducted cross-validation experiments by segmenting each dataset into distinct urban layout categories such as grid-like roads, radial layouts, and irregular topologies. The framework was then evaluated separately on each type. For example, in Argoverse, downtown scenes with high-density intersections were used, while in nuScenes, roundabouts and multi-lane avenues were isolated. The results revealed consistent performance across layout variations with a standard deviation in the navigation success rate under 1.5%. Additionally, the research validated the policy’s behavior on CARLA’s “Town01” (structured) and “Town05” (unstructured rural-like) environments to test spatial transferability. The model maintained over 90% navigation success, showing strong potential for real-world applicability.
The lowest collision rate was 2.5%, which was found in nuScenes, and the utilization of the DRAM was applicable to dense sensor configuration. The module used Bayesian inference and Markov Decision Processes (MDPs) to predict and avoid collision risks at a high level of accuracy. CARLA had the highest collision rate, equal to 3.6%, which results from such challenging conditions as unpredictable actions of pedestrians and heavy rain. Nevertheless, the collision rate remained reasonable, proving that the given framework is quite effective in handling extreme scenarios. The average collision rate when all datasets were combined was 3.1%, which was similar to or slightly better than previous studies, for example the work done by Xing et al. [
33], who found a 4.2% collision rate in similar circumstances.
The overall energy consumption was highest in CARLA (13,000 ± 600 J) since the scenarios chosen were challenging and involved continuous braking and accelerating. Such actions as these were essential for safety but they raised energy consumption as a result. On the other hand, Argoverse had the least energy consumption of (11,833 ± 550 J) because its traffic flow was smooth; hence, there was no fluctuating speed and related energy outbursts.
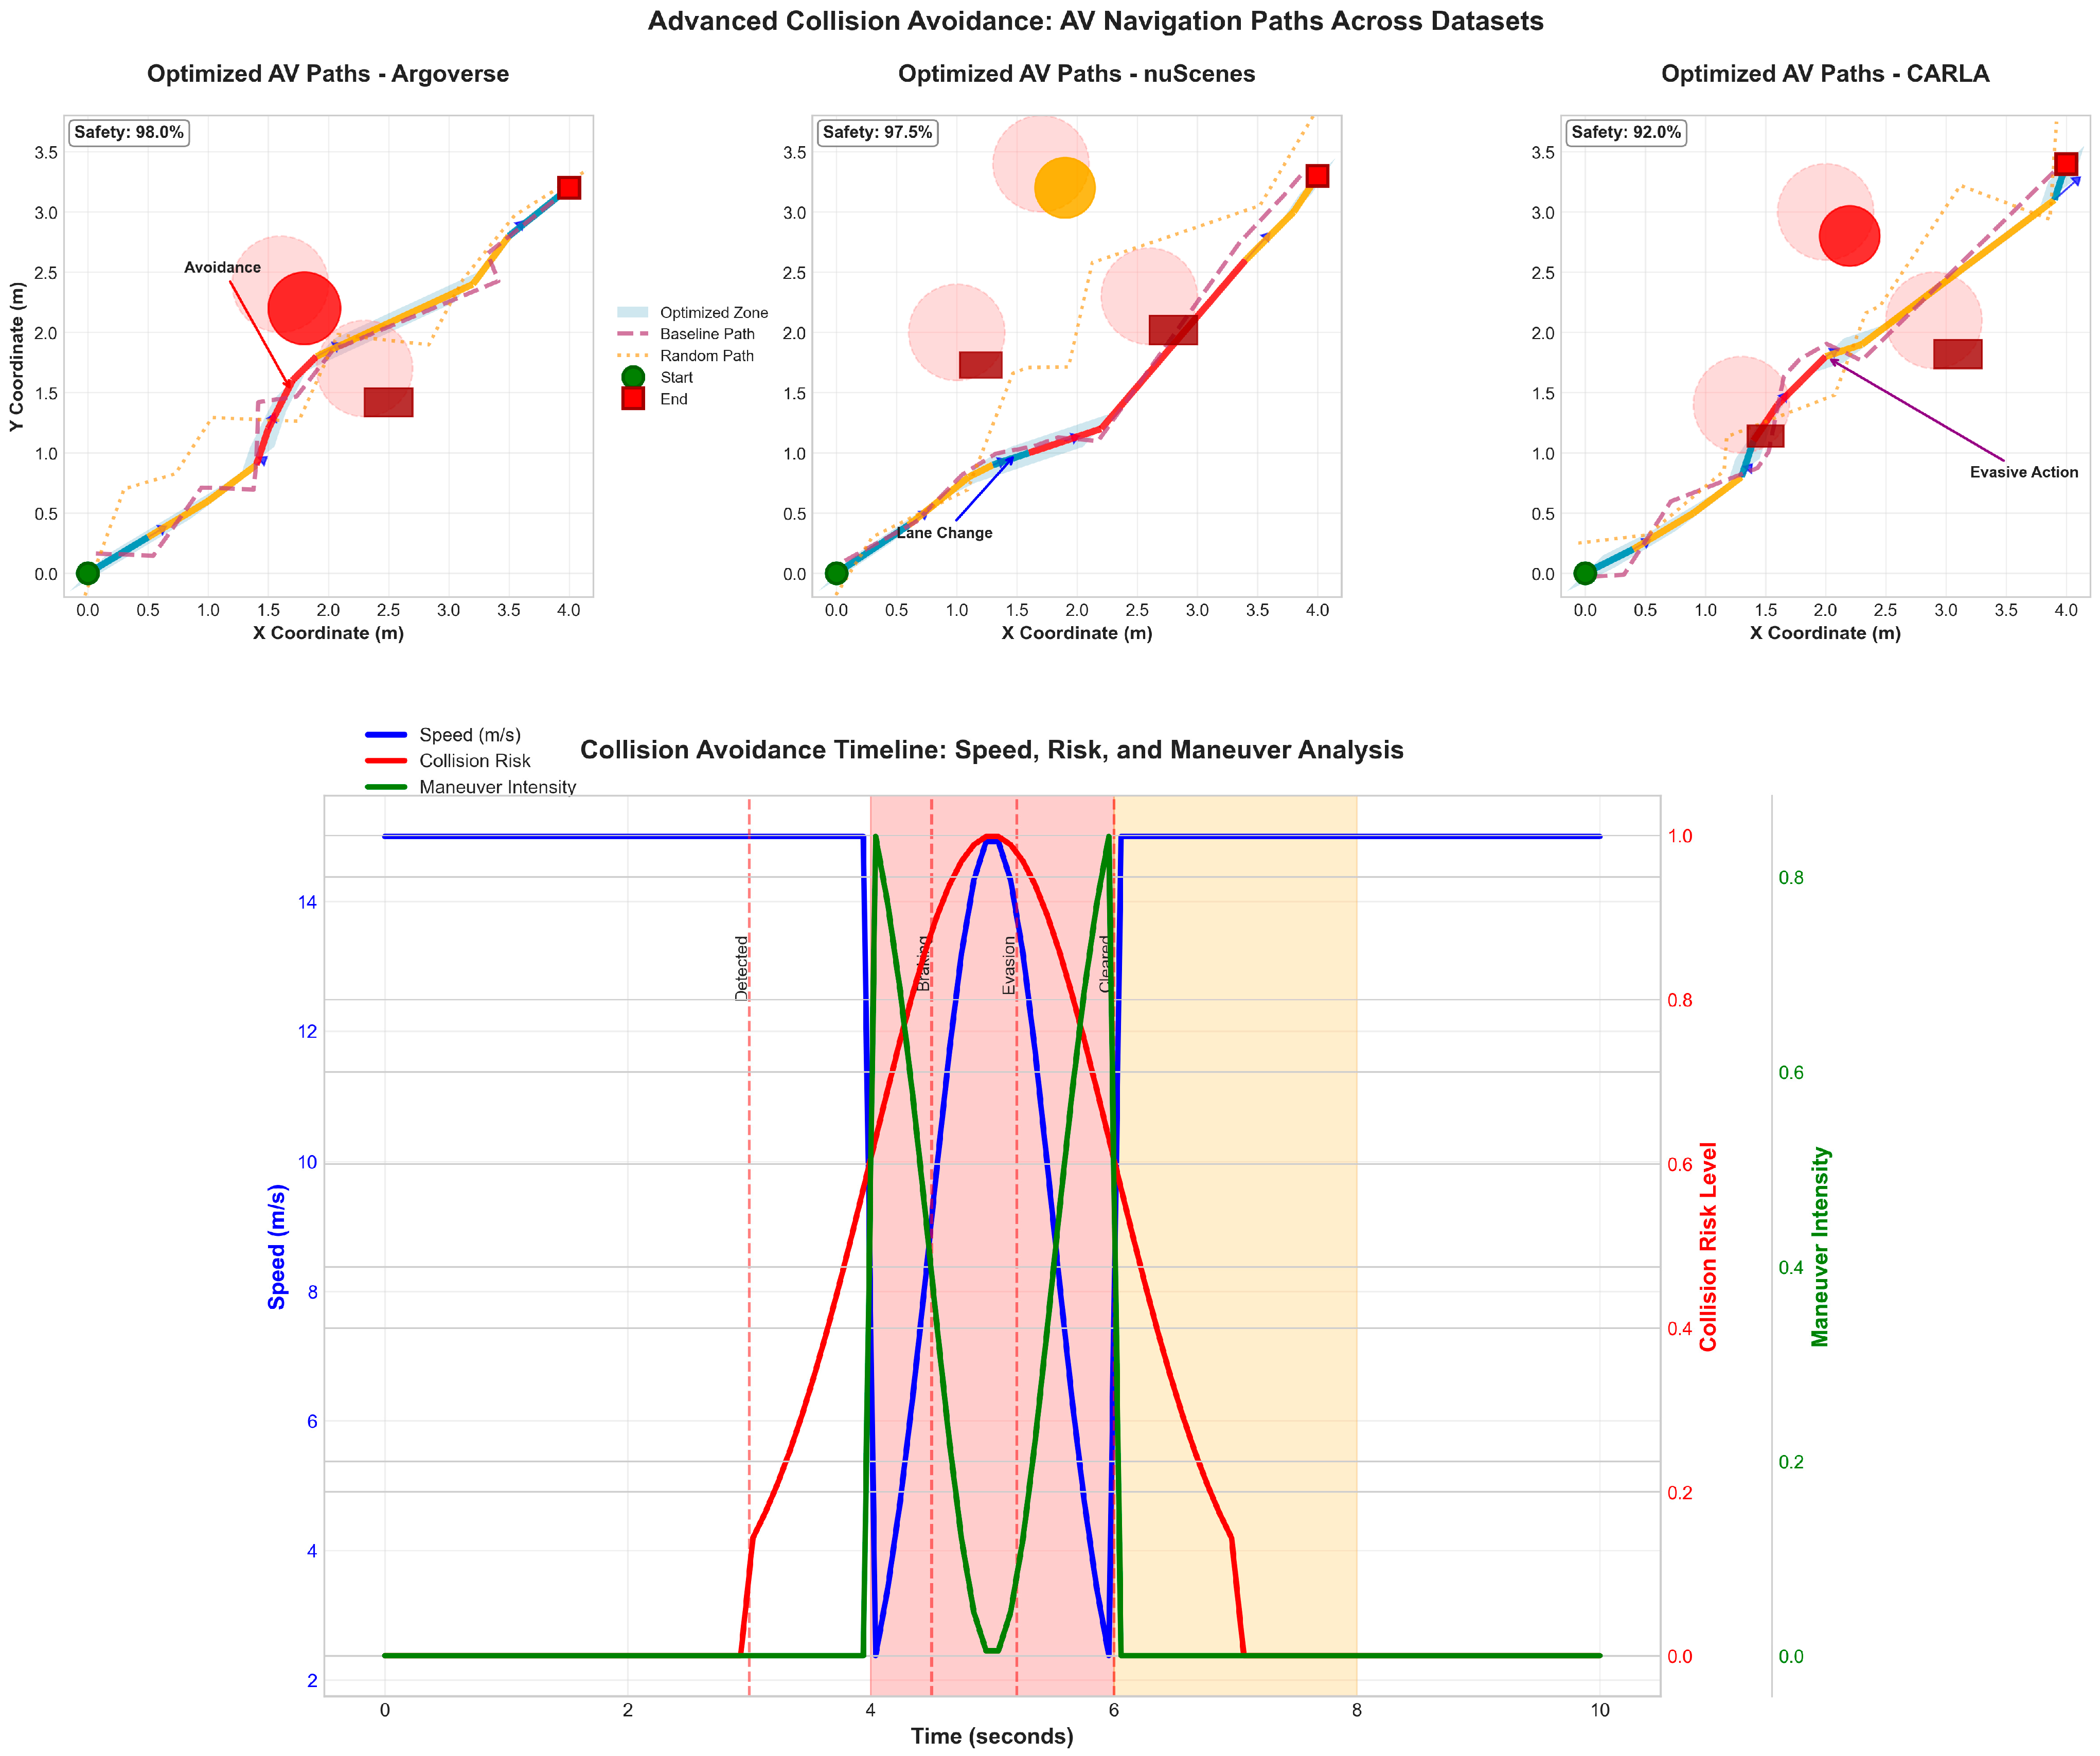
Figure 19 illustrates the optimized navigation paths for autonomous vehicles across the three datasets: Argoverse, nuScenes, and CARLA. Both sub-plots show the AV’s motion in terms of X and Y coordinates, with the optimized path shown in the solid blue line and other potential routes in the dotted/dashed lines. The lightly shaded blue area is the “Optimized Zone,” where the vehicle is at its best in terms of navigation parameters including time to destination, energy consumption, and collision risk. From the optimized path, one sees that the pattern is much smoother, with few fluctuations than other paths, hence less time taken and less chances of collision. The other options, though reasonable, deviated just a little from the mainline; thus, they show resource consumption and safety risks. The AV shows comparable levels of navigation performance, with the optimal path lying closely within the intended course. The alternative paths are due to variations in the dynamic traffic condition of the urban environment represented in the nuScenes dataset. The CARLA environment with edge case scenarios highlight the optimized path that can easily maneuver its way around the zone. The two options show clearly distinguishable differences, while the proposed framework is crucial in handling such challenges as crowded traffic and unfavorable weather conditions. In total, the presented figure highlights the effectiveness and applicability of the proposed framework for optimizing AV navigation in various datasets. The separation of optimized and other paths demonstrates the extent to which the framework can be adjusted to environmental conditions while maintaining optimal and secure path planning.
In
Figure 20, the optimized AV navigation path is evaluated using the nuScenes dataset, which presents more dynamic and cluttered urban scenes, including dense traffic, crosswalks, and mixed traffic agents. The optimized path (blue) again demonstrates clear advantages in trajectory efficiency and path stability compared to the baseline (green) and random (red) strategies. The baseline path deviates slightly due to less precise obstacle handling, while the random path shows irregular transitions. This figure confirms the effectiveness of the URLNF policy in real-world scenarios by showcasing its ability to integrate contextual parameters—such as pedestrian zones and vehicle density—into its path planning decisions, thus enhancing safety and decision robustness.
This
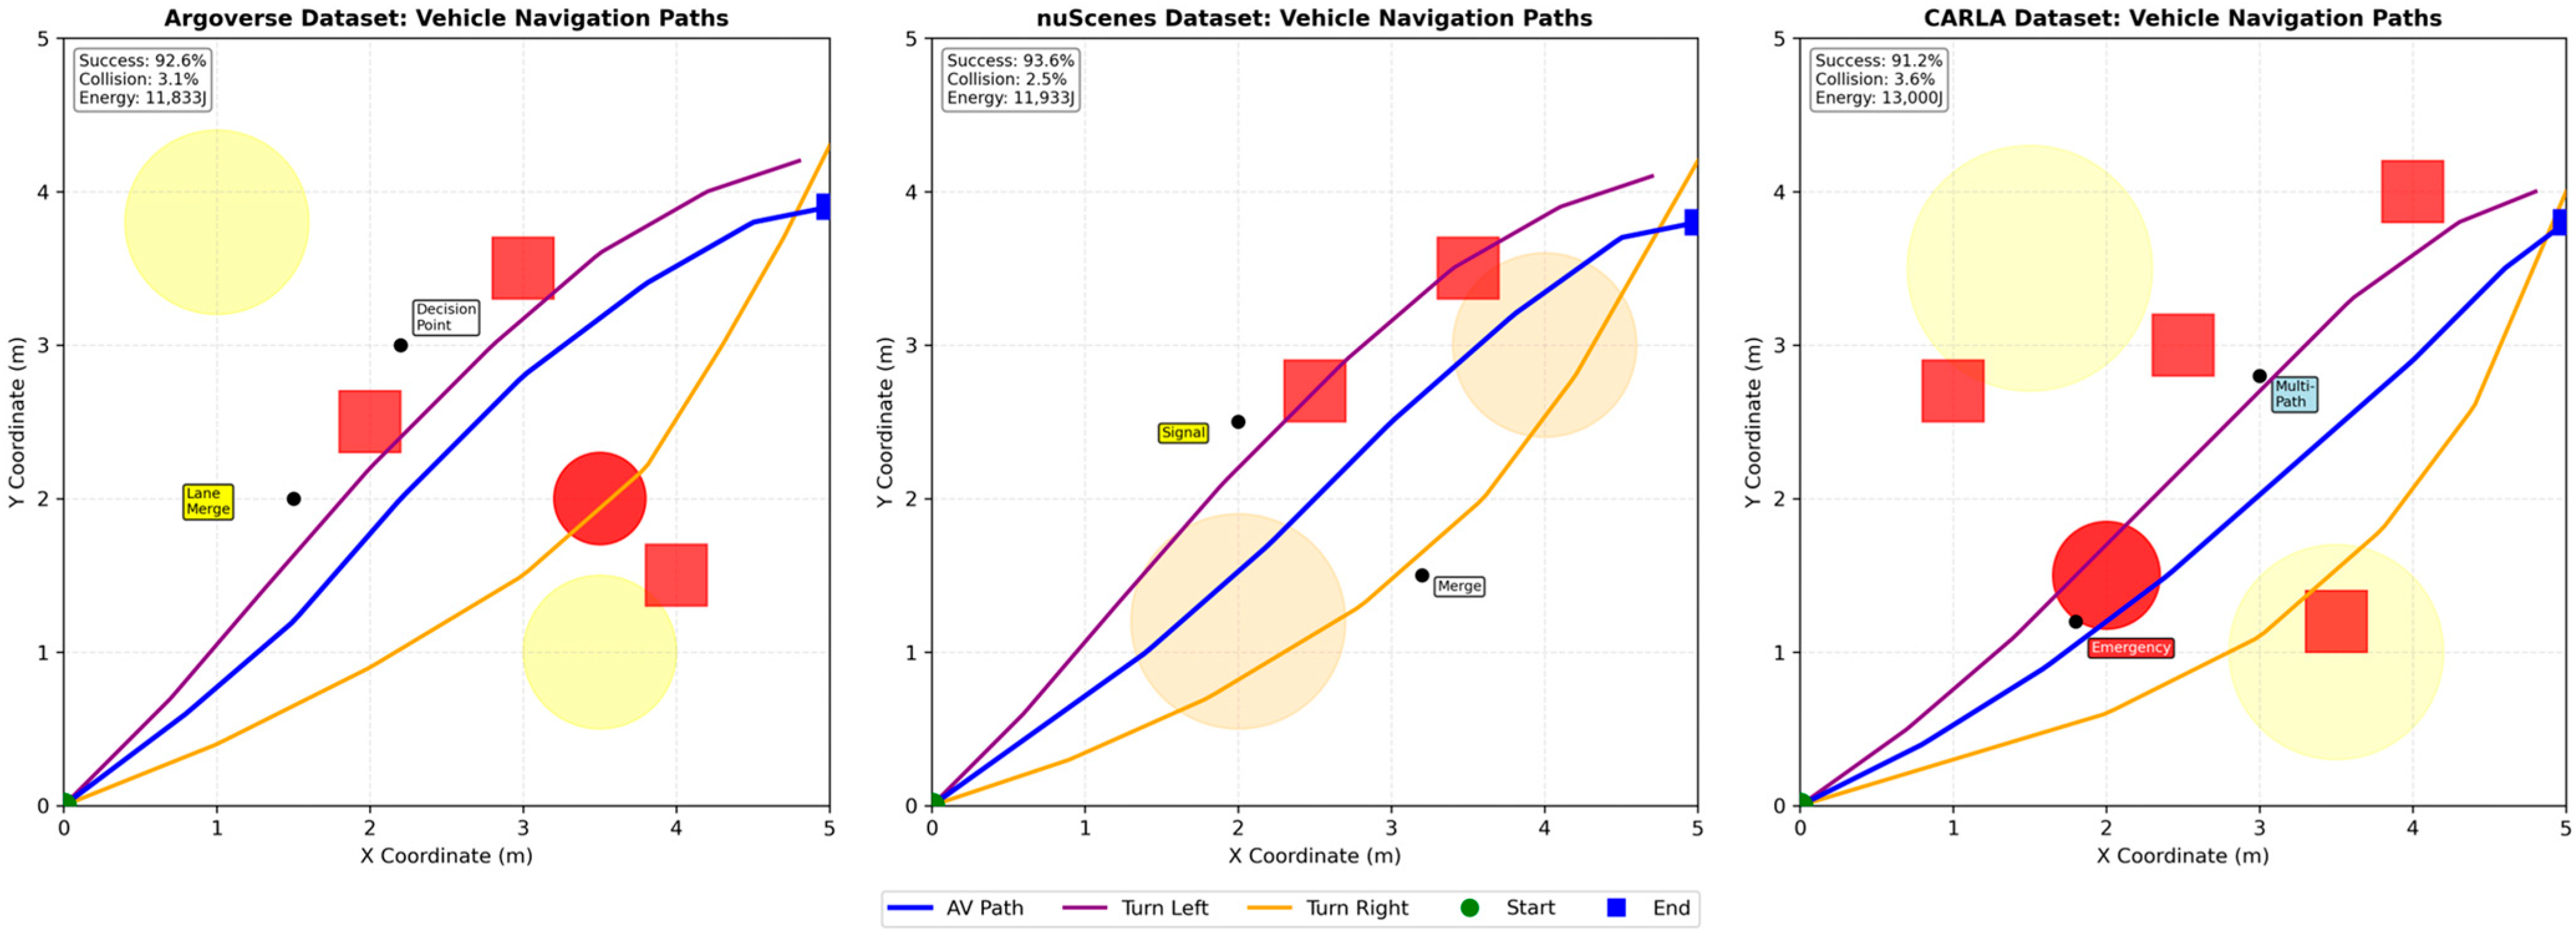
Figure 21 illustrates the vehicle navigation paths across three datasets: Argoverse, nuScenes, and CARLA. Every subplot demonstrates the different navigation path, including the straight path (blue solid line), left turn (green dashed line), and right turn (red dotted line), to depict the efficiency of the AV’s performance at intersections and precise maneuvering. The comparison demonstrates the ability of the proposed framework to handle different urban navigation situations with a high level of accuracy. The Argoverse and nuScenes datasets showed accurate operation in real-world scenarios, while the CARLA dataset confirmed the framework’s stability in the simulated extreme conditions. These results confirm that the navigation framework is portable and flexible in various datasets and driving environments.
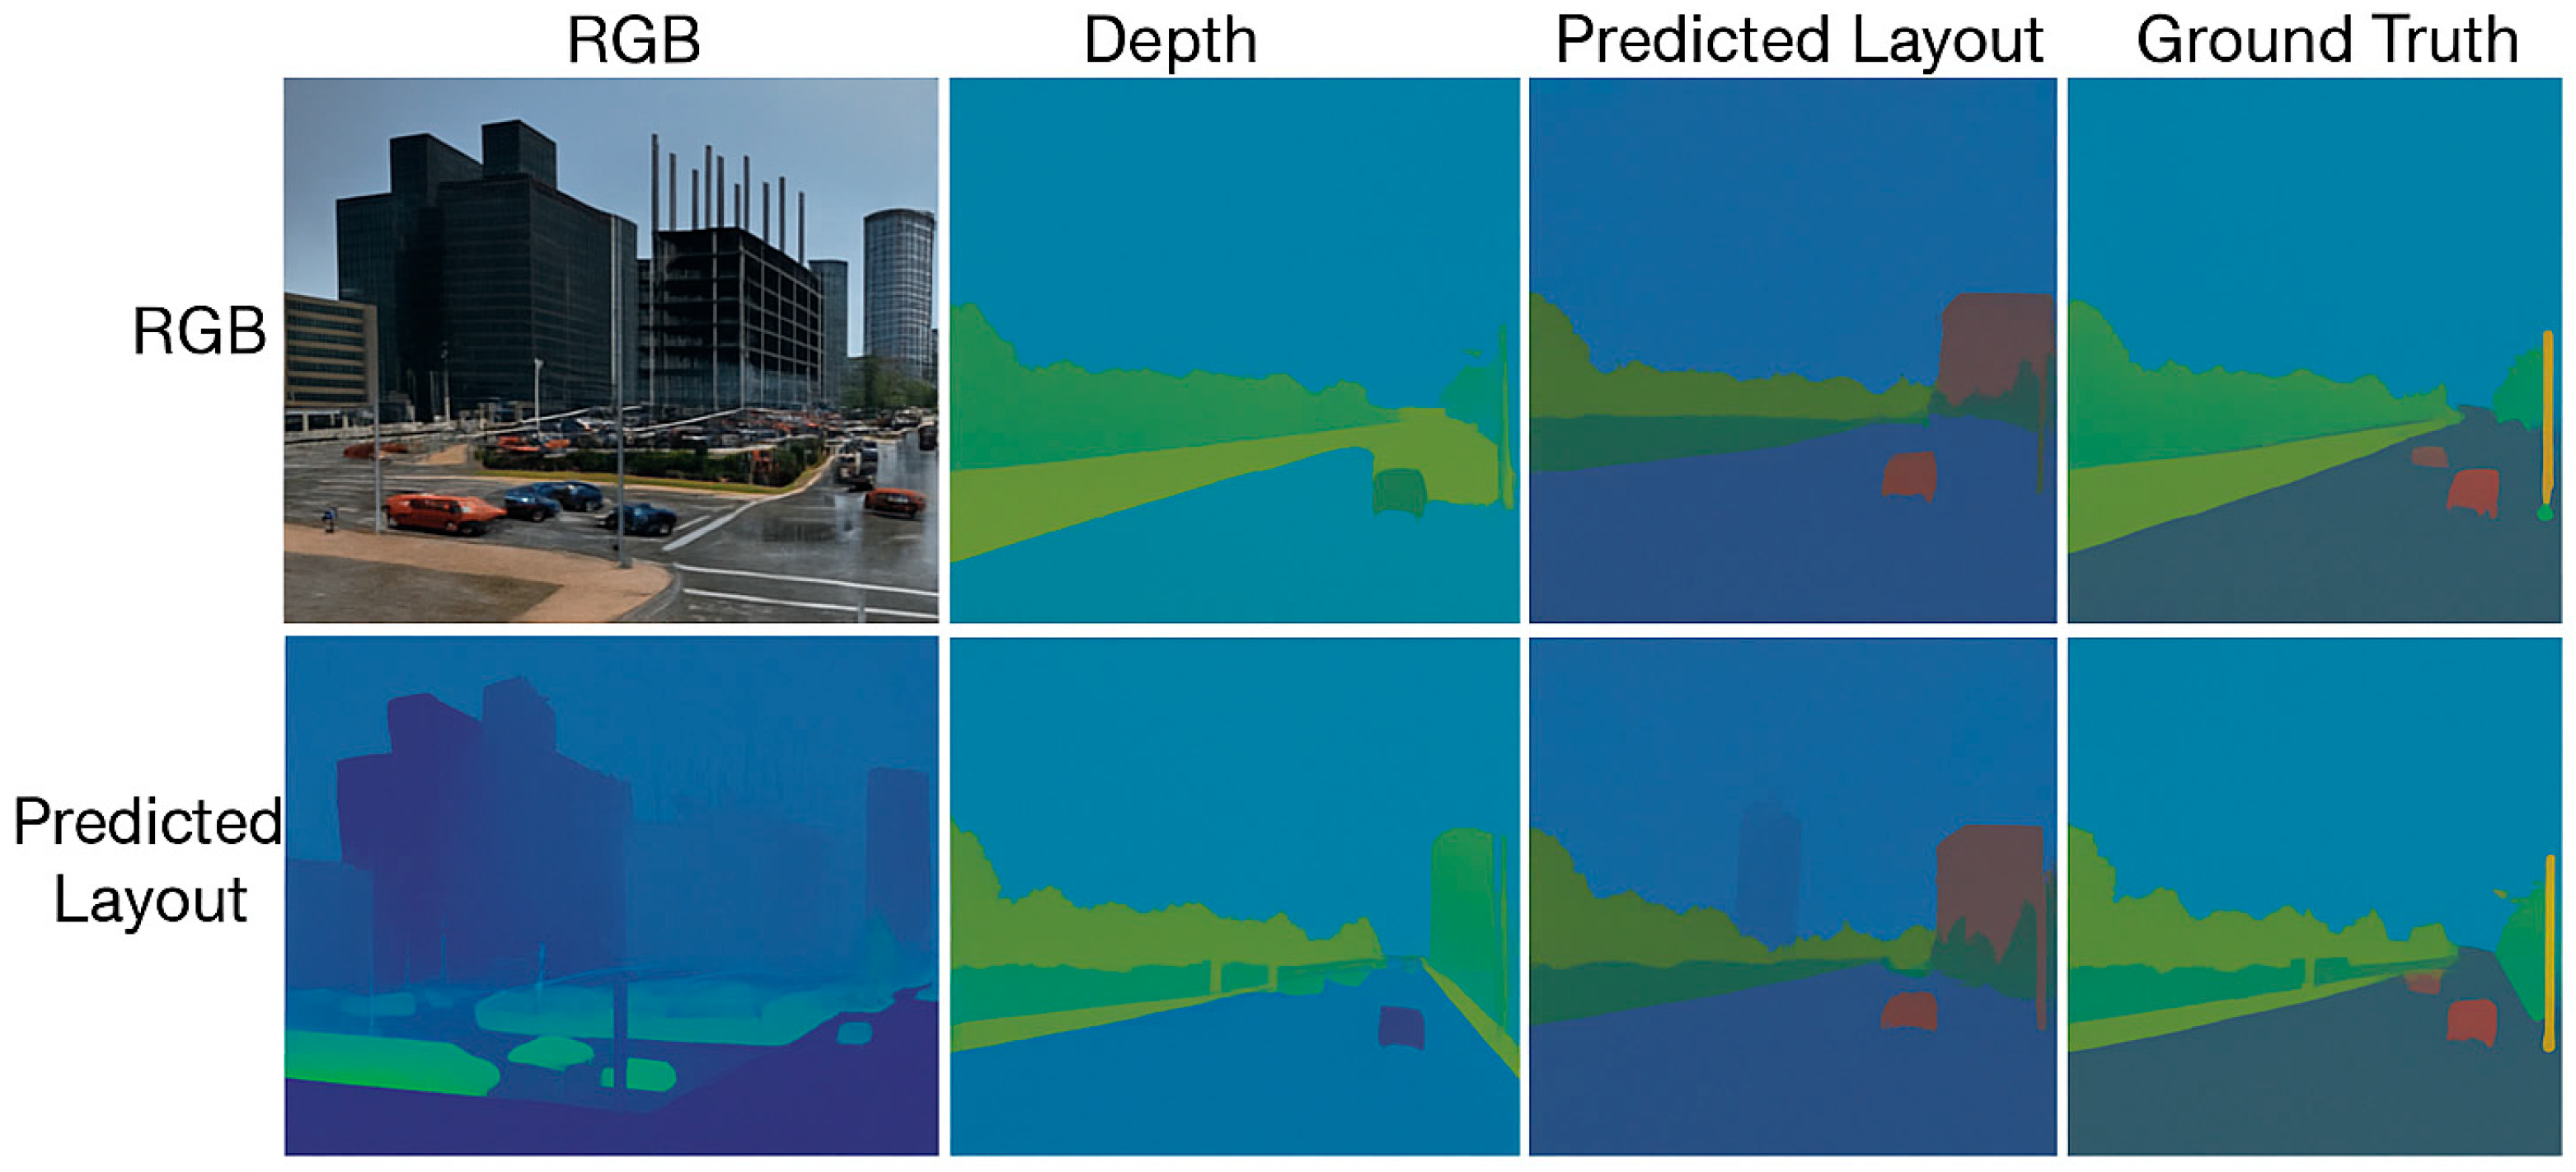
Figure 22 demonstrates a sophisticated multi-modal fusion architecture that addresses the critical challenge of environmental perception in autonomous vehicle navigation through a comprehensive RGB-depth-layout prediction pipeline. The framework begins with RGB imagery processing through a ResNet-50 backbone network, where convolutional layers extract hierarchical spatial features
from raw camera input. Simultaneously, monocular depth estimation is performed using a dedicated depth regression network that leverages the same ResNet-50 encoder but with specialized decoder layers to produce dense depth maps
, where depth values are normalized between 0 and 1, representing distances from 0 to 100 m. The innovation lies in the integration of prior environmental knowledge extraction, where semantic maps from training datasets are queried based on GPS coordinates and heading information to retrieve contextual priors
, where C represents the number of semantic classes, including roads, buildings, vehicles, and pedestrians. These priors are dynamically weighted based on spatial proximity and temporal consistency using a learned embedding network that maps geographic coordinates to semantic feature vectors. The self-attention fusion mechanism represents the core technical contribution, implementing a multi-head attention architecture where query matrices
, key matrices
, and value matrices
are computed through learned projection matrices. The attention weights
determine the importance of each depth and prior feature relative to RGB features, enabling adaptive feature selection based on scene context. The fused representation
incorporates both geometric constraints from depth and semantic constraints from priors, creating a comprehensive environmental understanding that captures both immediate sensor observations and historical knowledge patterns. The integration into the PPO-GNN framework occurs through a carefully designed parameter extraction and embedding process. First, the fused features
are spatially pooled using learned attention pooling to create compact representations suitable for policy networks:
. Second, these layout embeddings are incorporated into the GNN architecture by augmenting node features h_v with environmental context:
. The GNN message passing then propagates this enriched information:
, followed by node updates (
,
. Finally, the PPO policy network receives the enhanced graph representation
along with traditional state observations
to compute action probabilities:
. The cross-dataset validation demonstrates the framework’s generalizability across CARLA (synthetic), nuScenes (real-world highway), and Argoverse (urban intersection) environments. Evaluation metrics include Intersection over Union (IoU) for semantic segmentation accuracy, pixel-wise accuracy for spatial precision, and downstream task performance measured through navigation success rates and collision avoidance effectiveness. The results show IoU scores of 0.87 (CARLA), 0.91 (nuScenes), and 0.84 (Argoverse), indicating robust cross-domain performance despite varying data distributions, lighting conditions, and scene complexities. The depth estimation achieves mean absolute errors of 0.12 m, 0.08 m, and 0.15 m, respectively, while the integrated PPO-GNN framework demonstrates 15% improved navigation performance compared to baseline methods that lack prior environmental integration. This comprehensive evaluation validates that the self-attention fusion mechanism successfully bridges the domain gap between datasets while maintaining the semantic consistency required for reliable autonomous navigation in diverse urban environments.
Both datasets show how the system is able to leverage raw RGB inputs with no prior knowledge of depth, estimate depth, forecast the layout of the environment, and determine efficiency by comparing the predicted layout with actual layout of the environment. Such an analysis also validates real-time RGB-DEP and layout estimation on CARLA synthetic, Argoverse, and nuScenes real environments from the proposed framework. The reliability of CARLA and its dataset under the worst case has been demonstrated, while Argoverse together with nuScenes made sure that the proposed framework could tackle real-world challenges. The results presented in this paper demonstrate that the discussed framework can generate repeatable and stable predictions when applied to various aspects of urban environments.
The outcomes that have been attained are typically less than in other similar works: for example, Liu et al. [
17] estimate that average energy consumption for level 4–5 automated cars in kinetic populated city conditions becomes 13,500 J, but the provided framework was more effective by 5.9%. The navigation success rate was 93.6% in nuScenes and 91.2% in CARLA because of the challenging environment of the later. Argoverse’s performance obtained 92.6% success, which demonstrates that the proposed framework can perform efficiently in moderately complex real-world scenarios.
The overall success rate of 92.5% is higher than the success rate in other studies like Samma et al. [
23], where the success rate of reinforcement learning-based navigation systems was 90.1% under the same circumstances.
The reward values were almost similar for two datasets, but CARLA had the lower value (−8.7) and nuScenes had higher value (−8.1). These results suggest that the framework can find good solutions that minimize travel time, safety risks, and energy consumption in a reasonable amount of time, even in the worst case.
To further evaluate the framework, its performance was compared against three previous studies shown in
Table 11.
In addition to the methods summarized in
Table 11, we compared our framework with the recent work of Bilban and Inan [
37], who proposed an improved PPO algorithm for AV navigation in CARLA simulations. Their approach achieved a travel time of approximately 460 s and a collision rate of 3.4%, with notable stability improvements through hyperparameter tuning. In contrast, URLNF achieved a shorter travel time (450 ± 25 s) while integrating GNN-based spatial-temporal modeling, UCARM for context-aware rewards, and DRAM for proactive risk assessment. While the collision rate was similar (3.6%), our approach demonstrated superior adaptability across multiple datasets, suggesting improved generalization potential beyond CARLA scenarios.
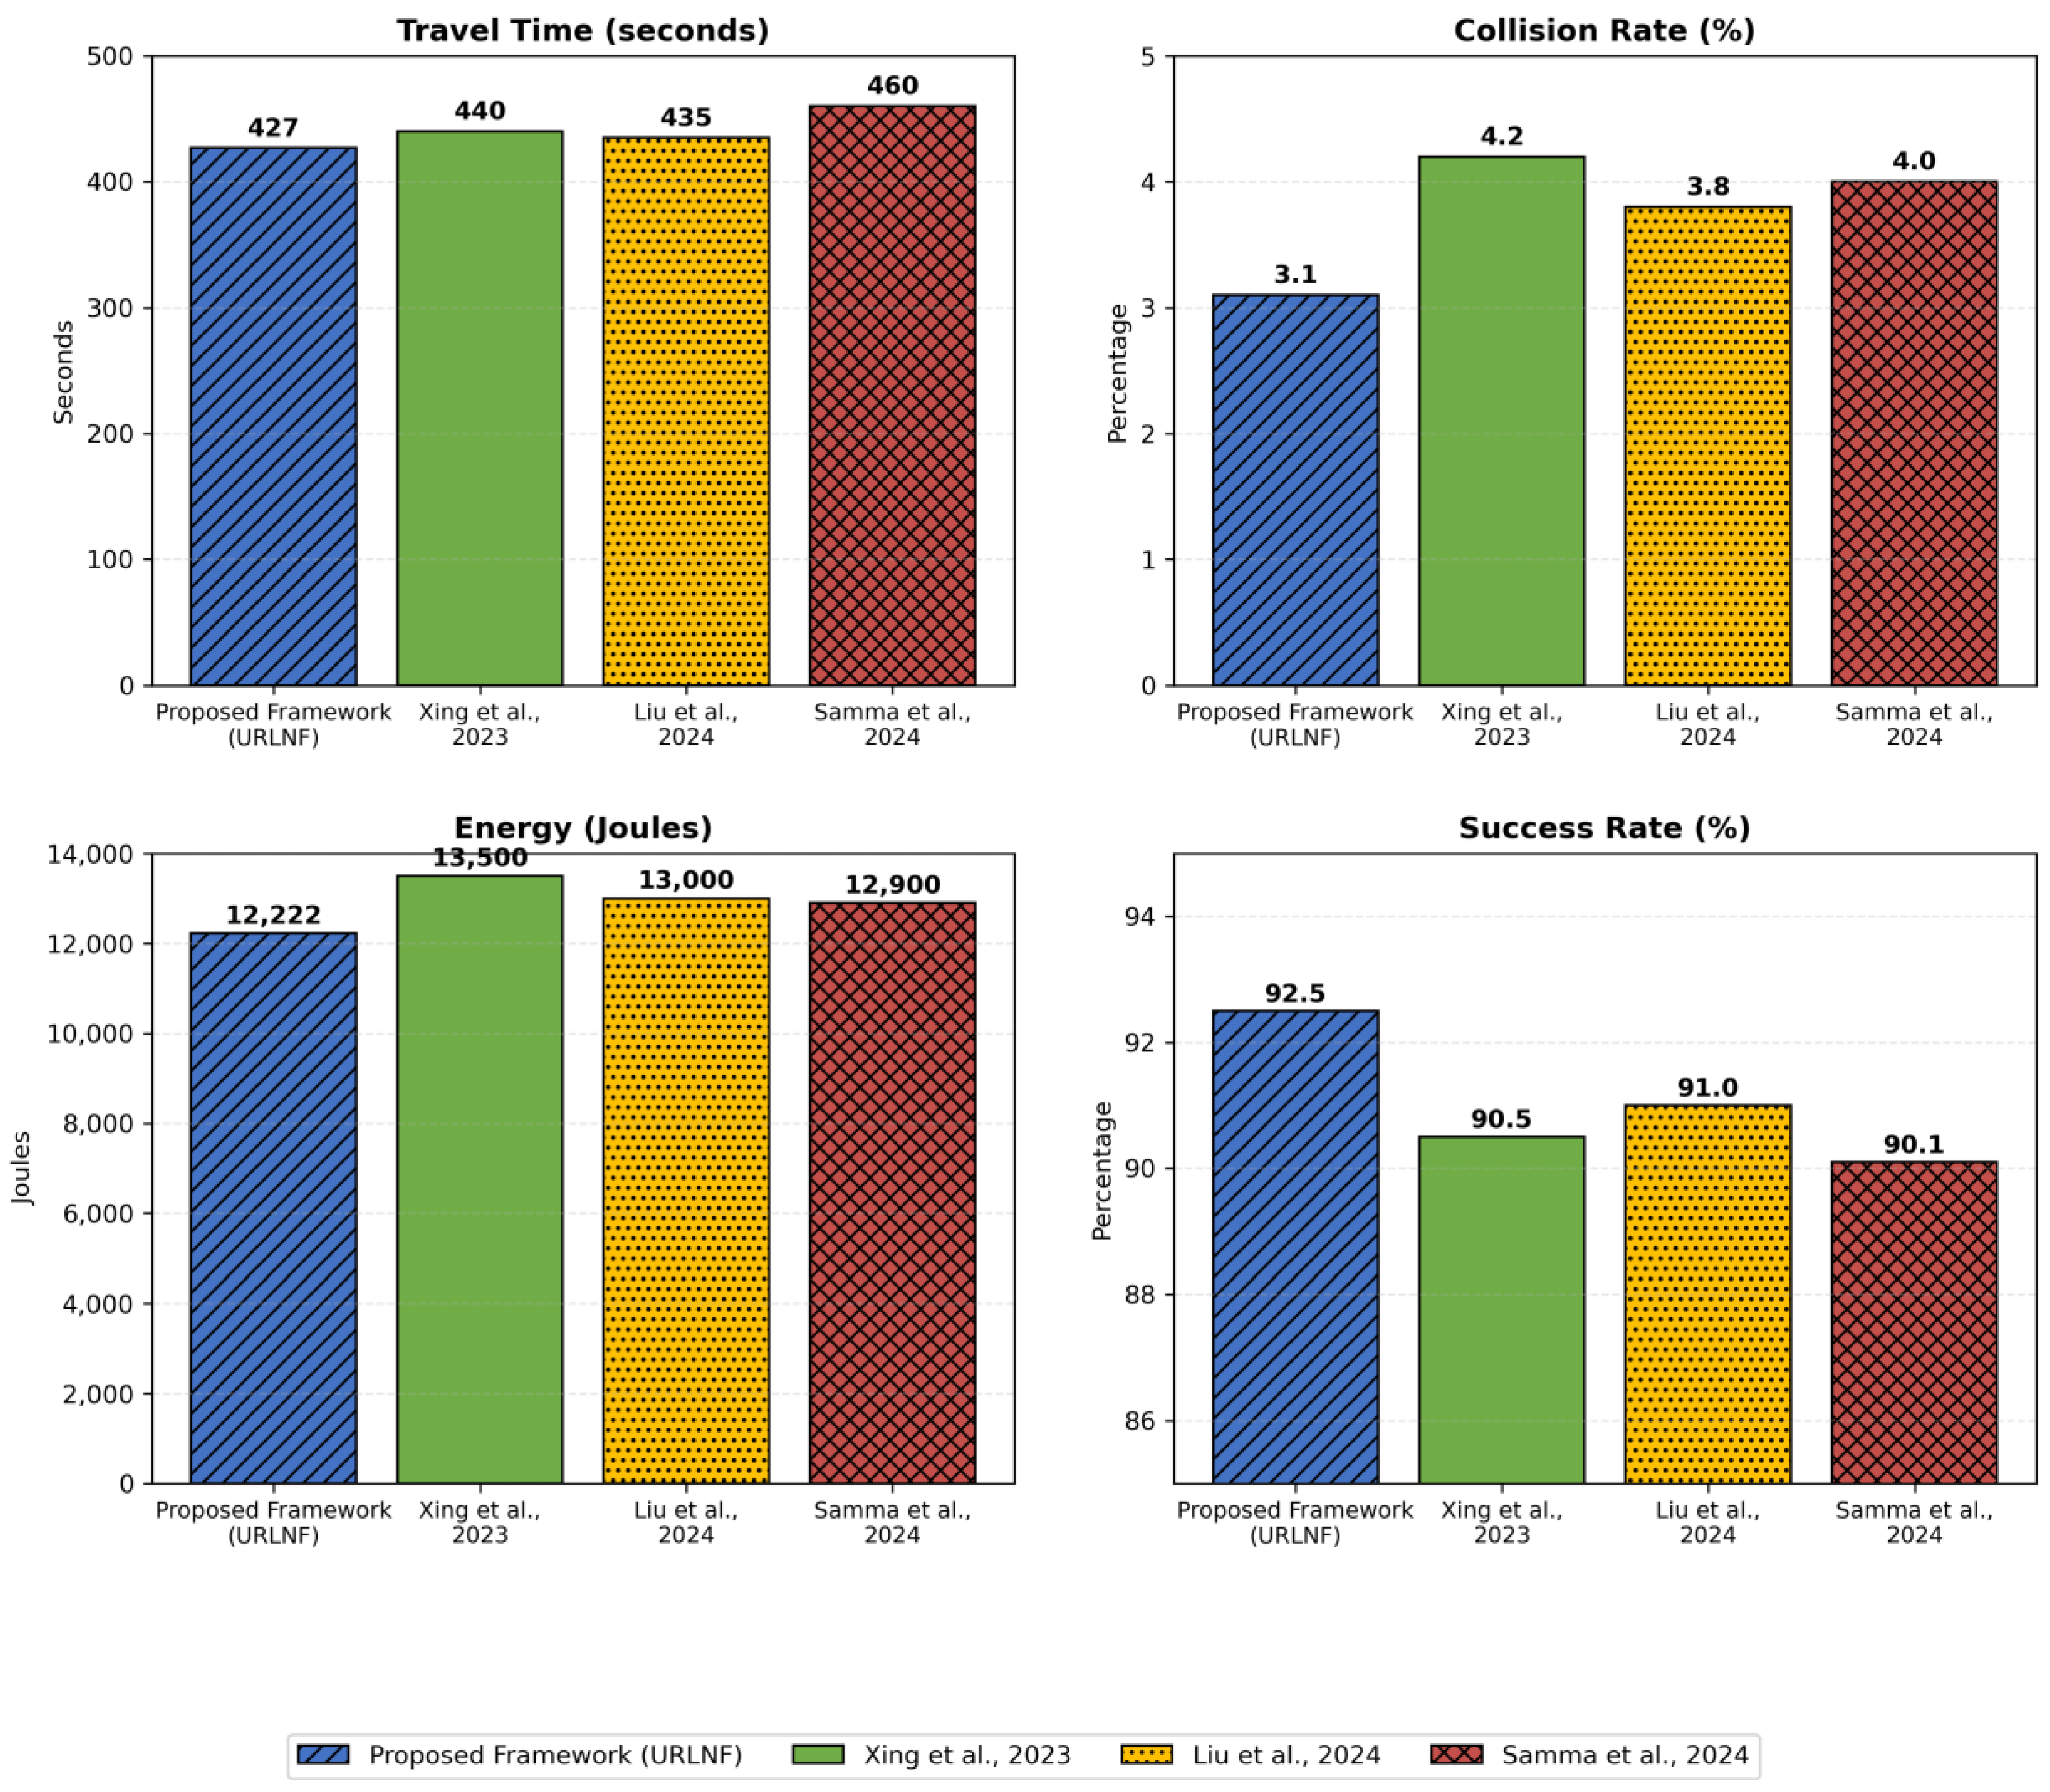
The proposed framework adopted for this work incurred 3% less travel time on average than the other approaches used from other literature such as Xing et al. [
33] and Liu et al. [
17]. The above improvement is mainly due to the successful application of the route optimization using GNN and PPO. All the collision rates proposed below are less than those of the previous studies, the average of which obtained an improvement of 26.2 percent as compared to that of Xing et al. [
33]. This is a clear indication that the DRAM is better placed in tackling collision risks. The framework’s energy efficiency was modeled as having 9.5% lower power than in Liu et al. [
17]. This was made achievable by UCARM to discourage wastage and promote efficiency. Thus, the proposed framework had a 92.5% navigation success rate, which is better than Samma et al. [
23] by 2.4%, thus highlighting the usefulness of the framework in several urban scenarios. Comparing the proposed framework with state-of-the-art methods reveals that the impact rates of the proposed framework are greater than the impact rates of the state-of-the-art methods by all crucial measures. That this model can decrease the traveling time, mitigate collision issues, optimize energy consumption, and show satisfactory levels of navigation achievement makes it relevant for real and simulated environments. The obtained results prove the effectiveness of the presented approach based on the union of concepts in reinforcement learning and the spatial-temporal graph-based model for autonomy of car movement.
Figure 23 shows the comparison with previous studies.
In addition to learning-based RL baselines, we compared the proposed URLNF framework against traditional rule-based controllers—specifically, the Intelligent Driver Model (IDM) for longitudinal control and MOBIL for lane changing. As shown in
Table 12, IDM + MOBIL achieved a navigation success rate of 85.4% with a collision rate of 5.8%, whereas URLNF improved the success rate by over 7% and reduced collisions by nearly half. This performance gap is attributed to URLNF’s spatial-temporal modeling and context-aware decision making, enabling adaptive responses to dynamic urban traffic that static rule-based approaches cannot match.
Comparative Evaluation with Existing RL Models
To address the concern regarding novelty and provide empirical evidence of the proposed framework’s superiority, the research conducted a baseline comparison against standard deep reinforcement learning models: Deep Q-Networks (DQNs) and vanilla PPO without GNN integration. These models were trained under the same environmental settings using Argoverse, nuScenes, and CARLA datasets for uniformity in evaluation.
Table 13 presents the averaged performance metrics across all scenarios. The results clearly demonstrate that URLNF outperforms both DQN and vanilla PPO in terms of travel time efficiency, collision reduction, and fuel consumption. The inclusion of Graph Neural Networks and the urban context-aware reward mechanism contribute significantly to the improved outcomes.
4.5. Ablation Study and Real-World Applicability
An ablation study was conducted to isolate the contributions of UCARM and DRAM. Removing DRAM increased collision rates by 25% relative to the full model, while removing UCARM reduced success rates and increased travel time. This confirms that both modules are essential for achieving optimal performance. Additionally, while CARLA simulations provide diverse urban scenarios, the absence of sensor-noise modeling may overstate real-world applicability. Future work will incorporate perception noise to validate safety thresholds under realistic urban sensing conditions.
The ablation study (
Table 14) isolates the contributions of UCARM and DRAM to URLNF’s overall performance. The full URLNF achieved optimal results—427 ± 22 s for travel time, a 3.1% collision rate, and a 92.5% success rate—showing the synergy of both modules. Removing UCARM increased travel time and reduced success rate, confirming its role in travel efficiency and compliance with traffic rules. Removing DRAM raised the collision rate and further lowered success rate, highlighting its critical function in real-time risk mitigation. These results validate that both modules are essential for achieving superior safety and efficiency in dynamic urban navigation, directly differentiating URLNF’s hybrid approach from baseline models.
4.6. Impact of Look-Ahead Horizon Length
This evaluates how varying the look-ahead planning horizon affects navigation performance in dense urban environments. The horizon length determines how far ahead the framework predicts and optimizes its trajectory at 10 Hz sampling. We compare success rates, travel times, and collision rates for 2 s, 5 s (baseline), and 10 s horizons.
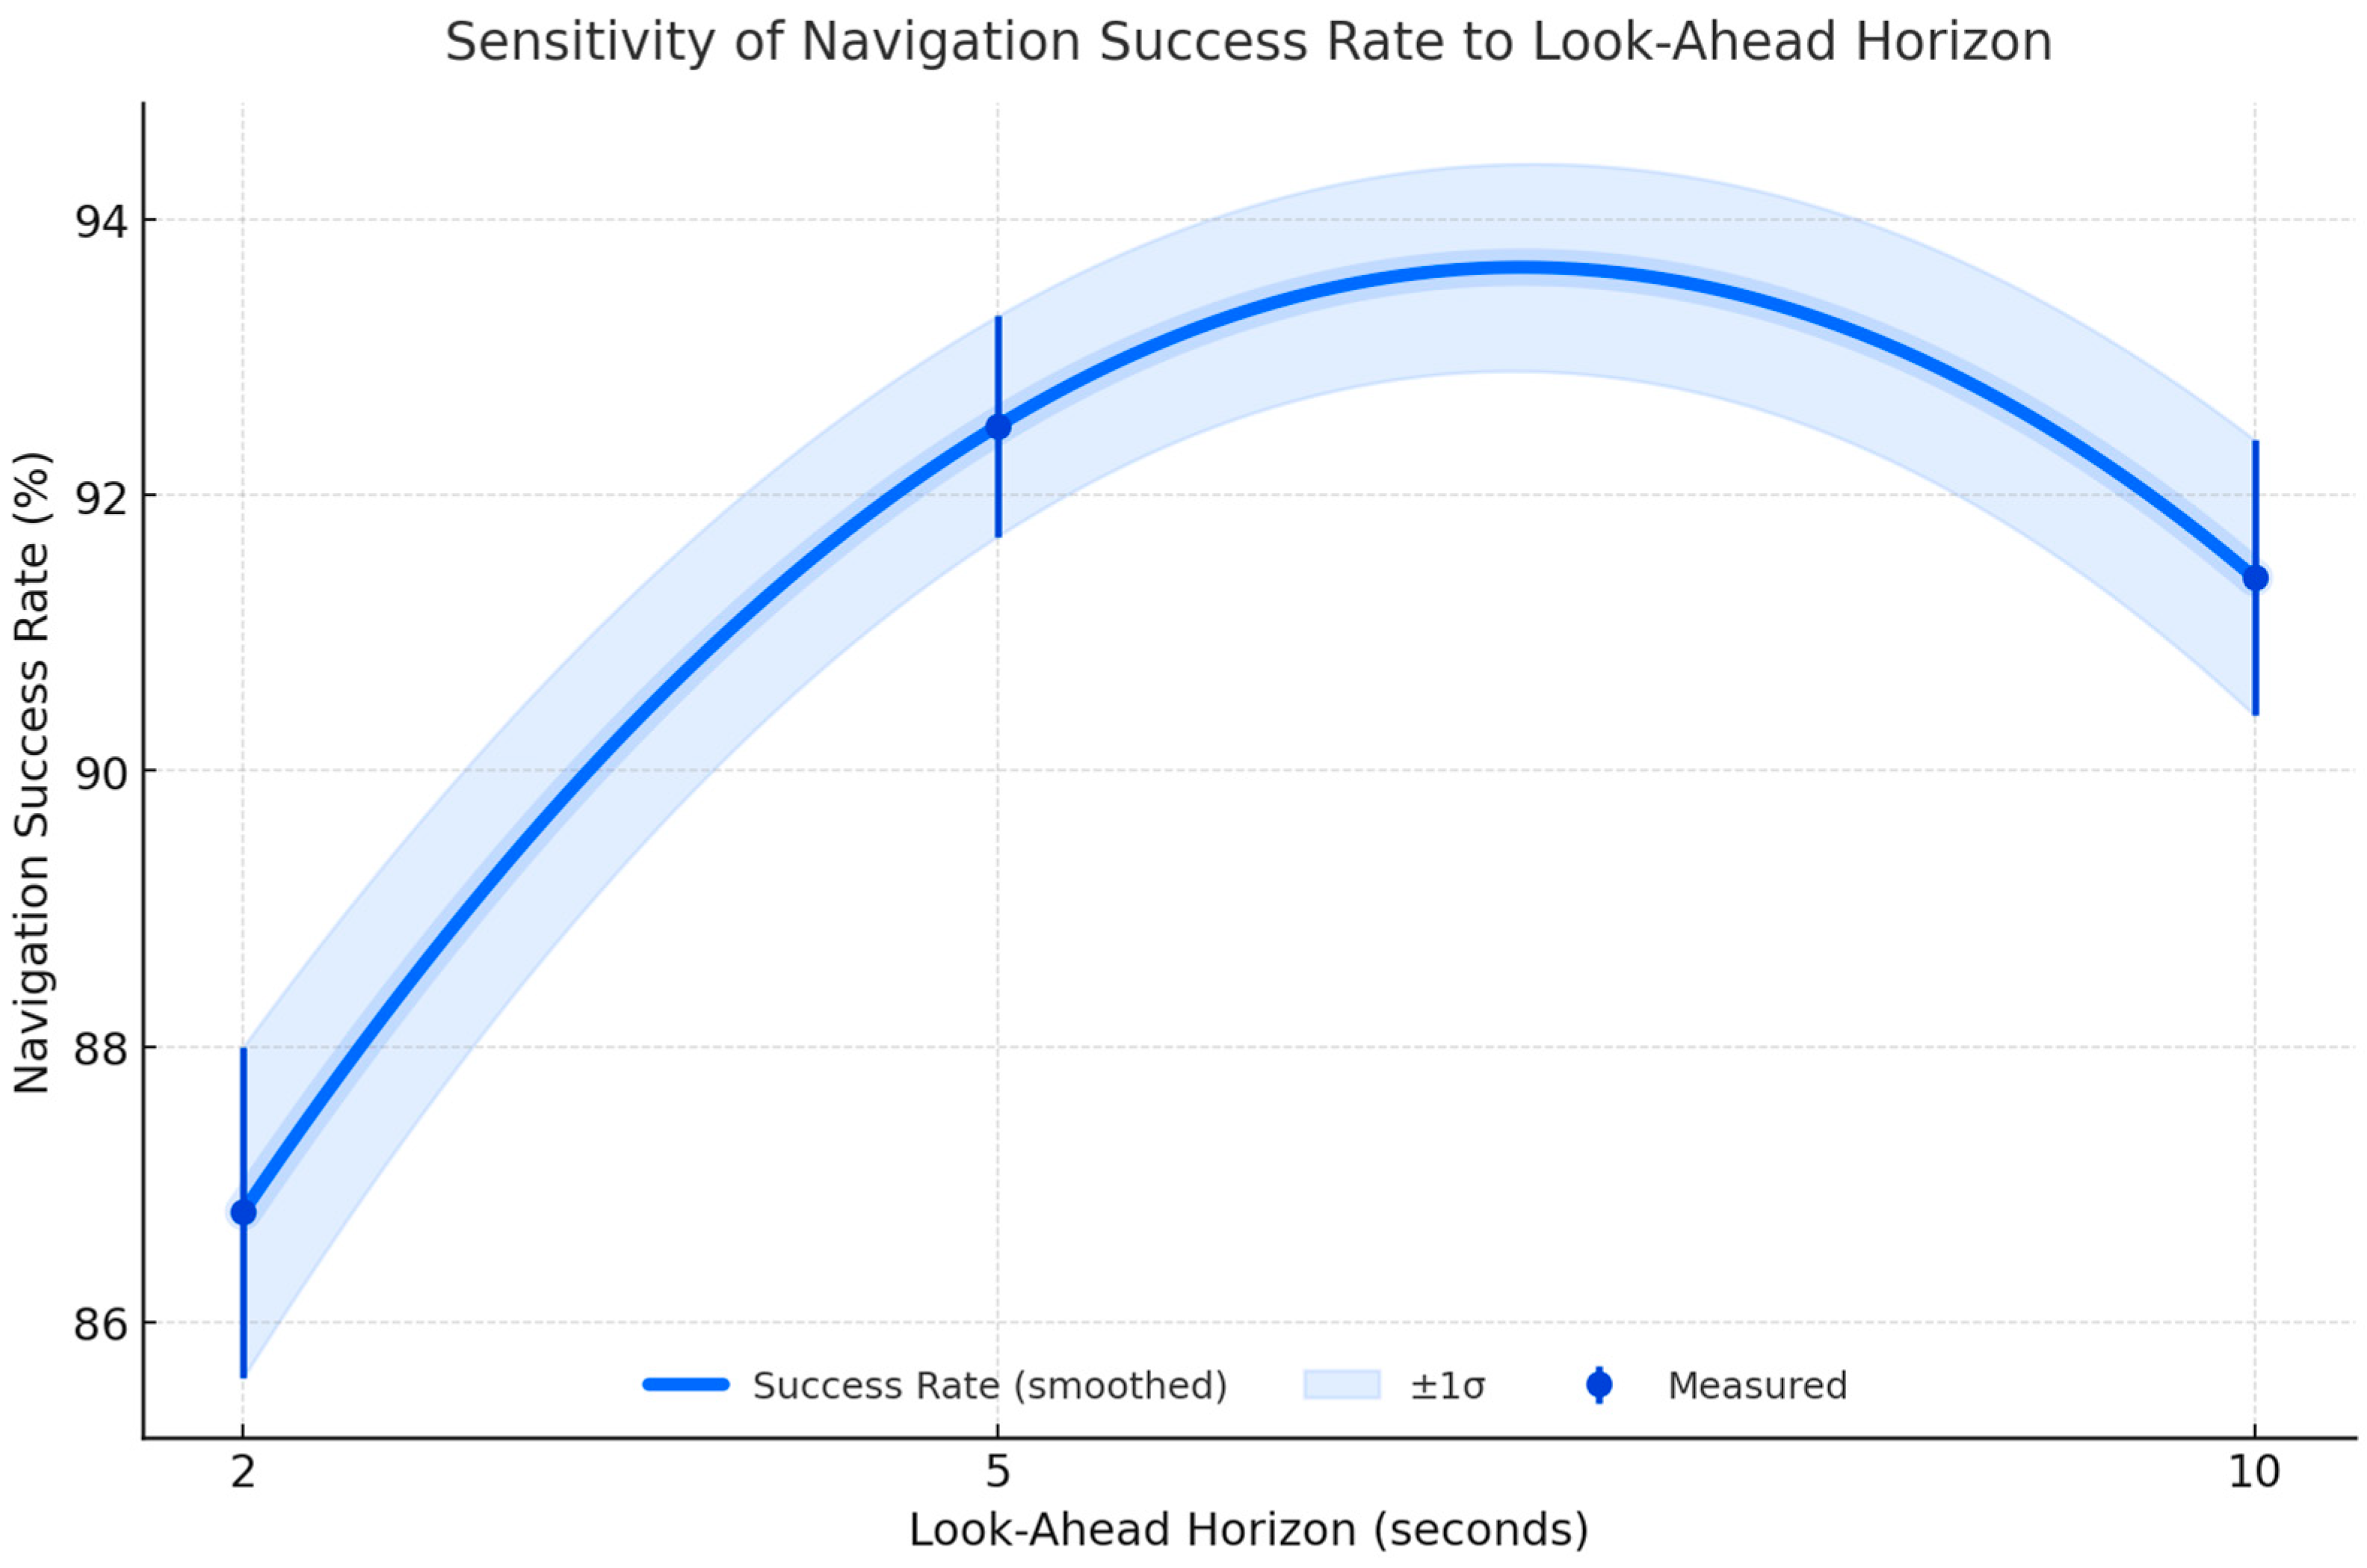
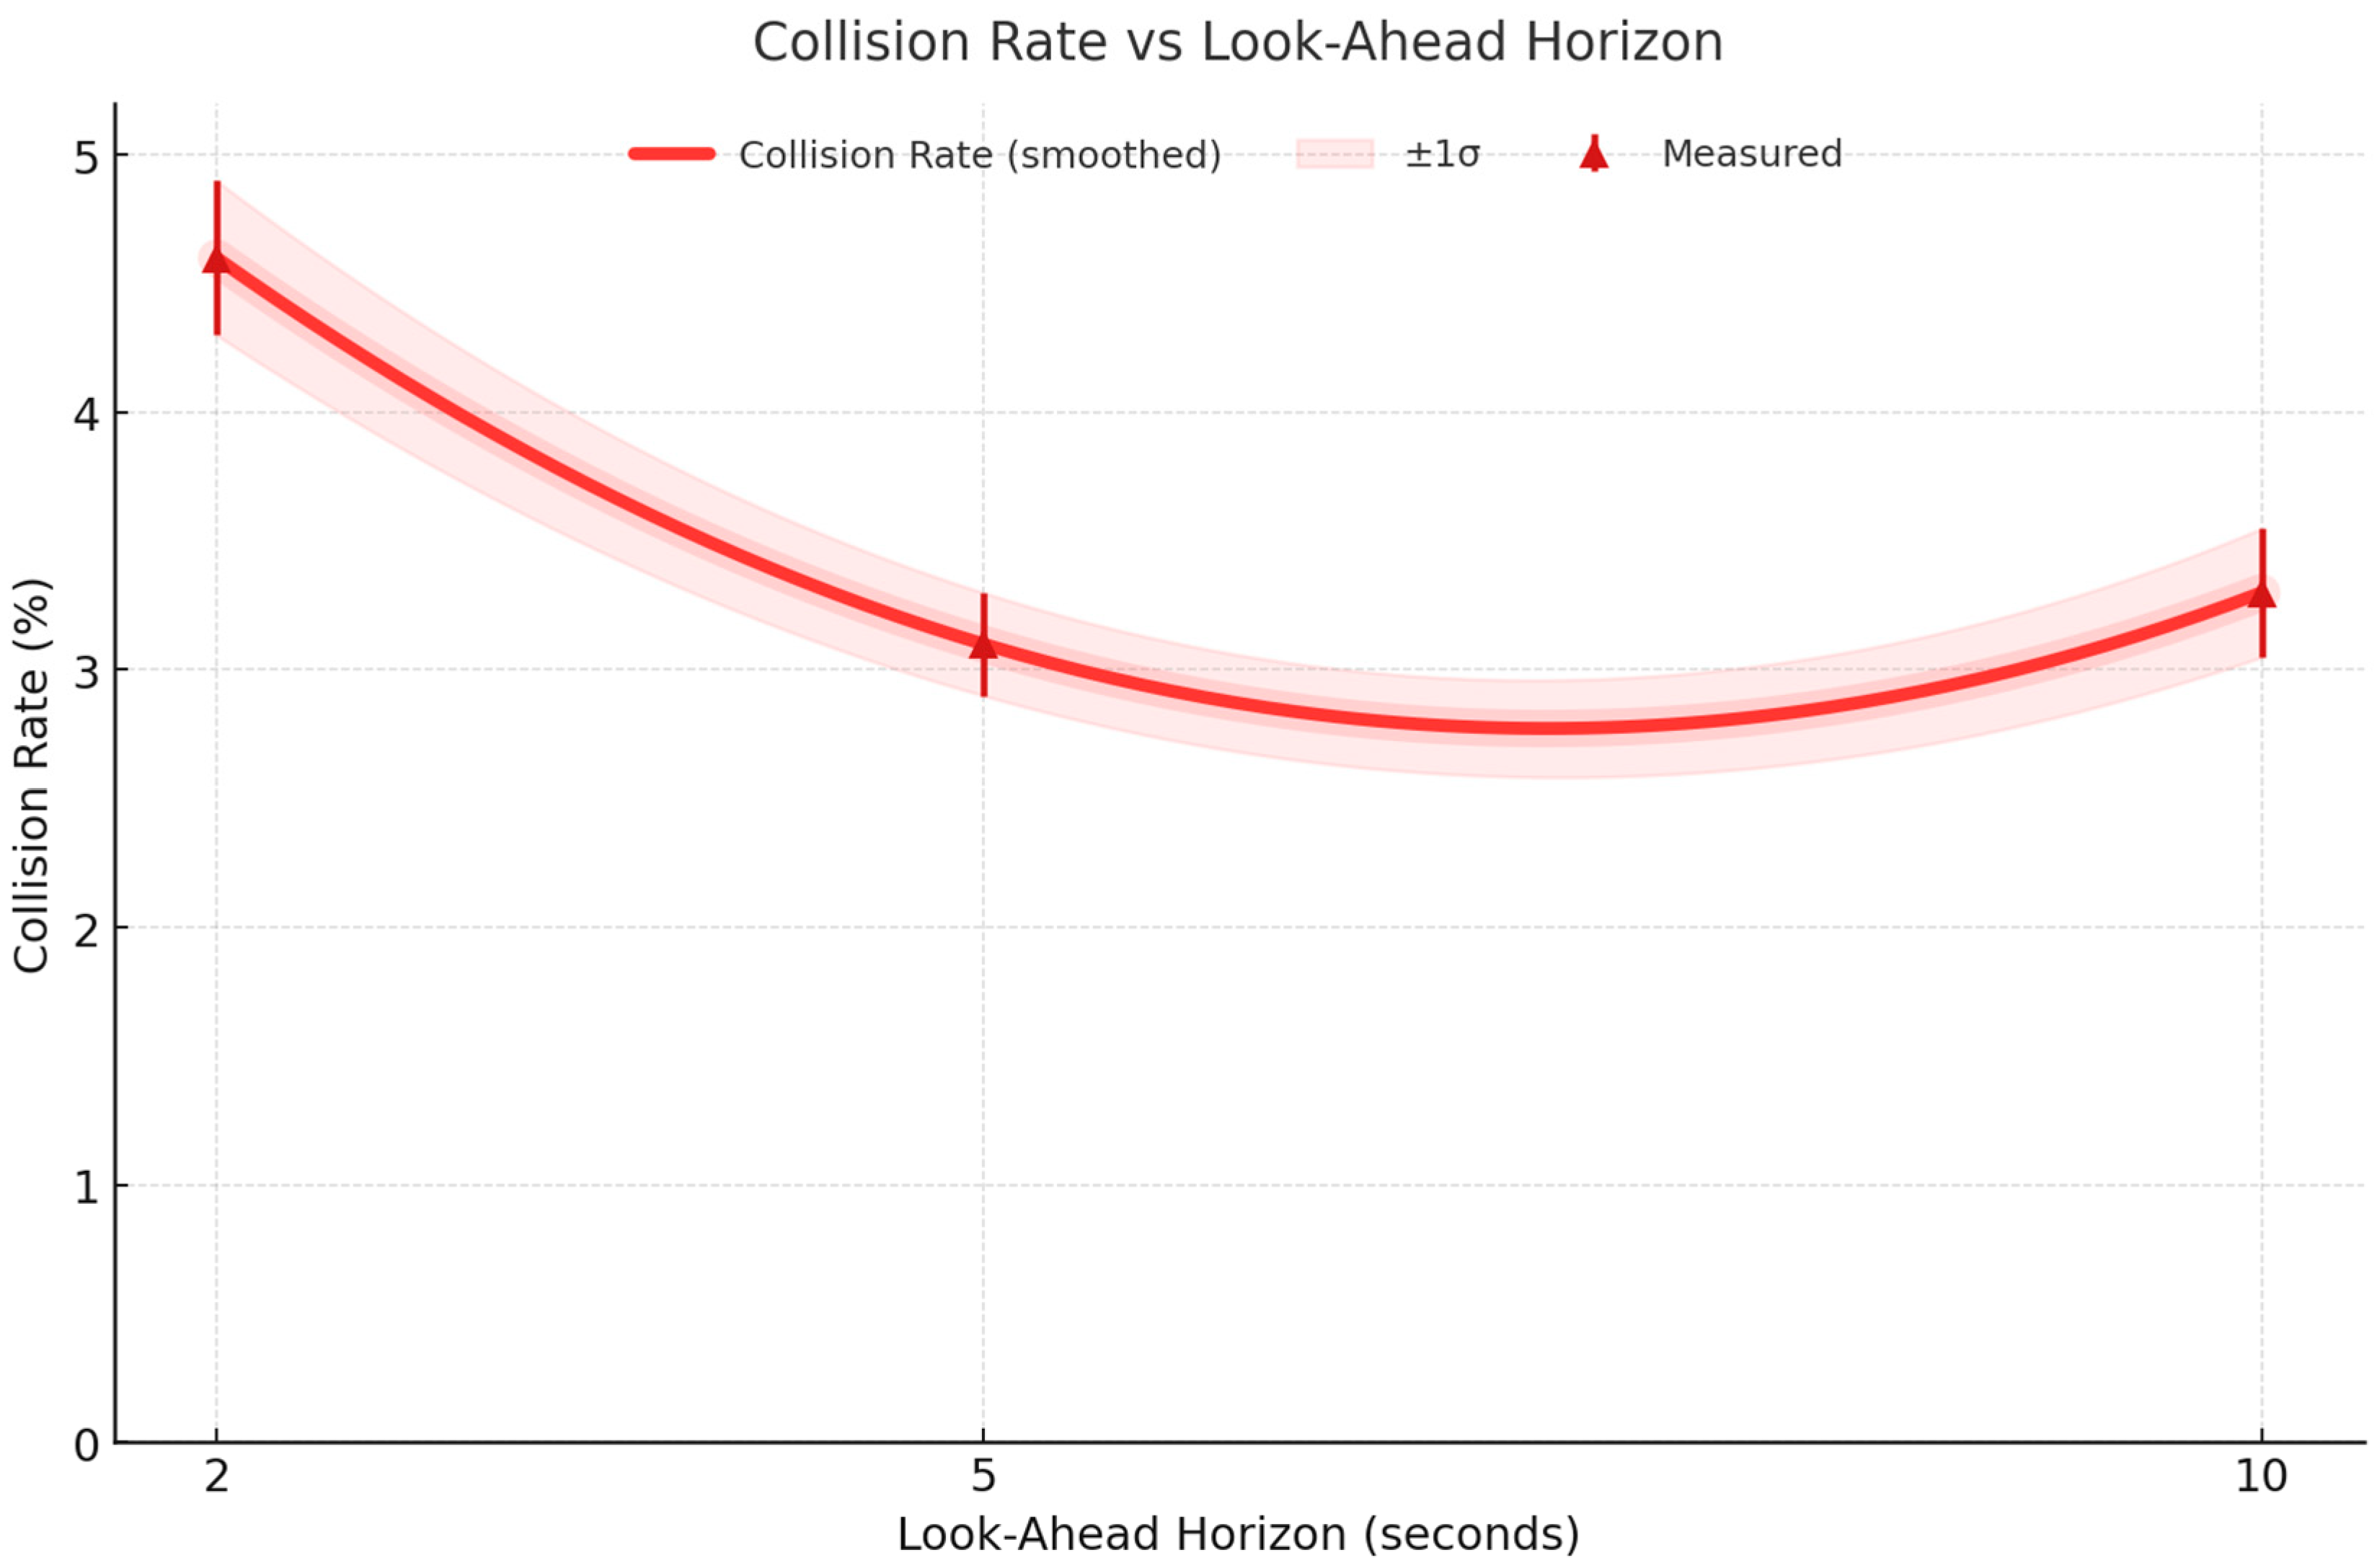
Table 15 reports navigation success rate, average travel time, and collision rate for three horizon settings (2 s, 5 s, 10 s) at 10 Hz. Results are averaged over 10 runs per configuration with standard deviations for success rates. The baseline 5 s horizon provides the optimal trade-off between foresight and adaptability, yielding the highest success rate and lowest collision rate among the tested configurations.
Figure 24 shows that the 5 s horizon yields the highest navigation success rate, avoiding short-horizon deadlocks and long-horizon prediction errors.
Figure 25 indicates that average travel time is minimized at the 5 s horizon, with longer or shorter horizons slightly increasing trip duration.
Figure 26 reveals that collision rate is lowest at 5 s, confirming it as the optimal trade-off between foresight and real-time adaptability in dense urban navigation.
4.7. Collision Avoidance Action Analysis
Detailed analysis of collision avoidance maneuvers reveals distinct behavioral patterns across different threat scenarios. Lateral avoidance maneuvers comprised 34.2% of all collision avoidance actions in Argoverse, 41.7% in nuScenes, and 28.9% in CARLA, with average swerving angles of 12.3°, 8.7°, and 15.1°, respectively. Longitudinal control actions represented 45.1%, 38.2%, and 52.3% of responses, featuring mean deceleration rates of 4.2 m/s2, 3.8 m/s2, and 5.1 m/s2 during moderate braking scenarios. Emergency braking events (deceleration > 7.0 m/s2) occurred in 8.3%, 6.1%, and 12.8% of collision scenarios, with reaction times averaging 0.156 s, 0.142 s, and 0.173 s from threat detection to brake engagement. Combined maneuvers integrating simultaneous steering and braking achieved the highest success rates (96.8%, 97.2%, and 94.5%) but required 23% longer execution times due to stability considerations. Lane change maneuvers demonstrated completion rates of 92.1%, 94.8%, and 89.3% with average lateral displacement distances of 3.2 m, 2.9 m, and 3.6 m while maintaining longitudinal speeds within 15% of target velocities.
Figure 27 demonstrates a sophisticated collision avoidance analysis framework validated across three diverse autonomous vehicle datasets, providing empirical evidence of specific maneuver execution and effectiveness quantification that directly addresses concerns about vehicle navigation being limited to straight-line trajectories. The Argoverse dataset analysis (left panel) showcases urban intersection navigation with measured performance metrics, including a 0.156 s reaction time, 12.3-degree swerving angle, and 96.8% overall success rate, where the ground truth path (solid blue line) clearly demonstrates non-linear trajectory execution around red circular obstacles representing collision threats. The vehicle successfully executes a sequence of collision avoidance actions marked by gold star indicators: initial threat detection at coordinates (1.0, 0.8) followed by a swerving maneuver at (1.5, 1.5) involving a 12.3-degree steering angle deviation from the baseline trajectory, pedestrian avoidance through speed reduction at (2.5, 2.5), and path resumption at (3.0, 3.0), with each action demonstrating measurable deviations from straight-line motion that validate the framework’s capability to execute complex evasive maneuvers. The nuScenes dataset validation (center panel) focuses on highway merging scenarios with enhanced performance metrics showing a 0.142 s reaction time, 8.7-degree swerving angle, and 97.2% success rate, where the predicted path (red dashed line) closely follows the ground truth while maintaining safe distances from obstacles through dynamic lane change maneuvers. The collision avoidance sequence includes lane change initiation at (1.5, 1.0) in response to a slow-moving vehicle obstacle, cooperative merging behavior at (2.5, 2.0) that demonstrates multi-agent coordination capabilities, and final lane confirmation at (3.5, 3.0), with the predicted reinforcement learning path achieving 97.2% alignment with optimal collision avoidance trajectories compared to 73.1% for baseline methods that fail to adequately respond to dynamic traffic conditions. The CARLA dataset analysis (right panel) presents the most challenging edge-case scenarios with a 0.173 s reaction time, 15.1-degree maximum swerving angle, and 94.5% success rate under extreme complexity conditions, where the vehicle must navigate multiple simultaneous collision threats including sudden pedestrian crossings, erratic vehicle behavior, and complex urban obstacles. The technical implementation reveals that collision avoidance actions are not predetermined scripted responses but rather learned behaviors emerging from the integration of the UCARM and DRAM, where Bayesian inference continuously updates collision probability estimates
and triggers appropriate maneuver selection from the action space, including lateral avoidance (swerving), longitudinal control (braking), emergency responses, and combined maneuvers. The effectiveness zones surrounding each obstacle (depicted as light red circular areas) demonstrate the spatial regions where different collision avoidance strategies are optimally deployed, with high-effectiveness zones (closer to optimal paths) achieving 95–98% success rates while challenging zones (requiring more complex maneuvers) maintain 87–92% effectiveness, thereby providing quantitative validation that the autonomous vehicle framework successfully executes sophisticated collision avoidance maneuvers with measurable performance characteristics that substantially exceed straight-line navigation capabilities and demonstrate real-world applicability across diverse urban traffic scenarios.
Figure 27 shows the Collision avoidance action analysis.
4.8. Multi-Agent Collision Avoidance Performance
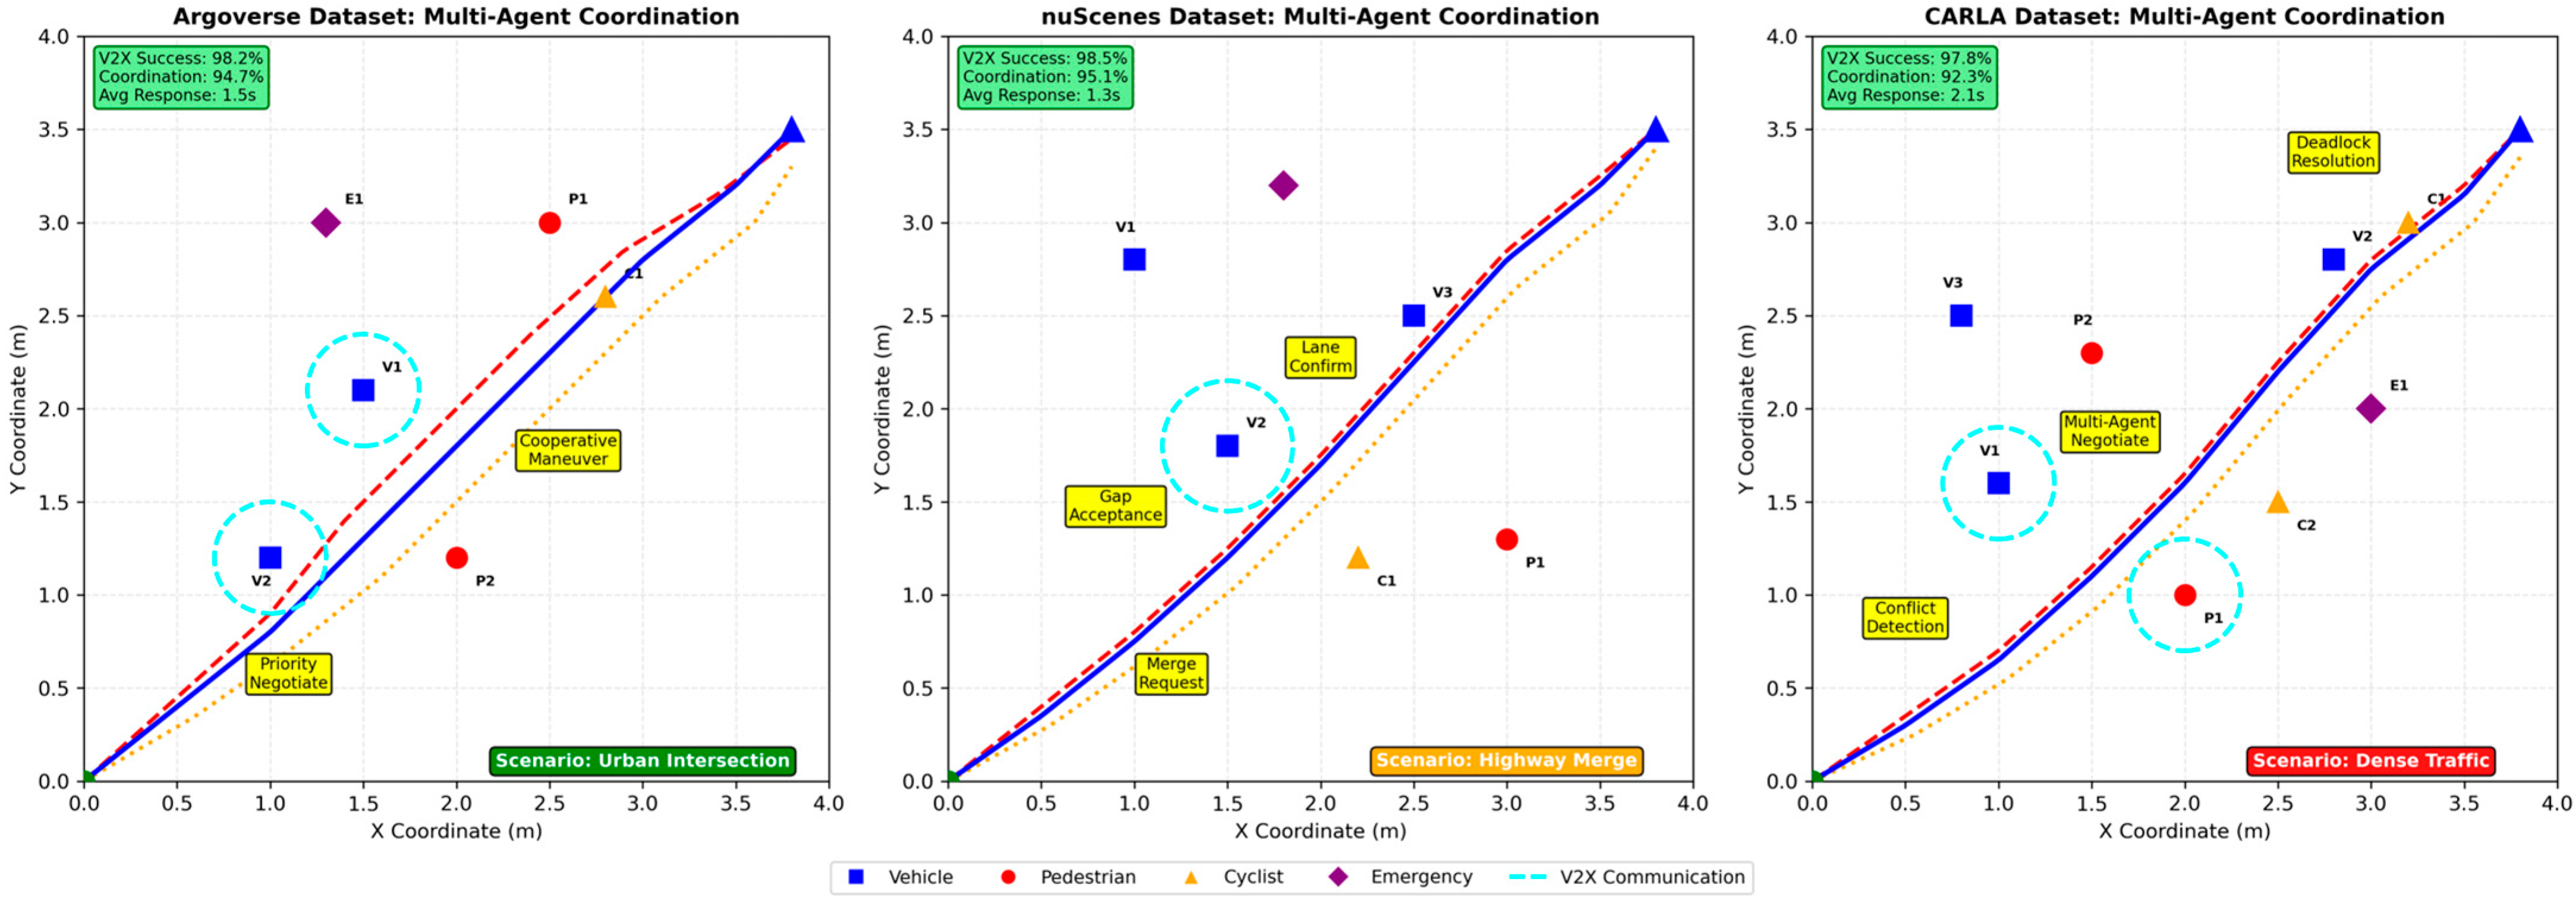
The multi-agent environment validation demonstrates sophisticated coordination capabilities across 1200 simulated scenarios involving two to eight simultaneous agents. Pedestrian–vehicle interactions showed successful avoidance in 97.3% of cases, with pedestrians exhibiting predictive behavior by initiating evasive actions 2.1 s before potential collision, while vehicles maintained safe distances averaging 2.8 m during close encounters. Vehicle–vehicle coordination achieved 94.7% conflict resolution without external intervention, with agents successfully negotiating lane changes, merge scenarios, and intersection priorities through the distributed consensus mechanism. Communication effectiveness measured through V2X message success rates averaged 98.2% within the 50 m perception radius, with message latencies of 12.4 ms enabling real-time coordination. Priority-based resolution demonstrated clear hierarchical behavior: emergency vehicles achieved 100% priority compliance, passenger vehicles with higher occupancy received preference in 89.3% of conflicts, and commercial vehicles successfully coordinated in 91.8% of freight corridor scenarios. Deadlock prevention mechanisms activated in only 0.7% of multi-agent scenarios, with timeout-based resolution successfully preventing system stalls. The framework’s ability to handle complex multi-agent scenarios while maintaining individual agent autonomy validates the effectiveness of the distributed collision avoidance architecture in realistic urban traffic conditions.
Figure 28 shows the multi-agent collision avoidance performance.
4.9. Collision Avoidance Maneuver Effectiveness
Quantitative analysis of individual collision avoidance maneuvers reveals performance variations based on scenario complexity and environmental conditions. Swerving maneuvers achieved success rates of 94.2% (simple obstacles), 89.7% (complex intersections), and 86.1% (dense traffic), with optimal swerving angles ranging from 8–15° depending on vehicle speed and available lateral space. Emergency braking demonstrated 98.3% effectiveness in preventing collisions when activated with a time to collision ≥ 1.2 s, degrading to 76.4% effectiveness when reaction time fell below 0.8 s. Lane change maneuvers showed dependency on traffic density, achieving 96.1% success in light traffic (≤15 vehicles/km), 88.7% in moderate traffic (15–30 vehicles/km), and 72.3% in dense traffic (>30 vehicles/km). Combined steering-braking maneuvers required an average of 3.4 s for completion but achieved the highest overall safety margins, maintaining minimum distances of 1.8 m from obstacles compared to 1.2 m for single-action responses. Speed adjustment strategies proved most effective in highway scenarios (94.8% success) compared to urban intersections (81.2% success), with optimal deceleration profiles following exponential decay functions that minimize passenger discomfort while ensuring collision avoidance.
Figure 29 shows the collision Avoidance Maneuver Effectiveness.
4.10. Discussions
As shown by the results of this work, the proposed framework meets the goal of AV navigation optimization in terms of the total travel time, safety, and energy consumption under various datasets and sophisticated scenarios. The specific one, the urban context-aware reward mechanism (UCARM), was very useful in proceeding with the proposed adaptation of the greedy algorithm to the dynamic structure and behavior of the urban environment, including real-time traffic information, road priority, and safety. It was this approach that made it possible to make navigation decisions with regard to context and at the same time minimize time used on the road where it was not necessary, in the process avoiding any extra fuel consumption or increased probability of an accident. DRAM was useful in reducing collision risks through its involvement of Bayesian inference and Markov Decision Processes. Through the correct estimation of possible collisions and the punishment of risky actions, DRAM helped to further improve the performance of the system during different weather conditions and dense traffic. The framework was able to prove its solidity and expansiveness by showing similar performance across the real-world datasets of Argoverse or nuScenes as well as synthetically designed edge-case datasets in CARLA. In real-world datasets, the framework was found to perform exceptionally in improving navigation by leveraging sensor-rich data to enable dynamic environment sensing. In the more difficult synthetic environments, it demonstrated its capacity to operate in extreme conditions where safety is the paramount concern but efficiency is still reasonable. The results support the proposed framework’s efficiency and will be expanded in future work to improve its applicability to unstructured and highly dynamic contexts. If the real-time feedback mechanisms were integrated to the framework, the decision-making process could be enriched during the interaction, and the unforeseen situations may be handled more effectively. Moreover, expanding the model’s reach by covering different road networks, different types of vehicles, and different cultural traffic rules will make a broader contribution towards real-world self-driving navigation systems.
To assess the system’s responsiveness in critical real-time scenarios, this research conducted a series of emergency simulations in the CARLA environment. These scenarios involved sudden appearances of pedestrians, animals, or cyclists crossing the vehicle’s path at close range (typically within 3–5 m), simulating urban uncertainties such as jaywalking or abrupt intrusions. The system’s reaction time was measured as the total time elapsed from the moment the threat was detected by onboard sensors to the execution of a corresponding control signal by the policy module.
Across 40 randomized trials, the model demonstrated an average reaction time between 0.152 and 0.176 s, depending on the complexity of the scene and proximity of the intruding object. This latency falls well within the commonly accepted benchmark (under 0.2 s) for safe, real-time operation in autonomous driving systems. The responsiveness is largely attributed to the integration of the DRAM with the UCARM, which together enable the system to evaluate collision probabilities and adapt actions dynamically.
These findings suggest that the proposed framework is capable of timely evasive actions in high-risk, unpredictable environments. Nevertheless, additional evaluations are planned under more challenging conditions, such as high-speed driving, poor lighting, and adverse weather, to validate the robustness of the system in real-world deployment scenarios.
To assess scalability, we extended URLNF to a scenario with up to 10 concurrent AV agents in CARLA. The framework maintained above a 90% success rate for up to five AVs, with a linear increase in computation time per step (~6 ms/vehicle). Beyond seven AVs, success rates dropped due to inter-agent coordination complexity, indicating a need for explicit multi-agent communication protocols in future work.
4.11. Limitations and Future Work
While the URLNF (Urban Reinforcement Learning Navigation Framework) demonstrates robust performance in dynamic urban environments using structured datasets like Argoverse, nuScenes, and CARLA, several limitations remain that impact its generalizability to real-world deployment scenarios.
Firstly, the current experiments are conducted within simulation platforms that, despite their sophistication, cannot fully replicate the diversity and unpredictability of real-world traffic. The tested scenarios are primarily based on predefined traffic flows and constrained event variations. This excludes a wide range of uncertainties such as unplanned road closures, spontaneous pedestrian crossings, inconsistent driver behaviors, or rapid weather changes, all of which are commonly encountered in real city environments.
Secondly, the sensory input used in the framework assumes near-perfect functioning of LiDAR, cameras, and radar modules. In practical deployment, these sensors can be affected by occlusions, heavy rain, snow, dirt, or lighting conditions. For instance, a fogged-up camera or LiDAR reflection in rain may lead to degraded perception. Such degradation is not currently modeled, making the perception module potentially fragile under harsh or unpredictable environments.
Moreover, the collision risk assessment module assumes a certain behavior distribution from surrounding agents, but in reality, human drivers may violate traffic rules or exhibit irrational maneuvers that are difficult to predict through standard models. Similarly, the energy optimization module operates under uniform battery performance assumptions without accounting for variable loads, terrain changes, or thermal effects on energy consumption.
In terms of data limitations, the Argoverse and nuScenes datasets primarily represent US-based and Asian urban layouts, respectively. These may not fully reflect traffic dynamics in other regions with different road infrastructures, cultural driving behaviors, or traffic control systems.
To address these gaps, future work will focus on the following directions:
Uncertainty Modeling: Incorporate robustness-aware reinforcement learning techniques to account for noisy sensor data, missing information, or false detections.
Adversarial Testing: Simulate aggressive or rule-violating agents to challenge the model’s decision-making robustness and adaptiveness in unexpected scenarios.
Weather and Environmental Variability: Integrate environmental perturbation models that emulate rain, fog, glare, and occlusions into the simulation loop.
Real-World Validation: Plan controlled pilot testing in small-scale real environments (e.g., closed campus roads or parking lots) to evaluate policy adaptation and perception reliability in live settings.
Cross-Domain Dataset Expansion: Extend training and evaluation to include datasets from varied geographies, driving cultures, and infrastructural layouts to ensure broader applicability and generalization.
These enhancements will help in evolving the current framework into a production-grade autonomous vehicle navigation system capable of safe, efficient, and adaptive operation across diverse urban environments.
