Article

Research on the Spatiotemporal Patterns of New Energy Vehicle Promotion Level in China

by
Yanmei Wang
1,
Fanlong Zeng
1,* and
Mingke He
2
1
School of Foreign Studies, Yiwu Industrial & Commercial College, Yiwu 322000, China
2
Business School, Beijing Technology and Business University, Beijing 100048, China
*
Author to whom correspondence should be addressed.
World Electr. Veh. J. 2025, 16(8), 456; https://doi.org/10.3390/wevj16080456
Submission received: 9 July 2025 / Revised: 7 August 2025 / Accepted: 9 August 2025 / Published: 11 August 2025

Abstract

Exploring the regional disparities in and spatiotemporal evolution of the new energy vehicle promotion level (NEVPL) is essential for facilitating low-carbon and environmentally sustainable development. This study employs a multidimensional index system to assess the NEVPL across 31 Chinese provinces from 2017 to 2023, utilizing data on NEV ownership, annual NEV sales, the number of public charging piles, and the vehicle-to-pile ratio. The NEVPL scores were estimated using the Entropy-TOPSIS method. Spatial patterns and the mechanisms of regional disparities were examined using a suite of spatial analytical techniques, including the standard deviation ellipse (SDE), gravity center analysis, Dagum Gini coefficient decomposition, and kernel density estimation. The results reveal three principal findings. First, NEVPL exhibited a sustained upward trend nationwide. The eastern region consistently maintained a leading position, the central and western regions demonstrated steady growth, and the northeastern region remained underdeveloped, leading to an expanding regional gap. Second, spatial distribution transitioned from an early dispersed pattern to a structure characterized by both agglomeration and differentiation. The promotional center gradually shifted toward the southeast, and high-value regions became increasingly isolated, forming island-like clusters. Third, spatial inequality was mainly driven by inter-regional differences, which contributed to over 70 percent of the total variance. The rising intra-regional disparity within the eastern region emerged as the predominant factor widening the national gap. These findings offer empirical evidence to support the refinement of new energy vehicle (NEV) policy frameworks and the promotion of balanced regional development.

1. Introduction

The “Emissions Gap Report 2024” published by the United Nations Environment Programme (UNEP) indicates that the transportation sector accounts for approximately one-third of global energy consumption and contributes nearly one-quarter of global carbon dioxide emissions [1]. In the context of China’s comprehensive “dual carbon” strategy, promoting a green and low-carbon transformation in transportation has become an urgent requirement for achieving national carbon peaking and carbon neutrality targets. This transformation relies heavily on the adoption of clean and low-carbon energy sources within the transportation sector, which is also recognized as a strategic priority for the country’s future development [2]. Among available options, new energy vehicles (NEVs) are regarded as a key measure for enabling China’s transition toward low-carbon transportation, due to their potential in energy conservation, emissions reduction, energy structure optimization, and pollution control [3].
A growing body of research has confirmed that NEVs significantly contribute to lowering carbon intensity and improving the sustainability of urban transport systems [2,3,4,5,6]. Their promotion also generates substantial external benefits, including improved public health, enhanced corporate performance, and better air quality [7,8]. For instance, Xue et al. [9] conducted a quantitative evaluation and found that NEV promotion stimulated green technological innovation in related firms and enhanced their operational performance. Yang et al. [10], using a health co-benefit evaluation model, demonstrated that the effective integration of economic policies with NEV promotion can yield improved environmental synergy. Liu et al. [11] developed a deep learning-based model for forecasting NEV sales, providing valuable insights for both business operations in the NEV sector and government decision-making.
To fully realize the potential of NEVs in reducing emissions and improving environmental quality, a wide range of policy instruments have been implemented in China, including fiscal subsidies [12], tax incentives [13], and the dual-credit policy [14]. These instruments have jointly formed a full-chain incentive system covering research and development, production, and consumption, thereby promoting NEVs nationwide. However, as the marginal effectiveness of these incentives diminishes, the NEV market in China is entering a post-subsidy era. Zhou et al. [15] indicated that, in the absence of subsidies and under constant vehicle sales, NEVs must replace at least 85 percent of conventional fuel vehicles to minimize the “rebound effect” on carbon emissions (the “rebound effect” in the context of carbon emissions from NEVs refers to the phenomenon where the expected reduction in carbon emissions from adopting NEVs is partly offset by behavioral and economic changes [15]). This scenario would be the most favorable for reducing carbon output and alleviating environmental pressure. Nevertheless, the withdrawal of subsidies may increase upfront costs and reduce consumer willingness to purchase NEVs in the post-subsidy period [16], thereby limiting the substitution of conventional vehicles and weakening the intended emission-reduction effects.
In response to this policy bottleneck, researchers have emphasized the need to focus on structural innovation and institutional coordination. Proposed strategies include the development of battery-swapping models [17] and investment in intelligent infrastructure [18,19]. Some scholars argue that NEV manufacturers should enhance vehicle performance, improve space efficiency through design optimization, and upgrade aesthetic features to better meet consumer preferences [20]. In parallel, consumer cognition and perceived benefits have been shown to influence purchasing intentions [21]. Accordingly, it is essential for public policy to go beyond financial support and prioritize awareness-raising measures [22] and improvements in operational convenience [23], in order to increase the effectiveness of NEV promotion.
Although considerable progress has been made in evaluating policy instruments and their outcomes, the existing literature on NEV promotion remains largely focused on national-level trends or specific urban cases. Few studies have systematically examined regional disparities and their dynamic evolution, especially in a country like China with significant regional differences. Existing studies, such as Dong et al. [24], used a novel multi-attribute decision-making (MADM) model to assess the promotion potential of ten major cities. However, their research is limited by both the temporal span and spatial coverage and does not reveal the spatiotemporal evolution patterns of NEV promotion levels or the mechanisms behind regional disparities. Therefore, investigating regional disparities in NEV promotion can contribute to more targeted, context-specific policy design and more efficient coordination of regional development efforts.
To address this research gap, the present study evaluates the NEVPL across 31 provincial-level administrative regions in mainland China (excluding Hong Kong, Macao, and Taiwan due to data limitations). A comprehensive index system is developed, and NEVPL scores from 2017 to 2023 are calculated using the Entropy -TOPSIS method. Spatial analytical techniques—including center of gravity analysis, the SDE model, Dagum Gini coefficient decomposition, and kernel density estimation—are employed to explore the spatiotemporal dynamics and the formation mechanisms of regional disparities in the NEVPL.
The contributions of this study are threefold. First, at the theoretical level, it integrates multiple spatial analysis methods to deepen the understanding of the spatiotemporal mechanisms of NEV promotion. Second, at the empirical level, it constructs a cross-regional, cross-temporal evaluation framework for the NEVPL, filling a gap in nationwide dynamic assessments. Third, at the policy level, it provides actionable recommendations for promoting coordinated regional development, grounded in findings on spatial centers of promotion and interregional disparities. These insights are intended to support evidence-based policymaking for optimizing China’s transportation energy structure under the dual-carbon strategy.
The remainder of this paper is organized as follows. Section 2 describes the study area, the construction of the evaluation index system, and the data sources. Section 3 outlines the research methods, including the Entropy-TOPSIS model and spatial disparity analysis. Section 4 presents the temporal and spatial distribution characteristics of the NEVPL. Section 5 explores the spatiotemporal evolution mechanisms of the NEVPL. Section 6 summarizes the main findings and proposes targeted policy recommendations aimed at facilitating spatially coordinated NEV promotion and informed policy design. The methodological framework is shown in Figure 1.

2. Study Area, Evaluation Index System, and Data Sources

2.1. Study Area

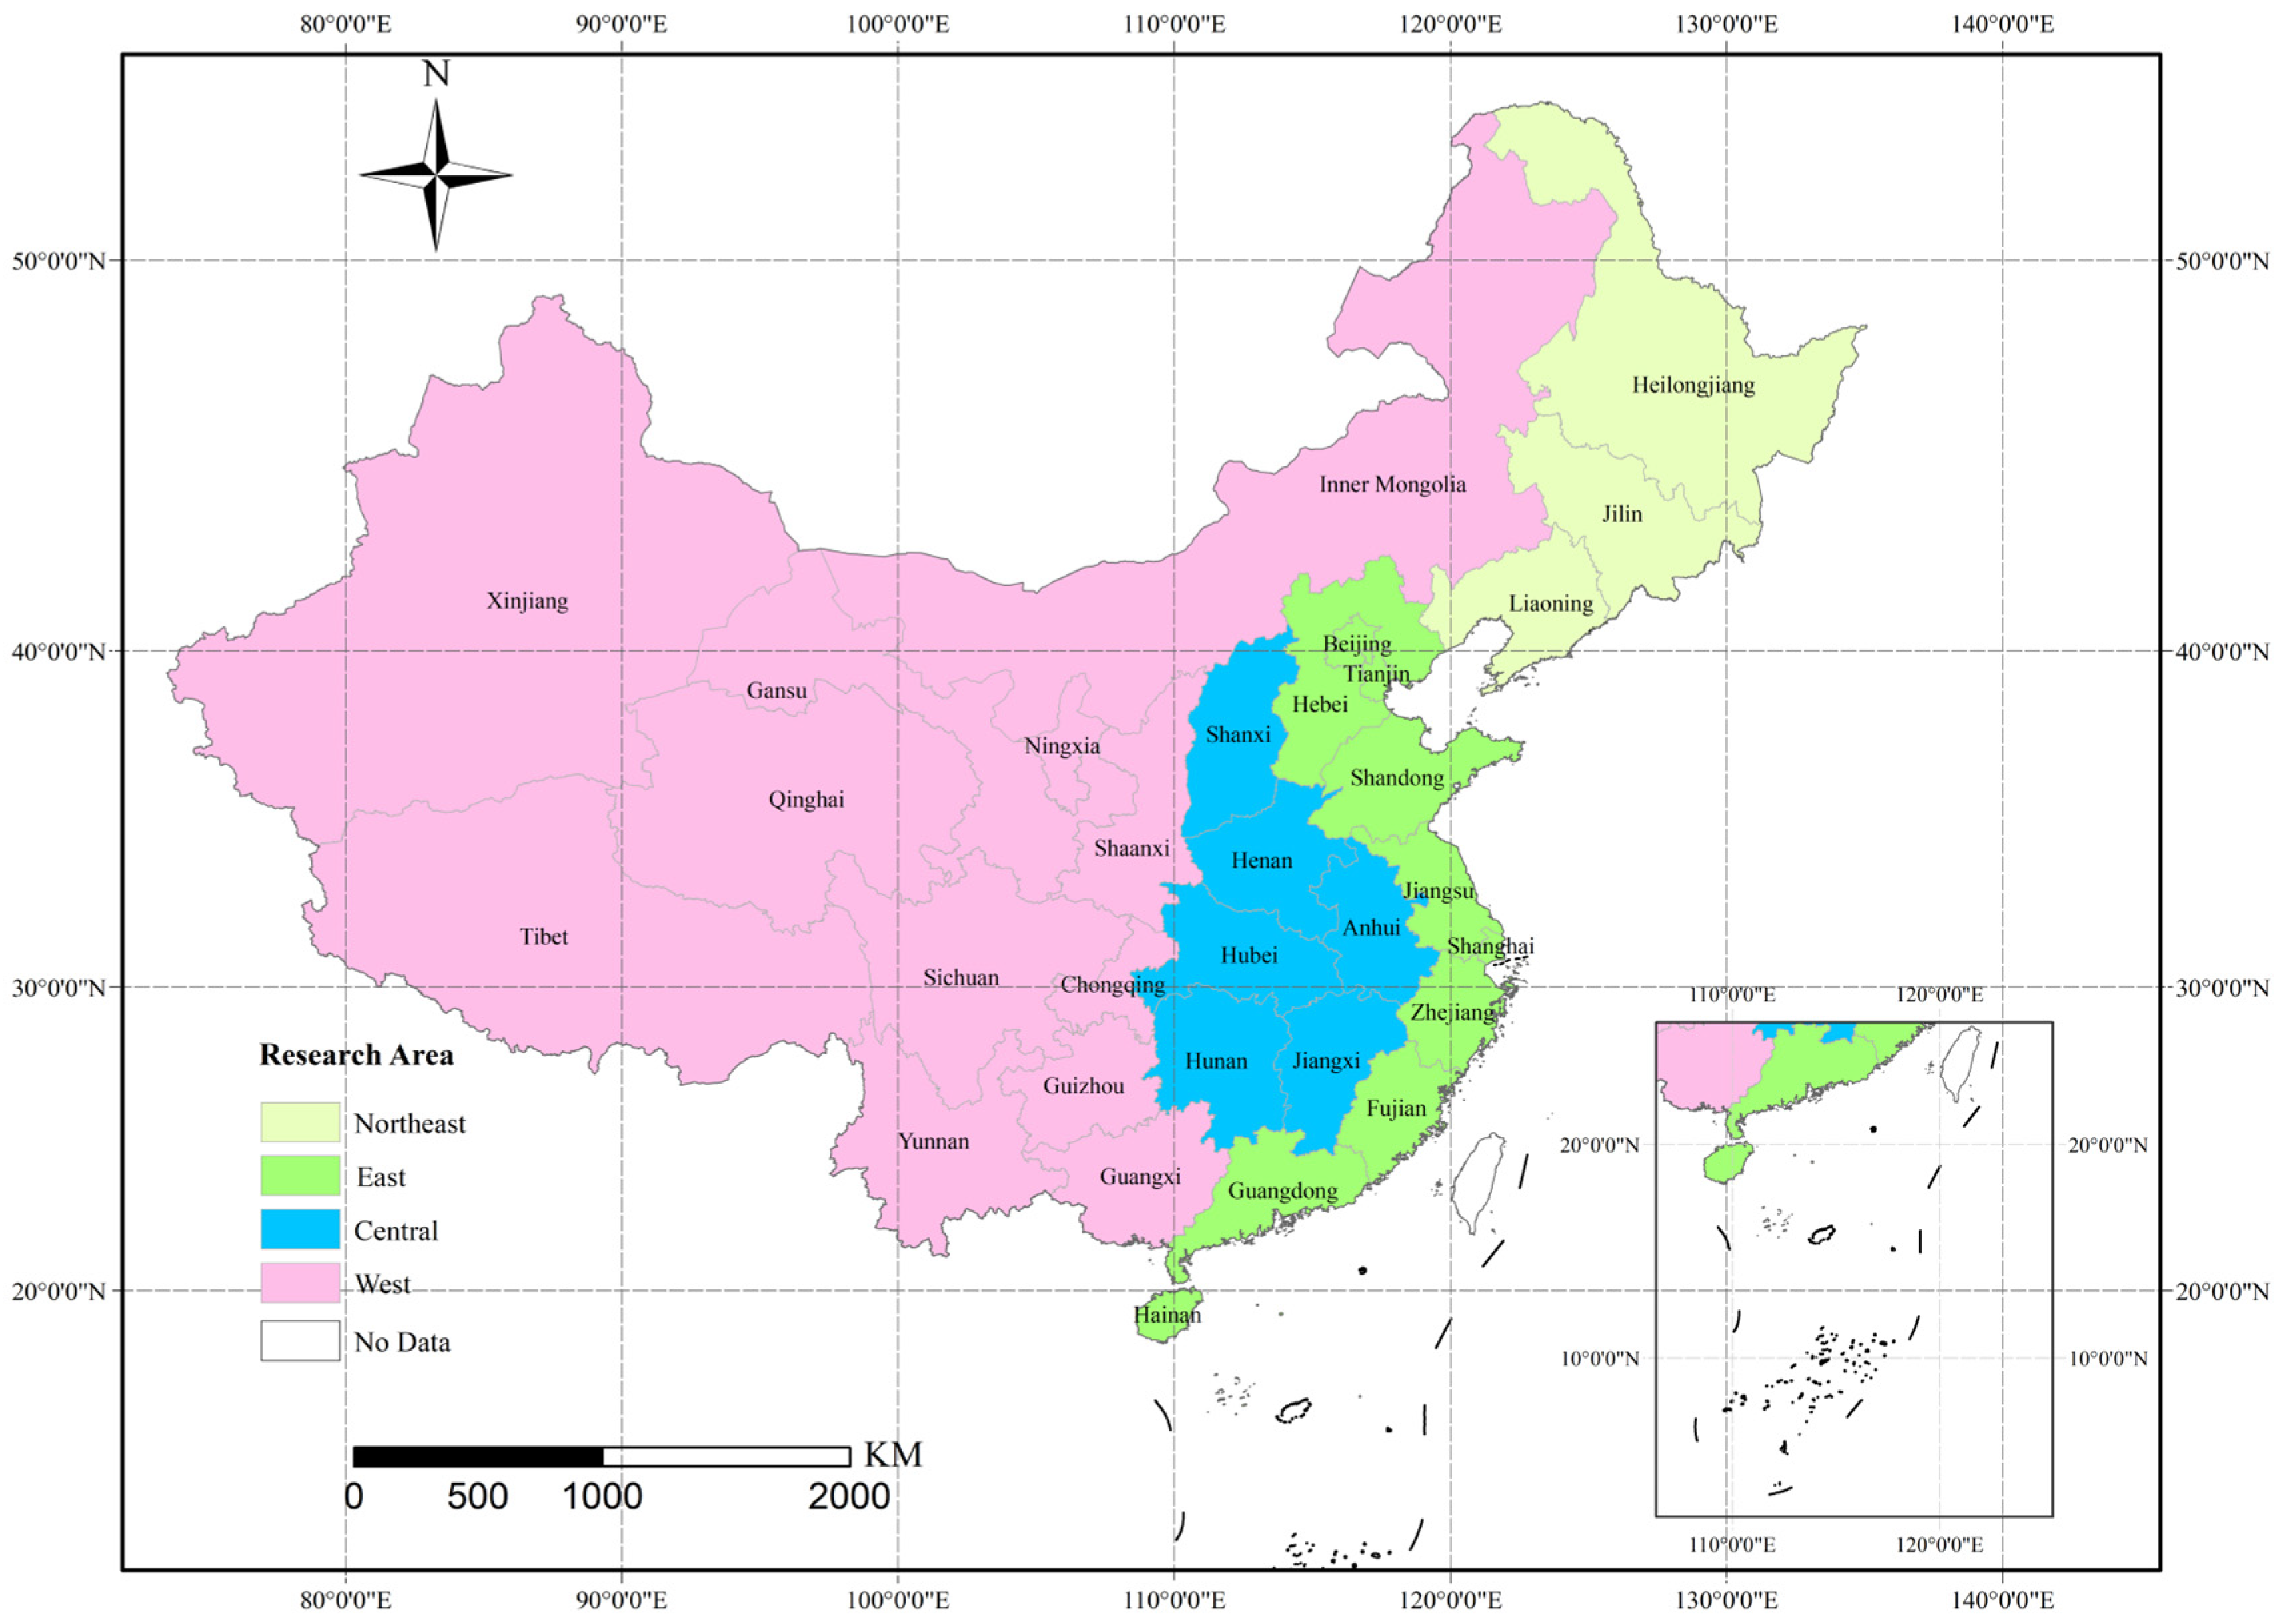
This study focuses on 31 provincial-level administrative regions in mainland China, which are grouped into four major economic regions: eastern, central, western, and northeastern China, as shown in Figure 2 [25]. The eastern region, as the most economically developed area [26], features strong industrial foundations, high income levels, and well-developed infrastructure. NEV promotion in this region benefits from high market demand and relatively comprehensive charging infrastructure. The central region lags behind the east in terms of economic development [27], but recent years have seen intensified NEV promotion driven by policy support and industrial upgrading, making it a rapidly emerging potential market. The western region, being relatively underdeveloped [28], faces challenges such as insufficient infrastructure and weak market demand. However, increasing state-level support has begun to unlock its potential for NEV promotion. The northeastern region, traditionally a heavy industrial base [29], has experienced economic restructuring pressures in recent years. While NEV adoption has been slower in this region, green transition initiatives and supportive policies have contributed to renewed market activity. Based on this four-region classification, spatiotemporal variation in the NEVPL is examined to provide a scientific foundation for understanding the dynamics of regional NEV diffusion.

2.2. Evaluation Index System and Data Sources

Existing research commonly uses either NEV ownership [30] or annual NEV sales [31] to measure the promotion level of NEVs. However, relying on a single indicator has significant limitations in capturing the complexity of regional differences. To provide a more comprehensive assessment of the NEVPL across China’s 31 provinces, this study adopts a multi-indicator evaluation system based on established literature [32,33,34,35], incorporating four key variables: NEV ownership, annual NEV sales, the number of public charging piles, and the vehicle-to-pile ratio.
(1)
NEV ownership refers to the total number of NEVs in use at a given point in time. A higher ownership level generally indicates stronger and more stable market demand, along with a more mature user base.
(2)
Annual NEV sales capture the year-on-year market expansion and reflect consumers’ willingness to adopt NEVs. Sales growth is typically associated with improved technological performance and enhanced policy support.
(3)
The number of public charging piles measures the availability of essential infrastructure for NEV operation. A greater charging density indicates a more complete charging network and contributes to improved usage convenience and market growth.
(4)
The vehicle-to-pile ratio is defined as the number of NEVs per public charging pile. This metric reflects the adequacy of charging infrastructure relative to vehicle ownership. A more balanced ratio improves the charging efficiency and mitigates infrastructure-related bottlenecks.
Based on these four indicators, provincial-level data from 2017 to 2023 were collected for all 31 provinces in China. The data were primarily obtained from publicly available sources, including the China Passenger Car Association and the China Electric Vehicle Charging Infrastructure Promotion Alliance.

3. Research Methods

This study combines classical MADM methods with spatial econometric techniques to evaluate the NEVPL across 31 provinces in China. The innovation lies in how these methods are integrated to provide a comprehensive and multidimensional evaluation of NEV promotion levels, capturing both the temporal and spatial dynamics essential for understanding regional disparities. The Entropy-TOPSIS model, a well-established MADM approach, is applied over an extended period (2017–2023) to ensure appropriate weighting of each indicator and generate a reliable regional ranking. Additionally, spatial econometric tools such as gravity center analysis, SDE, Dagum Gini coefficient decomposition, and kernel density estimation offer nuanced insights into the regional distribution and shifting dynamics of NEV promotion. These methods, although widely used in geographic and economic research, have not been widely applied to NEV promotion at a national level across multiple provinces. By integrating these approaches, this study provides a dynamic and spatially-sensitive framework, contributing to a deeper understanding of how regional factors, policies, and infrastructure development influence NEV adoption patterns across China.

3.1. Entropy-TOPSIS Model

The Entropy-TOPSIS model is a classical and well-established MADM method. It has been widely applied in various fields such as business management [36], ecological security [37], engineering and technology [38,39], and financial risk assessment [40] for the purpose of quantitative index evaluation. The model has demonstrated strong reliability and robustness, making it suitable for calculating the NEVPL in this study. The specific modeling steps are as follows [37]:
Step 1: Construct the initial decision matrix. Assume there are m alternatives to be evaluated and n evaluation criteria. Construct the evaluation matrix A = a i j m × n , where a i j represents the value corresponding to the j-th indicator for the i-th alternative.
A = a 11 a 12 a 1 n a 21 a 22 a 2 n a m 1 a m 2 a m n
Step 2: Normalize the indicators. To eliminate the influence of differing units or scales among the indicators, the following normalization formula is applied.
x i j = a i j min a i j max a i j min a i j , j B e n e f i t   i n d i c a t o r s x i j = max a i j a i j max a i j min a i j , j C o s t   i n d i c a t o r s
Step 3: Calculate the entropy value of each indicator.
E j = 1 ln m i = 1 m p i j ln p i j
where p i j = x i j i = 1 m x i j , if p i j = 0 , then lim p i j 0 p i j ln p i j = 0 .
Step 4: Calculate the weight of each indicator.
w j = 1 E j j = 1 n 1 E j
Step 5: Construct the weighted normalized decision matrix R = r i j m × n .
R = r 11 r 12 r 1 n r 21 r 22 r 2 n r m 1 r n 2 r m n , r i j = w j × x i j
Step 6: Determine the positive and the negative ideal solution.
R j + = max r i j   |   j = 1 , , n R j = min r i j   |   j = 1 , , n
Step 7: Compute the Euclidean distance of each alternative from the positive and negative ideal solutions.
d i + = j = 1 n ( R j + r i j ) 2 d i = j = 1 n ( R j r i j ) 2
Step 8: Calculate the relative closeness to the ideal solution, which represents the NEVPL score for each region.
C i = d i d i + + d i

3.2. Spatial Distribution Analysis Model

Gravity center migration and the SDE are often combined to analyze the spatiotemporal evolution patterns of sample values [41,42]. Gravity center migration reflects the extent of change and spatial disparity of sample values in a specific region by calculating the spatial distribution center. The SDE, based on the computed center, visually represents the spatial agglomeration and dispersion trends of an economic phenomenon in the form of a spatial ellipse. Based on these theories, this study uses gravity center migration and the SDE model to analyze the spatiotemporal evolution patterns of the NEVPL, with the calculation methods given in Equations (9)–(11) [43].
( X ¯ , Y ¯ ) = i = 1 m C i × X i i = 1 m C i , i = 1 m C i × Y i i = 1 m C i
σ x = 2 i = 1 m X ¯ × C i × cos θ X ¯ × C i × sin θ 2 m σ y = 2 i = 1 m Y ¯ × C i × cos θ Y ¯ × C i × sin θ 2 m
tan θ = i = 1 m X i 2 ¯ × Y i 2 ¯ × C i i = 1 m Y i 2 ¯ × C i + i = 1 m X i 2 ¯ × Y i 2 ¯ i = 1 m Y i 2 ¯ × C i + 4 i = 1 m X i ¯ × Y i ¯ × C i 2 2 i = 1 m X i ¯ × Y i ¯ × C i
where: X i and Y i represent the longitude and latitude of the i-th region, respectively; C i is the NEVPL index of the i-th region, calculated using the Entropy-TOPSIS model; m represents the number of regions, which is 31 in this study; ( X ¯ , Y ¯ ) represents the center of gravity coordinates for the promotion level of NEVs in China; σ x and σ y represent the standard deviations of the long and short axes of the spatial ellipse, respectively; and θ represents the rotation angle.

3.3. Spatial Disparity Analysis Method

3.3.1. Dagum Gini Coefficient

The Dagum Gini coefficient effectively identifies the sources of regional disparities and decomposes these differences. Compared to the coefficient of variation and the Theil index, the Dagum Gini coefficient accounts for issues such as overlapping data within sub-samples. Therefore, this study uses the Dagum Gini coefficient [44] to measure the regional disparity and its sources in the NEVPL across Chinese provinces. The formulae are as follows:
G = 1 2 × m 2 × C ¯ × j = 1 k h = 1 k i = 1 m j r = 1 m h C j i C h r
G j j = 1 2 × C ¯ × i = 1 m j r = 1 m j C j i C j r m j 2
G j h = i = 1 m j r = 1 m h C j i C h r m j × m h × C j ¯ + C h ¯
where: G represents the overall Gini coefficient, which can be further decomposed into three components: intra-regional differences ( G w ), inter-regional differences ( G n b ), and intensity of transvariation ( G t ), the specific decomposition process is detailed in reference [45]. m is the number of provinces, and k is the number of regions (in this study, the four major regions are East, Central, West, and Northeast); C j i ( C h r ) is the NEVPL of the province j (h) within the region i (r); m j ( m h ) is the number of provinces in the region j (h); C ¯ is the mean NEVPL across all provinces; G j j is the Gini coefficient within the region j, G j h represents the Gini coefficient between region j and h; and C j ¯ ( C h ¯ ) is the mean NEVPL for the province j (h).

3.3.2. Kernel Density Estimation

Kernel density estimation is a non-parametric estimation method used to describe the distribution and characteristics of random variables based on continuous density curves [46]. This method is employed in this study to analyze the distribution patterns and extensibility trends of the NEVPL. The calculation formulas are as follows [46]:
f ( C ) = i = 1 m K C i C i ¯ h m × h
K ( C ) = e x p ( C 2 2 ) 2 × π
In Equations (15) and (16), C i and C i ¯ represent the observed value and mean NEVPL for the i-th province, respectively; m is the number of provinces; h represents the bandwidth; and K ( ) is the Gaussian kernel density function.

4. Results

4.1. Temporal Distribution Characteristics of NEVPL in China

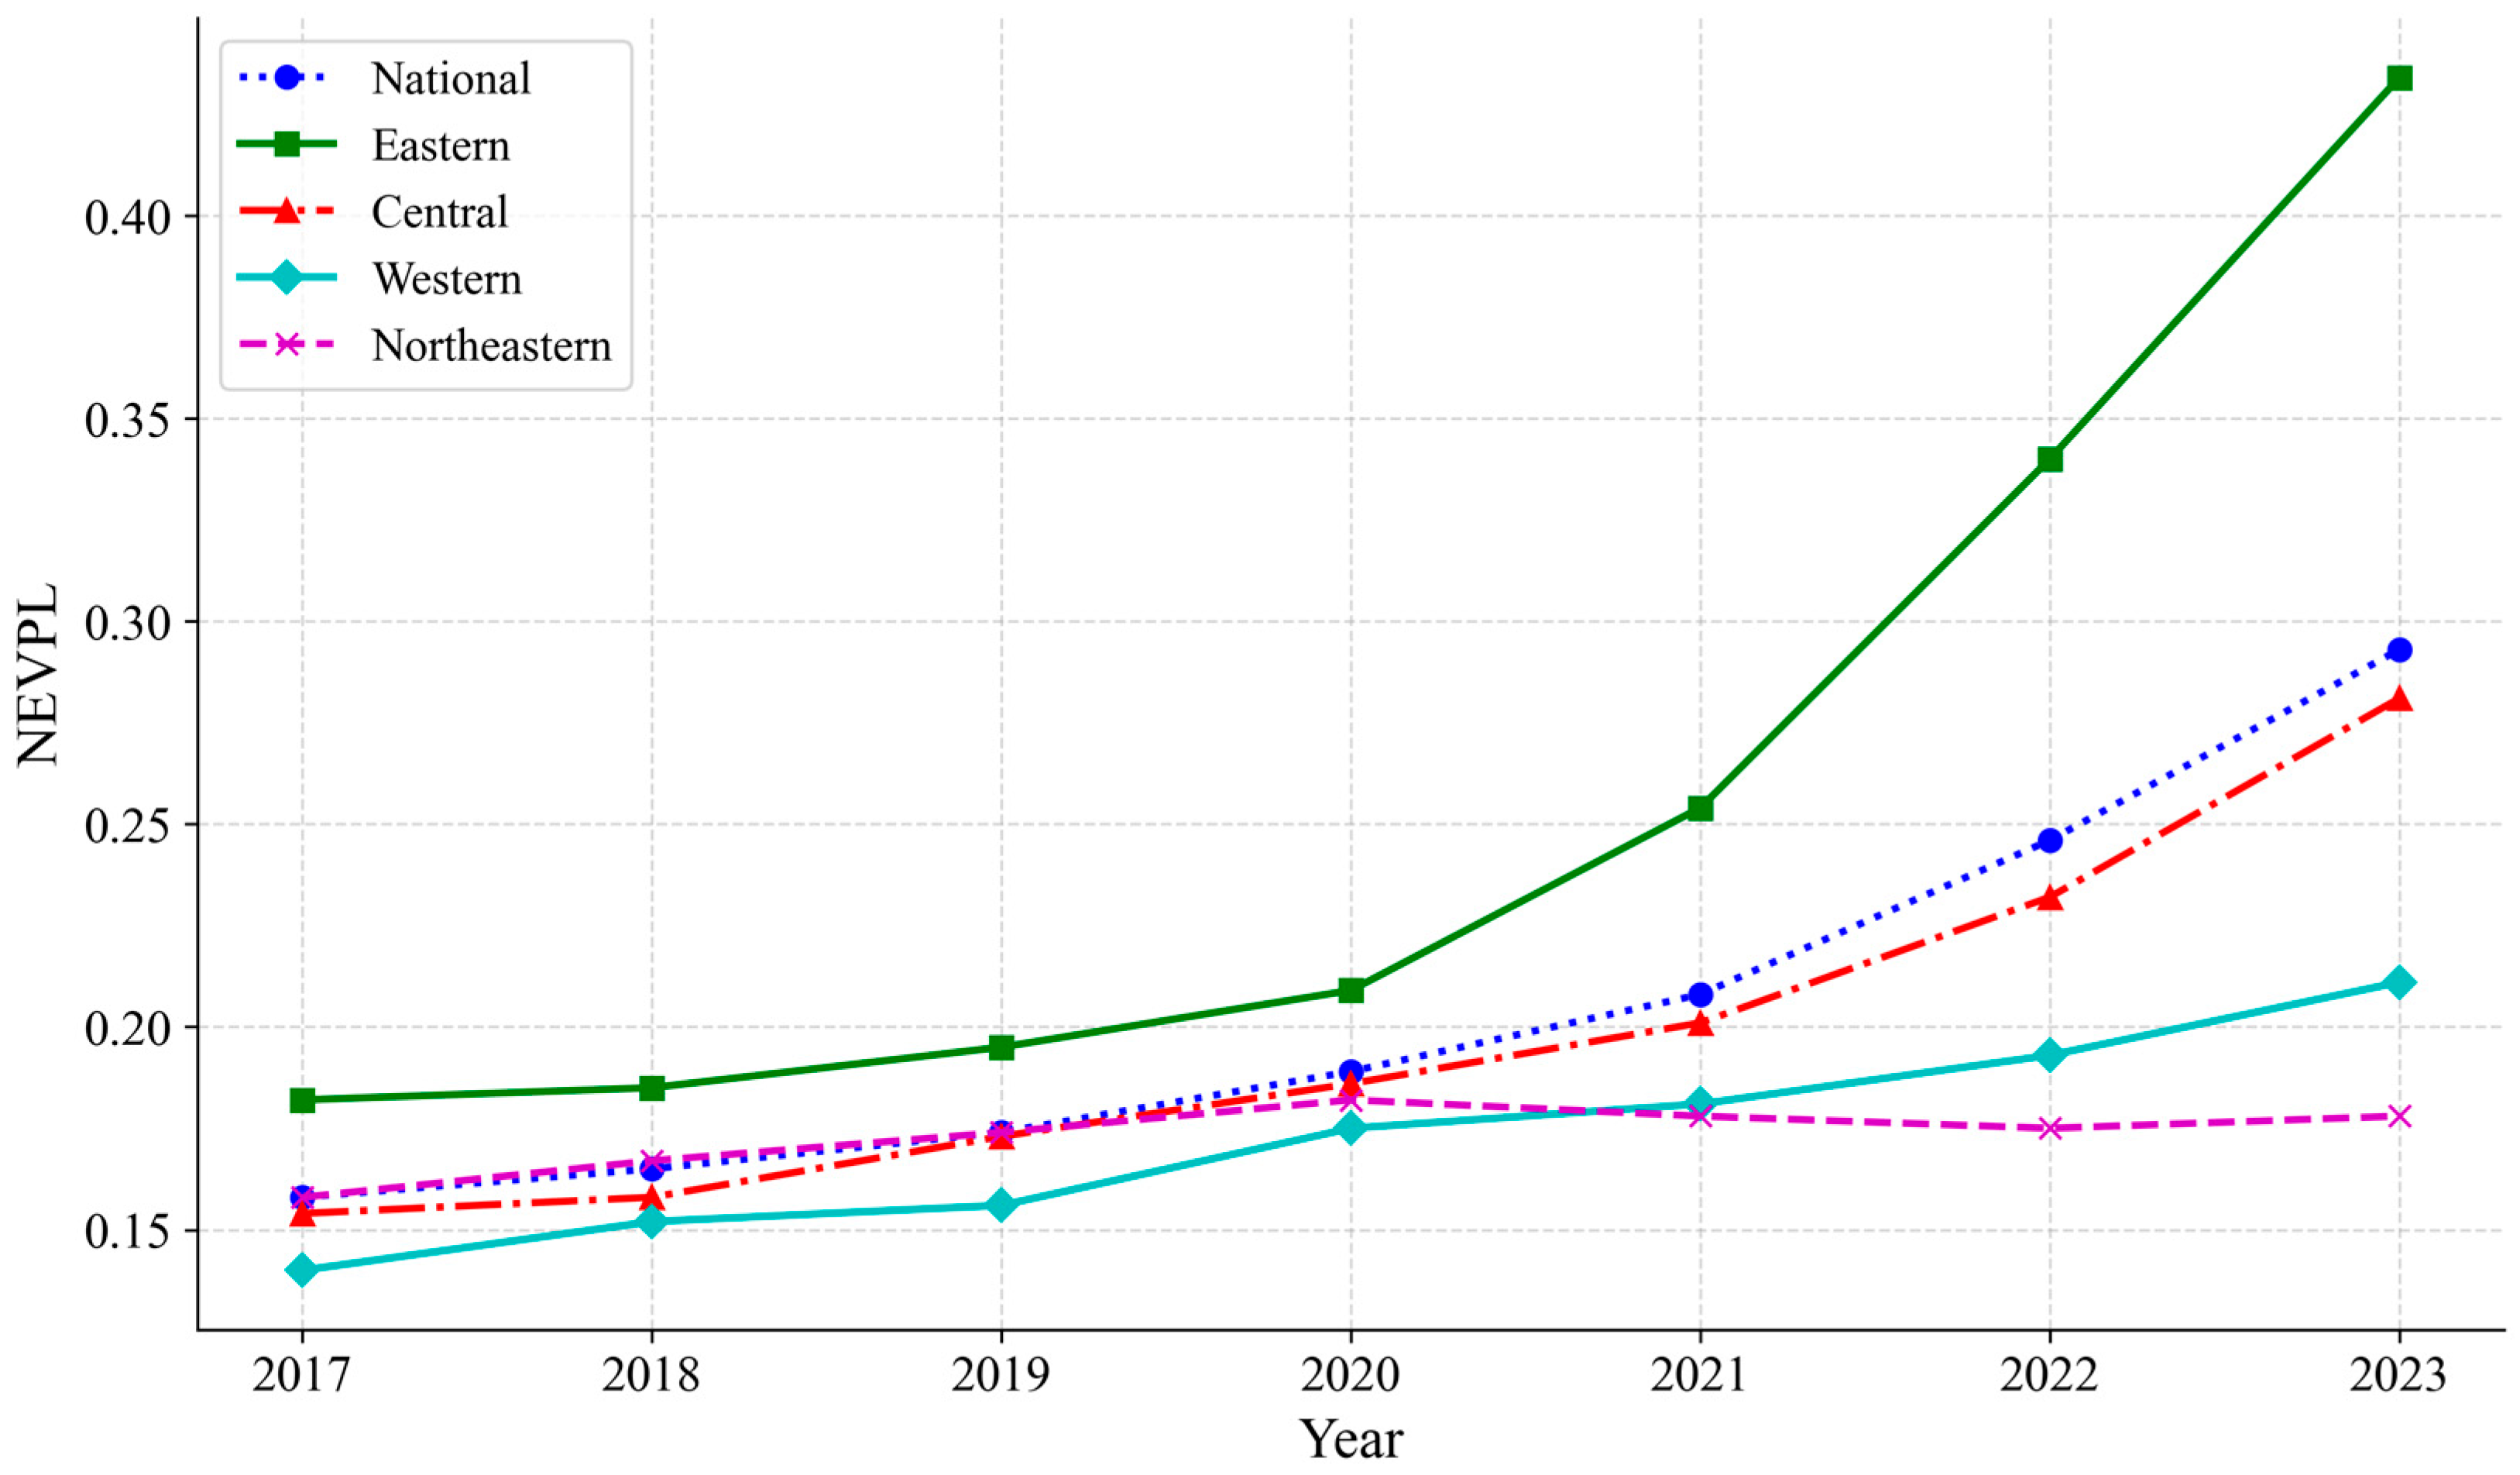
Figure 3 illustrates the evolution trend of the NEVPL in China and its four major economic regions from 2017 to 2023. Based on the calculated results, the NEVPL in China shows the following characteristics: first, the overall NEVPL in China has demonstrated a steady upward trend, reaching 0.293 in 2023, compared to 0.158 in 2017, with an average annual growth rate of 10.84%. This indicates significant progress in promoting NEVs across the country. However, the overall NEVPL remains relatively low. Second, there are regional differences in the growth rate of NEVPL. The eastern region has consistently maintained a higher NEVPL than the other regions, with an average annual growth rate of 15.59%. In 2023, the NEVPL reached 0.434, far exceeding the levels of other regions. This reflects the comprehensive advantages of the eastern region in terms of policy support, market demand, and infrastructure development. The central and western regions have average annual growth rates of 10.54% and 7.08%, respectively, showing steady growth in the NEV market in these regions. However, both the growth rate and NEVPL in these regions are still lower than the national average, and the gap between the central/western regions and the eastern region has further widened. Third, prior to 2020, the NEVPL in the northeastern region was only slightly lower than in the eastern region and was marginally higher than the central and western regions, maintaining a slow growth rate. However, since 2020, the NEVPL in the northeastern region has stagnated or even declined, indicating significant challenges in the promotion of NEVs in this region. Overall, although the national NEVPL has gradually improved, especially with the increasing dominance of the eastern region, the regional disparities have become even more pronounced.

4.2. Spatial Characteristics of NEVPL in China

As shown in Figure 4, in 2017, the NEVPL across provinces in China was generally low, with relatively small regional differences. By 2023, the NEVPL in all provinces had increased to some extent, but a two-tier differentiation phenomenon had emerged, significantly expanding the regional disparities. Specifically, in 2017, Guangdong province stood out with the highest NEVPL, whereas by 2023, provinces with higher NEVPL were mainly concentrated in the eastern coastal regions, particularly in the Yangtze River Delta, Pearl River Delta, and Beijing-Tianjin-Hebei regions. These regions have seen the faster adoption of NEVs due to their higher economic development levels, well-developed infrastructure, and strong policy support. The NEVPL in these areas has generally been higher, with some regions exceeding the index of 0.255. The advantage of the eastern region remains prominent, especially in terms of market demand for NEVs and the development of charging infrastructure, which has created strong market attractiveness.
The central and western regions have gradually increased their NEVPL over the past few years, particularly in some provincial capitals and economically developed areas. For example, provinces such as Chongqing, Sichuan, and Henan have seen an improvement in the NEVPL. This indicates that the central and western regions have seen gradual improvements in policy support and market demand. However, the northeastern region, as China’s traditional industrial base, still faces a relatively low NEVPL, and the growth rate has been slow. This reflects the region’s challenges in economic transformation, relatively underdeveloped infrastructure, and insufficient market demand.
From a spatial distribution perspective, in 2023, provinces with a higher NEVPL were mainly located to the east of the “Hu Huanyong Line”, while the provinces to the west generally had lower promotion levels. The eastern region’s dominance has been significantly enhanced and consolidated, while the central and western regions have also seen steady improvements. However, the northeastern region’s overall progress has been relatively lagging. Overall, the spatial characteristics of NEVPL show significant regional imbalance, with the eastern region continuing to lead, the central and western regions gradually catching up, and the northeastern region still facing significant challenges in the promotion process.

5. Spatiotemporal Evolution Characteristic Analysis

5.1. Spatial Distribution Characteristics of NEVPL in China

5.1.1. Directionality Analysis of Spatial Distribution

Based on the SDE distribution of the NEVPL in China for 2017 and 2023 (Figure 5) and the corresponding parameters (Table 1), it can be observed that from 2017 to 2023, the angle of the SDE for the NEVPL across provinces in China concentrated between 40° and 55°, with a clockwise rotation, indicating a southeastward shift. The major axis shows an extension pattern in the northeast-southwest direction, and both the major and minor axes have decreased in length. This suggests that the NEVPL across provinces in China exhibits a tendency for spatial agglomeration in both the east–west and north–south directions, with an increased degree of spatial clustering. Lastly, the ellipticity of the ellipse decreased from 1.15 in 2017 to 1.08 in 2023, indicating that the spatial distribution of the NEVPL has become more balanced, with a reduced directionality.

5.1.2. Gravity Center Migration Analysis of Spatial Distribution

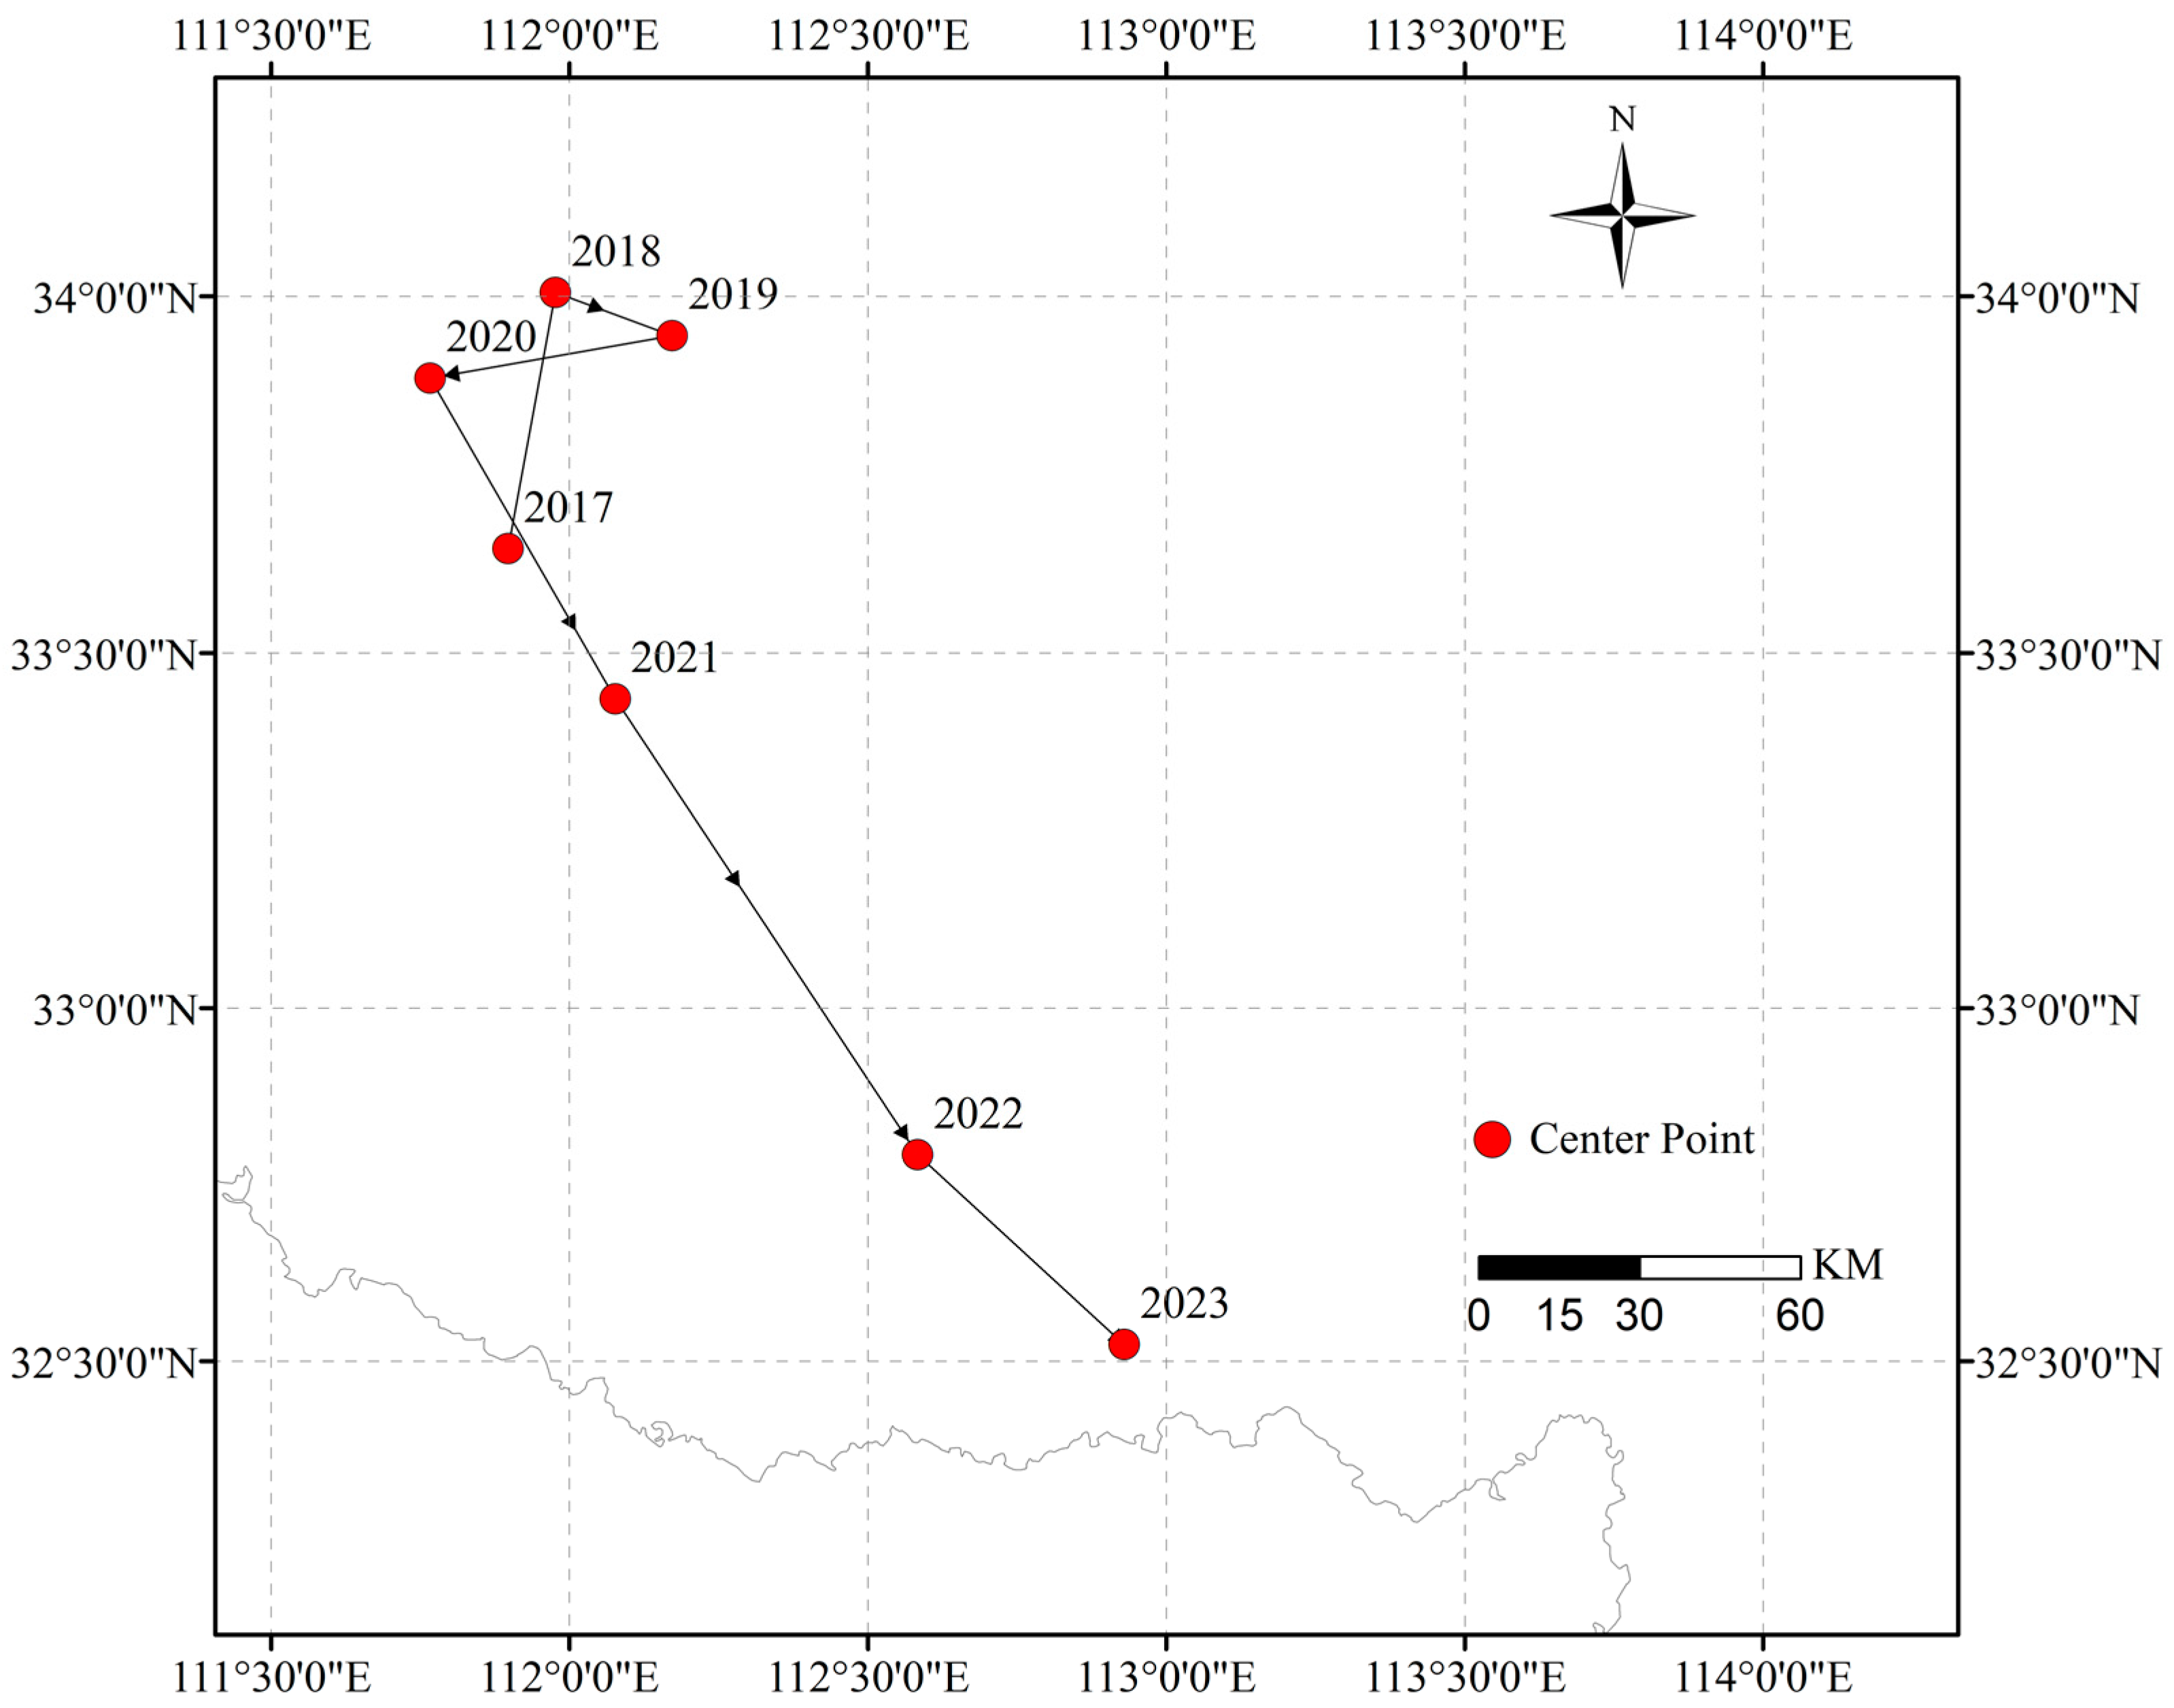
From 2017 to 2023, the gravity center of the NEVPL across Chinese provinces exhibited a clear directional trajectory. As shown in Figure 6, the gravity center shifted northward from 2017 to 2018. Between 2018 and 2019, it moved southeastward, followed by a southwestward shift from 2019 to 2020. After 2020, the gravity center continued to move southward and gradually stabilized in the southeastern direction. These changes in spatial focus are likely closely related to regional differences in economic development, policy support, and infrastructure construction. The southeastern coastal region has experienced sustained economic growth and increasing market demand, coupled with strong policy incentives, which has led to a concentration of the NEVPL in this area. At the same time, the central and western regions have gradually improved their NEVPL, contributing to the southward shift of the gravity center and its eventual stabilization in the southeastern coastal region.

5.2. Spatial Disparities and Dynamic Evolution of NEVPL in China

5.2.1. Spatial Disparity Analysis

As shown in Table 2, the overall Gini coefficient experienced two distinct phases: a decline from 0.114 in 2017 to 0.061 in 2020, followed by an increase to 0.260 in 2023. This trend indicates that the disparity in the NEVPL across Chinese provinces was initially alleviated but has become more pronounced in recent years.
In terms of intra-regional disparities, the Gini coefficient for the eastern region rose from 0.034 in 2017 to 0.273 in 2023, marking the largest increase among all regions. This suggests that, although the eastern region maintains a relatively high overall NEVPL, it also exhibits the most pronounced internal disparities. The central, western, and northeastern regions show similar trends to the national pattern, with initial decreases followed by increases. Notably, in 2023, the Gini coefficients for the central and eastern regions were relatively low and close in value, indicating mild and comparable levels of regional imbalance. The northeastern region maintained the lowest intra-regional disparity among all regions.
In terms of inter-regional disparities, the differences between the eastern region and the other three regions were generally high, with the largest disparity occurring between the eastern and northeastern regions and the smallest between the western and northeastern regions. Over time, disparities between the eastern region and the central, western, and northeastern regions showed an initial narrowing followed by a marked expansion. In contrast, differences between the central region and both the western and northeastern regions also widened but to a lesser extent. Additionally, the disparity between the western and northeastern regions remained small and relatively stable over time.
As shown in Table 3, from 2017 to 2023, spatial disparities in the NEVPL were primarily driven by inter-regional differences, followed by intra-regional differences, while the intensity of transvariation contributed the least. Both intra-regional differences and transvariation showed a declining trend over time, and their combined contribution remained below 50% throughout the period.
In contrast, the contribution of inter-regional differences continuously increased—from 52.65% in 2017 to 70.39% in 2023—indicating that spatial disparities in the NEVPL in China are increasingly dominated by inter-regional gaps, especially the growing lead of the eastern region over the others. Although intra-regional disparities slightly decreased, the intensifying inter-regional differences have led to an overall expansion in inequality.
This finding suggests that policy efforts should not only continue to address internal disparities within regions but also place greater emphasis on narrowing inter-regional gaps, thereby promoting more balanced NEV development across regions.

5.2.2. Dynamic Evolution of Spatial Disparities

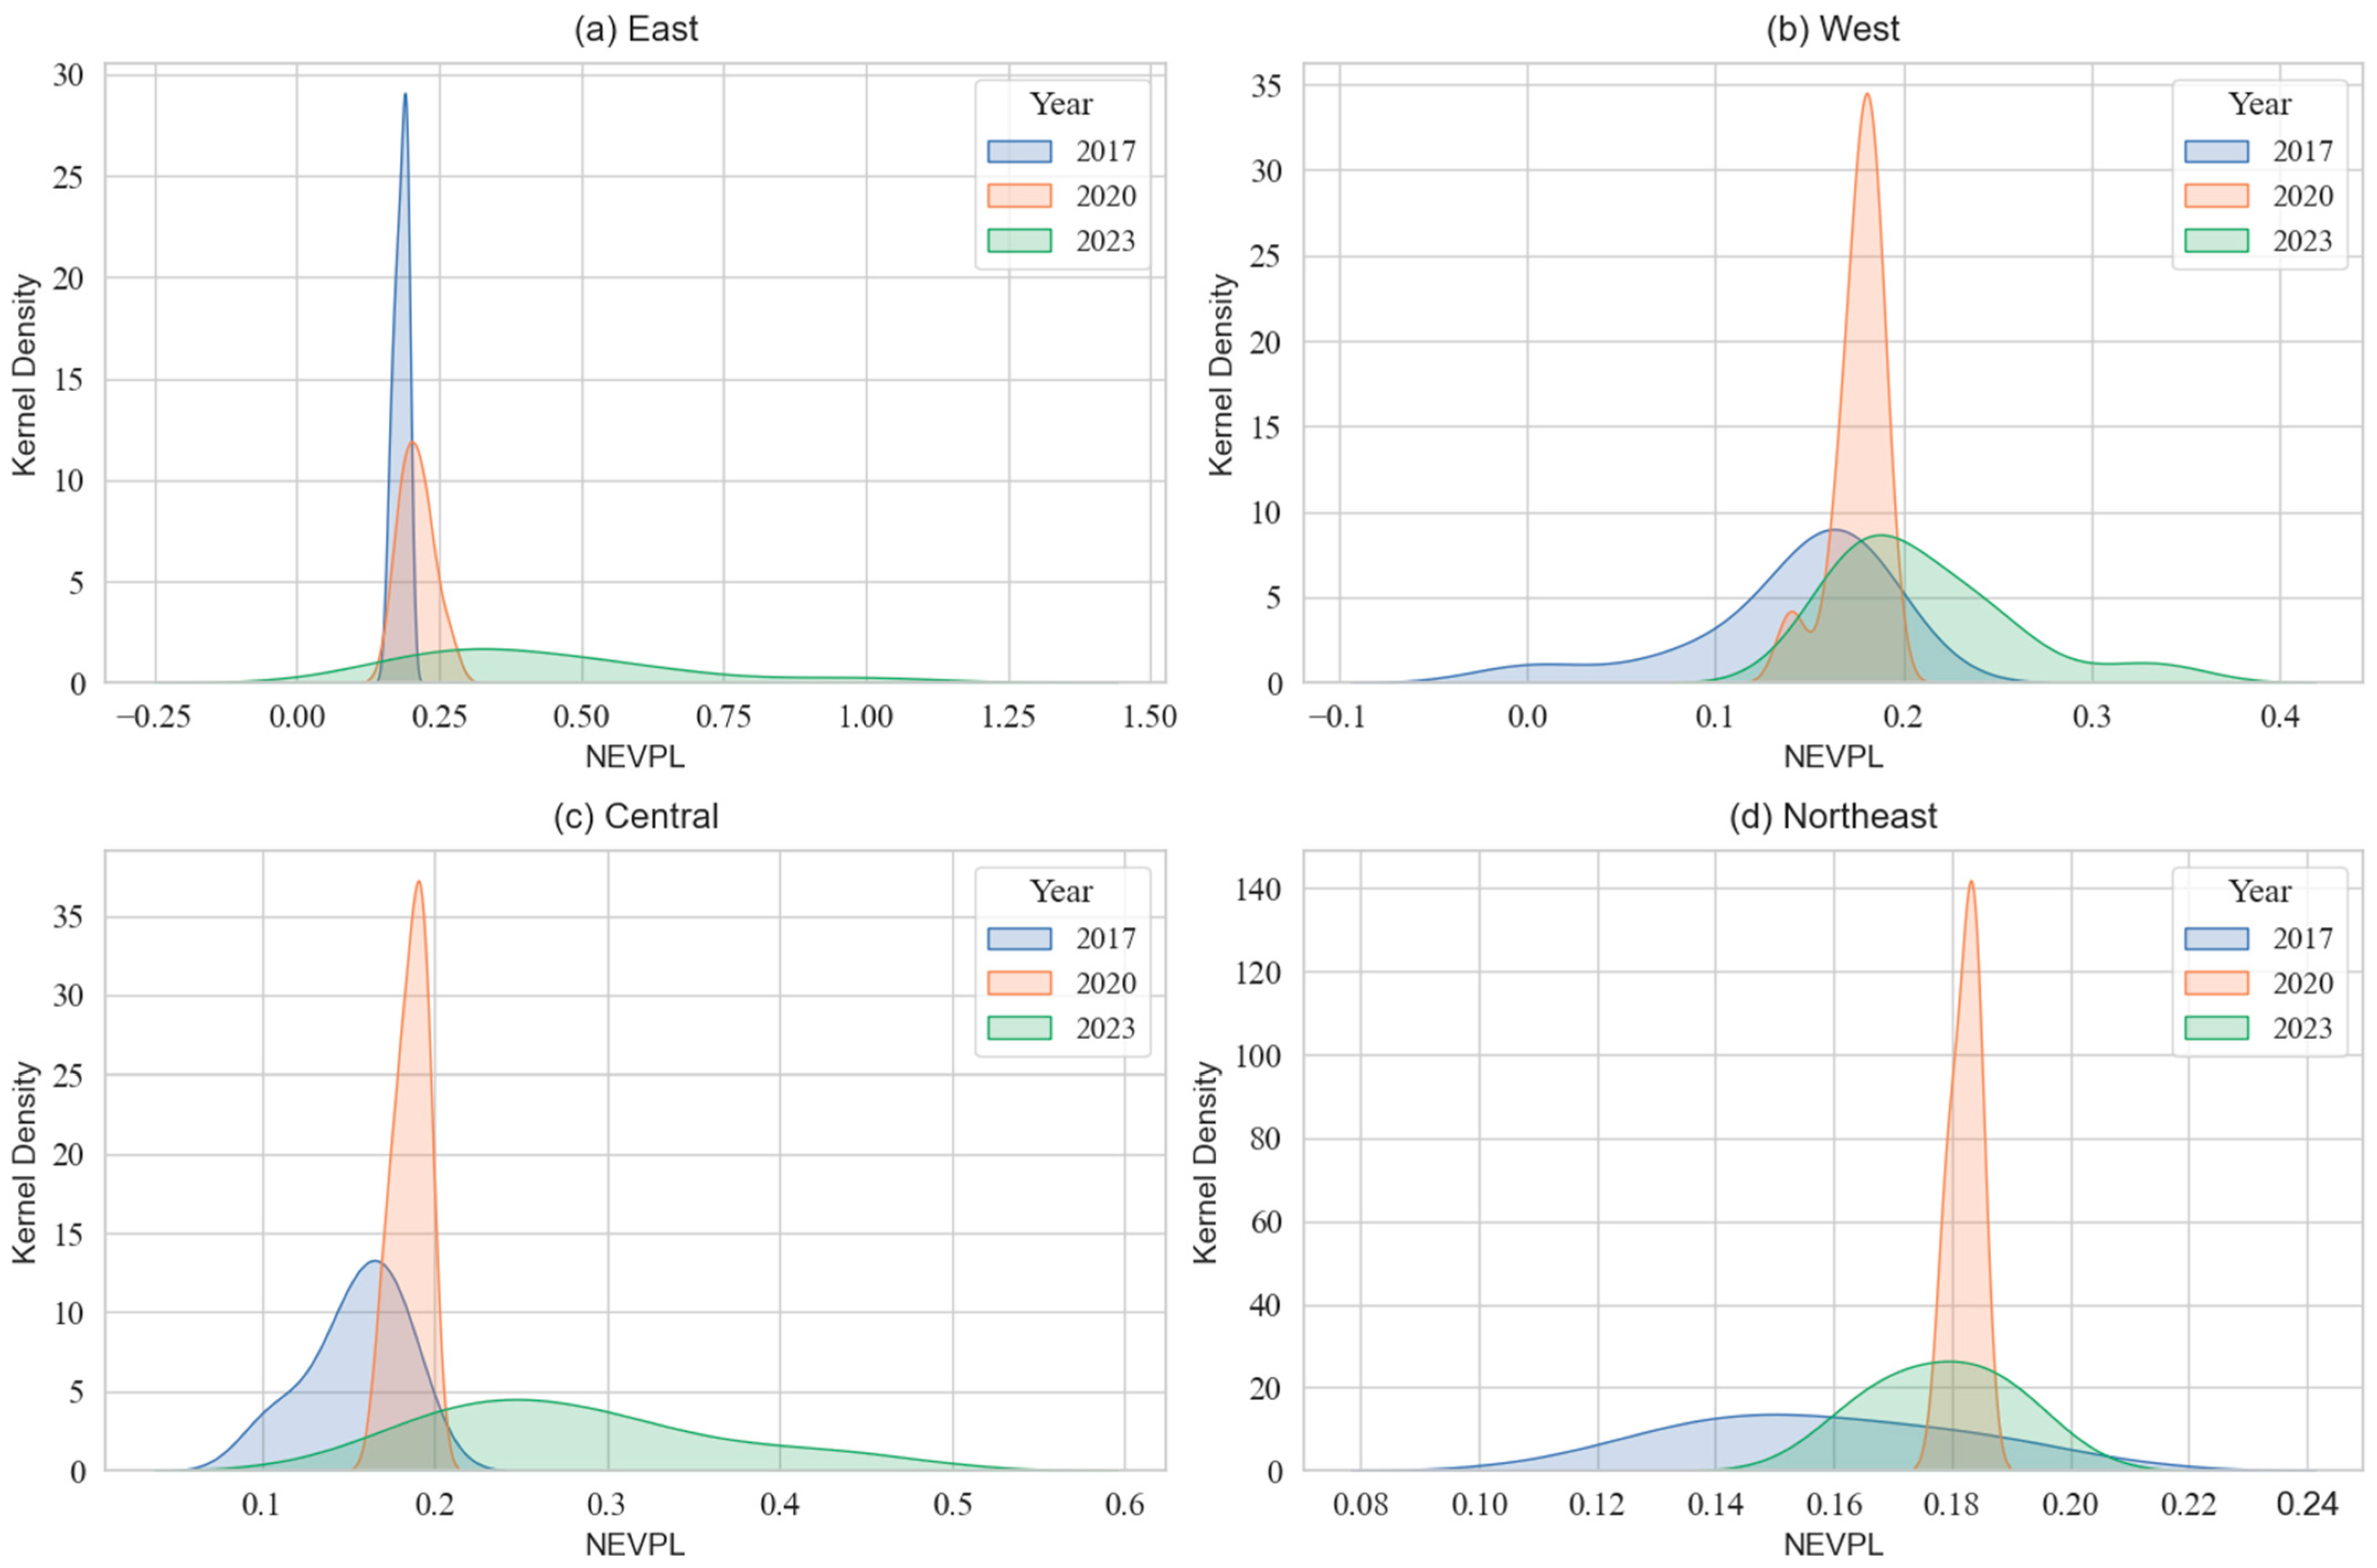
Figure 7 illustrates the dynamic distribution of the NEVPL across the four major regions. The results show a general transition from relatively concentrated distributions to more dispersed patterns over time, reflecting evolving disparities both within and between regions as NEV promotion deepens. The specific regional observations are as follows:
(1)
As shown in Figure 7a, the distribution of the NEVPL in the eastern region was relatively concentrated in 2017, with a sharp peak, indicating that provinces within the region were relatively homogeneous in the NEVPL. By 2020, the distribution range widened, the main peak shifted slightly to the right, and its height decreased, suggesting the emergence of internal disparities. In 2023, the distribution continued to shift rightward, the tail extended significantly, and the peak further declined, indicating a general increase in the NEVPL accompanied by growing internal inequality.
(2)
Figure 7b shows that the western region exhibited a more dispersed distribution in 2017, with notable inter-provincial differences. By 2020, the distribution became more concentrated, the main peak moved rightward, and the peak value rose significantly, suggesting that the NEVPL had improved across the region and became more consistent. However, in 2023, the distribution returned to a more dispersed form similar to 2017, but with a more pronounced right skew, indicating a renewed expansion in disparities, driven by accelerated NEV promotion in certain provinces.
(3)
The central region displayed a pattern similar to the western region, as illustrated in Figure 7c. In 2017, the distribution range was broad, reflecting large differences in the NEVPL among provinces. In 2020, the concentration increased noticeably, with the main peak shifting rightward and rising in height, signifying marked progress in NEV promotion. In 2023, the distribution continued to shift right and became more spread out, with the peak declining substantially, indicating that despite overall improvement, internal disparities re-emerged.
(4)
As shown in Figure 7d, the northeastern region exhibited more distinct stage-based characteristics. In 2017, the distribution was broad with a low peak, indicating substantial internal disparity. By 2020, the main peak shifted clearly to the right, the distribution became more concentrated, and the peak value increased, reflecting both improvement and convergence in the NEVPL. However, in 2023, the main peak slightly shifted leftward and declined in height, and the distribution once again became more dispersed, suggesting a resurgence of internal disparities and a divergence in the pace of NEV promotion.
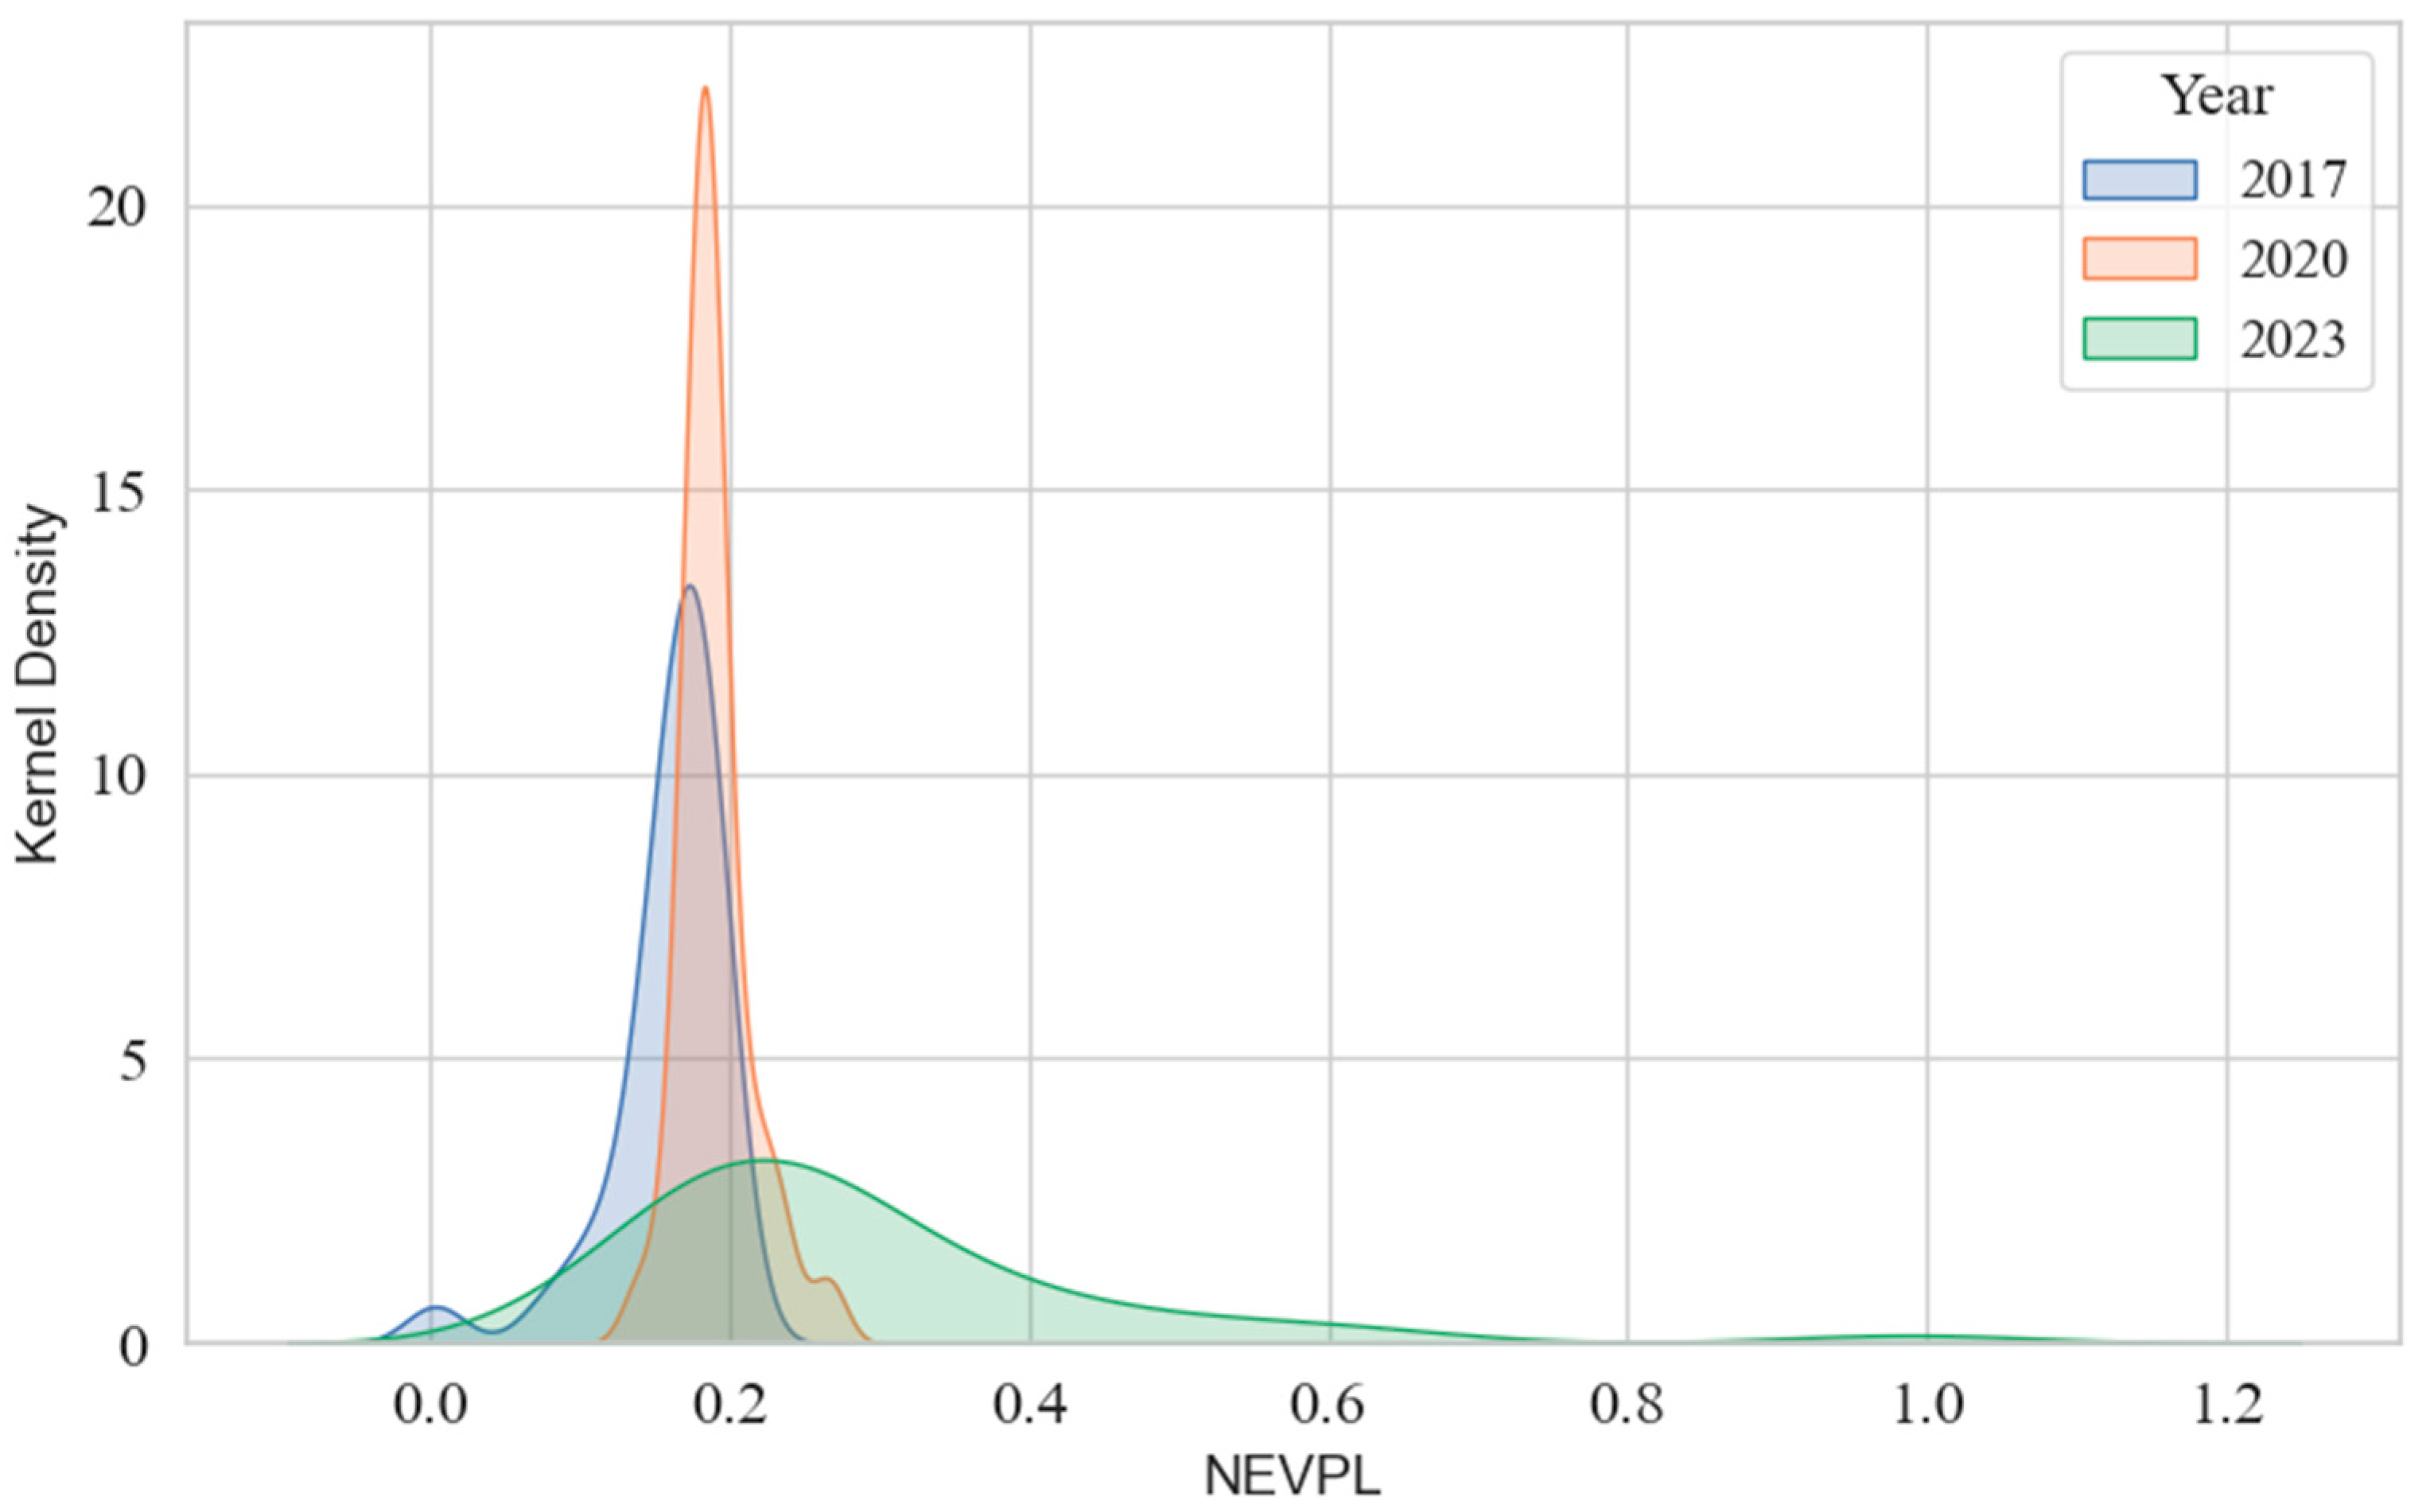
As shown in Figure 8, the kernel density distribution of the national NEVPL underwent a clear transition from a bimodal to a unimodal pattern. Throughout the period from 2017 to 2023, the primary peak of the density curve continuously shifted to the right, while the overall shape evolved from concentrated to dispersed. This indicates that although the overall level of the NEVPL in China has improved, regional disparities have been exacerbated. In 2017, the distribution curve appeared tall and narrow with two distinct peaks, reflecting a pronounced bimodal structure. The secondary peak on the left corresponded to provinces with a relatively low NEVPL, while the primary peak on the right represented provinces with higher levels of promotion. This suggests a clear divergence in the NEVPL among provinces at that time. By 2020, the distribution curve had become even narrower and taller, with the main peak shifting toward the left and a smaller secondary peak forming on the right. This implies that although the NEVPL had improved nationwide, most provinces remained clustered in the low-to-mid level range. A small number of provinces experienced significant improvement, forming a “tail-lifting” effect that slightly alleviated the overall disparity. In 2023, the shape of the kernel density curve changed substantially. It became flatter and wider, with a noticeable drop in peak height and a substantial broadening of the distribution range. The right tail extended further, forming a distinct right-skewed long-tailed distribution. This pattern reflects a further intensification of spatial disparities in the NEVPL across the country. While a few provinces achieved significant advancements—forming high-value “islands”—the majority of regions remained at relatively low levels of promotion.

6. Conclusions and Policy Recommendations

6.1. Conclusions

This study presents a multidimensional index system combined with the Entropy-TOPSIS model and spatial analysis techniques, such as gravity center analysis, the SDE model, and Dagum Gini coefficient decomposition, to assess and analyze the new energy vehicle promotion levels (NEVPL) across China’s provinces. While previous studies have often relied on single indicators or focused on case studies of individual provinces, this approach seeks to offer a more comprehensive and dynamic framework that captures both the temporal and spatial dynamics of NEV promotion. Additionally, by integrating spatiotemporal methods, this study aims to go beyond static evaluations, exploring how NEV promotion patterns evolve over time and across regions. Notably, in contrast to existing research that primarily emphasizes policy formulation, this study provides further insights into how regional policies, infrastructure, and economic conditions contribute to the disparities in NEV adoption rates across China’s provinces, with the hope of offering useful guidance for policymakers who aim to promote the more balanced and sustainable development of NEVs. The key conclusions of this study are as follows:
(1)
The NEVPL has continuously improved, though the overall level remains relatively low. From 2017 to 2023, China’s national average NEVPL rose from 0.158 to 0.293, with an average annual growth rate of 10.84%, indicating significant national progress in NEV adoption. The eastern region consistently led in the NEVPL, while the central and western regions exhibited steady growth. In contrast, the northeastern region lagged behind, reflecting pronounced regional disparities.
(2)
The spatial pattern is characterized by a coexistence of agglomeration and differentiation. Analysis using the SDE and gravity center migration shows that the promotional center has gradually shifted southeastward, with spatial distribution evolving from early dispersion to notable agglomeration. High-density promotion zones emerged along the eastern side of the “Hu Huanyong Line,” particularly in the Yangtze River Delta, Pearl River Delta, and Beijing-Tianjin-Hebei regions.
(3)
Regional disparities are expanding, with especially pronounced intra-regional differences in the east. Gini coefficient analysis reveals an overall trend of “initial moderation followed by expansion” in regional inequality, with the national Gini coefficient reaching 0.260 in 2023. Inter-regional disparities were identified as the primary source of spatial inequality, accounting for over 70% of the total variance. Although the eastern region maintained a high average NEVPL, it also exhibited the most substantial internal divergence.
(4)
A “high-value island” effect has emerged in the dynamic evolution process. Kernel density estimation indicates a shift from a bimodal to a right-skewed unimodal distribution, reflecting widening gaps between high- and low-performing provinces. A few leading provinces have formed high-value promotion “islands,” underscoring intensifying regional imbalances and polarization.

6.2. Policy Recommendations

In response to the observed spatiotemporal disparities and imbalances in NEV promotion, the following policy recommendations are proposed:
(1)
Strengthen regional coordination and implement differentiated policy guidance. While maintaining the eastern region’s leading edge, greater policy attention should be directed toward the central, western, and northeastern regions. Tailored fiscal incentives, technological support, and infrastructure investment should be adopted to address local shortcomings, narrow development gaps, and establish a multi-tiered, collaborative promotion mechanism.
(2)
Improve infrastructure systems and optimize vehicle-to-charger coordination. Local governments should plan charging infrastructure based on regional NEV promotion needs, increase the public charging density, and improve operational efficiency. Dynamic monitoring of the vehicle-to-charger ratio and the development of intelligent management platforms are essential to ensure charging convenience and mitigate structural mismatches between vehicles and charging infrastructure.
(3)
Promote technological innovation and enhance the industrial chain. Greater emphasis should be placed on breakthroughs in core NEV technologies, including traction batteries, drive systems, and lightweight vehicle design. Encouraging integration among industry, academia, and research, as well as supporting technological upgrades among local manufacturers, will foster regional industrial clusters and strengthen the sustainability and competitiveness of NEV promotion.
(4)
Establish dynamic monitoring and feedback mechanisms. A nationwide NEVPL monitoring system should be established to regularly evaluate and disclose regional promotion data. This would enhance transparency and policy responsiveness. Policy instruments should be adjusted in a timely manner based on observed spatiotemporal patterns, transitioning from static subsidies to performance-based incentives to improve precision and sustainability.
(5)
Promote green mobility culture and increase public acceptance. The public awareness and acceptance of NEVs should be enhanced through education campaigns, test-driving programs, and purchase incentives. Governments and institutions should take the lead in adopting NEVs, thereby serving as models for broader public engagement and fostering a favorable ecosystem for green travel.
While the recommendations presented in this study are aimed at promoting more balanced and sustainable NEV development, it is important to consider how these recommendations may influence the market. Historical data and past experiences suggest that well-designed policies, such as fiscal incentives, infrastructure development, and technological support, have had significant impacts on market dynamics. For instance, in regions where subsidies and tax incentives have been introduced, NEV adoption has accelerated, as evidenced by increased sales figures and consumer interest. Similarly, improvements in charging infrastructure and public awareness campaigns have contributed to the widespread adoption of NEVs. These examples indicate that when policy measures align with market needs and consumer behavior, the market tends to follow the direction set by the policies. However, the actual influence of these recommendations on market behavior should be continuously monitored and assessed to ensure that they generate the desired results.
Despite the valuable insights provided by this study, several limitations should be noted due to data availability. First, the data used is limited to the period from 2017 to 2023, which may not fully capture long-term trends or earlier policy impacts. Second, the study is based on provincial-level data and lacks an analysis at more granular scales such as city or county levels. Third, the study does not include an in-depth discussion of how factors such as price elasticity, consumer behavior, or specific market strategies influence the adoption of NEVs.

Author Contributions

Conceptualization, Y.W. and F.Z.; methodology, F.Z.; software, F.Z.; validation, Y.W.; formal analysis, Y.W.; investigation, Y.W.; resources, Y.W.; data curation, Y.W. and F.Z.; writing—original draft preparation, Y.W. and F.Z.; writing—review and editing, Y.W. and F.Z.; visualization, F.Z.; supervision, M.H.; project administration, M.H.; funding acquisition, M.H. All authors have read and agreed to the published version of the manuscript.

Funding

This research was funded by the Key Project of the National Social Science Foundation of China, grant number 20AJY016, the Project of Jinhua Federation of Social Sciences, grant number YB2024050, and the Project of Yiwu Federation of Social Sciences, grant number YWSK24083.

Data Availability Statement

The data presented in this study are available on request from the corresponding author.

Conflicts of Interest

The authors declare no conflicts of interest.

References

  1. UNEP. Emissions Gap Report 2024; United Nations Environment Programme: Nairobi, Kenya, 2024; Available online: https://www.unep.org/zh-hans/resources/2024nianpaifangchajubaogao (accessed on 24 October 2024).
  2. Wang, S.; Wang, J.; Cheng, J. Does the promotion and application of new energy vehicles contribute to the reduction of carbon intensity? A quasi-natural experiment analysis. Sustain. Futures 2025, 9, 100455. [Google Scholar] [CrossRef]
  3. Wang, K.; Zheng, L.J.; Zhang, J.Z.; Yao, H. The impact of promoting new energy vehicles on carbon intensity: Causal evidence from China. Energy Econ. 2022, 114, 106255. [Google Scholar] [CrossRef]
  4. Gu, X.; Wang, M.; Wu, J. An empirical study on the green effects of new energy vehicle promotion in the context of global carbon neutrality. Chin. J. Popul. Resour. Environ. 2022, 20, 332–340. [Google Scholar] [CrossRef]
  5. Zahoor, A.; Yu, Y.; Zhang, H.; Nihed, B.; Afrane, S.; Peng, S.; Mao, G. Can the new energy vehicles (NEVs) and power battery industry help China to meet the carbon neutrality goal before 2060? J. Environ. Manag. 2023, 336, 117663. [Google Scholar] [CrossRef]
  6. Dong, Y.; Zeng, F.; Sun, H. Research on the Evaluation of Urban Green Transportation Development Level in Guangzhou Under the Promotion of New Energy Vehicles. World Electr. Veh. J. 2025, 16, 253. [Google Scholar] [CrossRef]
  7. Pan, R.; Liang, Y.; Li, Y.; Zhou, K.; Miao, J. Environmental and Health Benefits of Promoting New Energy Vehicles: A Case Study Based on Chongqing City. Sustainability 2023, 15, 9257. [Google Scholar] [CrossRef]
  8. Zhu, Y.; Liu, Y.; Liu, X.; Wang, H. Carbon mitigation and health effects of fleet electrification in China’s Yangtze River Delta. Environ. Int. 2023, 180, 108203. [Google Scholar] [CrossRef]
  9. Xue, Y.; Zhu, C.; Lu, Y. Research on the Influence Mechanism of New Energy Vehicle Promotion Policy. Sustainability 2025, 17, 3699. [Google Scholar] [CrossRef]
  10. Yang, X.; Lin, W.; Gong, R.; Zhu, M.; Springer, C. Transport decarbonization in big cities: An integrated environmental co-benefit analysis of vehicles purchases quota-limit and new energy vehicles promotion policy in Beijing. Sustain. Cities Soc. 2021, 71, 102976. [Google Scholar] [CrossRef]
  11. Liu, B.; Song, C.; Wang, Q.; Zhang, X.; Chen, J. Research on regional differences of China’s new energy vehicles promotion policies: A perspective of sales volume forecasting. Energy 2022, 248, 123541. [Google Scholar] [CrossRef]
  12. Wang, Z.; Li, X.; Xue, X.; Liu, Y. More government subsidies, more green innovation? The evidence from Chinese new energy vehicle enterprises. Renew. Energy 2022, 197, 11–21. [Google Scholar] [CrossRef]
  13. Qian, B. Financial subsidies, tax incentives, and new energy vehicle enterprises’ innovation efficiency: Evidence from Chinese listed enterprises. PLoS ONE 2023, 18, e0293117. [Google Scholar] [CrossRef] [PubMed]
  14. Li, J.; Ku, Y.; Liu, C.; Zhou, Y. Dual credit policy: Promoting new energy vehicles with battery recycling in a competitive environment? J. Clean. Prod. 2020, 243, 118456. [Google Scholar] [CrossRef]
  15. Zhou, J.; Fang, W.; Han, X.; Sun, Q.; Liu, D.; Liu, S. Rebound effect of carbon emissions of new energy vehicle consumption: A case study of Beijing. Int. J. Environ. Sci. Technol. 2023, 20, 7603–7620. [Google Scholar] [CrossRef]
  16. Tang, X.; Feng, J.; Feng, B.; Mao, X.; Wei, X.Z. Policy analysis on the promotion of new energy vehicles in China considering consumers’ car purchasing choices in the “post-subsidy era”: Based on the study of a three-party evolutionary game. Environ. Dev. Sustain. 2024, 1–32. [Google Scholar] [CrossRef]
  17. Yuan, K.; Wu, G. Can the battery leasing mode promote new energy vehicle adoption and reduce carbon emission in a competitive environment? Energy Rep. 2025, 13, 5915–5930. [Google Scholar] [CrossRef]
  18. Liu, B.; Wang, Y.; Wang, S. Matching analysis of new energy vehicle charging demand and charging infrastructure power supply capacity: A case study of China’s capital Beijing. Energy Environ. 2024. [Google Scholar] [CrossRef]
  19. Li, C.; Lu, X.; Liu, Y.; Xia, Z.; Wang, X.; Zhao, H. A Study of Tripartite Strategies for Closed-Loop Charging Infrastructure Construction of New Energy Vehicles in China under the Expectation of Government Withdrawal Subsidies. J. Clean. Prod. 2025, 493, 144943. [Google Scholar] [CrossRef]
  20. Sun, B.; Ju, Z. Research on the promotion of new energy vehicles based on multi-source heterogeneous data: Consumer and manufacturer perspectives. Environ. Sci. Pollut. Res. 2023, 30, 28863–28873. [Google Scholar] [CrossRef]
  21. Wang, C.; Sinha, P.N.; Zhang, X.; Wang, S.; Lee, Y.K. The impact of NEV users’ perceived benefits on purchase intention. Travel Behav. Soc. 2024, 34, 100681. [Google Scholar] [CrossRef]
  22. Xiong, Y.; Wang, L. Policy cognition of potential consumers of new energy vehicles and its sensitivity to purchase willingness. J. Clean. Prod. 2020, 261, 121032. [Google Scholar] [CrossRef]
  23. Jiang, Y.; Wu, Q.; Li, M.; Gu, Y.; Yang, J. What is affecting the popularity of new energy vehicles? A systematic review based on the public perspective. Sustainability 2023, 15, 13471. [Google Scholar] [CrossRef]
  24. Dong, Y.; Wang, D.; Zeng, F.; Zhang, Y. A novel MADM model integrating hybrid information for evaluating the development prospects of urban new energy vehicles. PLoS ONE 2025, 20, e0314026. [Google Scholar] [CrossRef]
  25. Cui, Y.; Khan, S.U.; Deng, Y.; Zhao, M. Regional difference decomposition and its spatiotemporal dynamic evolution of Chinese agricultural carbon emission: Considering carbon sink effect. Environ. Sci. Pollut. Res. 2021, 28, 38909–38928. [Google Scholar] [CrossRef]
  26. Wu, M.; Zhao, M.; Wu, Z. Evaluation of development level and economic contribution ratio of science and technology innovation in eastern China. Technol. Soc. 2019, 59, 101194. [Google Scholar] [CrossRef]
  27. Qin, M.; Huang, Z. A study on the differences in the synergistic development level of digitalization and greenization in the eastern and central regions of China. Sustainability 2023, 15, 16688. [Google Scholar] [CrossRef]
  28. Deng, X.; Liang, L.; Wu, F.; Wang, Z.; He, S. A review of the balance of regional development in China from the perspective of development geography. J. Geogr. Sci. 2022, 32, 3–22. [Google Scholar] [CrossRef]
  29. Luo, Y.; Fang, S.; Wu, H.; Zhou, X.; He, Z.; Gao, L. Spatial and temporal evolution of habitat quality and its shrinkage effect in shrinking cities: Evidence from Northeast China. Ecol. Indic. 2024, 161, 111919. [Google Scholar] [CrossRef]
  30. Tao, M. Dynamics between electric vehicle uptake and green development: Understanding the role of local government competition. Transp. Policy 2024, 146, 227–240. [Google Scholar] [CrossRef]
  31. Shang, W.L.; Zhang, J.; Wang, K.; Yang, H.; Ochieng, W. Can financial subsidy increase electric vehicle (EV) penetration—Evidence from a quasi-natural experiment. Renew. Sustain. Energy Rev. 2024, 190, 114021. [Google Scholar] [CrossRef]
  32. Zhang, H.; Liu, Y.; Tan, X.; Qi, Y.; Yang, L.; Jia, M. Research on the impact of leap-forward development of new energy vehicles on urban traffic congestion. Chin. J. Manag. Sci. 2024, 1–19. [Google Scholar] [CrossRef]
  33. Liu, Q.; Le, W.; Guo, B. Research on the Efficiency of New Energy Vehicle Charging Facilities Based on Complex Network. Manage. Rev. 2021, 33, 284–293. [Google Scholar]
  34. Ju, Q.; Ju, P.; Dai, W.; Ran, L. Adoption of new energy vehicles under subsidy policies: Unit subsidies, sales incentives and product differentiation. J. Manag. Sci. China 2021, 24, 101–116. [Google Scholar]
  35. Tang, B.; Wang, X.; Wang, B.; Wu, Y.; Zou, Y.; Xu, H.; Ma, Y. Analysis and Prospect of China’s New Energy Vehicles Industry Development Level. J. Beijing Inst. Technol. (Soc. Sci. Ed.) 2019, 21, 6–11. [Google Scholar]
  36. Satı, Z.E. Comparison of the criteria affecting the digital innovation performance of the European Union (EU) member and candidate countries with the entropy weight-TOPSIS method and investigation of its importance for SMEs. Technol. Forecast. Soc. Change 2024, 200, 123094. [Google Scholar] [CrossRef]
  37. Jing, X.; Tao, S.; Hu, H.; Sun, M.; Wang, M. Spatio-temporal evaluation of ecological security of cultivated land in China based on DPSIR-entropy weight TOPSIS model and analysis of obstacle factors. Ecol. Indic. 2024, 166, 112579. [Google Scholar] [CrossRef]
  38. Yang, H.; Liu, N.; Li, M.; Gu, M.; Gao, Q. Design and optimization of heat pipe-assisted liquid cooling structure for power battery thermal management based on NSGA-II and entropy Weight-TOPSIS method. Appl. Therm. Eng. 2025, 272, 126416. [Google Scholar] [CrossRef]
  39. Han, Q.; Chen, L.; Tang, X.; Weng, T.; Yang, G.; Zhang, B.; Zhang, Y. Research on TOPSIS multi-indicator evaluation model based on entropy weight method for C2N site selection. Ann. Nucl. Energy 2025, 221, 111566. [Google Scholar] [CrossRef]
  40. Zournatzidou, G.; Sklavos, G.; Ragazou, K.; Sariannidis, N. Anti-competition and anti-corruption controversies in the European financial sector: Examining the anti-ESG factors with entropy weight and TOPSIS methods. J. Risk Financ. Manag. 2024, 17, 492. [Google Scholar] [CrossRef]
  41. Ni, Y.; Chen, Y. Spatial–temporal distribution measurement of input–output efficiency of the water–energy–food nexus of the Yangtze River Economic Belt, China. Front. Ecol. Evol. 2022, 10, 944397. [Google Scholar] [CrossRef]
  42. Wen, G.; Zhang, Z.; Tian, Y.; Fang, L.; Wang, Z.; Ding, X.; Huang, Y. Temporal and spatial characteristics of cultivated land non-point source pollution in the main grain producing areas of the middle and lower Yangtze region. J. Agro-Environ. Sci. 2024, 43, 133–142. [Google Scholar]
  43. He, M.; Xiao, W.; Li, Y.; Chen, X.; Huang, J. Spatio-Temporal Differentiation, Driving Force and Response Characteristics of China’s Forest Carbon Sink Efficiency from the Perspective of New Urbanization. Ecol. Econ. 2025, 41, 127–135. [Google Scholar]
  44. Dagum, C. Decomposition and interpretation of Gini and the generalized entropy inequality measures. Statistica 1997, 57, 295–308. [Google Scholar]
  45. Ma, T.; Liu, Y.; Yang, M. Spatial-temporal heterogeneity for commercial building carbon emissions in China: Based on the Dagum Gini coefficient. Sustainability 2022, 14, 5243. [Google Scholar] [CrossRef]
  46. Huang, M.; Wang, H. Dynamic Evolution and Spatiotemporal Convergence on the Construction of Unified Market of China’s Urban Agglomerations. J. Xi’an Jiaotong Univ. (Soc. Sci.) 2024, 44, 77–91. [Google Scholar]
Figure 1. The method framework for this study.
Wevj 16 00456 g001
Figure 2. Study area.
Wevj 16 00456 g002
Figure 3. Evolution trend of NEVPL in China from 2017 to 2023.
Wevj 16 00456 g003
Figure 4. Distribution of NEVPL across provinces in China in 2017 and 2023.
Wevj 16 00456 g004
Figure 5. SDE distribution of NEVPL in China for 2017 and 2023.
Wevj 16 00456 g005
Figure 6. Trajectory of NEVPL gravity center across Chinese provinces from 2017 to 2023.
Wevj 16 00456 g006
Figure 7. Dynamic distribution patterns of NEVPL in China’s four major regions (2017–2023).
Wevj 16 00456 g007
Figure 8. National dynamic distribution patterns of NEVPL (2017–2023).
Wevj 16 00456 g008
Table 1. Shape parameters of the SDE of NEVPL in China (2017 and 2023).
YearRotation Angle (°)Minor Axis (km)Major Axis (km)Axis Ratio
201755.701023.561175.811.15
202340.67998.531076.261.08
Table 2. Gini coefficients of NEVPL in China and four major regions (2017–2023).
YearOverallIntra-RegionalInter-Regional
East (E)Central (C)West (W)Northeast (NE)E-CE-WE-NEC-WC-NEW-NE
20170.1140.0340.0670.0890.1740.0820.0900.1370.0830.1300.135
20180.0850.0500.0530.0630.0980.0680.0840.1070.0660.0840.084
20190.0820.0570.0220.0350.1060.0610.0670.1150.0300.0740.078
20200.0610.0730.0240.0060.0350.0730.0770.0940.0220.0380.025
20210.1130.1440.0560.0310.0190.1410.1720.1770.0630.0640.027
20220.1980.2360.0910.0630.0200.2290.2840.3200.1120.1410.057
20230.2600.2730.1400.1110.0300.2750.3580.4180.1770.2240.099
Table 3. Decomposition of Dagum Gini coefficient for NEVPL in China (2017–2023).
YearOverallContributionContribution Rate (%)
G w G n b G t G w G n b G t
2017 0.1140.0310.0600.02327.1452.6520.22
20180.0850.0220.0460.01725.9353.5720.49
20190.0820.0220.0510.00827.4562.4710.07
20200.0610.0140.0400.00623.5266.669.82
20210.1130.0240.0810.00721.6972.056.27
20220.1980.0450.1420.01122.6171.815.58
20230.2600.0590.1830.01822.7170.396.90
Disclaimer/Publisher’s Note: The statements, opinions and data contained in all publications are solely those of the individual author(s) and contributor(s) and not of MDPI and/or the editor(s). MDPI and/or the editor(s) disclaim responsibility for any injury to people or property resulting from any ideas, methods, instructions or products referred to in the content.