Article

Vibration Control and Energy-Regenerative Performance Analysis of an Energy-Regenerative Magnetorheological Semi-Active Suspension

School of Transportation and Vehicle Engineering, Shandong University of Technology, Zibo 255000, China
*
Author to whom correspondence should be addressed.
World Electr. Veh. J. 2025, 16(8), 455; https://doi.org/10.3390/wevj16080455
Submission received: 16 June 2025 / Revised: 22 July 2025 / Accepted: 8 August 2025 / Published: 10 August 2025
(This article belongs to the Special Issue Vehicle System Dynamics and Intelligent Control for Electric Vehicles)

Abstract

To improve both ride comfort and energy efficiency, this study proposes a semi-active suspension system equipped with an electromagnetic linear energy-regenerative magnetorheological damper (ELEMRD). The ELEMRD integrates a magnetorheological damper (MRD) with a linear generator. A neural network-based surrogate model was employed to optimize the key parameters of the linear generator for better compatibility with semi-active suspensions. A prototype was fabricated and tested. Experimental results show that with an excitation current of 1.5 A, the prototype generates a peak output force of 1415 N. Under harmonic excitation at 5 Hz, the no-load regenerative power reaches 11.1 W and 37.3 W at vibration amplitudes of 5 mm and 10 mm, respectively. An energy-regenerative magnetorheological semi-active suspension model was developed and controlled using a Linear Quadratic Regulator (LQR). Results indicate that, on a Class C road at 20 m/s, the proposed system reduces sprung mass acceleration and suspension working space by 14.2% and 7.5% compared to a passive suspension. The root mean square and peak regenerative power reach 49.8 W and 404.2 W, respectively. The proposed semi-active suspension also exhibits enhanced low-frequency vibration isolation, demonstrating its effectiveness in improving ride quality while achieving energy recovery.

1. Introduction

With increasing awareness of energy efficiency and environmental protection, the automotive industry is undergoing a shift toward electrification and energy conservation [1]. This shift has promoted the development of electric drive systems and stimulated ongoing innovation in various energy-saving technologies [2,3]. Notable advances have been achieved in regenerative braking, while vibration energy recovery from suspension systems has also emerged as an active area of research [4,5,6]. The suspension system, a fundamental component of the vehicle chassis, plays a key role in buffering and attenuating body vibrations induced by road irregularities. These vibrations affect not only ride comfort but can also compromise driving safety under severe conditions. Conventional suspension systems rely on hydraulic dampers to convert vibration energy into heat, which is subsequently dissipated into the environment [7]. This process results in energy loss and may cause a decline in damping force due to fluid temperature rise. As a result, the study of vibration suppression and energy recovery in suspension systems holds considerable research value.
Vehicle suspension systems are generally categorized as passive, semi-active, or active. Their cost and performance increase progressively across these types, with semi-active suspensions offering a favorable balance between the two factors [8]. Among semi-active systems, MRDs have gained considerable attention owing to their distinctive advantages [9,10,11]. These dampers exploit the characteristics of magnetorheological fluids to adjust the damping force by modulating the magnetic field strength, enabling dynamic control of suspension performance. They respond rapidly to changes in road conditions and provide optimal damping across diverse operating scenarios. Integrating MRDs with energy recovery devices presents an effective approach for both vibration suppression and energy regeneration in suspension systems. This concept can be traced back to early research on utilizing vibrational energy to power electrorheological dampers [12]. Compared to electrorheological dampers, MRDs simply replace electric field control with magnetic field control.
To enhance the integration of MRDs with energy recovery devices, extensive research has been conducted, resulting in various MRD designs featuring energy regeneration capabilities. Among these, electromagnetic energy-regenerative MRDs are the most widely adopted. This type of damper operates on the principle of electromagnetic induction, converting suspension motion into movement that intersects magnetic field lines, thereby transforming vibration energy into electrical energy [13]. Based on the motion characteristics of the electromagnetic energy recovery device, these MRDs can be classified into rotary and linear generator types [14]. The rotary type typically employs a permanent magnet rotary generator as the energy recovery device. However, since suspension motion is linear, this damper requires an additional mechanism to convert motion. Guan et al. realized energy regeneration by combining a ball screw mechanism with a rotary permanent magnet DC generator, using the generated electrical energy to power the MRD [15]. This self-powered feature improved the independence and reliability of MRD operation. Dong also utilized a ball screw and rotary generator for energy recovery but arranged the MRD and generator in a parallel configuration [16]. Compared to the series configuration, the parallel configuration is structurally simpler and easier to maintain, but it results in a larger overall volume. Li et al. designed a self-powered MRD based on a double-link motion conversion mechanism [17]. This mechanism achieves relatively high power generation efficiency, though it occupies more space. The motion conversion mechanism increases the overall volume and weight of the system, which is unfavorable for lightweight and compact suspension design in passenger vehicles. It is also prone to wear, looseness, and mechanical failure, thereby increasing maintenance difficulty and cost while reducing system stability and reliability. In addition, mechanical conversion introduces friction, backlash, and impact losses, and the associated large rotational inertia can lead to delayed system response.
The linear motor type typically employs high power density tubular permanent magnet linear motors, which can also be applied to vehicle braking and gear shifting [18,19]. Although the output power of a linear generator is at least 21% lower than that of a rotary generator of the same size, the linear generator can directly utilize the suspension’s linear motion to achieve energy regeneration [20]. Hu et al. integrated a linear generator into the piston head of the MRD, enabling the recovery of vibration energy during the piston head’s linear motion [21]. This design not only realizes both damping and energy regeneration functions, but also enables self-sensing by determining the relative position between the piston and the outer cylinder based on the regeneration voltage. An alternative integration approach involves placing a multi-pole linear generator on the outer surface of the MRD’s outer cylinder [22,23]. Although coaxial and radial layouts offer high integration levels, they require dedicated magnetic field isolation components, which increase design complexity. Moreover, optimizing such configurations often demands establishing global optimization objectives, resulting in increased optimization difficulty.
Building on preliminary progress in the structural design of energy regeneration, researchers have increasingly focused on dynamic modeling and performance analysis of energy-regenerative magnetorheological suspension systems to promote their engineering applications. Jian et al. developed a novel semi-active magnetorheological suspension system integrating a parallel magnetorheological damper with a tubular linear permanent magnet synchronous motor (TLPMSM) [24]. The study found that incorporating the TLPMSM slightly increased the amplitudes of both the sprung and unsprung masses but did not change the overall motion trend. This suggests that integrating energy regeneration devices into semi-active magnetorheological suspension systems is feasible. Zhang et al. developed an electromechanically coupled dynamic model of an energy-regenerative semi-active magnetorheological suspension system and conducted a time-domain analysis [25]. The results showed that, under self-powered mode, the velocity amplitude with semi-active control was significantly lower than that with passive control, demonstrating the effectiveness of the self-powered semi-active MR suspension. A trade-off exists between suspension vibration isolation performance and vibration energy harvesting capability. Gao et al. applied an adaptive optimal fault-tolerant control algorithm that improved both vibration isolation and energy harvesting performance, thus partially mitigating the conflict between the two [26]. In addition to achieving adjustable damping force under self-powered mode, Zhu et al. also realized variable stiffness in this mode [27,28]. This advancement significantly enhanced vibration isolation performance while reducing system complexity. These studies collectively demonstrate that integrating energy regeneration devices into semi-active magnetorheological suspension systems is both feasible and effective.
Based on the above discussion, developing a semi-active magnetorheological suspension system that integrates vibration suppression and energy regeneration holds significant research value. This system combines semi-active magnetorheological control with an energy recovery mechanism, improving vehicle dynamic performance and energy utilization efficiency. It also shows promising application potential. Therefore, a compact and structurally simple ELEMRD is designed in this study. Axially integrating the single-phase permanent magnet linear generator based on a Halbach array with the MRD eliminates the need for motion conversion mechanisms, thereby reducing structural complexity. This approach enables compact packaging while facilitating subsequent maintenance. Moreover, the coaxial configuration helps reduce magnetic field interference. Compared to other integration methods, this scheme achieves a balance among structural simplicity, packaging compactness, and energy conversion efficiency. A neural network surrogate model was employed to optimize the structural parameters of the energy regeneration device, enhancing its compatibility with the suspension system. A prototype of the ELEMRD was fabricated and subjected to experimental testing. Based on this, a novel electromagnetic linear semi-active magnetorheological suspension system is proposed, and its vibration control and energy regeneration performance under LQR control are analyzed.
The organization of this paper is as follows: Section 2 presents the structure and working principle of the newly designed ELEMRD. Section 3 employs a neural network surrogate model to optimize the key parameters of the energy-regenerative device, followed by the fabrication and experimental testing of the ELEMRD prototype. Section 4 establishes the model of the electromagnetic linear energy-regenerative magnetorheological semi-active suspension system. Section 5 presents a simulation-based comparative analysis of the vibration attenuation and energy regeneration performance of the proposed system under LQR and PID control. Finally, Section 6 draws the conclusions.

2. Structure of ELEMRD

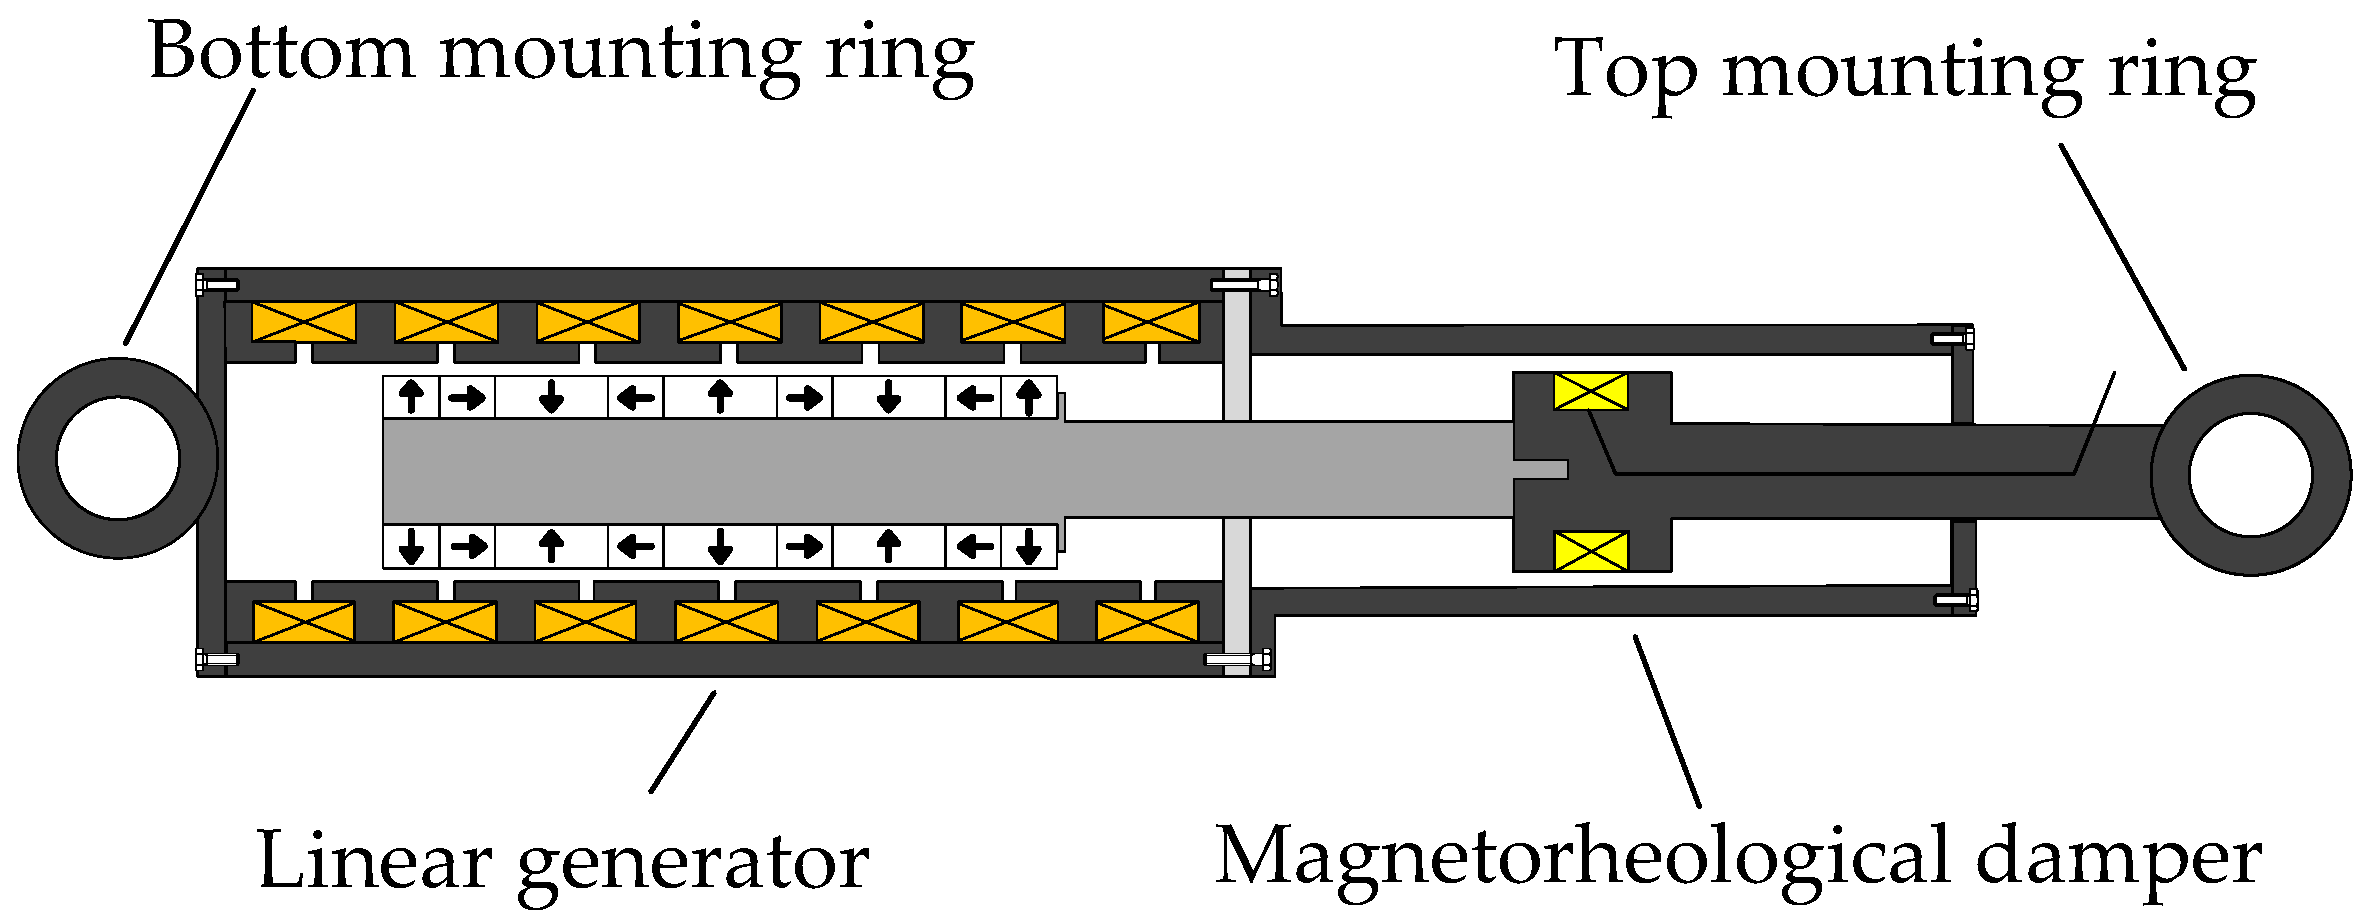
Figure 1 presents the structural diagram of the newly designed ELEMRD, which mainly consists of two components: an MRD and a linear generator. The MRD adopts a conventional double-rod piston configuration. The linear generator is a cylindrical, single-phase permanent magnet type. Its primary part (stator) mainly comprises coil windings, motor housing, and end caps, whereas the secondary part (mover) consists of permanent magnets and their support structure. The support structure of the permanent magnets shares a common shaft with the lower piston rod of the MRD, ensuring that the mover of the generator moves synchronously with the piston of the MRD.
The design of the ELEMRD encompasses the following aspects:
  • The MRD and the linear generator are integrated in a coaxial, axially aligned configuration, allowing for a compact design without requiring complex magnetic shielding.
  • The linear generator employs a long-primary, short-secondary topology, enhancing the utilization efficiency of the permanent magnets.
  • The permanent magnets in the linear generator are arranged in a Halbach array, which provides a higher air-gap flux density, thereby improving the power density of the energy regeneration device. The support structure of the permanent magnets is made of aluminum, effectively reducing the inertial mass.
The working principle of the ELEMRD is as follows. The top mounting ring of the ELEMRD is connected to the vehicle body, while the bottom mounting ring is attached to the wheel. When the vehicle travels over an uneven road surface, relative motion occurs between the vehicle body and the wheel. According to Faraday’s law of electromagnetic induction, this relative motion induces a voltage in the secondary coil of the linear generator. After passing through the rectifier and energy recovery circuits, the electrical energy is stored in a supercapacitor, which can be used to power the magnetorheological damper or auxiliary vehicle systems, such as lighting and control systems. Meanwhile, the suspension controller processes signals from various vehicle sensors and regulates the output of the stored energy from the supercapacitor to the excitation coil of the magnetorheological damper, thereby generating the required damping force. Figure 2 illustrates the power supply process from the linear generator to the MRD. In accordance with Lenz’s law, the power generation of the linear generator simultaneously produces an electromagnetic damping force, which serves as an effective supplemental damping mechanism.

3. Parameter Optimization of ELEMRD

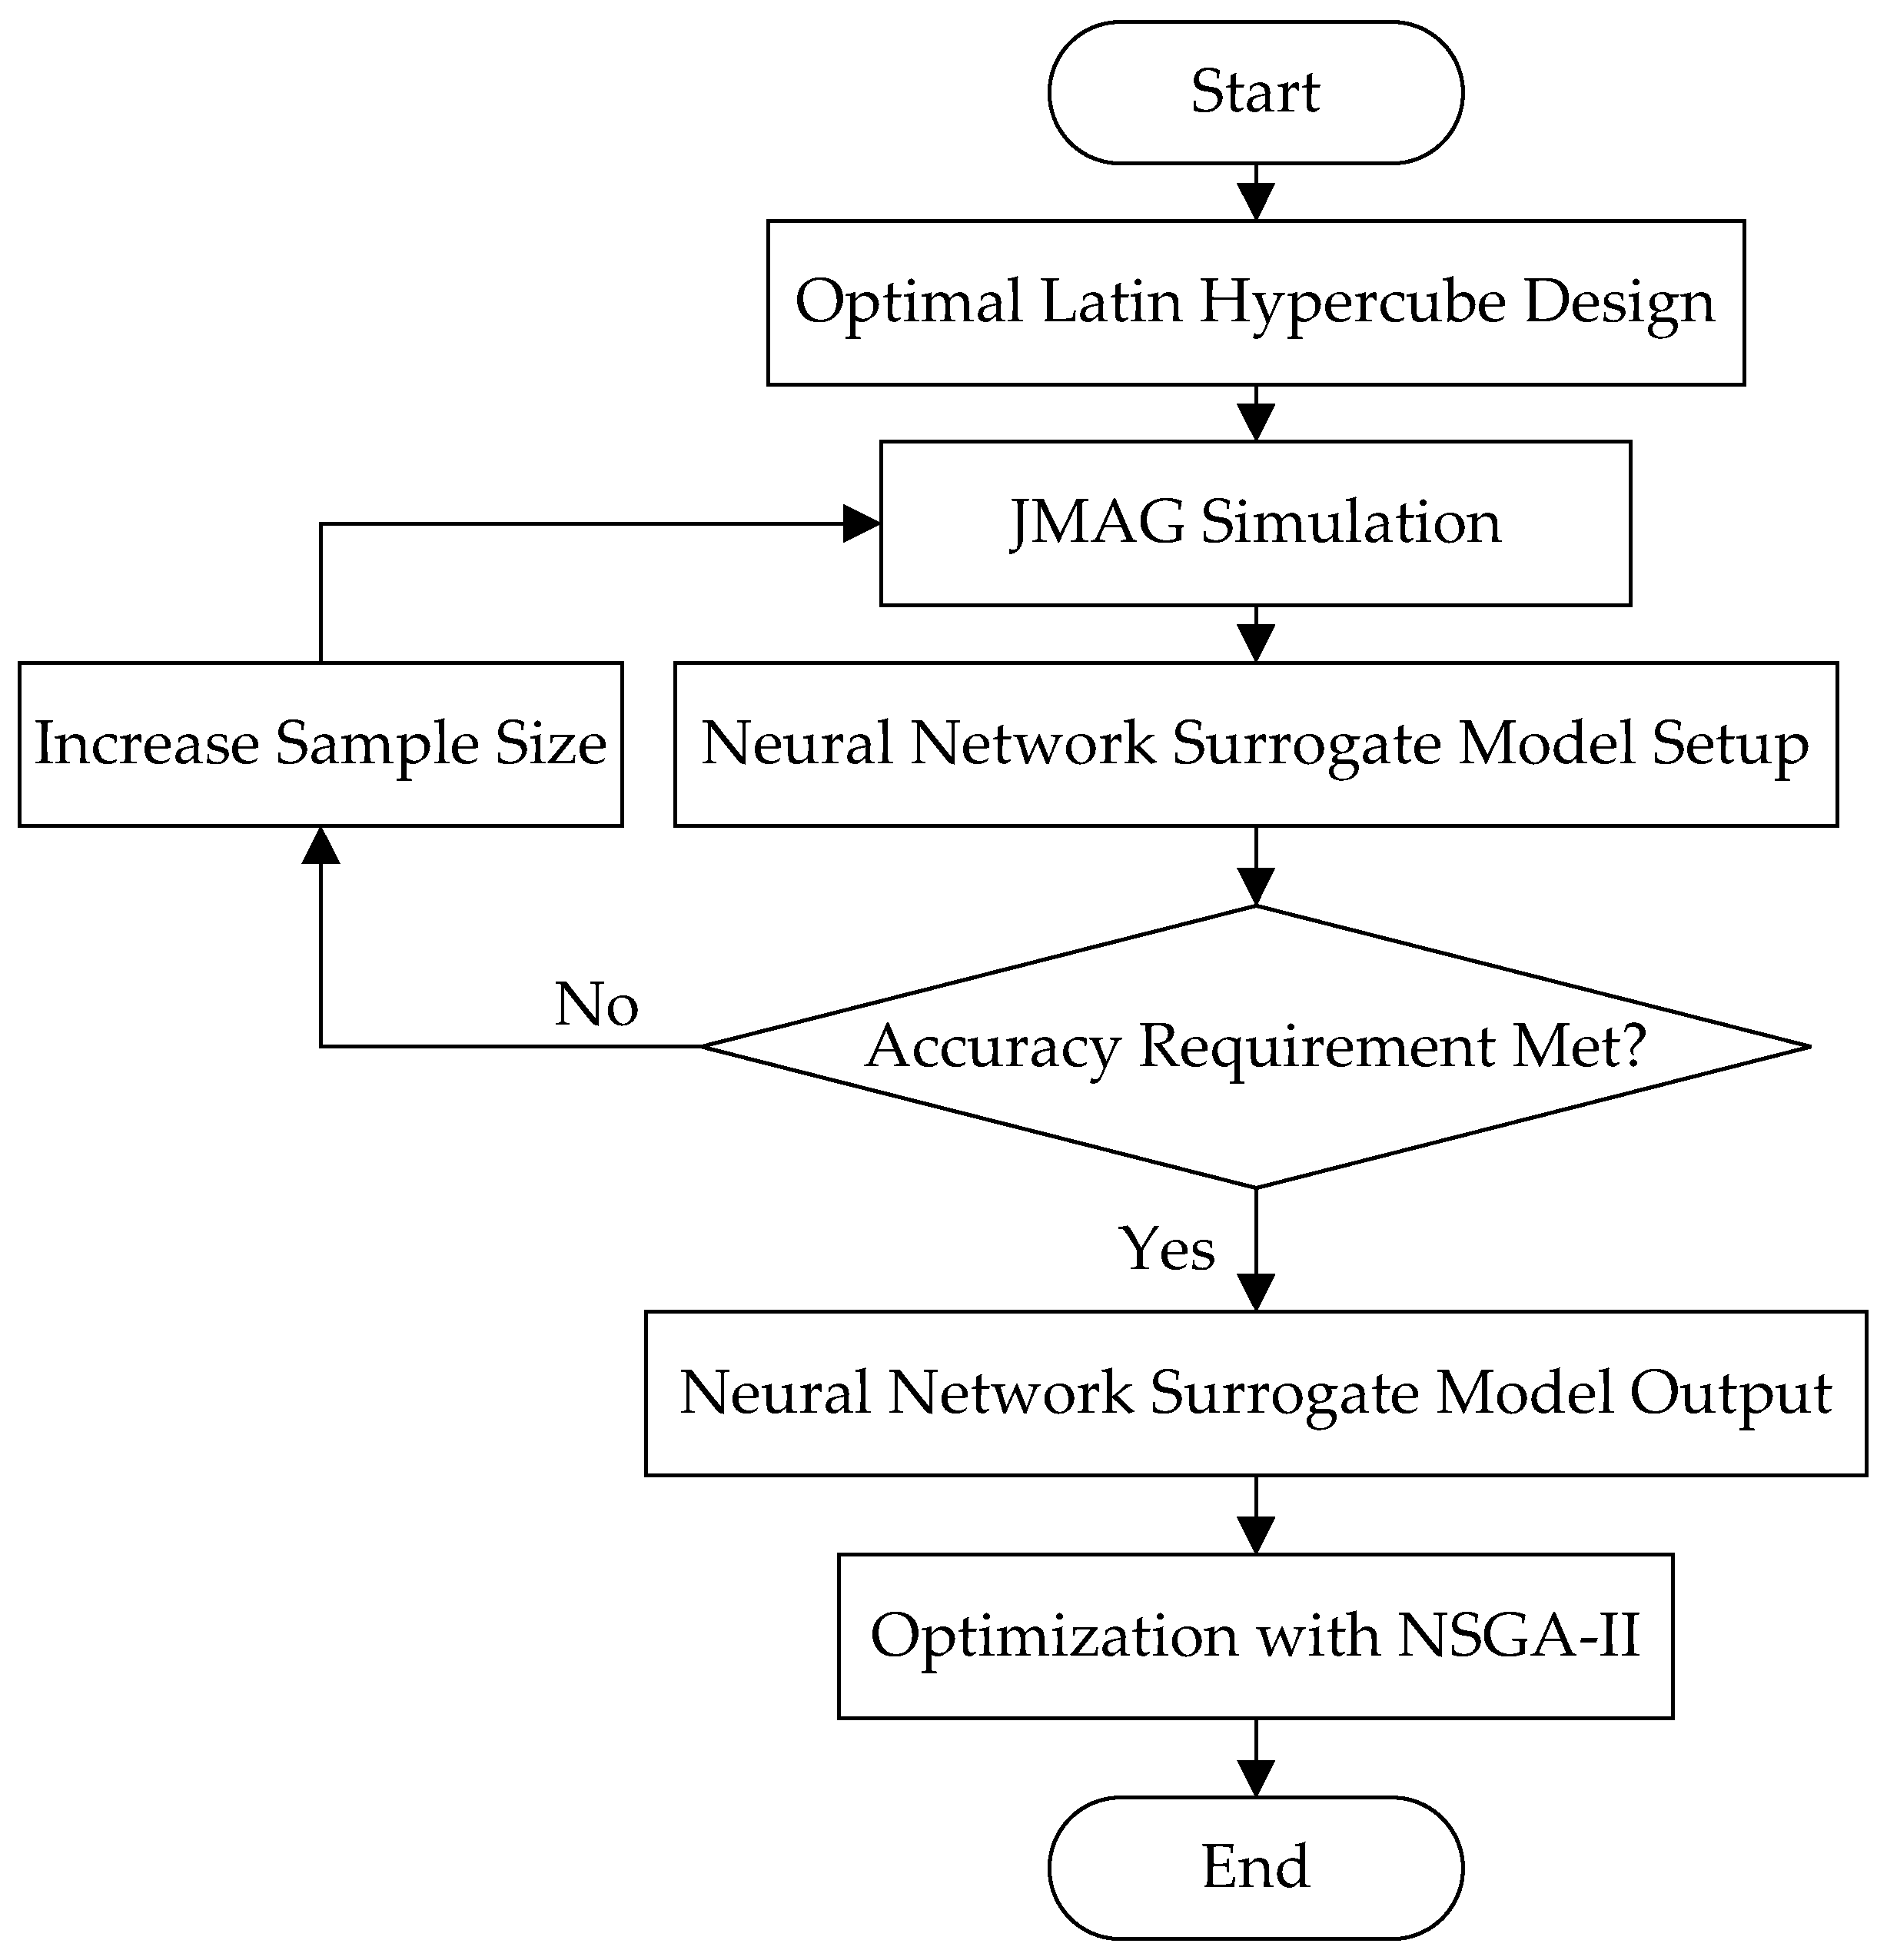
To enhance compatibility with the suspension system, this paper proposes an optimized design of the linear generator. Figure 3 illustrates the optimization workflow. The fundamental steps of this process are as follows. First, a specified number of sample parameters are uniformly generated within the optimization space. Second, these sample parameters are substituted into the finite element model to obtain simulation results. Third, a neural network surrogate model is constructed using the sample parameters and simulation results. Fourth, the accuracy of the surrogate model is assessed; if the fitting accuracy is insufficient, the sample size is increased. Finally, the Non-dominated Sorting Genetic Algorithm II (NSGA-II) [29] is employed to optimize the surrogate model. Compared to simplified analytical methods, finite element optimization can more accurately simulate the complex magnetic field distribution inside the generator, thereby improving optimization accuracy. Compared to direct iterative optimization using transient finite element models, surrogate models significantly reduce the optimization time while maintaining accuracy.

3.1. Mathematical Model of Optimization

The optimization formulation consists of three fundamental elements: optimization parameters, the objective function, and constraint conditions. The optimal parameter configuration is obtained by solving this constrained optimization problem.
(1) Objective Function: Enhancing energy recovery efficiency is a key goal in designing energy-regenerative suspension systems. The regenerative power output of the linear generator directly indicates the suspension system’s energy recovery capability. Therefore, maximizing the root mean square (RMS) of the no-load regenerative power P no load is selected as one of the optimization objectives. The cogging force of the linear generator varies periodically with the relative position between the mover and stator, representing an uncontrollable force. At times, the mover must overcome this force to operate properly, leading to unnecessary energy losses. If the cogging force is too large or fluctuates sharply, the suspension may fail to respond sensitively to small vibrations. Optimizing the cogging force helps reduce additional energy consumption, enhance power generation efficiency, and ensure better controllability of the suspension’s dynamic response. Therefore, minimizing the peak cogging force F c is chosen as another optimization objective.
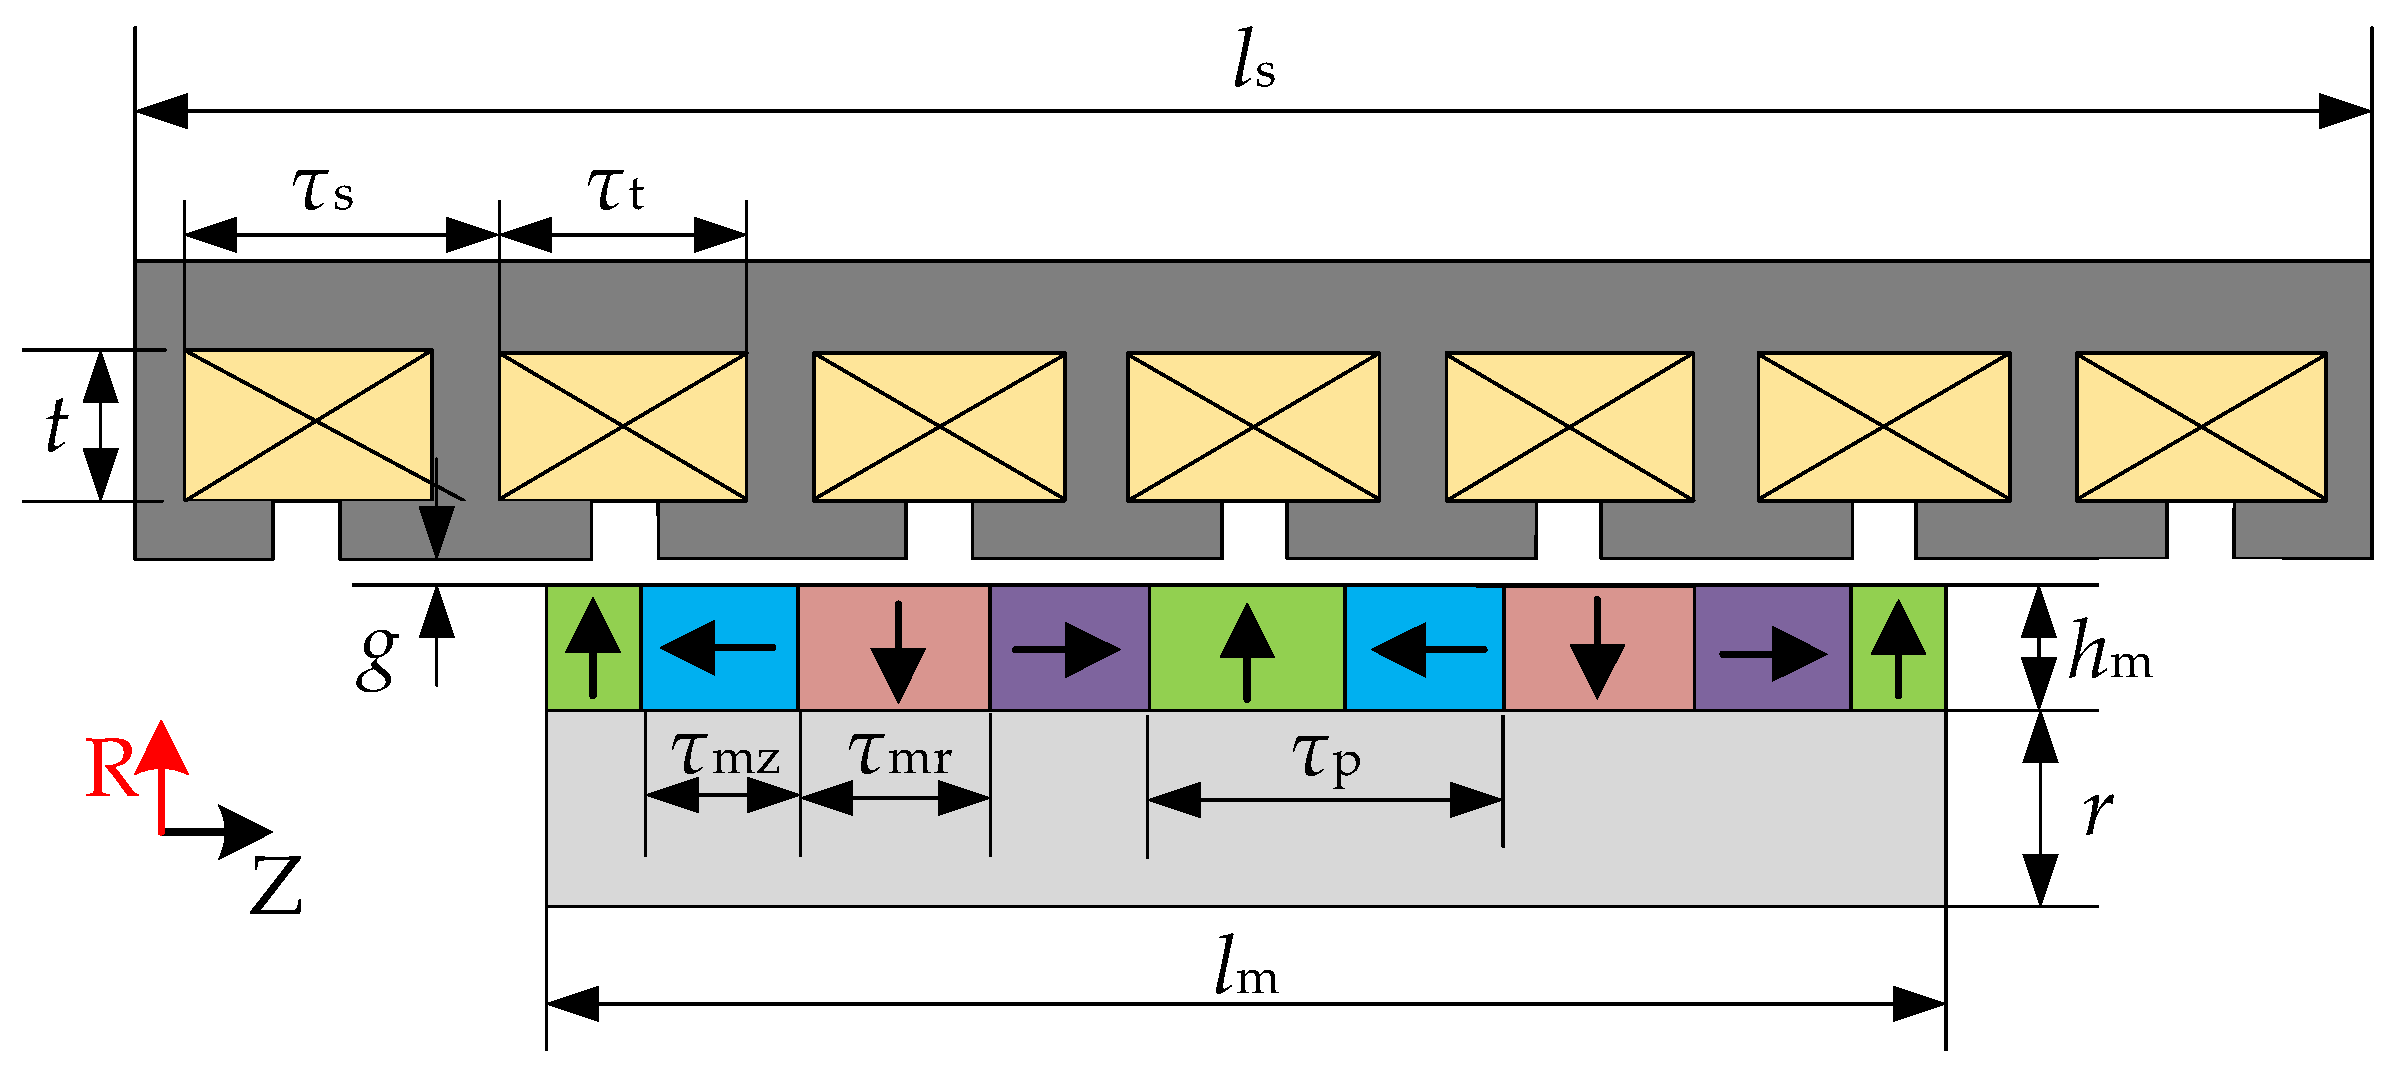
(2) Optimization Parameters: The operating principle of the linear generator is based on Faraday’s law of electromagnetic induction. The magnetic field strength produced by the permanent magnet directly determines the generator’s power generation capability. The cogging force is a periodic force resulting from the interaction between the permanent magnet and the stator slots. When the slot-pole combination is fixed, the cogging force magnitude mainly depends on the permanent magnet’s size. Figure 4 illustrates the schematic diagram of the linear generator’s structural dimensions, while Table 1 lists the corresponding dimensional parameters. The permanent magnet thickness h m , the length of the axially magnetized permanent magnet τ mz , and the length of the radially magnetized permanent magnet τ mr are selected as optimization parameters. Table 2 presents the optimization parameters and their value ranges.
(3) Constraints: Considering that the designed suspension stroke is ±40 mm, the stroke S of the linear generator’s mover should not be less than 80 mm. The permanent magnet pole pitch is τ p = τ mz + τ mr . The ratio between the slot pitch τ s and the permanent magnet pole pitch τ p is 9:10. The permanent magnet array of the linear generator consists of four poles, and there are seven slots. Therefore, the stroke of the mover S is:
S = 7 · τ s 4 · τ p = 2.3 · ( τ mz + τ mr )
The mathematical model for optimizing the linear generator can be formulated as follows:
f x = max P no load x , min F c x s . t . S x 80 x = h m , τ mz , τ mr

3.2. Construction of Neural Network Surrogate Model

To reduce optimization time and enhance computational efficiency, this study develops a neural network surrogate model to approximate the relationship between the optimization parameters and the objective functions of the linear electromagnetic generator. The NSGA-II algorithm is then applied to perform the optimization.The neural network model learns from input data and effectively approximates the nonlinear functional relationship between input variables and output responses. It consists of adjustable weights and biases that represent the connection strengths between neurons during training. The output of the neural network model can be expressed as:
Y = f ( W X + B )
where Y is the output vector, X is the input vector, W is the weight matrix, B is the bias vector, and f ( · ) is the activation function that introduces the nonlinear transformation.
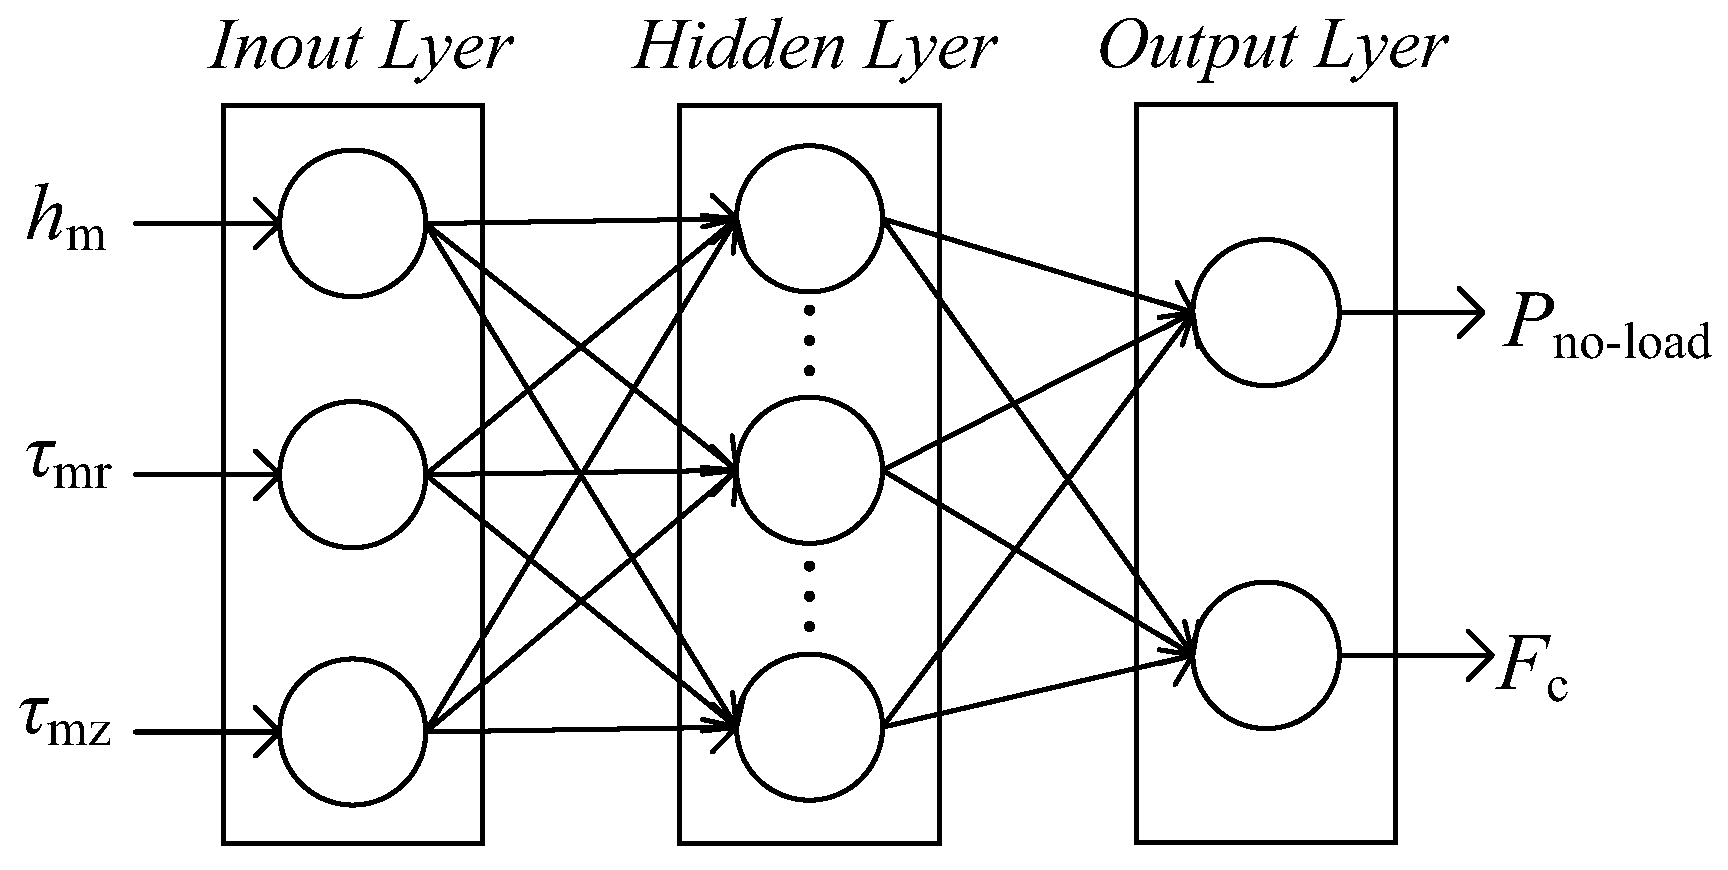
A neural network typically consists of an input layer, one or more hidden layers, and an output layer. For the optimization model of the linear generator, the input layer is defined by the permanent magnet thickness h m , the length of the axially magnetized permanent magnet τ mz , and the length of the radially magnetized permanent magnet τ mr . The output layer corresponds to the no-load regenerative power P no load and the peak cogging force F c . Because the number of inputs and outputs in the neural network model is relatively small, there is only one hidden layer, which consists of 14 neurons. The activation function used in the hidden layer is the tansig function, while the output layer employs the purelin function. The structure of the neural network for the linear generator is illustrated in Figure 5.
Constructing a neural network surrogate model requires an initial dataset. One main source of inaccuracy in surrogate modeling is the insufficient number and non-uniform distribution of sample points in this dataset. In this study, the Optimal Latin Hypercube Design (OLHD) is used to generate the initial dataset. OLHD improves the uniformity of sample distribution in high-dimensional space through algorithmic optimization [30]. This method ensures a more uniform spatial distribution of sample points, even with a relatively small sample size.
The procedure for establishing the neural network surrogate model is as follows: In total, 120 and 30 sets of sample parameters are generated within the optimization parameter space using the OLHD method, serving as the training and test sets, respectively. These 150 sample sets are then input into the JMAG finite element simulation model to obtain corresponding actual values, with the mover velocity fixed at 0.4 m/s. Finally, the neural network surrogate model is constructed using the 120 training samples and their corresponding simulation results.

3.3. Accuracy of Neural Network Surrogate Model

If the surrogate model achieves higher fitting accuracy, the prediction error can be reduced accordingly, thereby improving the accuracy of the subsequent optimization results based on the model. Therefore, evaluating the fitting performance of the neural network surrogate model is essential. In this study, the fitting accuracy of the surrogate model is evaluated using the coefficient of determination ( R 2 ) in combination with the root mean square error (RMSE). The expressions for these two metrics are given as follows:
R 2 = 1 i = 1 n y i y ˜ i 2 i = 1 n y i y ¯ i 2
RMSE = 1 n i = 1 n ( y i y ˜ i ) 2
where y i is the actual value of the i-th sample point, y ^ i is the predicted value of the i-th sample point obtained from the surrogate model, and y ¯ is the mean of the actual sample values.
The coefficient of determination R 2 ranges from 0 to 1, with values closer to 1 indicating higher fitting accuracy of the surrogate model [31]. The root mean square error (RMSE) measures the average deviation between the predicted and actual values. The R 2 and RMSE are calculated using the actual and predicted values from the neural network surrogate model for the 30 sample points in the test set, as shown in Table 3.
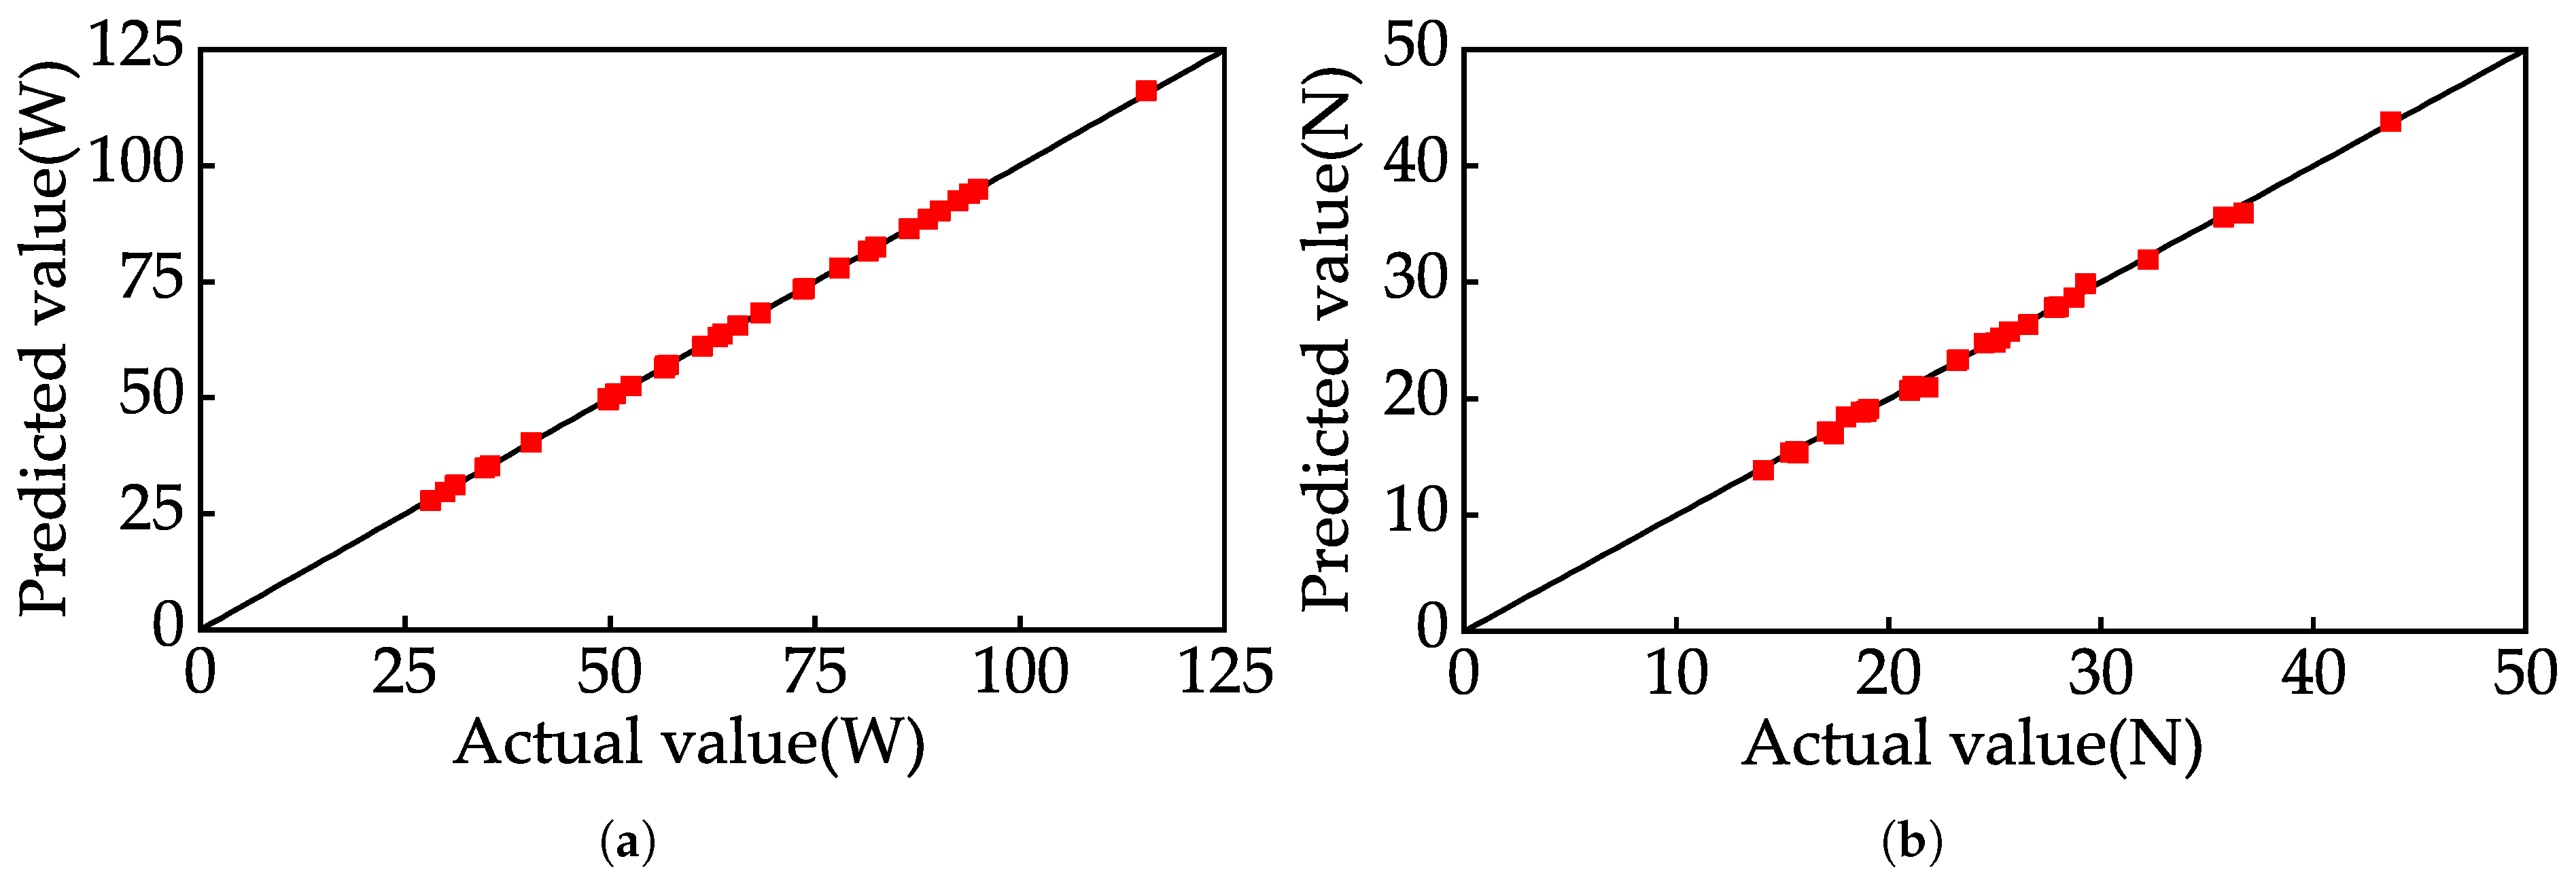
As shown in Table 2, the R 2 values of the neural network surrogate model are very close to 1, and the RMSE values are extremely small, indicating high fitting accuracy. To further validate the fitting accuracy of the neural network model, the actual and predicted values for the 30 sample points in the test set were compared, as shown in Figure 6. In this figure, a black line passing through the origin at a 45-degree angle represents points where the predicted values equal the actual values. The sample points for both the cogging force and no-load regenerative power are closely distributed around this line. This demonstrates that the prediction errors between the neural network surrogate model and the finite element simulation results are minimal. Therefore, the neural network surrogate model developed in this study is employed to replace the finite element simulation model for key parameter optimization of the linear generator.

3.4. Optimization Results

The NSGA-II algorithm was employed to optimize the neural network surrogate model, and the Pareto front for P no load and F c is shown in Figure 7.
As shown in Figure 7, there is a trade-off between increasing P no load and reducing F c . The Pareto front reveals two extreme cases, where either both P no load and F c reach their maximum values, or both reach their minimum values, represented by points P 1 and P 2 on the Pareto front. The optimization results for these two extremes are summarized in Table 4.
From Table 4, it is evident that through optimization, the maximum P no load reaches 116.2 W; however, at this point, the F c is 45.8 N, which is unfavorable for the stable operation of the suspension. The minimum F c is 8.7 N, but this results in a reduced P no load of only 24.9 W, indicating low energy conversion efficiency.
Furthermore, as shown in Figure 7, it is evident that along the Pareto front, as F c increases, the growth rate of P no load initially accelerates before gradually slowing down. The point P 3 on the Pareto front represents the inflection point of this growth rate. Therefore, the parameters corresponding to P 3 are chosen as the final optimization parameters, as they strike a balance between a relatively high P no load and a relatively low F c . A comparison between the optimized and initial designs is shown in Table 5. Following optimization, the no-load regenerative power P no load of the linear generator increased by 14.2%, while the peak positioning force F c decreased by 49.7%. The optimized parameters were incorporated into the finite element model for simulation. Figure 8 compares the initial and optimized designs in terms of no-load regenerative power and cogging force.

3.5. Bench Test of ELEMRD

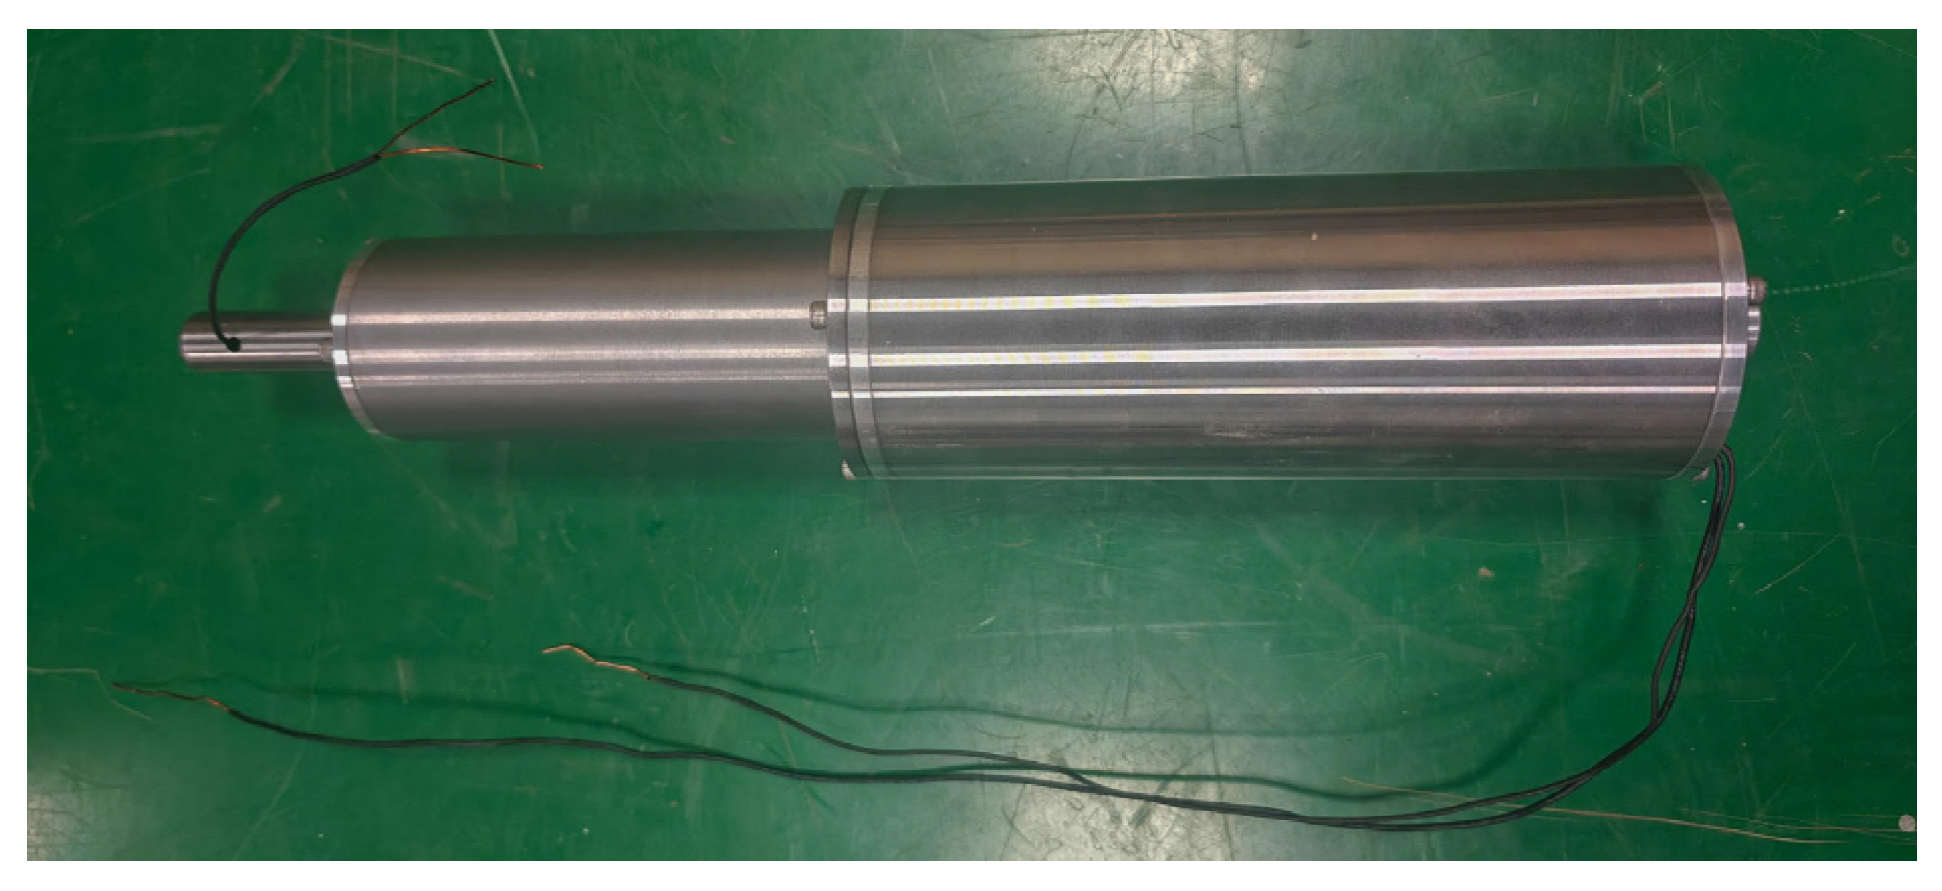
To investigate the damping and power generation performance of the designed ELEMRD, a prototype was fabricated, as shown in Figure 9. The test setup for the ELEMRD bench experiment is presented in Figure 10. It mainly consists of a vibration exciter, the ELEMRD prototype, a controller, a power supply, a driver, a digital oscilloscope, and a force sensor. One end of the ELEMRD is connected to the test stand beam, while the other end is attached to the vibration exciter. The designed prototype has a diameter of 80 mm and an axial length of 421 mm, making it suitable for installation within the packaging constraints of a typical passenger vehicle suspension system. The excitation coil of the prototype has a resistance of approximately 1.5 Ω and a maximum operating current of 1.5 A, resulting in a maximum power consumption of 3.4 W. The low power consumption makes it well-suited for use in suspension applications.
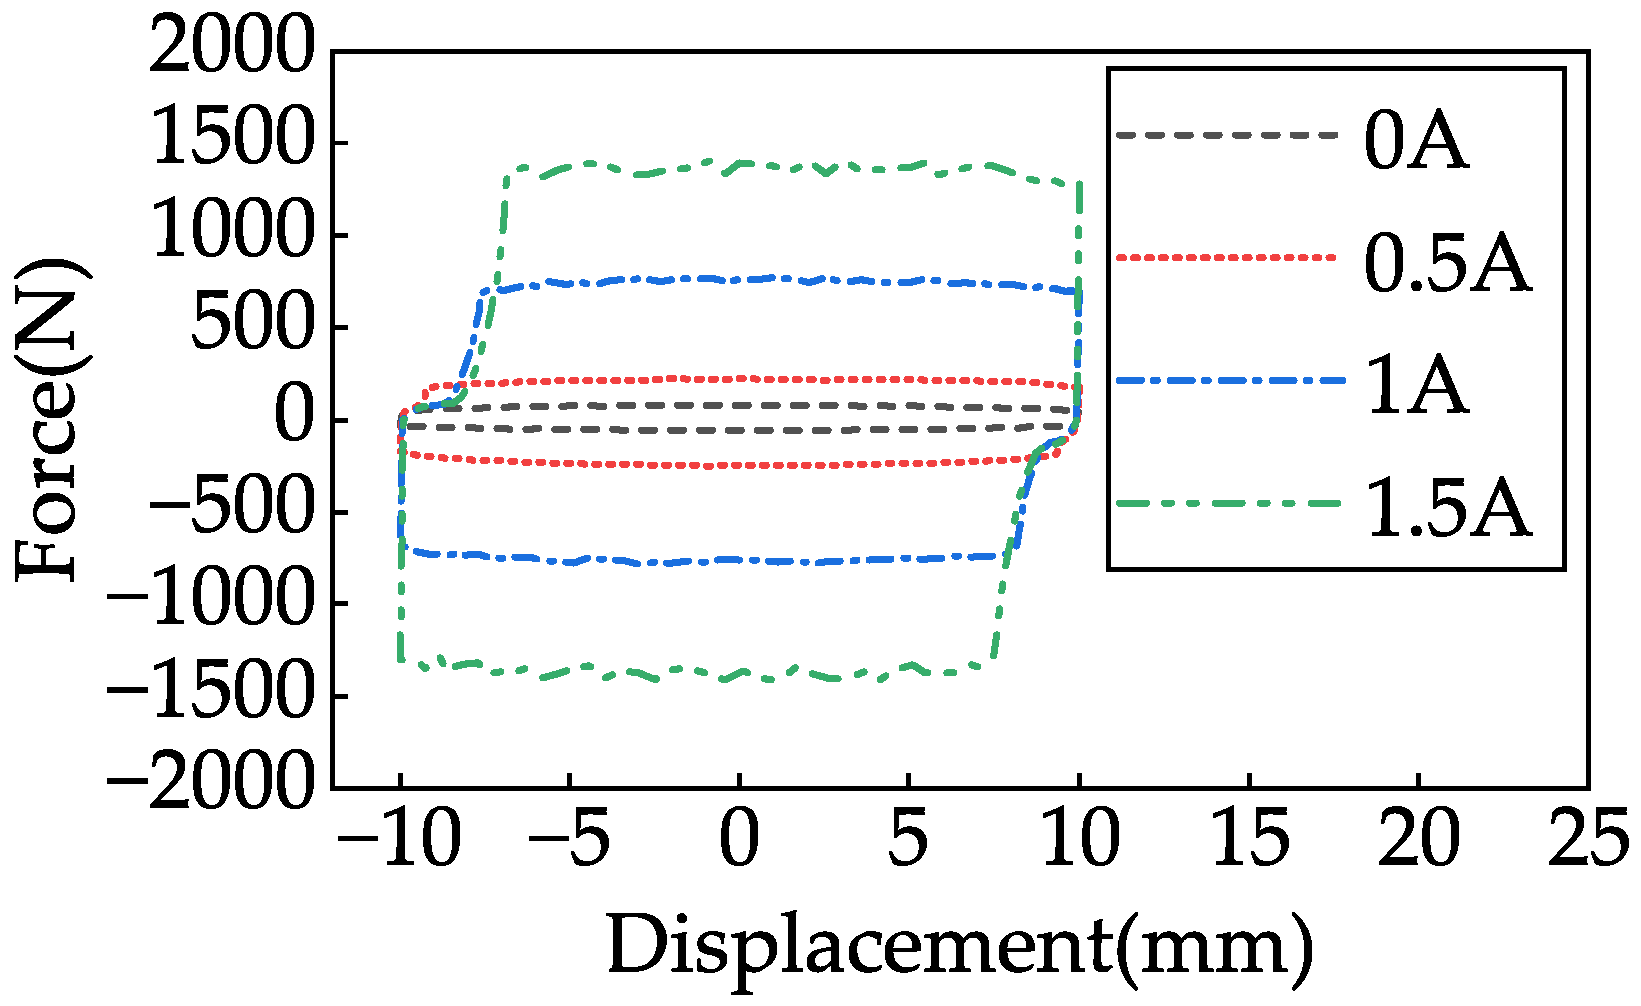
According to the Chinese automotive industry standard QC/T 491-2018 [32], the damping performance of the ELEMRD prototype was tested using a harmonic excitation with an amplitude of 10 mm and a frequency of 8.3 Hz. The excitation current of the MRD was set to 0 A, 0.5 A, 1A, and 1.5 A using the controller. The corresponding damping forces under different current levels are shown in Figure 11. When the input current is 0 A, the maximum damping force output by the MRD is 81 N. Neglecting friction, the viscous damping coefficient of the MRD is approximately 156 N/(m/s). When the input currents are 0.5 A, 1 A, and 1.5 A, the maximum output forces are 249 N, 784 N, and 1415 N, respectively. As the excitation current increases, the output force of the MRD also increases. Figure 12 compares the simulated and experimental values of the maximum output force at different current levels. Discrepancies exist between the simulated and experimental results, with errors of 12.5%, 11.6%, 3.2%, and 6.1%, respectively. These discrepancies are relatively complex and mainly arise from four sources: (1) limitations in magnetic field simulation accuracy and the applicability of the Bingham constitutive model; (2) zero-field viscosity deviation and particle sedimentation effects inherent in the magnetorheological fluid; (3) the influence of the nonlinear characteristics of magnetic materials on the actual magnetic flux distribution; (4) structural deviations introduced during the manufacturing and assembly processes. To address these issues, the design process will be further optimized in future work to improve modeling accuracy and enhance the overall reliability of the design.
To analyze the energy regeneration performance of the ELEMRD prototype, harmonic excitations with amplitudes of 5 mm and 10 mm and a frequency of 5 Hz were applied. A digital oscilloscope was used to record and store the generated instantaneous voltage signals. The voltage waveforms under the two amplitude conditions are shown in Figure 13. As shown in Figure 13, at the same frequency, increasing the vibration amplitude leads to a higher induced voltage in the ELEMRD. When the vibration amplitude is 5 mm, the RMS value of the induced voltage is 11.3 V. Given that the measured coil resistance is approximately 11.5 Ω , the corresponding energy regeneration power of the ELEMRD is 11.1 W. When the vibration amplitude increases to 10 mm, the RMS voltage rises to 20.7 V, resulting in an energy regeneration power of 37.3 W.

4. Energy-Regenerative Magnetorheological Semi-Active Suspension System Modeling

4.1. Dynamic Model of ELEMRD

When the linear generator unit in the ELEMRD forms a closed circuit with an external load, an induced current is generated in the regenerative coil. This current enables energy transfer to the external circuit and produces an electromagnetic damping force. Consequently, the total output force of the ELEMRD comprises two components: the damping force from the MRD and the electromagnetic force from the linear generator. These components must be calculated separately before being combined.
The output force of an MRD can be described by various models [33]. Among them, the Bingham model is widely adopted because of its simple structure and clear physical interpretation. However, this model exhibits certain limitations in the roll-off characteristics at low speeds and the nonlinear hysteresis behavior. Although not highly accurate, the model features a small number of parameters, ease of computation, and controllability, making it a balanced compromise between accuracy and efficiency. Therefore, it was selected for the analysis. More complex constitutive models, such as the Bouc–Wen or Spencer models, will be employed in future studies. According to the Bingham model, the output force of an MRD is expressed as [21]:
F d = D + 3 ( D 2 d 2 ) 2 4 D h 2 π L η h v + D + 3 ( D 2 d 2 ) 4 h π L τ y sgn ( v )
where D is the piston diameter, d is the piston rod diameter, h is the damping channel width, L is the damping channel length, v is the suspension relative velocity, η is the apparent viscosity coefficient of the magnetorheological fluid, τ y is the shear stress of the magnetorheological fluid, and sgn ( · ) is the Heaviside step function.
As shown in Equation (5), the output force of the MRD is divided into two components:
F 0 = C 0 v
F a = C 1 sgn ( v )
where F 0 is the non-adjustable damping force, C 0 is the viscous damping coefficient, with C 0 = D + 3 ( D 2 d 2 ) 2 4 D h 2 π L η h , F a is the adjustable damping force, with C 1 = D + 3 ( D 2 d 2 ) 4 h π L τ y .
When the linear generator coil in the ELEMRD forms a closed circuit with the external load, the induced current in the linear generator coil is expressed as:
I = k e v R a + R 0
where k e is the back electromotive force (EMF) coefficient of the linear generator, R 0 is the internal resistance of the linear generator, and R a is the external load resistance.
The electromagnetic damping force generated by the linear generator is expressed as:
F e = k f I
where k f is the electromagnetic force coefficient of the linear generator.
By combining Equations (8) and (9), the following expression can be obtained:
F e = k e k f R a + R 0 v
To simplify the analysis, the armature reaction is temporarily neglected. Consequently, the no-load back electromotive force constant and the electromagnetic force coefficient are assumed to be numerically equal, with the no-load back electromotive force coefficient used for calculation. The back electromotive force coefficient of the linear generator is not constant; it depends on the suspension working space. The relationship between them is illustrated in Figure 14.
The linear generator also exhibits cogging force; therefore, the output force of the linear generator is expressed as:
F m = F e + F c
where F c is the cogging force.
The total output force of the ELEMRD is expressed as:
F = F d + F m

4.2. Dynamic Model of Semi-Active Suspension System

This study is based on a two-degree-of-freedom 1/4 energy-regenerative magnetorheological semi-active suspension system model, as illustrated in Figure 15, where m s is the sprung mass, m t is the unsprung mass, K s is the suspension stiffness, K t is the tire stiffness, x s is the absolute displacement of the sprung mass, x t is the absolute displacement of the unsprung mass, and x r is the road excitation.
According to Newton’s second law, the equations of motion for the energy-regenerative magnetorheological semi-active suspension system are expressed as:
m s x ¨ s = K s x s x t + F m t x ¨ t = K s x s x t K t x t x r F
where F is the total output force of ELEMRD.
Select state vectors X = x ˙ s , x ˙ t , x s x t , x t x r T , output vectors Y = x ¨ s , x s x t , x t x r T , corresponding input vectors U = F and w = x ˙ r . The three outputs of the suspension system are defined as follows: (1) sprung mass acceleration (SMA); (2) suspension working space (SWS); (3) dynamic tire deflection (DTD).
Equation (13) can be transformed into the state-space form as follows:
X ˙ = A X + B U + G w Y = C X + D U
where
A = 0 0 K s m s 0 0 0 K s m t K t m t 1 1 0 0 0 1 0 0 , B = 1 m s 1 m t 0 0 , G = 0 0 0 1 , C = 0 0 K s m s 0 0 0 1 0 0 0 0 1 , D = 1 m s 0 0 .

4.3. Road Modeling

The road input model is a key parameter for the energy-regenerative magnetorheological semi-active suspension system. According to ISO-8608 [34], the power spectral density (PSD) expression of road roughness is given by:
G q ( n ) = G q ( n 0 ) n n 0 W
where G q ( n 0 ) is the road roughness coefficient ( m 3 ), n is the spatial frequency ( m 1 ), n 0 is the reference spatial frequency ( n 0 = 0.1 m 1 ), and W is the frequency index, which determines the frequency structure of the PSD of the road displacement. Road roughness is classified into 8 levels from A to H [35], as shown in Table 6.
The temporal PSD of road roughness is determined by the spatial PSD and the vehicle speed. When the vehicle travels at a speed u, the temporal frequency f of the road input is the product of u and n:
f = u n
Therefore, the temporal PSD can be expressed as:
G q ( f ) = G q ( n 0 ) n 0 2 u f
The PSD of the vertical velocity of road roughness in the frequency domain is given by:
G q ˙ ( f ) = 4 π 2 G q ( n 0 ) n 0 2 u
From Equation (20), it can be observed that the PSD of the vertical velocity of the road roughness is constant across the entire frequency range and is independent of frequency. Its characteristics are consistent with those of a white noise power spectrum. The filtered white noise method can accurately reflect the real conditions of a random road roughness. This method models the road excitation of a quarter vehicle using the first-order linear system response to unit white noise excitation. Since the road spectrum is approximately flat in the low-frequency range, a low-cutoff frequency f 0 can be introduced into the road roughness model, and the time PSD can be expressed as:
G q ( f ) = G q ( n 0 ) n 0 2 u f + f 0 2
where f 0 is cut-off frequency in the time domain.
The frequency-domain response function can be expressed as:
H ( j ω ) = 2 π n 0 G q ( n 0 ) u j ω + ω 0
The time-domain model for the filtered white noise road roughness is expressed as follows [36]:
x ˙ r ( t ) = 2 π n 1 u x r ( t ) + 2 π n 0 G q ( n 0 ) u ω ( t )
where n 1 is the lower cutoff spatial frequency of the road roughness, with n 1 = 0.01 m 1 .
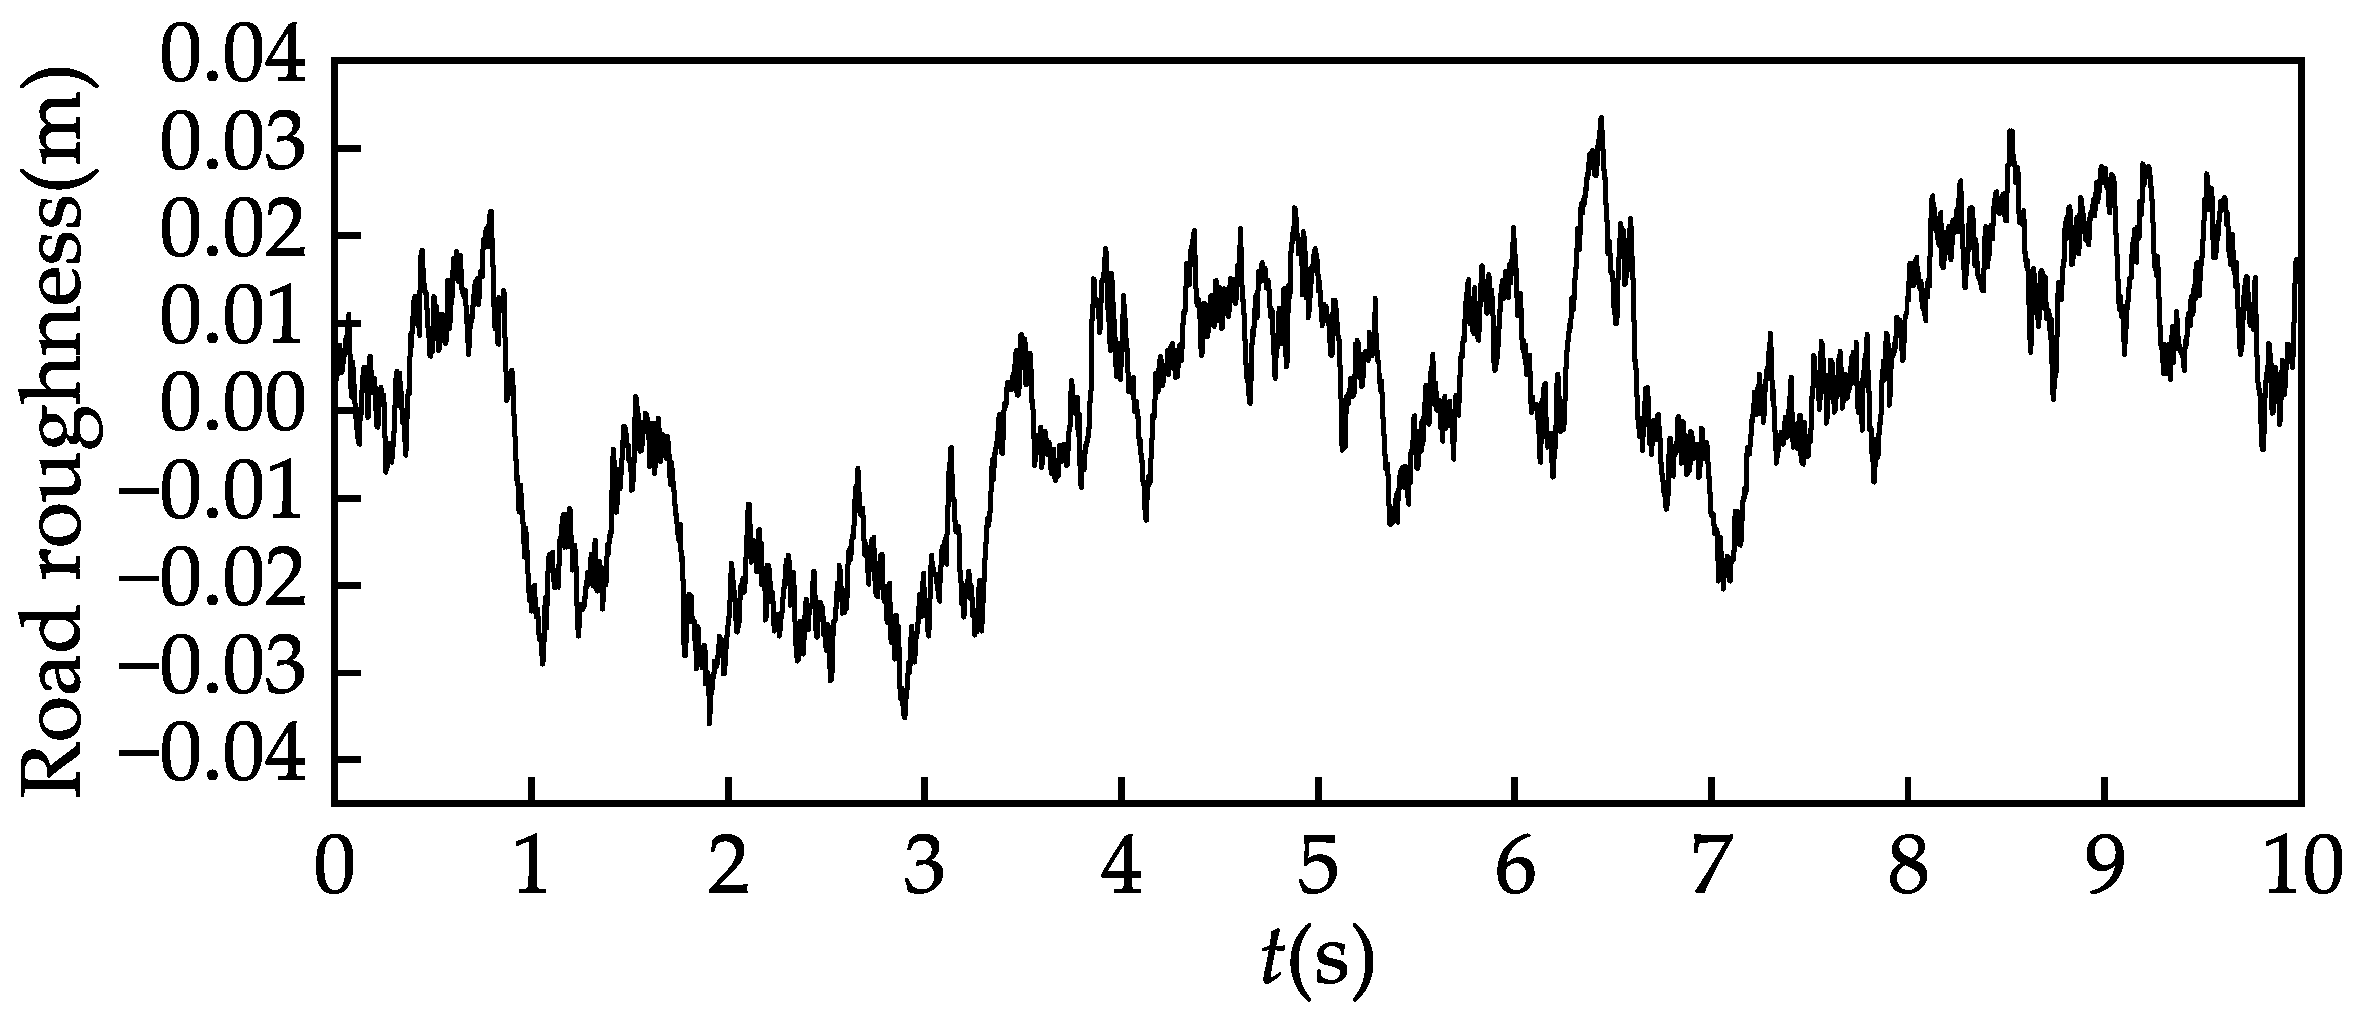
In this study, a Class C road and a vehicle speed of 20 m/s were selected as the road model. The road simulation results obtained in MATLAB R2018b are shown in Figure 16.

4.4. Performance Evaluation Method for Suspension Systems

In the performance evaluation of suspension systems, the most commonly used indicators are sprung mass acceleration, dynamic tire load (DTL), and suspension working space. The dynamic tire load is defined as the product of dynamic tire deformation and tire stiffness. For suspension systems with energy-regenerative capability, regenerative power (RP) is also a key evaluation metric. The RMS values of these indicators are typically used to assess the overall suspension performance. The RMS values of sprung mass acceleration, dynamic tire load, suspension working space, and regenerative power are denoted as σ SMA , σ DTL , σ SWS , and σ RP , respectively, and can be expressed as:
σ SMA = 1 t 0 0 t 0 x ¨ s 2 d t
σ DTL = K t 1 t 0 0 t 0 x t x r 2 d t
σ SWS = 1 t 0 0 t 0 x s x t 2 d t
σ RP = 1 t 0 0 t 0 k e ( x ˙ s x ˙ t ) 2 R a + R 0 2 d t

5. Simulation Analysis of Energy-Regenerative Magnetorheological Semi-Active Suspension Performance Based on LQR Algorithm

5.1. Design of LQR Controller

The LQR algorithm is widely used in controlling semi-active and active suspension systems [37,38]. By applying full-state feedback, the optimal control input is determined based on the weighted contributions of various states. The objective of the LQR algorithm is to minimize the cumulative effect of state errors over the entire operational period, thereby optimizing the system’s overall dynamic performance. The specific derivation is as follows:
If the actual state is Y ( t ) and the desired state is Y ( t ) , then the state error can be expressed as:
e t = Y t Y t
The cost function can be expressed as:
J = 0 e 2 ( t ) d t = 0 Y ( t ) Y ( t ) 2 d t
When the system is in equilibrium, let Y ( t ) = 0 . Under this condition, the cost function simplifies to:
J = 0 Y 2 ( t ) d t
When multiple state variables are involved, the cost function is given by:
J = 0 Y 1 2 t + Y 2 2 t + . . . + Y n 2 t d t
By assigning different weights to each state variable, the cost function can be expressed as:
J = 0 q 1 2 Y 1 2 t + q 2 2 Y 2 2 t + . . . + q n 2 Y n 2 t d t
Equation (32) can be rewritten in the following matrix form:
J = 0 Y T q T q Y d t
Let q T q = Q 0 . Then, the cost function can be expressed as:
J = 0 Y T Q 0 Y d t
By substituting the expression Y = C X + D U from Equation (15) into Equation (34), the cost function can be reformulated as:
J = 0 X T Q X + U T R U + 2 X T N U d t
where Q = C T Q 0 C , R = D T Q 0 D , N = C T Q 0 D .
The optimal control gain matrix K can be expressed as [39]:
U = K X = R 1 B T P + N T X
where K is the optimal state feedback gain matrix and P is the solution to the following Riccati equation:
P A + A T P P B + N R 1 B T P + N T + Q = 0
In this study, the objective performance index is defined as the time-domain integral of the weighted sum of the squares of sprung mass acceleration, dynamic tire load, and suspension deflection. Since the dynamic tire load equals the product of tire stiffness and dynamic tire deformation, the dynamic tire deformation is used instead of dynamic tire load in the cost function calculation. The cost function can be expressed as:
J = 0 Y T Q 0 Y = 0 q 1 x ¨ s 2 + q 2 x s x t 2 + q 3 x t x r 2 d t
where
Q 0 = q 1 0 0 0 q 2 0 0 0 q 3
q 1 , q 2 , and q 3 are the weighting coefficients for sprung mass acceleration, dynamic tire deflection, and suspension working space, respectively.
Figure 17 illustrates the control structure of the energy-regenerative magnetorheological semi-active suspension based on the LQR controller. In Figure 17, F ideal represents the ideal output force of the ELEMRD as calculated by the LQR controller, while F actual represents the actual output force of the ELEMRD.
Based on the dynamic model of the ELEMRD, the output force of the ELEMRD can be expressed as:
F = F 0 + F a + F e + F c = C 0 x ˙ s x ˙ t + F a k e 2 R a + R 0 x ˙ s x ˙ t + F c
Therefore, to achieve the ideal control force F ideal , it can only be realized by adjusting the adjustable damping force F aideal . The ideal adjustable damping force F aideal output of ELEMRD is:
F aideal = F ideal F 0 F e F c
Since the MRD can only provide resistance, the ideal control force cannot be directly applied to the suspension model. Instead, the direction of the ideal adjustable damping force and the relative velocity between the piston and cylinder must be determined first. If their directions align, the actual adjustable damping force is immediately set to zero. Therefore, the expression for the actual output force of the ELEMRD is:
F actual = F 0 + F e + F c if F aideal x ˙ s x ˙ t 0 F ideal if F aideal x ˙ s x ˙ t < 0
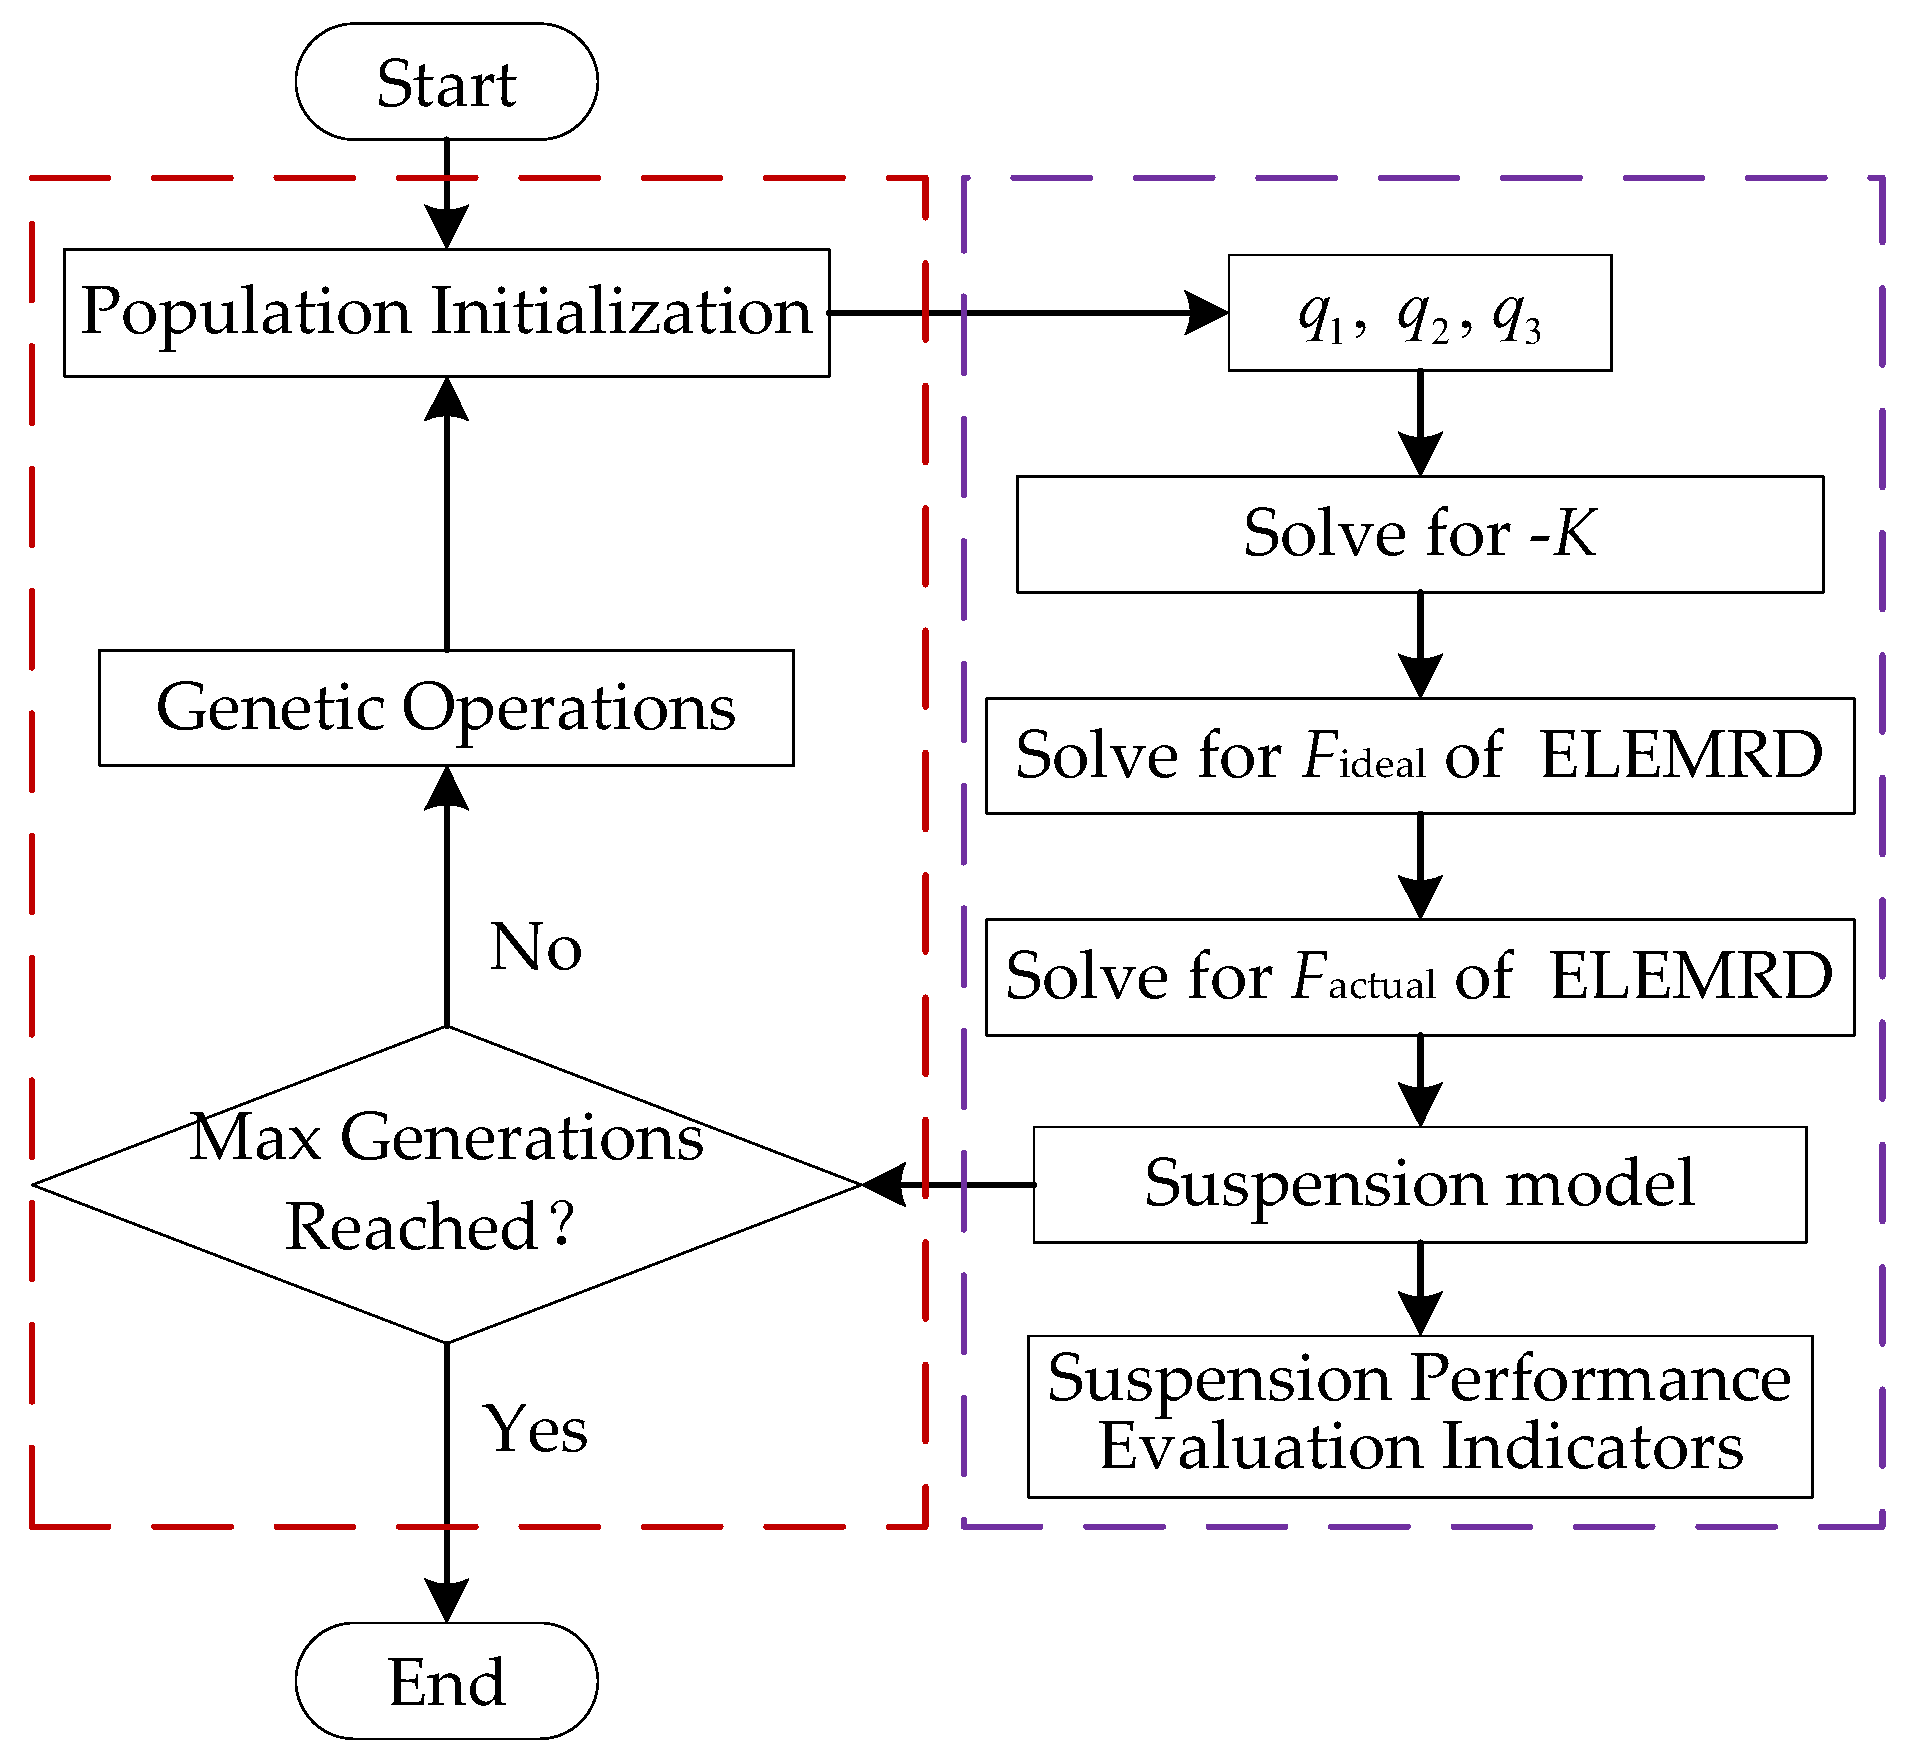
The key to the LQR algorithm lies in the design of the weighting matrices Q. However, no fixed rule or empirical guideline generally exists for their selection. Designers often rely on trial-and-error methods to determine appropriate values, which are typically inefficient and may not produce optimal results. Therefore, this study employs the NSGA-II algorithm to optimize the LQR weighting coefficients by leveraging its global search capability. The optimization process is illustrated in Figure 18. The optimization of LQR controller parameters is an offline process. During actual operation, only simple matrix multiplication operations need to be performed, and the processor resource requirements are relatively low, making it highly suitable for real-time control of suspension systems. For different operating conditions, multiple sets of LQR controller parameters can be pre-optimized offline, and then switched or interpolated among these parameters in real time based on the system status.
Before optimizing the weighting coefficients with the NSGA-II algorithm, the objective function and constraints must be defined. To maximize vehicle ride comfort and handling stability, sprung mass acceleration and tire dynamic load are selected as the primary optimization objectives, while suspension working space is set as a constraint. This constraint prevents excessively small suspension working space, which leads to very low regenerative power and is detrimental to vibration energy recovery. The mathematical expression of the optimization function is as follows:
f ( x ) = min σ BA x , σ DTL x s . t . σ BA x σ BApassive σ DTL x m s + m t g / 3 x s x t max 0.04 x = [ q 1 , q 2 , q 3 ]
where σ BA ( x ) σ BApassive indicates that the RMS value of the sprung mass acceleration for the semi-active suspension is lower than that of the passive suspension, in order to ensure ride comfort. σ DTL x ( m s + m t ) g / 3 ensures that the RMS value of the tire dynamic load for the semi-active suspension does not exceed one-third of the static tire load, in order to maintain driving safety [40]. x s x t max represents the maximum amplitude of the suspension working space, which should not exceed the suspension’s limit travel of 0.04 m to prevent the suspension from hitting the limit block.

5.2. Suspension Performance Simulation Analysis

Table 7 presents the 1/4 vehicle parameters used in the suspension performance simulation conducted in MATLAB. To facilitate the analysis of the performance of the energy-regenerative magnetorheological semi-active suspension, the performance of the passive suspension is used as a reference in this study. The numerical values of the simulation parameters m s , m t , and K s for the passive suspension system are identical to those of the semi-active suspension system. The damping coefficient of the passive suspension is set to 1500 N/(m/s). The damping coefficient of 1500 N/(m/s) (damping ratio ζ 0.287 ) was selected based on the typical sprung mass (360 kg) and spring stiffness (19,000 N/m) of passenger car suspensions. This value falls within the comfort-oriented damping ratio range of 0.2 to 0.4 and aligns with parameters of similar passive suspensions, ensuring the validity of the comparative results.
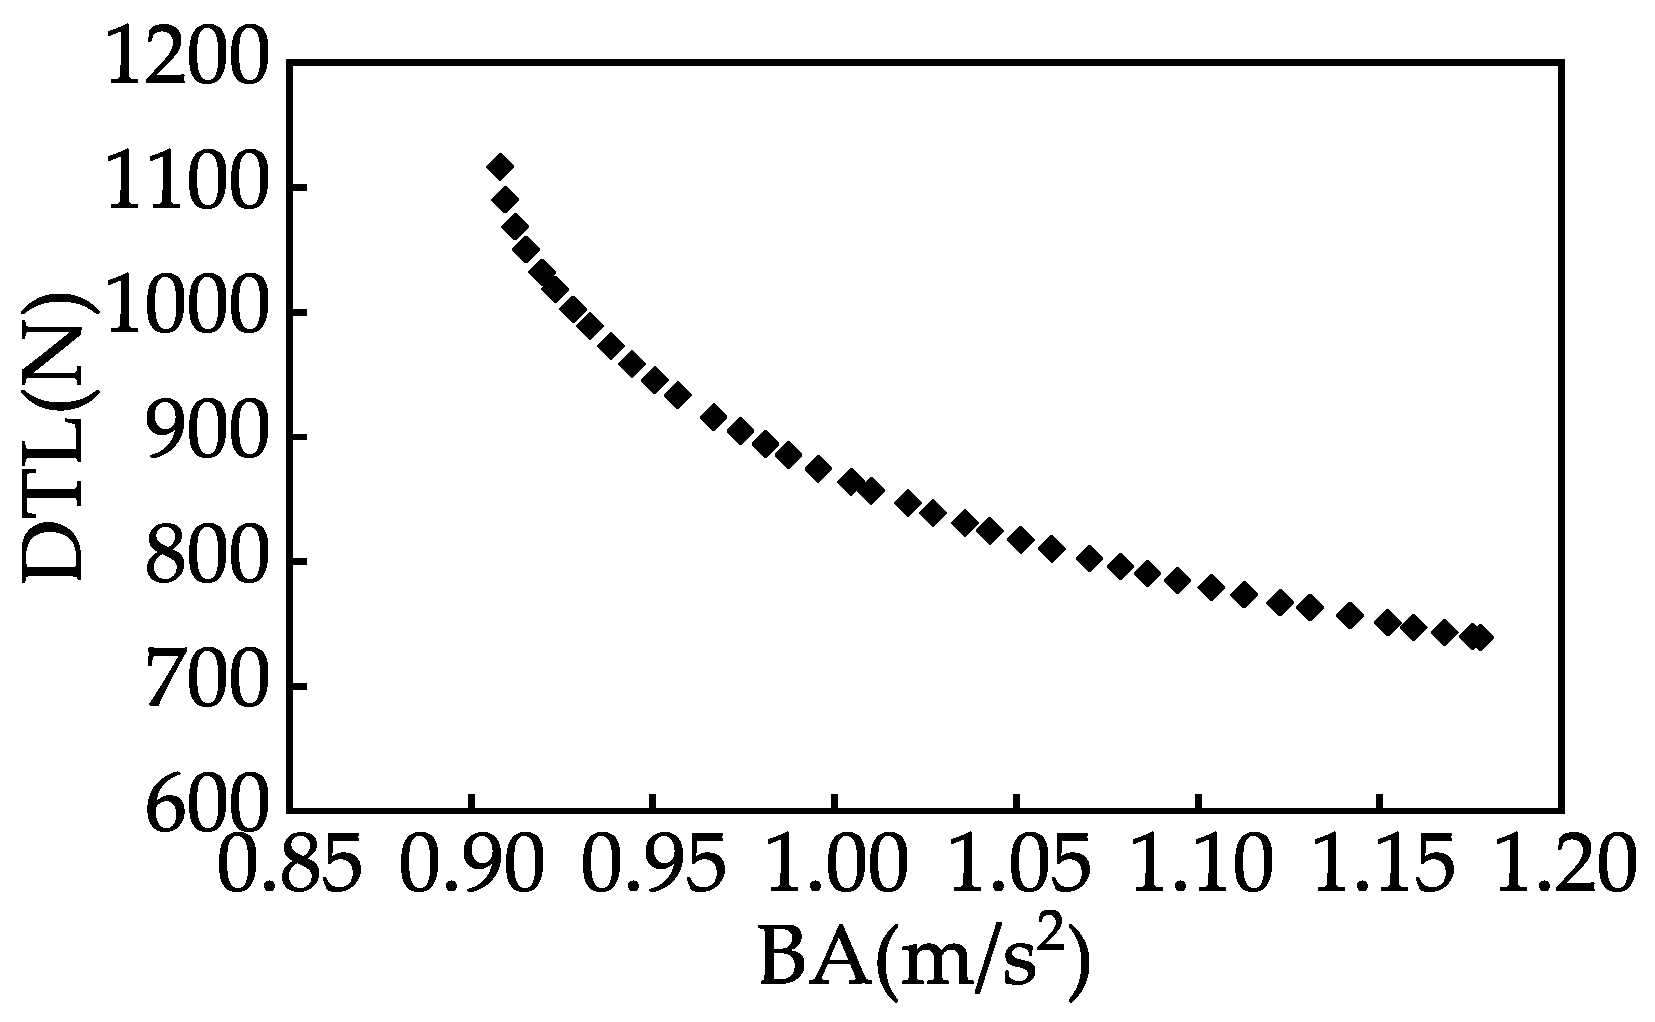
Figure 19 illustrates the Pareto optimal front of the objective functions obtained from the LQR weighting coefficient optimization for the energy-regenerative magnetorheological semi-active suspension system, under Class C road conditions and a vehicle speed of 20 m/s. As shown in Figure 19, the two objectives are conflicting and have inconsistent dimensions.
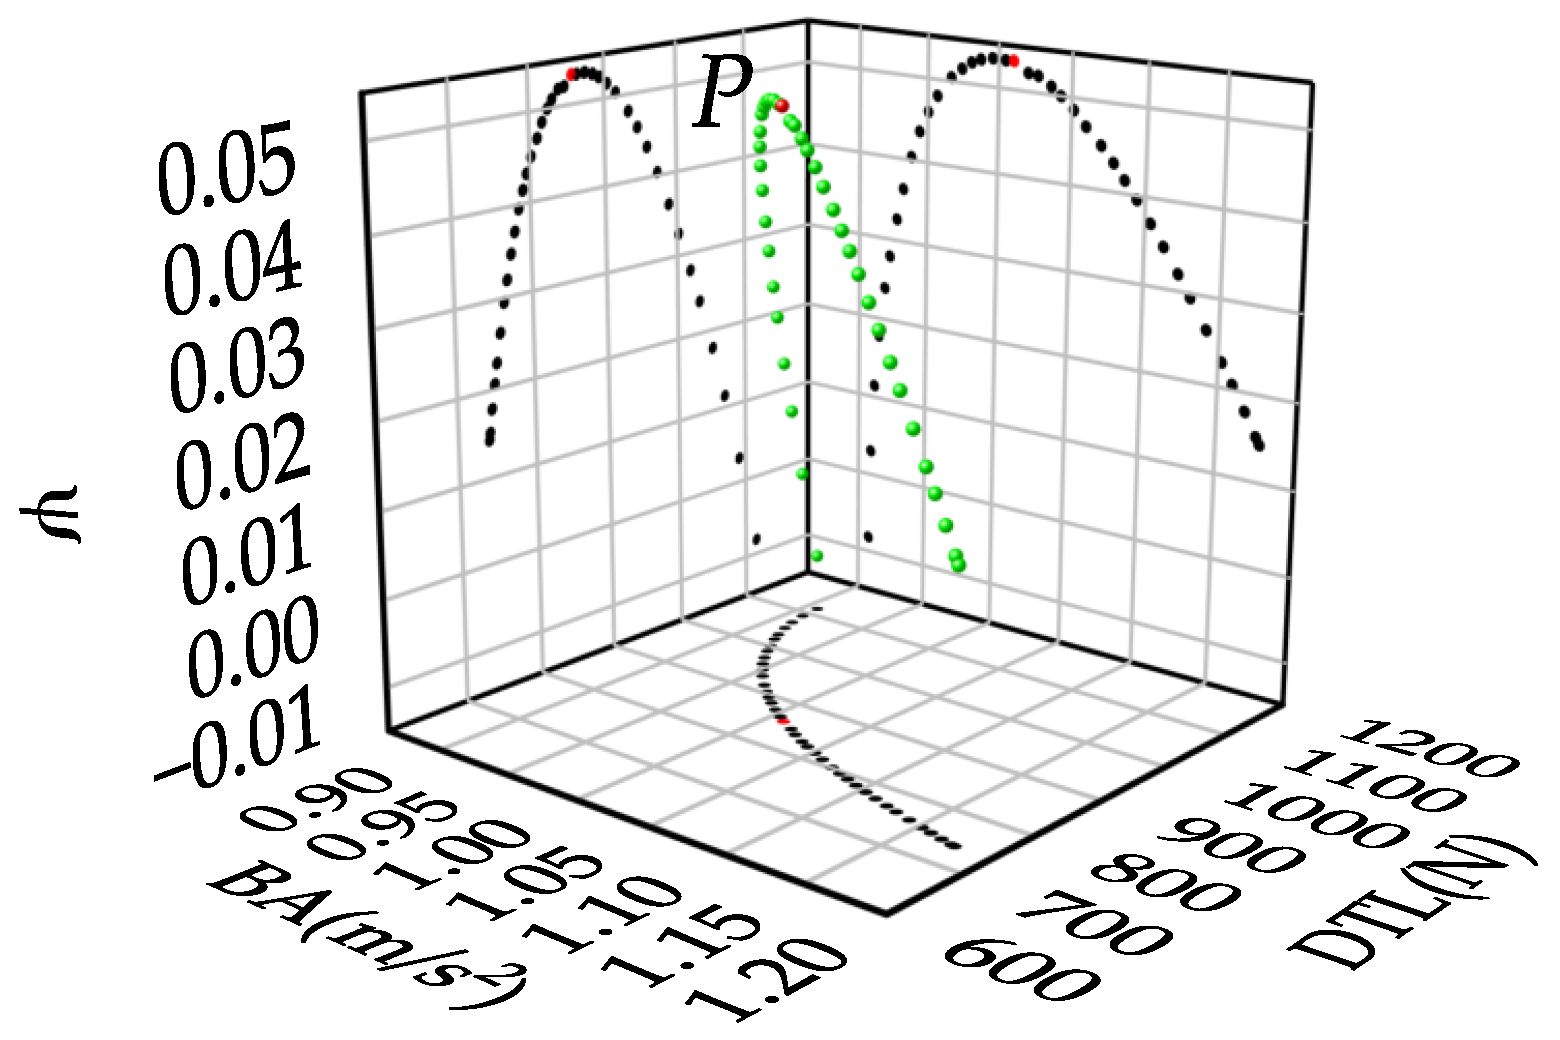
To identify the most suitable solution from the Pareto front, the performance improvement rate of each candidate solution relative to the baseline passive suspension is calculated. A weighted sum method is used for comprehensive evaluation and decision-making. A dominant weight of 0.65 is assigned to the comfort metric, while a secondary weight of 0.35 is given to the handling metric, forming a comprehensive scoring function. The parameter set with the highest comprehensive score is ultimately selected as the optimal design solution. The specific calculation formula is as follows:
ψ i = 0.65 · BA passive BA i BA passive + 0.35 · DTL passive DTL i DTL passive
where S i is the comprehensive performance score of the i-th Pareto solution, BA i is the body acceleration of the i-th solution, BA passive is the body acceleration of the baseline passive suspension, DTL i is the dynamic tire load of the i-th solution, and DTL passive is the dynamic tire load of the baseline passive suspension.
Figure 20 illustrates the comprehensive scores of different solution sets on the Pareto front. Among them, point P has the highest comprehensive score, and thus its corresponding parameters are identified as the final optimized solution. The parameter set at point P emphasizes ride comfort while also maintaining handling stability, demonstrating a well-balanced trade-off between the two objectives. The three weighting coefficients of the LQR controller are q 1 = 3.157 × 10⁶, q 2 = 2.931 × 10⁷, and q 3 = 1.118 × 10¹¹.
The optimized LQR weighting coefficients were incorporated into the controller, and time-domain simulations were performed in MATLAB. A comparative analysis was conducted between the above simulation results and those of the passive suspension and the semi-active suspension controlled by the PID algorithm, as shown in Figure 21. The corresponding RMS values of the suspension performance metrics are provided in Table 8.
As shown in Figure 21 and Table 8, compared to the passive suspension, both LQR and PID control improve suspension performance. In terms of sprung mass acceleration, the PID and LQR controllers reduce the value by approximately 29.9% and 14.2%, respectively, thereby enhancing ride comfort. Regarding suspension working space, the PID and LQR controllers reduce it by about 7.5% and 2.8%, respectively, contributing to helping to limit suspension stroke and improved structural reliability. However, the PID controller increases the dynamic tire load by approximately 41.0%, which adversely affects handling stability, whereas LQR leads to a more moderate increase of around 11.2%, achieving a better trade-off between comfort and handling. Although the comprehensive scores of the two control strategies differ only slightly, the LQR controller demonstrates a more balanced performance across all evaluation metrics. Therefore, it is more suitable for applications that demand both high ride comfort and driving stability.
Based on the time-domain simulations, a frequency-domain analysis of the suspension performance metrics was further carried out. Figure 22 compares the power spectral densities of various performance indicators under the passive suspension and the energy-regenerative magnetorheological semi-active suspension systems controlled by LQR and PID strategies. Compared with the passive suspension, both the LQR- and PID-controlled semi-active suspensions exhibit significantly lower PSD values of sprung mass acceleration in the low-frequency range (1–3 Hz), indicating enhanced capability in suppressing low-frequency vibrations. Among them, the PID controller demonstrates the most pronounced effect. However, in the mid-to-high frequency range (8–15 Hz), the PID-controlled suspension shows relatively higher PSD values of dynamic tire load. This is mainly because the PID control strategy prioritizes ride comfort, which comes at the expense of high-frequency tire–road contact performance. In addition, both semi-active suspensions considerably reduce the total energy of the suspension working space in the low-frequency range (0.5–3 Hz) compared to the passive suspension, which helps mitigate the risk of collisions between the suspension and the bump stops.
Figure 23 illustrates the variation of regenerative power of the energy-regenerative MR semi-active suspension under Class C Road conditions at a vehicle speed of 20 m/s. It can be observed that the regenerative power exhibits significant fluctuations in response to the vehicle’s vertical vibrations. Under LQR control, the peak regenerative power reaches 404.2 W, with an RMS value of 49.8 W. In contrast, the PID-controlled system achieves a higher peak of 633.2 W and an RMS value of 80.2 W, representing an approximate 61% increase in RMS power compared to LQR. However, this improvement in regenerative power under PID control comes at the cost of degraded high-frequency tire–road contact performance, indicating a trade-off with vehicle handling stability. Considering all performance metrics comprehensively, the LQR strategy achieves a more balanced overall dynamic performance. The energy-regenerative semi-active magnetorheological suspension can generate an output power of approximately 25 W under Class C Road conditions, during which the vibration velocity of the suspension reaches 0.3054 m/s. Even when accounting for an estimated 40% loss in the energy harvesting and management circuitry, the system still possesses the capability for self-powering.
Dong et al proposed a parallel configuration that integrates a magnetorheological damper with an energy regeneration device to recover vibration energy from the vehicle suspension system [16]. Under the same vibration velocity condition (0.3054 m/s), their suspension system achieved an energy recovery power of approximately 13 W. In contrast, the axially integrated structure proposed in this study achieves a significantly higher energy regeneration capability under identical vibration conditions, demonstrating its advantages in structural compactness and energy conversion efficiency.
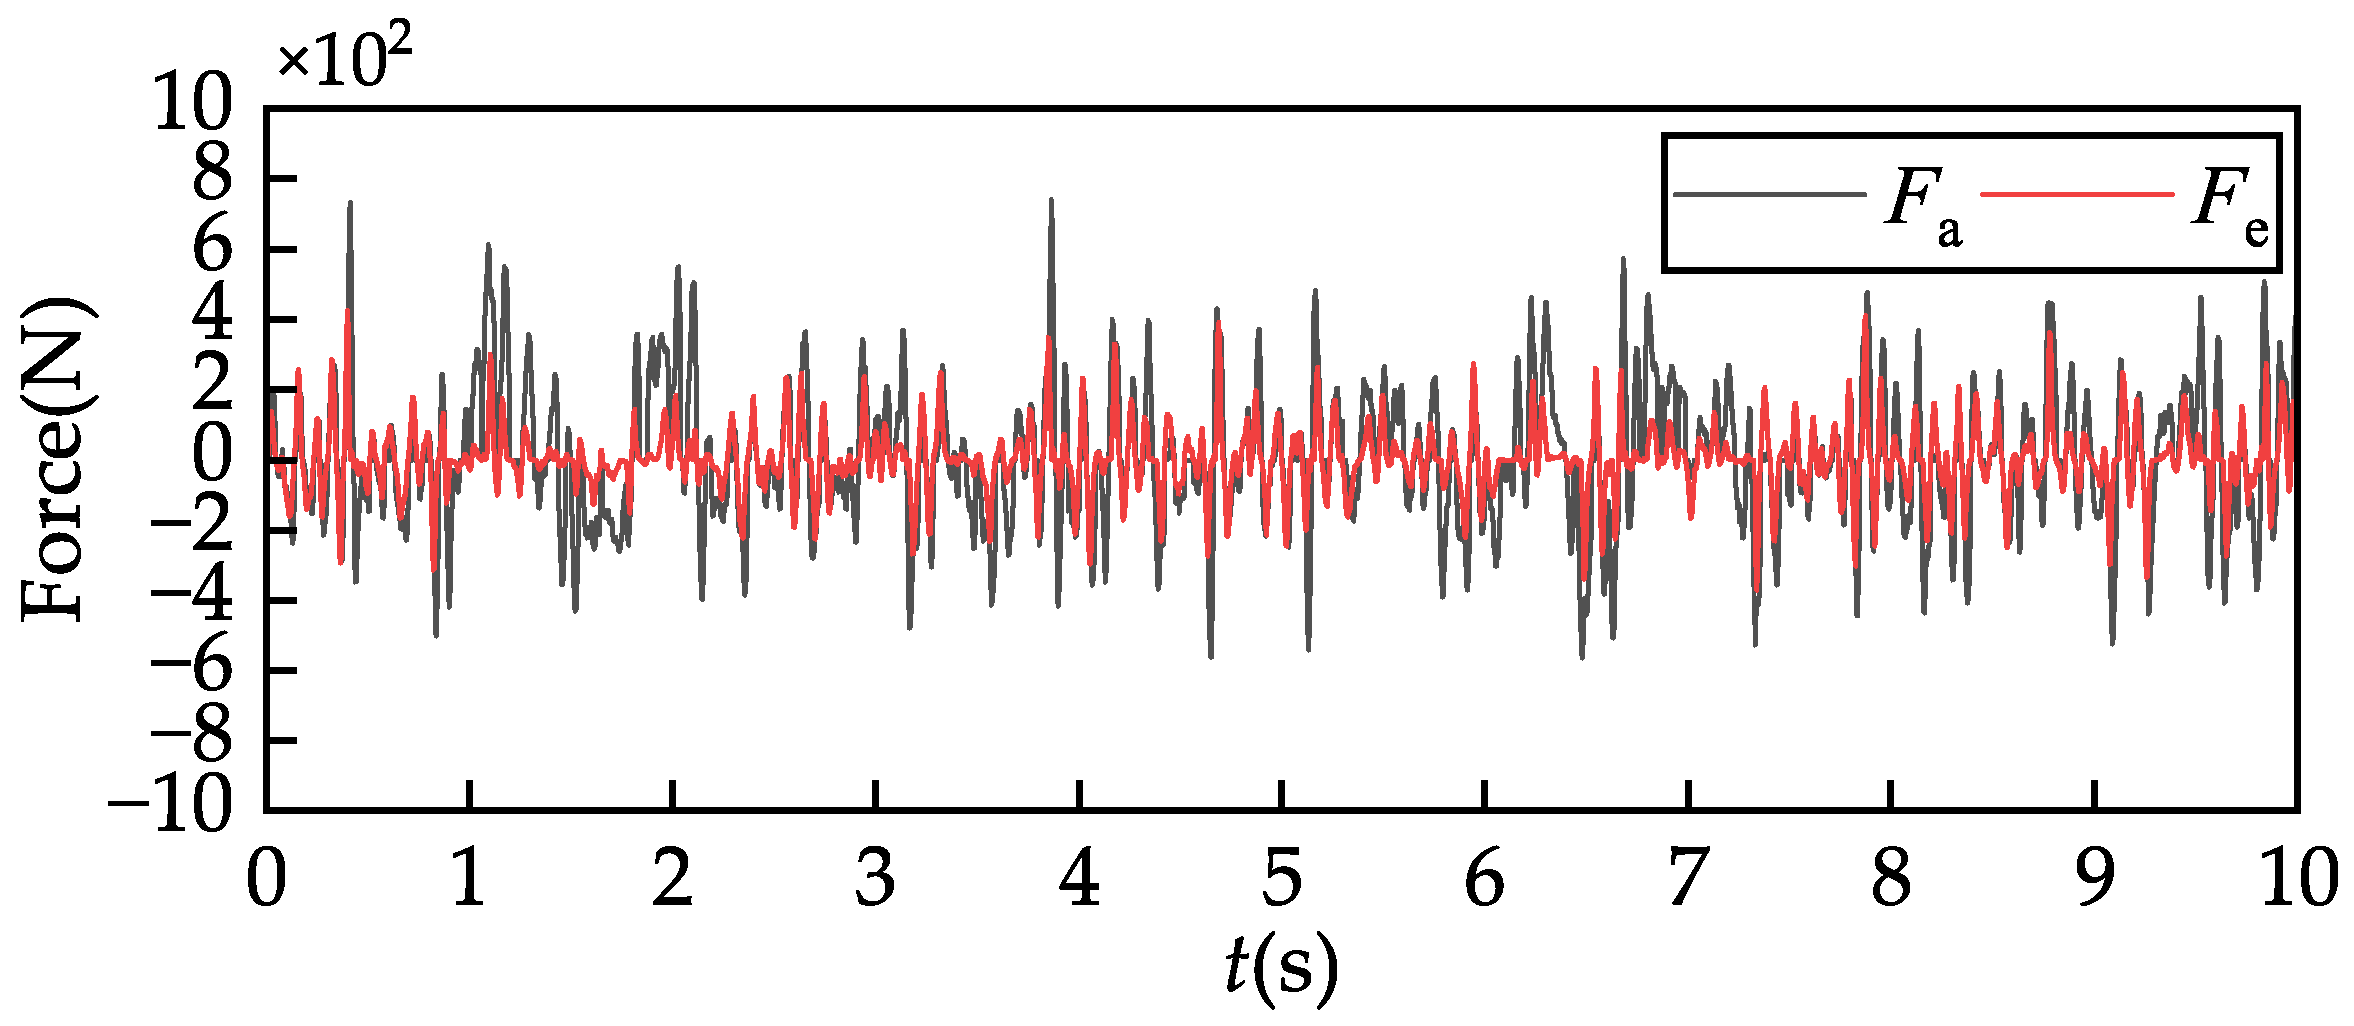
Figure 24 shows the adjustable damping force and electromagnetic damping force output by the ELEMRD under Class C road at a vehicle speed of 20 m/s. From the figure, it can be observed that the directions of both forces remain aligned in the time domain, as both forces are always opposite to the relative motion direction between the sprung and unsprung masses. The RMS values of the adjustable damping force and electromagnetic damping force are 189.4 N and 93.6 N, respectively. The presence of the electromagnetic damping force allows the linear generator to function as an additional damper for vibration suppression. The damping coefficient of this damper can be altered by adjusting the external resistance.
To achieve maximum power transfer, the analysis assumes that the external load resistance R a is matched with the coil resistance R 0 of the linear generator. In practical applications, R a can serve as a tunable element to adjust the damping characteristics. Figure 25 illustrates the influence of different R a values on the suspension vibration characteristics. As shown in Figure 25a, reducing R a significantly decreases the adjustable damping force F a generated by the ELEMRD, which helps to reduce both the energy consumption and heat generation of the MRD. As shown in Figure 25b, the variation in R a has a relatively small effect on the suspension’s vibration characteristics. Therefore, to ensure maximum power transfer, R a should be matched as closely as possible to R 0 .

6. Conclusions

In this study, a semi-active suspension system with an ELEMRD is proposed. This suspension not only achieves semi-active vibration control but also recovers vibration energy from the suspension system, thereby improving the overall energy efficiency of the vehicle. The main conclusions of this study are as follows:
(1) A new ELEMRD was designed by integrating a magnetorheological damper with a linear generator. A neural network-based surrogate model was employed to optimize the generator parameters, increasing no-load regenerative power by 14.2% and reducing cogging force by 49.7%.
(2) A prototype was fabricated and tested. Under an excitation current at 1.5 A, the MRD achieved a peak output force of 1415 N. At a 5 Hz excitation frequency, the no-load regenerative power reached 11.1 W and 37.3 W for vibration amplitudes of 5 mm and 10 mm, respectively.
(3) A semi-active suspension model incorporating the ELEMRD was developed and controlled using both LQR and PID control strategies. Compared to the passive suspension, both the LQR and PID controllers improve performance. The PID controller reduces sprung mass acceleration by 29.9% and suspension working space by 2.8%, but increases dynamic tire load by 41.0%, negatively impacting handling. LQR reduces acceleration by 14.2% and suspension working space by 7.5%, while increasing tire load by only 11.2%, achieving a better balance. Under Class C road conditions at 20 m/s, the PID controller achieves a peak regenerative power of 633.2 W and an RMS value of 80.2 W, significantly higher than LQR’s peak of 404.2 W and RMS of 49.8 W. However, this increase in regenerative power with PID control comes at the cost of degraded high-frequency tire–road contact performance, indicating a trade-off between energy regeneration and vehicle handling stability. Overall, the LQR controller provides a better balance between regenerative efficiency and ride comfort and stability.
This study preliminarily designed and validated an ELEMRD integrating magnetorheological damping and energy regeneration, combining structural optimization and system simulation to provide valuable insights for further research on energy-regenerative semi-active suspensions. The work focuses on the mechanical integration of the magnetorheological damper and linear generator, as well as the vibration control and energy recovery capabilities of a suspension system equipped with the ELEMRD. In the next stage, research will focus on energy harvesting and power management circuits to realize a closed-loop energy system, which will be further investigated through suspension bench testing.
Author Contributions

Conceptualization, J.L. and W.W.; methodology, W.W.; software, W.W.; validation, W.W., H.W., and X.X.; formal analysis, W.W. and H.W.; investigation, W.W. and C.T.; resources, J.L. and C.T.; data curation, W.W.; writing—original draft preparation, W.W.; writing—review and editing, J.L. and C.T.; visualization, W.W., H.W., and X.X.; supervision, J.L.; project administration, J.L.; funding acquisition, J.L. All authors have read and agreed to the published version of the manuscript.

Funding

This research was funded by Shandong Association for Science & Technology (Grant No.: SDAST2024QTA061), the National Natural Science Foundation of China (Grant No.: 52305265), and the Postdoctoral Science Foundation of China (Grant No.: 2023M732113).

Data Availability Statement

The original contributions presented in the study are included in the article; further inquiries can be directed to the corresponding author.

Conflicts of Interest

The authors declare no conflicts of interest.

References

  1. Ahmad, M.; Bhatti, A.H.; Ashraf, M.M. Energy recovery using regenerative suspension system. In Proceedings of the 2024 7th International Conference on Energy Conservation and Efficiency (ICECE), Lahore, Pakistan, 6–7 March 2024; pp. 1–6. [Google Scholar]
  2. Zhang, B.; Shi, P.; Mou, X.; Li, H.; Zhao, Y.; Zheng, L. Energy management strategy for P1 + P3 plug-in hybrid electric vehicles. World Electr. Veh. J. 2023, 14, 332. [Google Scholar] [CrossRef]
  3. Wu, T.; Wang, F.; Ye, P. Regenerative braking strategy of dual-motor EV considering energy recovery and brake stability. World Electr. Veh. J. 2023, 14, 19. [Google Scholar] [CrossRef]
  4. Fu, C.; Lu, J.; Ge, W.; Tan, C.; Li, B. A review of electromagnetic energy regenerative suspension system & key technologies. Comput. Model. Eng. Sci. 2023, 135, 1779–1824. [Google Scholar] [CrossRef]
  5. Gijón-Rivera, C.; Olazagoitia, J.L.; Reyes-Avendaño, J.A. Design and development of a novel Four-Links rotational hybrid Energy-Harvesting suspension system compatible with conventional suspension technologies. Energy Convers. Manage. X 2024, 22, 100572. [Google Scholar] [CrossRef]
  6. Zhang, W.; Wang, G.; Guo, Y. Research on damping and energy recovery characteristics of a novel mechanical-electrical-hydraulic regenerative suspension system. Energy 2023, 271, 127022. [Google Scholar] [CrossRef]
  7. Zhang, Y.; Guo, K.; Wang, D.; Chen, C.; Li, X. Energy conversion mechanism and regenerative potential of vehicle suspensions. Energy 2017, 119, 961–970. [Google Scholar] [CrossRef]
  8. Koulocheris, D.; Papaioannou, G.; Chrysos, E. A comparison of optimal semi-active suspension systems regarding vehicle ride comfort. In Proceedings of the CAR2017 International Congress of Automotive and Transport Engineering- Mobility Engineering and Environment, Pitesti, Romania, 8–10 November 2017. [Google Scholar]
  9. Karkoub, M.A.; Zribi, M. Active/semi-active suspension control using magnetorheological actuators. Int. J. Syst. Sci. 2006, 37, 35–44. [Google Scholar] [CrossRef]
  10. Hu, T.; Jiang, L.; Pan, L.; Chen, B.; Gong, N.; Yang, J.; Gong, X.; Sun, S. Development of a semi-active suspension using a compact magnetorheological damper with negative-stiffness components. Mech. Syst. Signal Process 2025, 223, 111842. [Google Scholar] [CrossRef]
  11. Lam, A.H.F.; Liao, W.H. Semi-active control of automotive suspension systems with magneto-rheological dampers. Int. J. Veh. Des. 2003, 33, 50–75. [Google Scholar] [CrossRef]
  12. Kim, S.; Choi, S.B.; Cheong, C.C. ER suspension system with energy generation. J. Intell. Mater. Syst. Struct. 1999, 10, 738–742. [Google Scholar] [CrossRef]
  13. Gao, H.; Xu, J.; Pu, X.; Li, S.; Mei, X. An online control method for energy recovery of suspension vibration of new energy vehicles. J. Xi’an Jiaotong Univ. 2020, 54, 19–26. [Google Scholar]
  14. Sapiński, B.; Orkisz, P. Real-time sensing action of the electromagnetic vibration-based energy harvester for a magnetorheological damper control. Energies 2021, 14, 2845. [Google Scholar] [CrossRef]
  15. Guan, X.; Huang, Y.; Ru, Y.; Li, H.; Ou, J. A novel self-powered MR damper: Theoretical and experimental analysis. Smart Mater. Struct. 2015, 24, 105033. [Google Scholar] [CrossRef]
  16. Dong, X. Design and characterization of axial flux permanent magnet energy harvester for vehicle magnetorheological damper. Smart Mater. Struct. 2016, 25, 015024. [Google Scholar] [CrossRef]
  17. Li, L.; Hu, G.; Yu, L.; Qi, H. Development and performance analysis of a new self-powered magnetorheological damper with energy-harvesting capability. Energies 2021, 14, 6166. [Google Scholar] [CrossRef]
  18. Li, B.; Ge, W.; Li, Q.; Li, Y.; Tan, C. Gearshift Sensorless Control for Direct-Drive-Type AMT Based on Improved GA-BP Neural Network Algorithm. Math. Probl. Eng. 2020, 1, 1–13. [Google Scholar] [CrossRef]
  19. Lu, J.; Gu, C.; Zhao, Y.; Tan, C.; Lu, Y.; Fu, C. Refined modeling method and analysis of an electromagnetic direct-drive hydrostatic actuation system. Actuators 2022, 10, 281. [Google Scholar] [CrossRef]
  20. Gupta, A.; Jendrzejczyk, J.A.; Mulcahy T., M.; Hull, J.R. Design of electromagnetic shock absorbers. Int. J. Mech. Mater. Des. 2006, 3, 285–291. [Google Scholar] [CrossRef]
  21. Hu, G.; Yi, F.; Liu, H.; Zeng, L. Performance analysis of a novel magnetorheological damper with displacement self-sensing and energy harvesting capability. J. Vib. Eng. Technol. 2021, 9, 85–103. [Google Scholar] [CrossRef]
  22. Chen, C.; Liao, W.H. A self-sensing magnetorheological damper with power generation. Smart Mater. Struct. 2012, 21, 025014. [Google Scholar] [CrossRef]
  23. Wang, K.; Liu, W. Design of self-powered MR damper integrated with permanent magnet linear generator. Automob. Technol. 2016, 21–23. [Google Scholar]
  24. Jian, L.; Wang, X.; Chen, T.; Wang, E.; Zhang, H. Design and study of a novel magneto-rheological regenerative suspension system. In Proceedings of the 2017 International Conference on Advanced Mechatronic Systems (ICAMechS), Xiamen, China, 6–9 December 2017; pp. 220–223. [Google Scholar]
  25. Zhang, X.; He, L.; Wang, Z.; Qin, Z.; Niu, J.; Gao, X. Interval sensitivity analysis and optimization of magneto-rheological damper with energy harvesting characteristics. J. Vib. Eng. Technol. 2024, 12, 1707–1720. [Google Scholar] [CrossRef]
  26. Gao, X.; Jiang, Q.; Zhang, G.; Niu, J.; Dong, R.; He, L. Adaptive optimal fault-tolerant vibration control and sensitivity analysis of semi-active suspension based on a self-powered magneto-rheological damper. Smart Mater. Struct. 2024, 33, 035030. [Google Scholar] [CrossRef]
  27. Zhu, X.; Ning, D.; Hao, Z.; Huang, H.; Sun, Y.Z.; Jia, H.; Sun, S.; Yan, T.; Li, W. Modelling and experimental evaluation of a variable stiffness MR suspension with self-powering capability. J. Intell. Mater. Syst. Struct. 2021, 32, 1473–1483. [Google Scholar] [CrossRef]
  28. Zhu, X.; Deng, L.; Sun, S.; Yan, T.; Yu, J.; Ma, Z.; Li, W. Development of a variable stiffness magnetorheological damper with self-powered generation capability. J. Intell. Mater. Syst. Struct. 2019, 31, 209–219. [Google Scholar] [CrossRef]
  29. Zou, D.; Jiao, X.; Zhou, Y.; Yang, C. Design and multi-objective optimization of an electric inflatable pontoon amphibious vehicle. World Electr. Veh. J. 2025, 16, 58. [Google Scholar] [CrossRef]
  30. Pholdee, N.; Bureerat, S. An efficient optimum Latin hypercube sampling technique based on sequencing optimisation using simulated annealing. Int. J. Syst. Sci. 2021, 46, 1780–1789. [Google Scholar] [CrossRef]
  31. He, Q.; Li, X.; Mao, W.; Yang, X.; Wu, H. Research on vehicle frame optimization methods based on the combination of size optimization and topology optimization. World Electr. Veh. J. 2024, 15, 107. [Google Scholar] [CrossRef]
  32. QC/T 491-2018; Automobile shock absorber technique requirements and test methods. Ministry of Industry and Information Technology of the People’s Republic of China (MIIT): Beijing, China, 2018.
  33. Rossi, A.; Orsini, F.; Scorza, A.; Botta, F.; Belfiore, N.P.; Sciuto, S.A. A review on parametric dynamic models of magnetorheological dampers and their characterization methods. Actuators 2018, 7, 16. [Google Scholar] [CrossRef]
  34. ISO 8608-1995(E); Mechanical Vibration-Road Surface Profiles-Reporting of Measured Data. International Organization for Standardization: Geneva, Switzerland, 1995.
  35. Li, S.; Xu, J.; Gao, H.; Tao, T.; Mei, X. Safety probability based multi-objective optimization of energy-harvesting suspension system. Energy 2020, 209, 118362. [Google Scholar] [CrossRef]
  36. Yin, J.; Chen, X.; Wu, L.; Liu, Y. Simulation method of road excitation in time domain using filtered white noise and dynamic analysis of suspension. J. Tongji Univ. (Natural Sci.) 2017, 45, 398–407. [Google Scholar]
  37. Tang, L.; Ren, N.L.; Funkhouser, S. Semi-active suspension control with PSO tuned LQR controller based on MR damper. Int. J. Automot. Mech. Eng. 2023, 20, 10512–10522. [Google Scholar] [CrossRef]
  38. Yu, W.; Li, J.; Yuan, J.; Ji, X. LQR controller design of active suspension based on genetic algorithm. In Proceedings of the 2021 IEEE 5th Information Technology, Networking, Electronic and Automation Control Conference (ITNEC), Xi’an, China, 15–17 October 2021; pp. 1056–1060. [Google Scholar]
  39. Han, K.; Hu, Y.; Zeng, D.; Yu, Y.; Xiao, L.; Yang, J.; Liu, W.; Gao, L. Vehicle attitude control of magnetorheological semi-active suspension based on multi-objective intelligent optimization algorithm. Actuators 2024, 13, 466. [Google Scholar] [CrossRef]
  40. Meng, X.; Wang, R.; Ding, R.; Chen, L. Optimal design and experimental research on a new hybrid electromagnetic actuator for vehicles. IEEE Access 2019, 8, 95768–95778. [Google Scholar] [CrossRef]
Figure 1. Structural diagram of ELEMRD.
Wevj 16 00455 g001
Figure 2. Power supply process from the linear generator to the MRD.
Wevj 16 00455 g002
Figure 3. Linear generator optimization flowchart.
Wevj 16 00455 g003
Figure 4. Schematic diagram of the linear generator’s structural dimensions.
Wevj 16 00455 g004
Figure 5. The structure of the neural network.
Wevj 16 00455 g005
Figure 6. Comparison between actual and predicted values in the test set. (a) No-load regenerative power. (b) Peak cogging force.
Wevj 16 00455 g006
Figure 7. Pareto front of linear generator optimization.
Wevj 16 00455 g007
Figure 8. Comparison of the linear generator before and after optimization. (a) No-load regenerative power. (b) Cogging force.
Wevj 16 00455 g008
Figure 9. Prototype of ELEMRD.
Wevj 16 00455 g009
Figure 10. Bench test of ELEMRD.
Wevj 16 00455 g010
Figure 11. Force–displacement curves under different excitation currents.
Wevj 16 00455 g011
Figure 12. Maximum output force under different excitation currents.
Wevj 16 00455 g012
Figure 13. Instantaneous voltage waveforms under 5 mm and 10 mm amplitudes.
Wevj 16 00455 g013
Figure 14. Back electromotive force coefficient of the linear generator.
Wevj 16 00455 g014
Figure 15. Two-degree-of-freedom 1/4 energy-regenerative magnetorheological semi-active suspension system model.
Wevj 16 00455 g015
Figure 16. Time-domain simulation result of the road.
Wevj 16 00455 g016
Figure 17. LQR control structure diagram of the suspension.
Wevj 16 00455 g017
Figure 18. LQR weighting coefficients optimization flowchart.
Wevj 16 00455 g018
Figure 19. Pareto front of LQR controller weighting coefficient optimization.
Wevj 16 00455 g019
Figure 20. Pareto front of LQR controller weighting coefficient optimization.
Wevj 16 00455 g020
Figure 21. Comparison of time-domain simulation results between energy-regenerative magnetorheological semi-active and passive suspensions. (a) Sprung mass acceleration. (b) Dynamic tire load. (c) Suspension working space.
Wevj 16 00455 g021
Figure 22. Frequency-domain comparison of suspension performance metrics between passive and energy-regenerative magnetorheological semi-active suspensions. (a) Power spectral density of sprung mass acceleration. (b) Power spectral density of dynamic tire load. (c) Power spectral density of suspension working space.
Wevj 16 00455 g022
Figure 23. Regenerative power of the energy-regenerative magnetorheological semi-active suspension system.
Wevj 16 00455 g023
Figure 24. Adjustable damping force ( F a ) and electromagnetic damping force ( F e ) of ELEMRD.
Wevj 16 00455 g024
Figure 25. Effect of R a on suspension vibration performance. (a) The RMS values of adjustable damping force and electromagnetic damping force. (b) The RMS values of sprung mass acceleration and dynamic tire load.
Wevj 16 00455 g025
Table 1. Dimensional parameters of the linear generator.
ParameterValue (mm)
Mover length l m 148
Permanent magnet support structure radius r10
Permanent magnet pole pitch τ p 37
Permanent magnet thickness h m 7.5
Length of the axially magnetized permanent magnet τ mz 23
Length of the radially magnetized permanent magnet τ mr 14
Air gap width g1.5
Slot width τ t 20.7
Slot depth t10.5
Slot pitch τ s 33.3
Stator length l s 233.1
Table 2. Optimization parameters and their ranges.
ParameterRangeUnit
h m [5, 9]mm
τ mz [13, 25]mm
τ mr [13, 25]mm
Table 3. Fitting metrics of the neural network surrogate model.
Optimization Objective R 2 RMSE
P no load 0.9990.174
F c 0.9990.310
Table 4. Optimized extreme solution.
Type P no load ( W ) F c ( N ) h m ( mm ) τ mr ( mm ) τ mz ( mm )
P 1 116.245.89.014.620.2
P 2 24.98.75.025.015.9
Table 5. Optimized extreme solution.
Type P no load ( W ) F c ( N ) h m ( mm ) τ mr ( mm ) τ mz ( mm )
Inital84.637.17.51423
Optimized96.618.69.022.213
Table 6. Road roughness coefficients for different road level.
Road levelABCDEFGH
G q n 0 ( 10 6 m 3 ) 16642561024409616,38465,536262,144
Table 7. Suspension simulation parameters for the 1/4 vehicle model.
ParameterValueUnit
m s 360kg
m t 40kg
K s 19,000N/m
K t 200,000N/m
C 0 156N·s/m
R 0 11.5 Ω
R a 11.5 Ω
Table 8. Comparison of RMS values of suspension performance metrics.
Type σ SMA ( m / s 2 ) σ DTL ( N ) σ SWS ( m ) ψ
Passive suspension1.1778770.60.0107-
LQR1.0101857.00.00990.0523
PID0.82601087.20.01040.0503
Disclaimer/Publisher’s Note: The statements, opinions and data contained in all publications are solely those of the individual author(s) and contributor(s) and not of MDPI and/or the editor(s). MDPI and/or the editor(s) disclaim responsibility for any injury to people or property resulting from any ideas, methods, instructions or products referred to in the content.