Article

Forecasting Infrastructure Needs, Environmental Impacts, and Dynamic Pricing for Electric Vehicle Charging

1
Department of Engineering and Design, University of Sussex, Brighton BN1 9RH, UK
2
Department of Computer Science, City St. George’s, University of London, London EC1V 0HB, UK
3
School of Computing and Engineering, University of West London, London W5 5RF, UK
*
Authors to whom correspondence should be addressed.
World Electr. Veh. J. 2025, 16(8), 410; https://doi.org/10.3390/wevj16080410
Submission received: 20 May 2025 / Revised: 8 July 2025 / Accepted: 11 July 2025 / Published: 22 July 2025

Abstract

In recent years, carbon dioxide (CO2) emissions have increased at the fastest rates ever recorded. This is a trend that contradicts global efforts to stabilise greenhouse gas (GHG) concentrations and prevent long-term climate change. Over 90% of global transport relies on oil-based fuels. The continued use of diesel and petrol raises concerns related to oil costs, supply security, GHG emissions, and the release of air pollutants and volatile organic compounds. This study explored electric vehicle (EV) charging networks by assessing environmental impacts through GHG and petroleum savings, developing dynamic pricing strategies, and forecasting infrastructure needs. A substantial dataset of over 259,000 EV charging records from Palo Alto, California, was statistically analysed. Machine learning models were applied to generate insights that support sustainable and economically viable electric transport planning for policymakers, urban planners, and other stakeholders. Findings indicate that GHG and gasoline savings are directly proportional to energy consumed, with conversion rates of 0.42 kg CO2 and 0.125 gallons per kilowatt-hour (kWh), respectively. Additionally, dynamic pricing strategies such as a 20% discount on underutilised days and a 15% surcharge during peak hours are proposed to optimise charging behaviour and improve station efficiency.

1. Introduction

The transportation sector is a major contributor to greenhouse gas (GHG) emissions, primarily due to its reliance on fossil fuels like diesel and petrol [1,2]. As global awareness of climate change grows, electric vehicles (EVs) have emerged as a promising alternative, offering reduced emissions, lower costs, and improved public health [3,4,5]. However, the widespread adoption of EVs hinges on the development and efficiency of charging infrastructure [6].
The origins of EVs trace back to the early 19th century, with Ányos Jedlik building a small-scale electric car in 1827, and subsequent developments by inventors like Robert Anderson and Thomas Davenport in the 1830s [7,8]. However, it was not until the late 20th century that EVs began to gain traction, marking the need for reliable charging infrastructure. Early charging stations, often located in parking garages, were slow and unreliable but set the stage for future development [9,10]. In 2006, the transportation sector accounted for 27.5% of global energy use and contributed 23% of energy-related CO2 emissions, with road transport making up the majority of both consumption and emissions. By 2010, over 1 billion vehicles were on the road, largely fueled by oil, and this number is expected to grow significantly by 2050 [11].
The shift to sustainable transportation is essential for mitigating climate change, and EVs are a key player in this transition [12]. For example, California has set a target for zero-emission vehicles by 2035, and Palo Alto already has 30% EVs, the highest rate in the U.S. [13]. As EV adoption rises, well-planned and accessible charging networks are crucial to supporting this transition. Poorly located charging stations could impede EV growth, making it harder for users to charge their vehicles [14]. Effective charging management, including dynamic pricing, can help balance supply and demand, improve user experience, and reduce charging congestion [15].
While the rapid growth of EV adoption calls for the optimisation of existing infrastructure, future expansion will be needed to meet growing demand. With EV ownership expected to triple by 2050, dynamic pricing models will play a crucial role in optimising charging networks by spreading demand more evenly, reducing waiting times, and ensuring affordability and profitability. However, significant infrastructure expansion may be necessary to support a transition to sustainable electric transport, addressing challenges like infrastructure requirements, environmental impacts, and flexible pricing strategies.
Recent literature increasingly highlights that the accessibility of EV charging infrastructure, the grid-balancing potential of dynamic pricing, and uncertainty around operational costs are not isolated considerations but interdependent barriers that jointly shape adoption outcomes and user equity. For example, Andrenacci and Valentini (2023) show that price unpredictability, particularly in real-time pricing regimes, can negatively impact user trust and reduce willingness to switch to EVs, especially among lower-income and cost-sensitive drivers. Similarly, Faisal et al. (2024) and Jin and Slowik (2017) argue that lack of cost transparency in charging networks can exacerbate perceptions of economic risk, undermining both behavioural responsiveness and social equity in infrastructure rollouts [16,17]. These findings align with Limmer’s assessment that the success of dynamic pricing strategies hinges on users’ ability to anticipate costs and their willingness to engage in flexible scheduling. As such, dynamic pricing must be carefully designed with predictability and transparency to avoid deterring adoption or entrenching usage disparities, particularly in markets with high price sensitivity or inconsistent infrastructure access [18].
This paper aims to contribute to the field of sustainable urban mobility by providing data-driven insights into EV charging infrastructure development, assessing environmental impacts, and exploring dynamic pricing models. The key contributions include:
  • Policy Recommendations: Offering evidence-based advice to policymakers on infrastructure development and pricing strategies.
  • Urban Planning: Assisting urban planners in designing efficient, accessible EV charging networks that support rapid adoption.
  • Economic Viability: Proposing strategies for economically sustainable EV charging infrastructure, ensuring affordability for users while maintaining profitability.
  • Environmental Impact: Highlighting the potential environmental benefits of widespread EV adoption and the optimisation of charging networks.
By addressing these areas, this paper will offer actionable solutions to overcome current infrastructure challenges and facilitate the transition to sustainable electric transportation.
It is important to emphasise that this study is framed as a case study of Palo Alto, California, a city with distinct characteristics including high EV adoption rates, favourable weather, and progressive municipal energy policies. As such, the findings, particularly those related to dynamic pricing, holiday and peak-time behaviours, may not be directly generalisable to other cities with differing climatic, demographic, or regulatory profiles. Nonetheless, this context-specific insight offers a valuable reference point for urban environments with similar infrastructure aspirations or policy goals.
The rest of the paper is organised as follows: Section 2 discusses related works, methodology is explained in Section 3, Section 4 presents results, and the conclusion is found in Section 5.

2. Related Works

2.1. History of EVs and Charging Infrastructure

The history of EVs and their charging infrastructure dates back to the late 19th century. Early EVs relied on basic outlets and slow, inefficient charging methods, which limited widespread adoption. Renewed interest in the late 20th century, driven by battery advancements and growing environmental awareness, led to the development of more advanced infrastructure. Fast-charging stations, home charging solutions, and standardised protocols such as CCS and CHAdeMO have been essential in reducing range anxiety and supporting broader EV adoption [19,20].

2.2. CO2 Emissions and Environmental Impact

The transportation sector is a major source of CO2 emissions due to fossil fuel use. Shifting to EVs is a key strategy for reducing GHG emissions and combating climate change. EVs produce significantly lower emissions than internal combustion engine vehicles, especially when powered by renewable energy. In the U.S., transportation CO2 emissions dropped by 6% from 2005 to 2021 with increased EV adoption. While battery production adds to life cycle emissions, EVs still have a lower overall environmental impact than conventional vehicles [21,22].

2.3. Pricing and Economic Impact of EV Market Expansion

The rapid growth of the EV market has significant economic implications. In the U.S., plug-in EVs made up 10% of all light-duty vehicle sales in Q3 2023, with over one million sold that year [23]. This trend is driven by rising fuel prices, greater environmental awareness, and more affordable EV models. Supporting this demand, both public and private sectors are investing in charging infrastructure, including public stations and home solutions [17,24].
Beyond the auto industry, EV adoption boosts sectors like battery manufacturing and renewable energy. Integrating renewable energy sources, such as solar power, with EV charging enhances sustainability by reducing grid reliance and emissions [16]. Dynamic pricing strategies, adjusting rates by demand and time, can improve profitability and accessibility. Research identifies three EV charging behaviours: charging based on cost and need, opportunistic charging, and charging influenced by factors like power, dwell time, and home charging costs [24].

2.4. Technological Advancements and Design Considerations

The efficiency and user convenience of EV charging stations depend on effective design and optimisation. Recent studies highlight the benefits of integrating renewable energy and storage systems to lower costs and improve sustainability. Smart grids and vehicle-to-grid (V2G) systems support bidirectional energy flow, helping stabilize the grid during peak demand [25,26]. Innovations such as wireless and ultra-fast charging are also enhancing accessibility and performance [27].

2.5. Shortcomings in EV Charging Pricing and Infrastructure

Previous research on EV charging has largely centred on dynamic pricing and integration with clean energy to reduce costs and environmental impacts. Hernández Cedillo et al. (2022) [28] examined dynamic pricing models such as time-of-use and real-time pricing, demonstrating their effectiveness in shifting demand to off-peak periods and aligning charging with renewable generation. Zhao and Lee (2022) [15] applied deep reinforcement learning to optimise pricing strategies but focused mainly on theoretical models, overlooking real-world limitations.
However, these studies often neglect the infrastructure implications if pricing strategies fail as well as the possibility that pricing models may fall short in effectively shaping consumer behaviour. For instance, user responsiveness to price variation may differ by income, vehicle range, or access to alternative stations. Without behavioural validation, dynamic pricing strategies risk overestimating their influence on user decision-making. This research fills that gap by addressing not only environmental and economic factors but also the infrastructure adaptations needed to ensure a resilient EV charging network. It offers a more holistic perspective, providing actionable insights for policymakers, utilities, and urban planners to support sustainable EV adoption, even when dynamic pricing alone may prove insufficient.

3. Methodology

3.1. Dataset Description

The dataset [29] used in this research is licensed under “U.S. Government Works”. It includes over 259,000 records from 47 charging stations across California from 29 July 2011, to 31 December 2020, containing:
  • Identification: Station names, media access control (MAC) addresses, and organizational info.
  • Temporal Data: Session start/end times, durations, transaction dates.
  • Energy Usage: Energy consumed in kWh.
  • Environmental Impact: GHG savings (kg), gasoline savings (gallons).
  • Station Details: Port/plug types, electric vehicle supply equipment (EVSE) ID, system serial number (S/N), model number.
  • Geography: Full address, city, state, ZIP, latitude, longitude.
  • Financial Info: Currency and fee details.
  • Driver Info: User ID, postal code.
Ethical Considerations and Limitations: The dataset excludes personally identifiable information, adhering to ethical guidelines and license terms. Limitations include possible data bias, variable omissions, and inconsistency due to evolving online sources. Additionally, the dataset’s regional focus on Palo Alto necessitates caution when extrapolating behavioural or economic insights to broader or dissimilar contexts.

3.2. Data Preparation

Data was prepared using: Pandas version 2.1.4 [30], Scikit-learn version 1.3.2 [31], Matplotlib version: 3.7.1 [32], and NumPy version 1.26.4 [33].
Four columns were removed due to redundancy and missing data: EVSE ID, county, system S/N, and model number (each had over 78,000 missing values).
The data indicated that users began paying for charging services on 1 August 2017  [34], whereas previously charging was free; only data from this point onward was used in pricing-related analysis.

3.3. Feature Engineering

Feature Creation:
  • Charging Time (seconds): Duration in seconds during which the vehicle was actively drawing electricity. It reflects energy usage efficiency and informs environmental impact estimates.
  • Total Duration (seconds): Total plugged-in time, from connection to disconnection, including idle time. Essential for modelling usage behaviour and station occupancy.
  • Holiday: Indicates whether the session occurred on a U.S. federal holiday. This feature accounts for potential variations in demand due to public holidays. The federal holidays were identified according to the U.S. government’s official list [35].
  • Weekday/Weekend, Day of Week: Classifies each session as occurring on a weekday or weekend and records the specific weekday name. Useful for capturing routine behaviour patterns.
  • Price per kWh: Calculated by dividing the total session fee by the amount of energy consumed (in kilowatt-hours). This derived feature is essential for understanding the relationship between cost and user behaviour. It enables analysis of how drivers respond to varying prices, supporting the development of dynamic pricing strategies that adjust rates based on time, demand, or other conditions [36,37]. Such pricing models help operators optimise revenue, manage station congestion, and influence charging habits (e.g., encouraging off-peak usage).
  • YearMonth: Combines year and month to capture seasonal or monthly trends and support long-term demand forecasting.
Feature Selection:
Table 1 lists the features used in each model along with their roles in the analysis:
Model Targets:
  • GHG/Gasoline Savings Model: GHG Savings (kg), Gasoline Savings (gallons)
  • Dynamic Pricing Model: Energy (kWh)
  • Demand Forecasting Model: Energy (kWh)
The forecasting model is integrated with the pricing model’s features as a fallback strategy.

3.4. Missing Values and Outliers

  • GHG Model: Interquartile range (IQR)-based outlier removal was applied to GHG and gasoline savings values. This ensured that extreme or anomalous values did not distort the environmental impact analysis.
  • Pricing Model: Data from before 1 August 2017 was excluded, as charging was free prior to this date. Outliers in price per kWh were also removed to maintain a realistic representation of market-based pricing behaviour.
  • Forecasting Model: Outliers in energy consumption were eliminated to improve the accuracy of long-term demand predictions. This step was crucial for preserving the integrity of seasonality and trend modelling.
  • Remaining NaNs: After cleaning and dropping irrelevant columns, any rows containing missing (NaN) values were removed. This ensured a complete dataset and reduced the risk of introducing bias or computational errors in the models.
The number of rows removed through IQR-based outlier filtering was relatively small across all models. In each case, fewer than 9000 rows were excluded, preserving the integrity of the dataset while reducing noise from extreme values. While some valid high-load sessions may have been removed, this trade-off was accepted to enhance the stability and reliability of the models.

3.5. Feature Scaling

Applied StandardScaler [38] from sklearn.preprocessing in GHG and Pricing models:
z = x μ σ
where μ is the mean and σ is the standard deviation. Default settings (with_mean=True, with_std=True) were used.
StandardScaler was not applied to the seasonal autoregressive integrated moving average with exogenous regressors (SARIMAX)-based forecasting model because, unlike neural network-based models, it operates on time series values directly and does not involve gradient-based optimisation where feature scaling would influence learning stability or convergence speed. SARIMAX models rely on statistical relationships (such as autoregressive and moving average components) and internal differencing of the data, which makes them inherently less sensitive to the magnitude of input features. Therefore, applying StandardScaler is not only unnecessary but could also distort the interpretability of the model parameters, especially when forecasting in units like kWh.

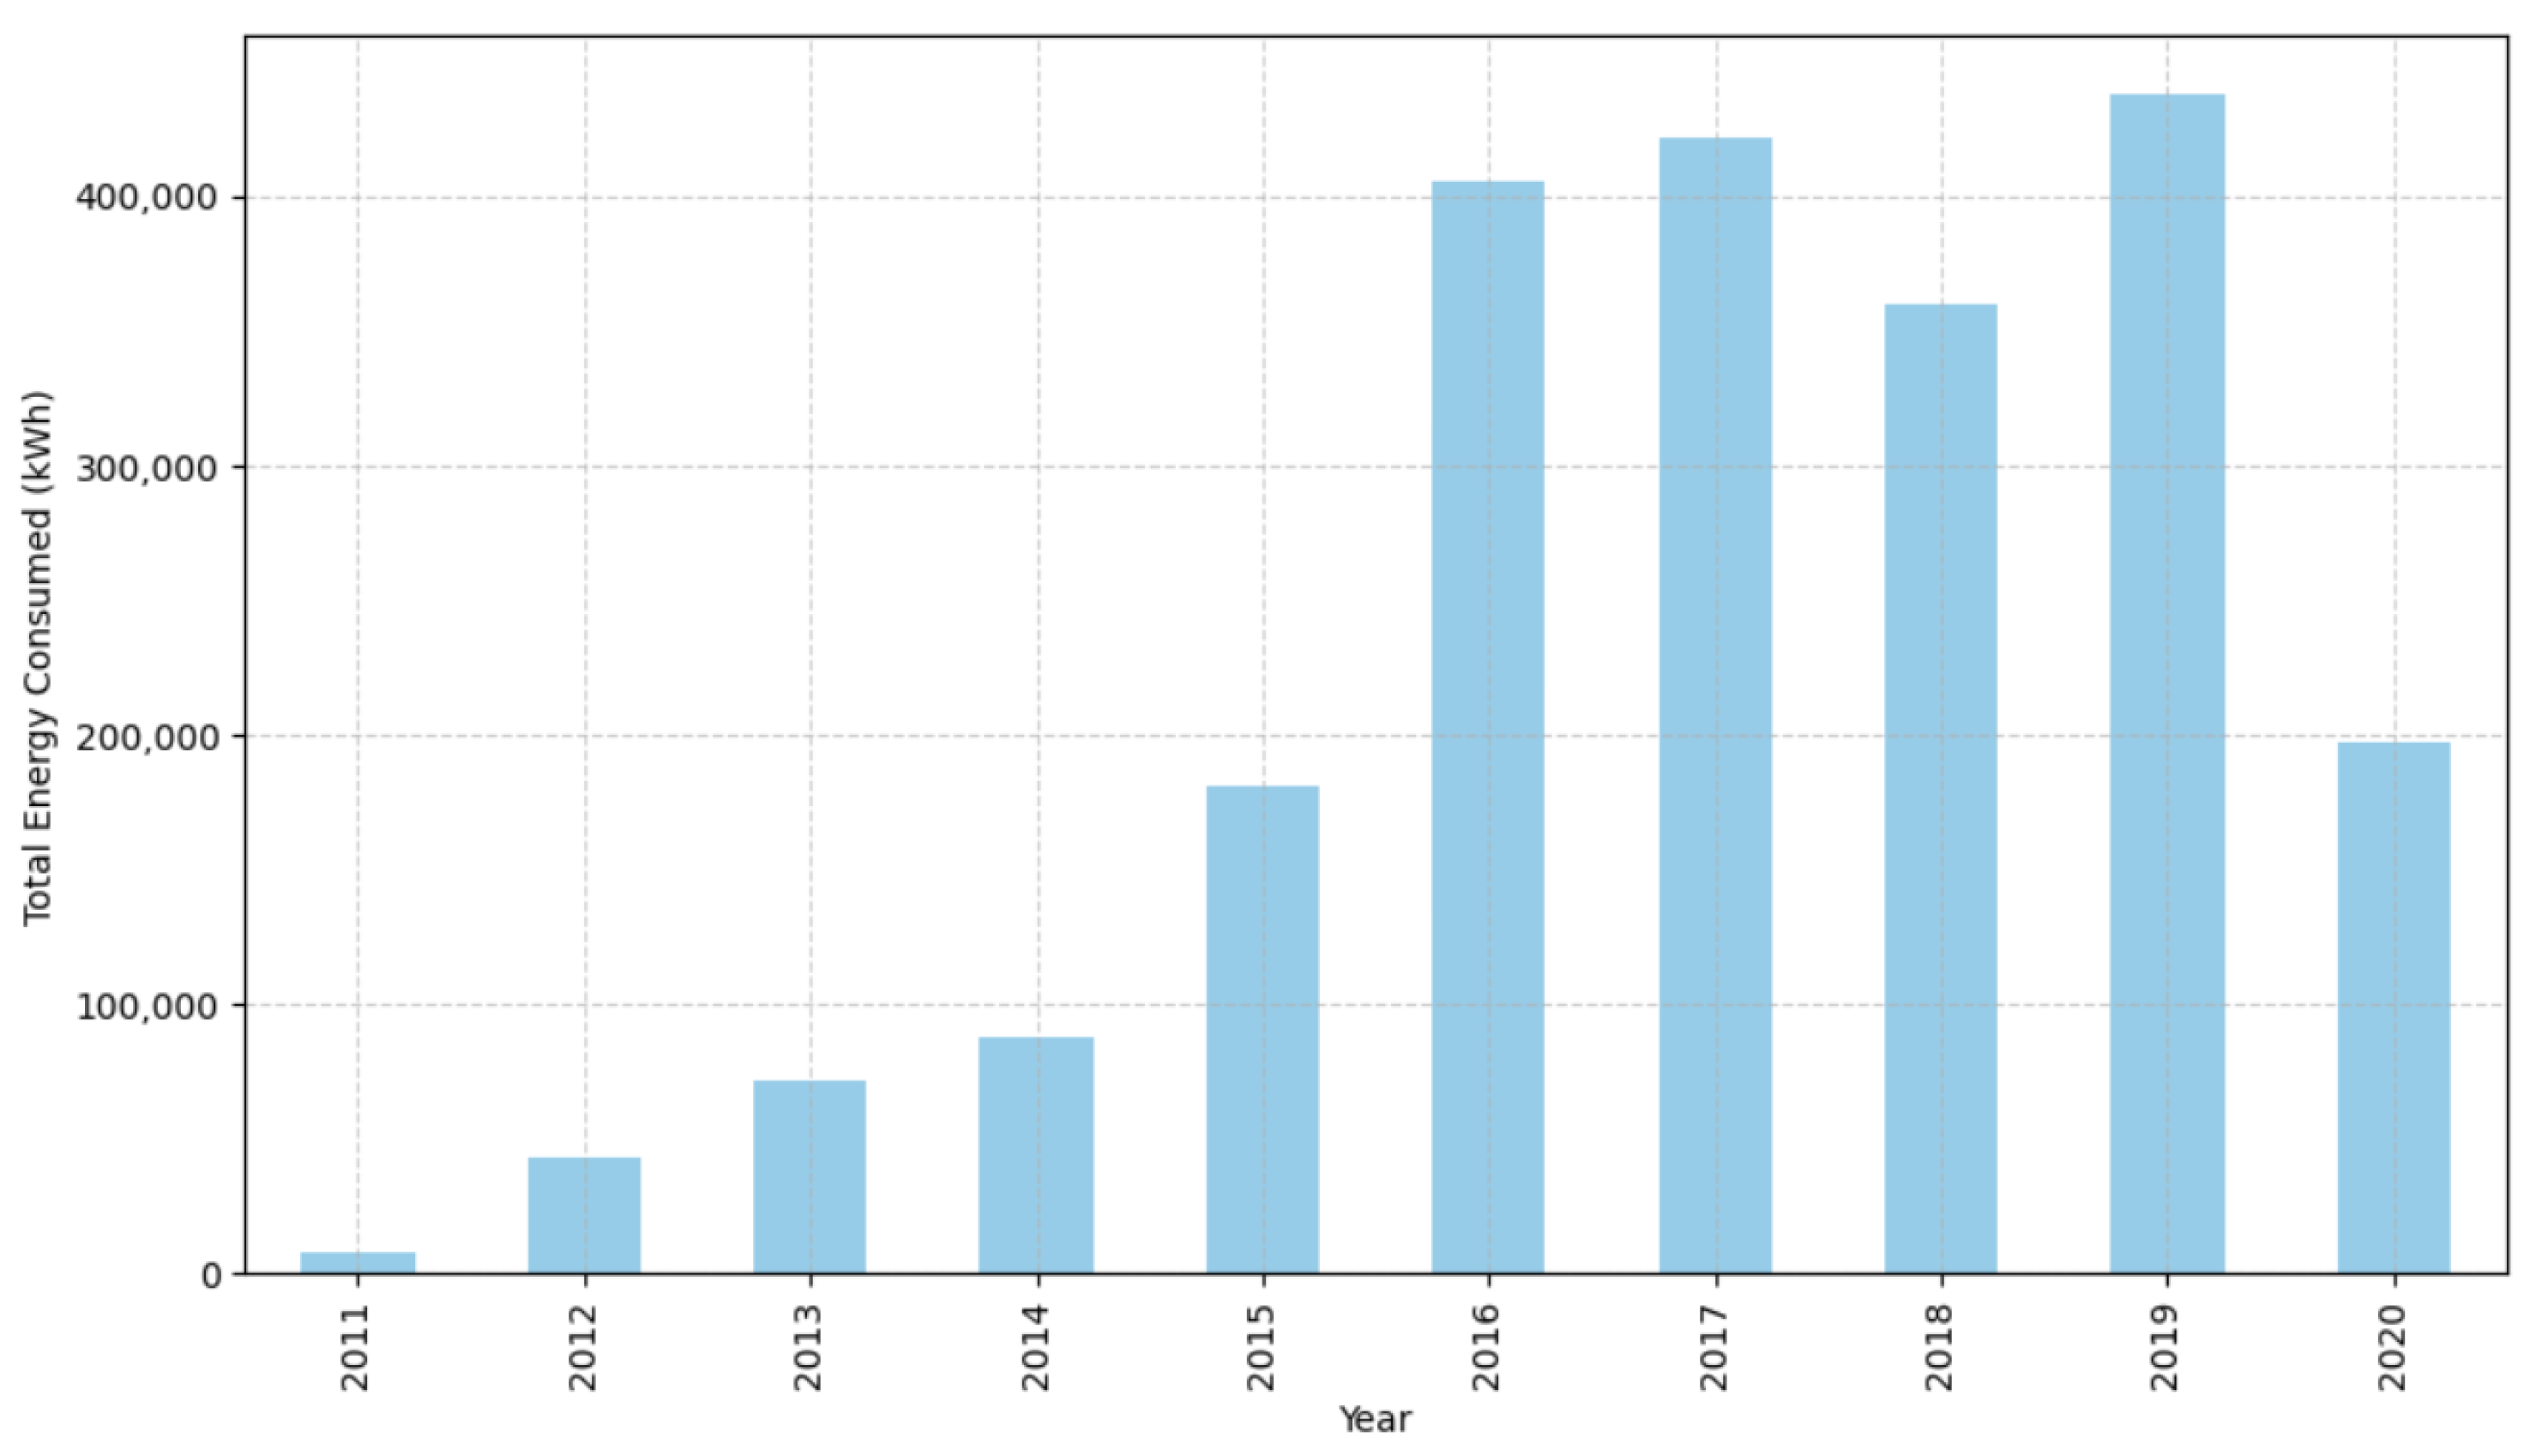
3.6. Variation Analysis

Between 2011 and 2020 as shown in Figure 1, total energy consumption generally increased with the growing adoption of EVs. However, 2018 and 2020 showed unexpected declines. This analysis examines possible causes for these anomalies, considering how external factors may have disrupted expected patterns. Understanding these variations is important for improving forecasts of EV charging demand.
  • Energy Consumption Dips in 2018 and 2020:
Two notable declines in EV energy consumption occurred in 2018 and 2020 due to distinct external factors. In 2018, following the introduction of a charging fee on 1 August 2017, in Palo Alto, users who were previously accustomed to free charging reduced their usage or sought alternative options. This change in behaviour demonstrates how pricing policies can influence infrastructure utilisation [34]. In 2020, the COVID-19 pandemic caused a sharp decline in charging demand. Lockdowns, remote work, travel restrictions, and economic uncertainty led to reduced travel and more conservative energy use, with many delaying EV purchases due to financial concerns [39]. These events highlight the sensitivity of EV charging patterns to both economic incentives and broader societal disruptions.

3.7. Model Selection

  • GHG and Gasoline Savings Model
A linear regression model was used to analyse how factors such as charging times and energy usage relate to GHG and gasoline savings. This method assumes a linear relationship and fits a line that minimises prediction errors. Its simplicity and interpretability make it suitable for understanding the environmental and economic benefits at EV charging stations [40].
  • Dynamic Pricing Model
Ridge regression was selected for pricing analysis. It extends linear regression with L2 regularisation (Ridge penalty) to reduce overfitting, especially in the presence of multicollinearity. By penalising large coefficients, it produces more stable and reliable predictions [41,42].
This equation forms the basis of ridge regression, detailing the components and their roles in the model:
| | y X w | | 2 2 + α · | | w | | 2 2
  • y: Observed values.
  • X: Predictor variables.
  • w: Coefficient vector.
  • α : Regularisation parameter.
  • | | · | | 2 2 : Squared Euclidean norm [42].
In this study, α was set to 1.0 based on empirical testing. This commonly used default value provided sufficient regularisation. Including this detail enhances the model’s reproducibility and clarity.
  • Demand Forecasting Model
The demand forecasting model employed a SARIMAX framework due to its ability to handle non-stationary and seasonal data while incorporating external variables [43]. It builds on earlier models by accounting for cases where pricing alone does not influence user behaviour, such as peak demand or limited user flexibility. This model supports planning for infrastructure expansion and equitable access to charging stations.

3.8. Hypothesis Testing

Two hypothesis tests (Figure 2 and Figure 3) were conducted to inform demand forecasting and pricing strategies. Both applied a consistent bootstrapping method, resampling with replacement to estimate means and mean differences. Key steps included dataset preparation, generating bootstrapped samples, computing z-scores, and calculating p-values. A significance level of α = 0.05 was used to evaluate results. This approach supports robust, interpretable findings for operational planning.
p-values were calculated empirically by computing the proportion of bootstrap resamples where the test statistic was at least as extreme as the observed value, using a two-tailed approach.
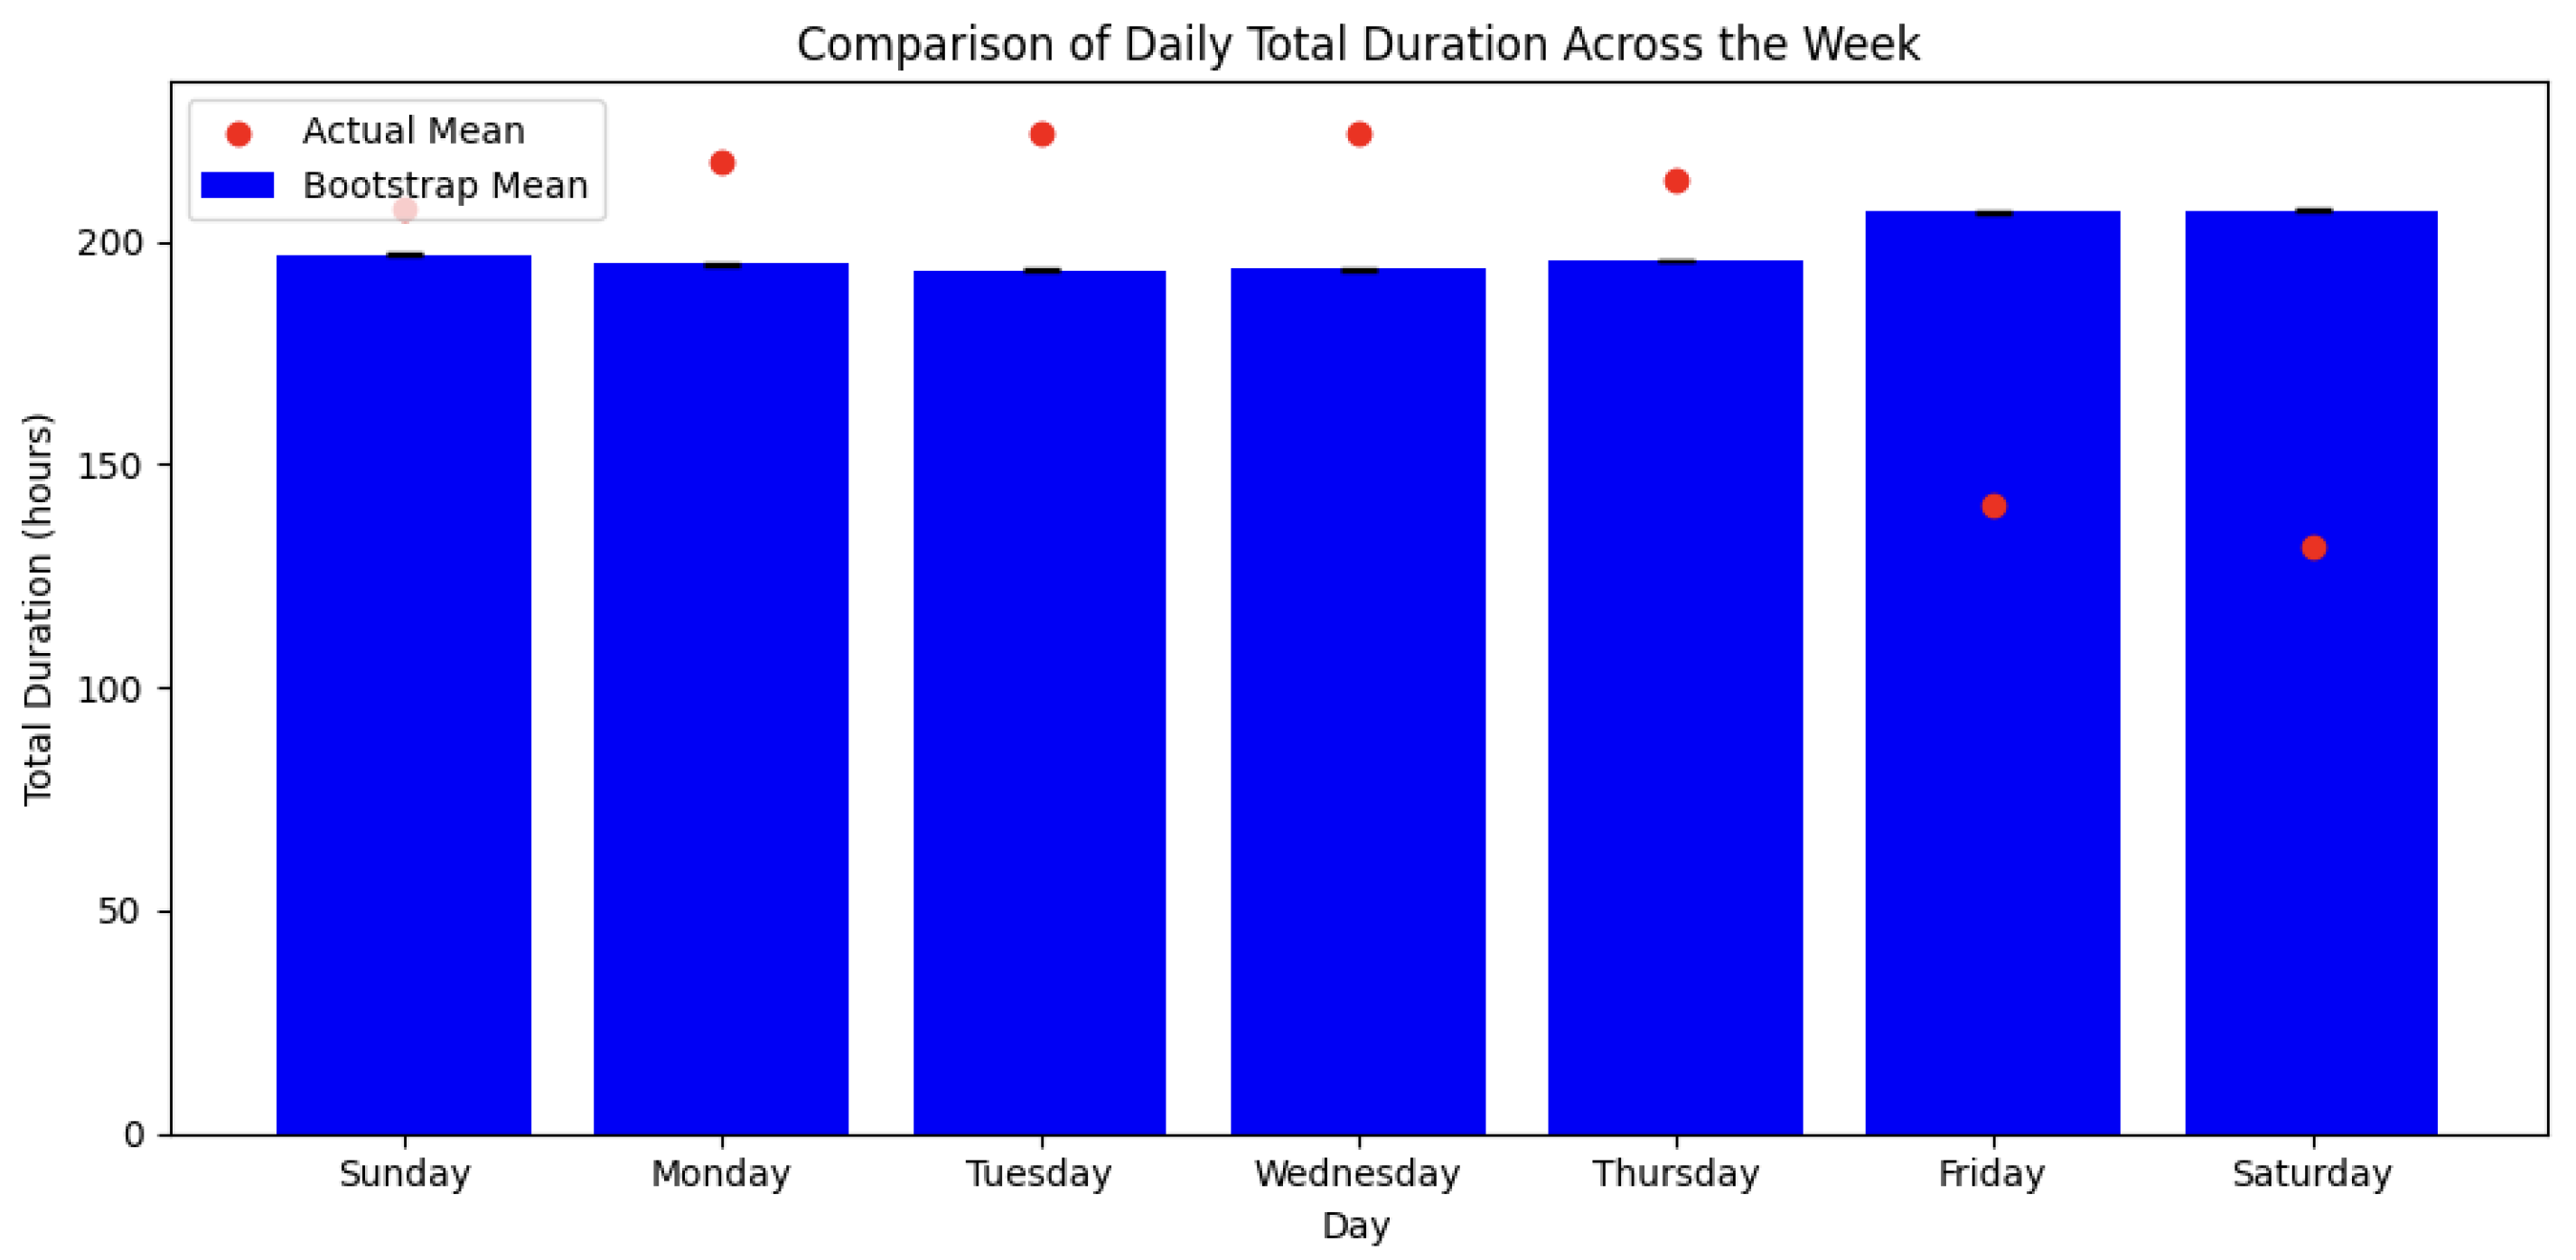
  • Daily Variations in Charging Times
In this hypothesis test, the daily variations in EV charging durations are tested based on the following:
Null Hypothesis H 0 : The mean charging time on a specific day equals that of all other days.
H 0 : μ d = μ other
Alternative Hypothesis H 1 : The mean charging time on a specific day differs from that of other days.
H 1 : μ d μ other
  • μ d : Mean charging duration for the specific day.
  • μ other : mean charging duration on all other days.
The null hypothesis was rejected for Friday and Saturday, indicating significantly different charging times on these days.
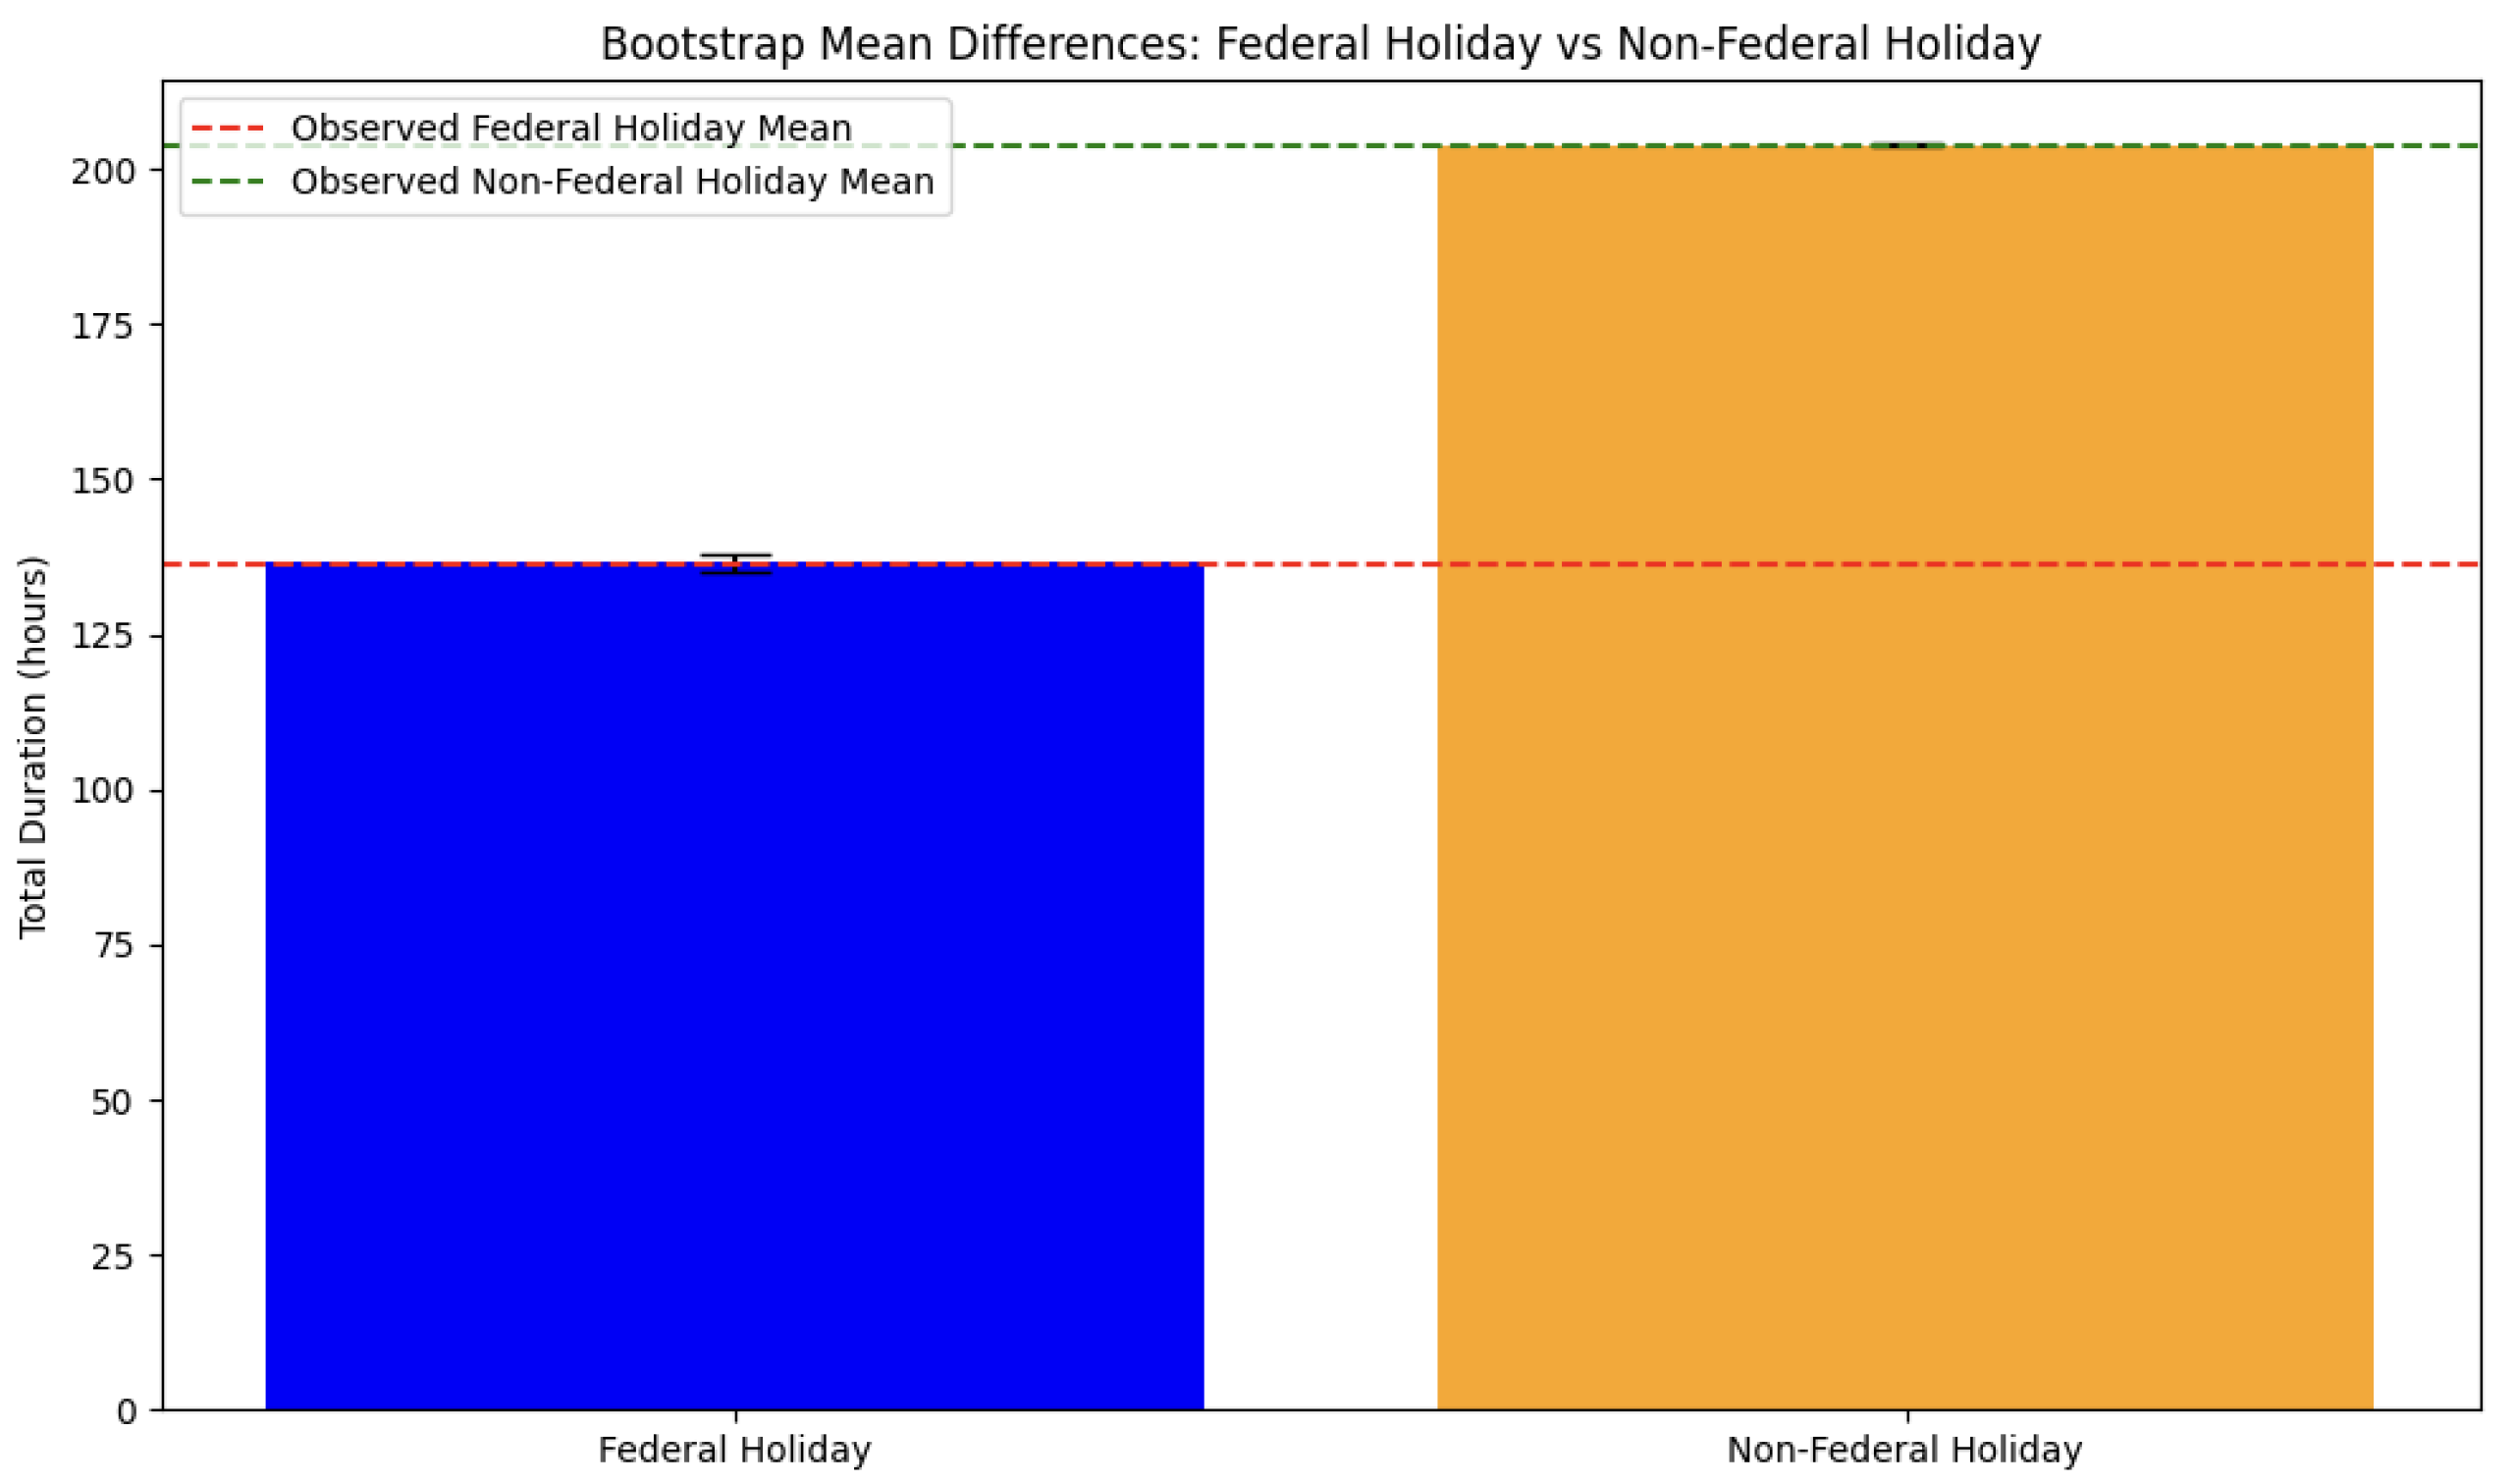
  • Federal Holiday vs. Non-Federal Holiday Charging Times
In this analysis, the differences in EV charging means during federal holidays versus non-federal holidays are examined:
Null Hypothesis H 0 : Mean charging time is the same for both groups.
H 0 : μ holiday = μ non - holiday
Alternative Hypothesis H 1 : Mean charging times differ between the two.
H 1 : μ holiday μ non - holiday
  • μ holiday : Mean charging time on federal holidays.
  • μ non - holiday : Mean on non-federal holidays.
The test rejected the null hypothesis, confirming significantly different charging behaviour during federal holidays, critical insight for pricing decisions.

4. Results

4.1. GHG and Gasoline Savings Model

The model was designed to project and monitor GHG and gasoline savings over the years 2021 to 2025, focusing on the environmental benefits of EV usage. Utilising historical data from EV charging stations, the linear regression model employed predictive analytics to forecast trends and quantify potential reductions in emissions and gasoline usage. This approach enables evaluation of the long-term impact of sustainability efforts in reducing carbon footprints. However, the results revealed an almost perfect coefficient of determination ( R 2 1 ). Moreover, as illustrated in Figure 4, the correlation heatmap shows a high degree of interdependence among key charging session attributes, confirming the near-perfect correlation between energy (kWh), GHG savings (kg), and gasoline savings (gallons). This indicates that GHG and gasoline savings are not independently measured variables but are instead directly derived from the amount of energy consumed during each charging session.
This insight, while valuable, introduced modelling limitations, as it restricted the ability to independently assess each of these variables. To address this issue and improve the model’s predictive performance over the next five years, constants representing the relationships between these variables were extracted from the correlation analysis. These constants are now used to compute GHG and gasoline savings based on the measured or predicted energy (kWh), ensuring consistency and avoiding redundancy in variable inputs.

Conversion Rates

Upon careful examination, the conversion rates observed in the data were as follows:
  • GHG saved per kWh: 0.420 kg;
  • Gasoline saved per kWh: 0.125 gallons.
These values capture only the average carbon intensity of the local grid during the study period and does not reflect year-to-year changes in the energy mix, such as increased use of renewables or shifts in peak demand generation.
As shown in Table 2, the values for energy, GHG savings, and gasoline savings across the years were derived using these fixed conversion rates. These figures were calculated based on the monthly energy demand trends illustrated in Figure 5.
These calculations demonstrate that substantial environmental savings were achieved and are projected to continue, highlighting the escalating impact of sustainable practices on the environment over time.

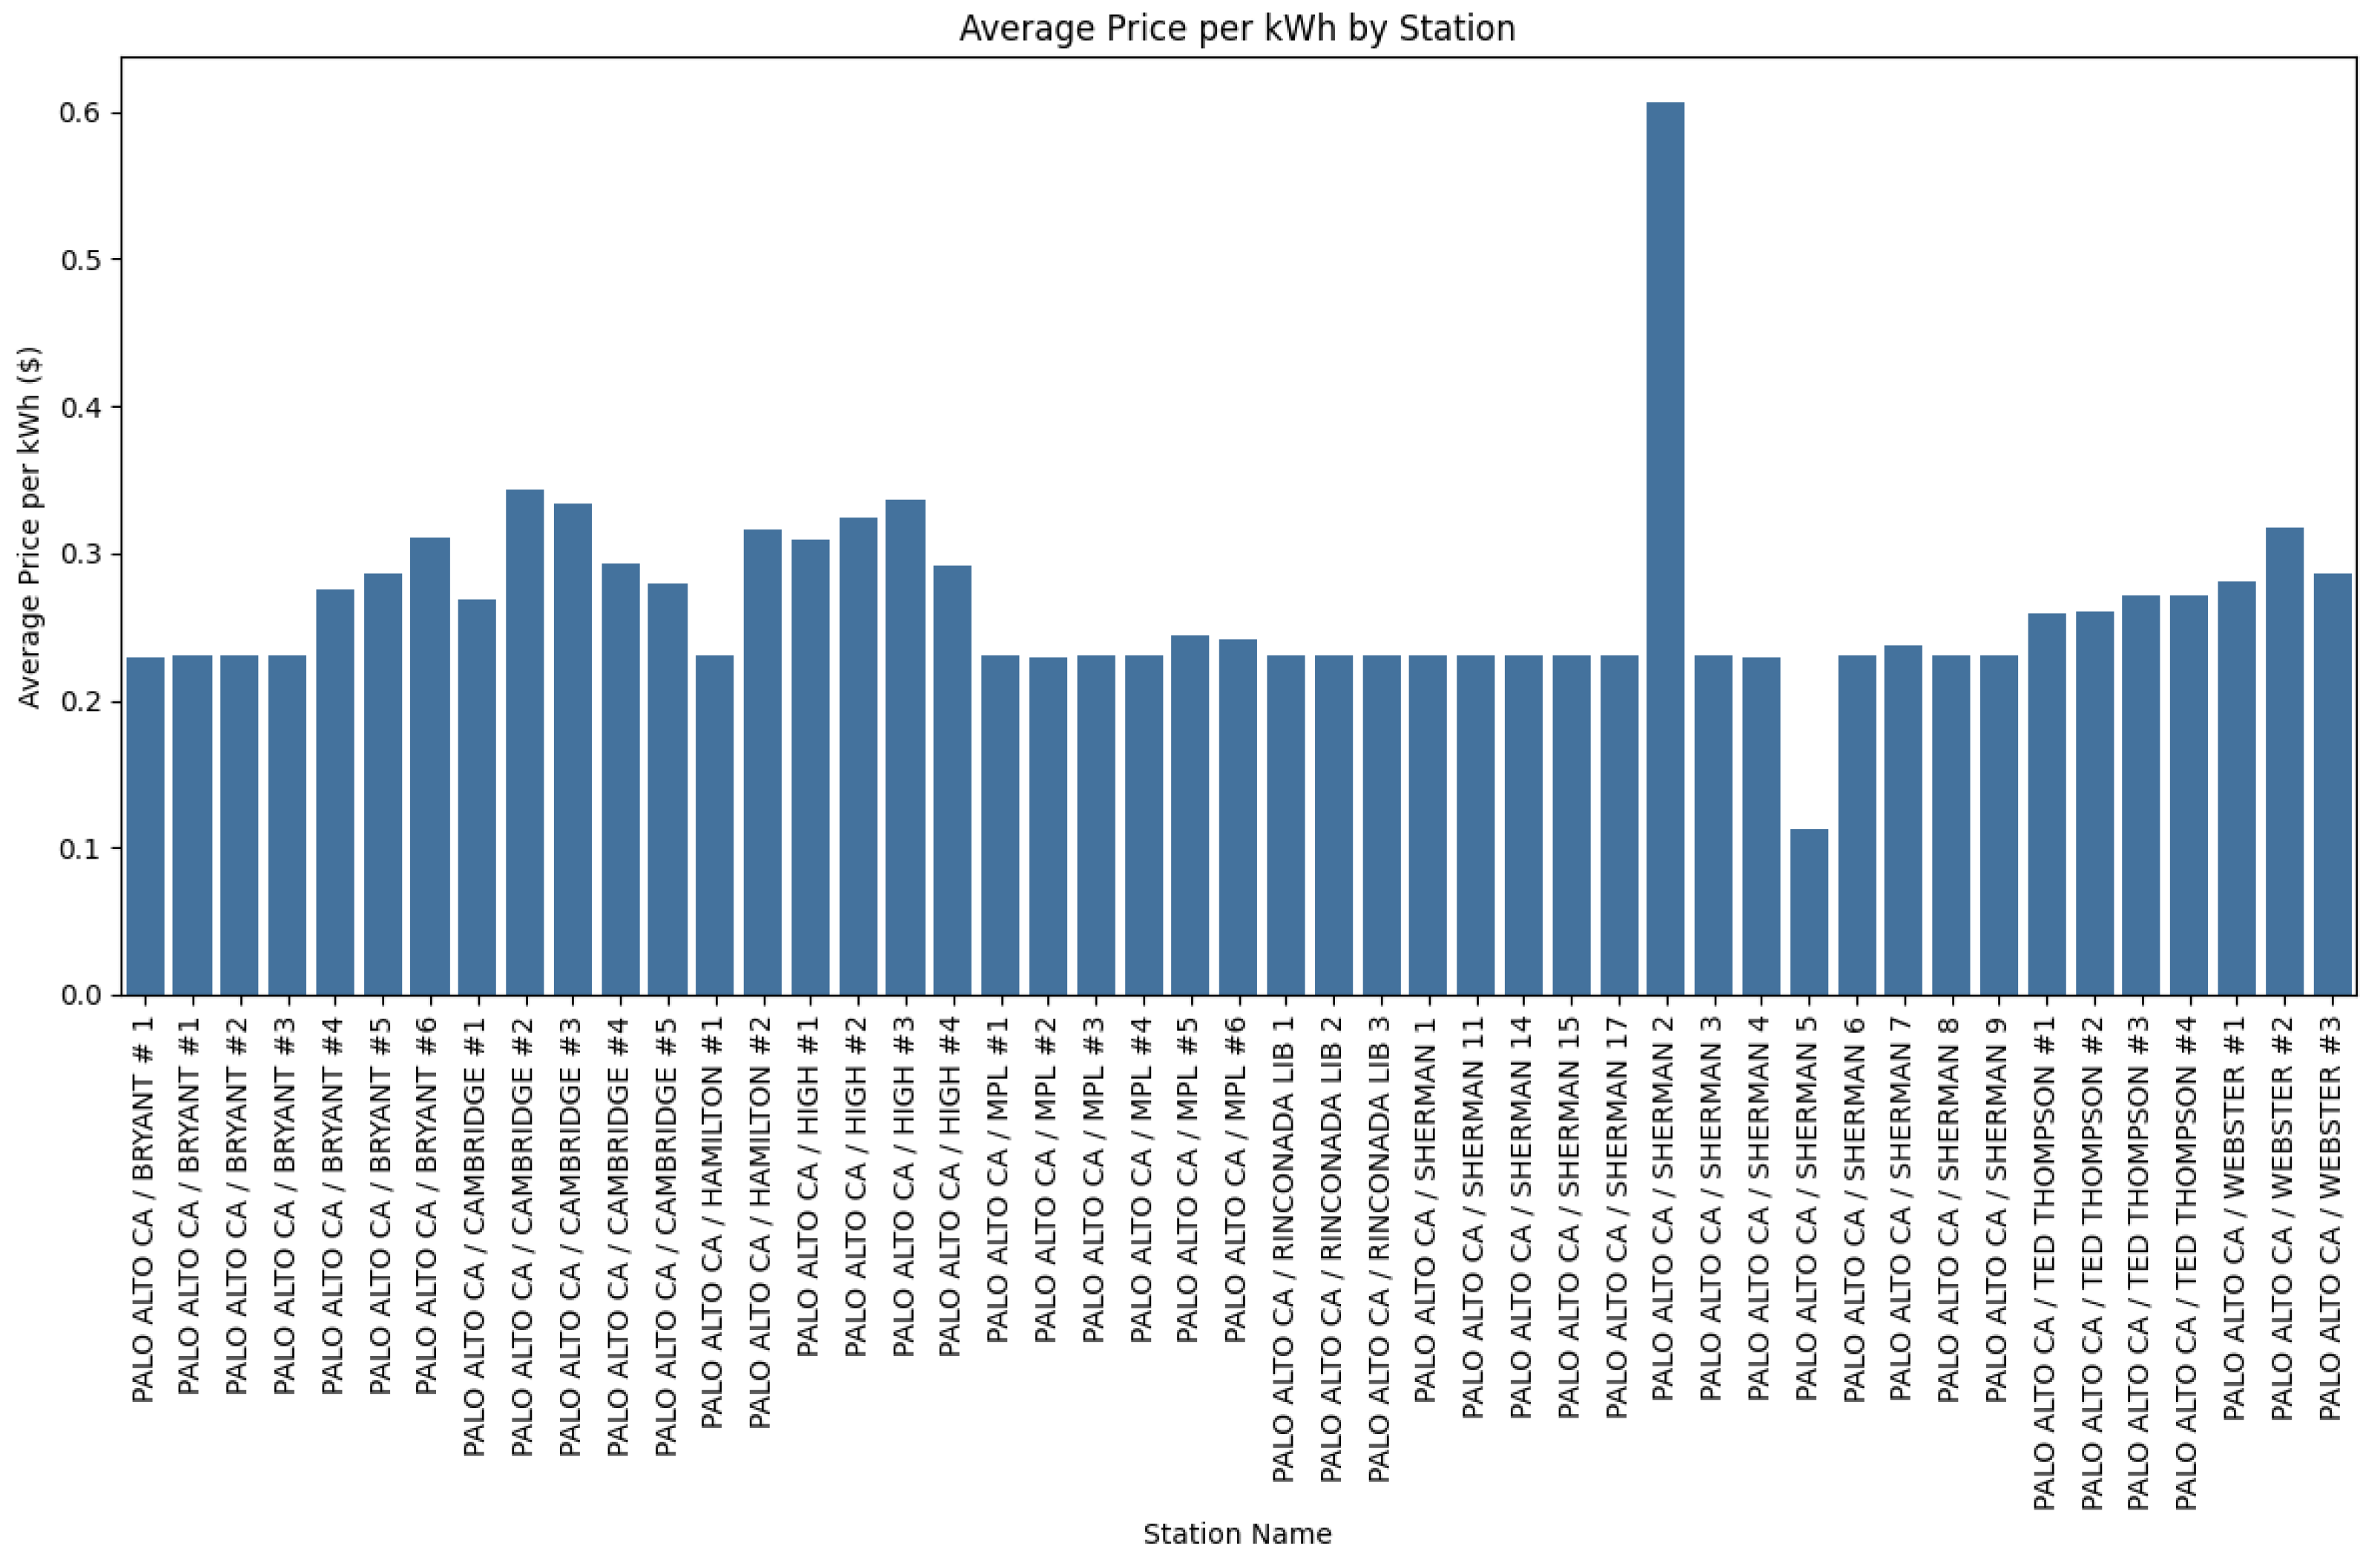
4.2. Dynamic Pricing Model

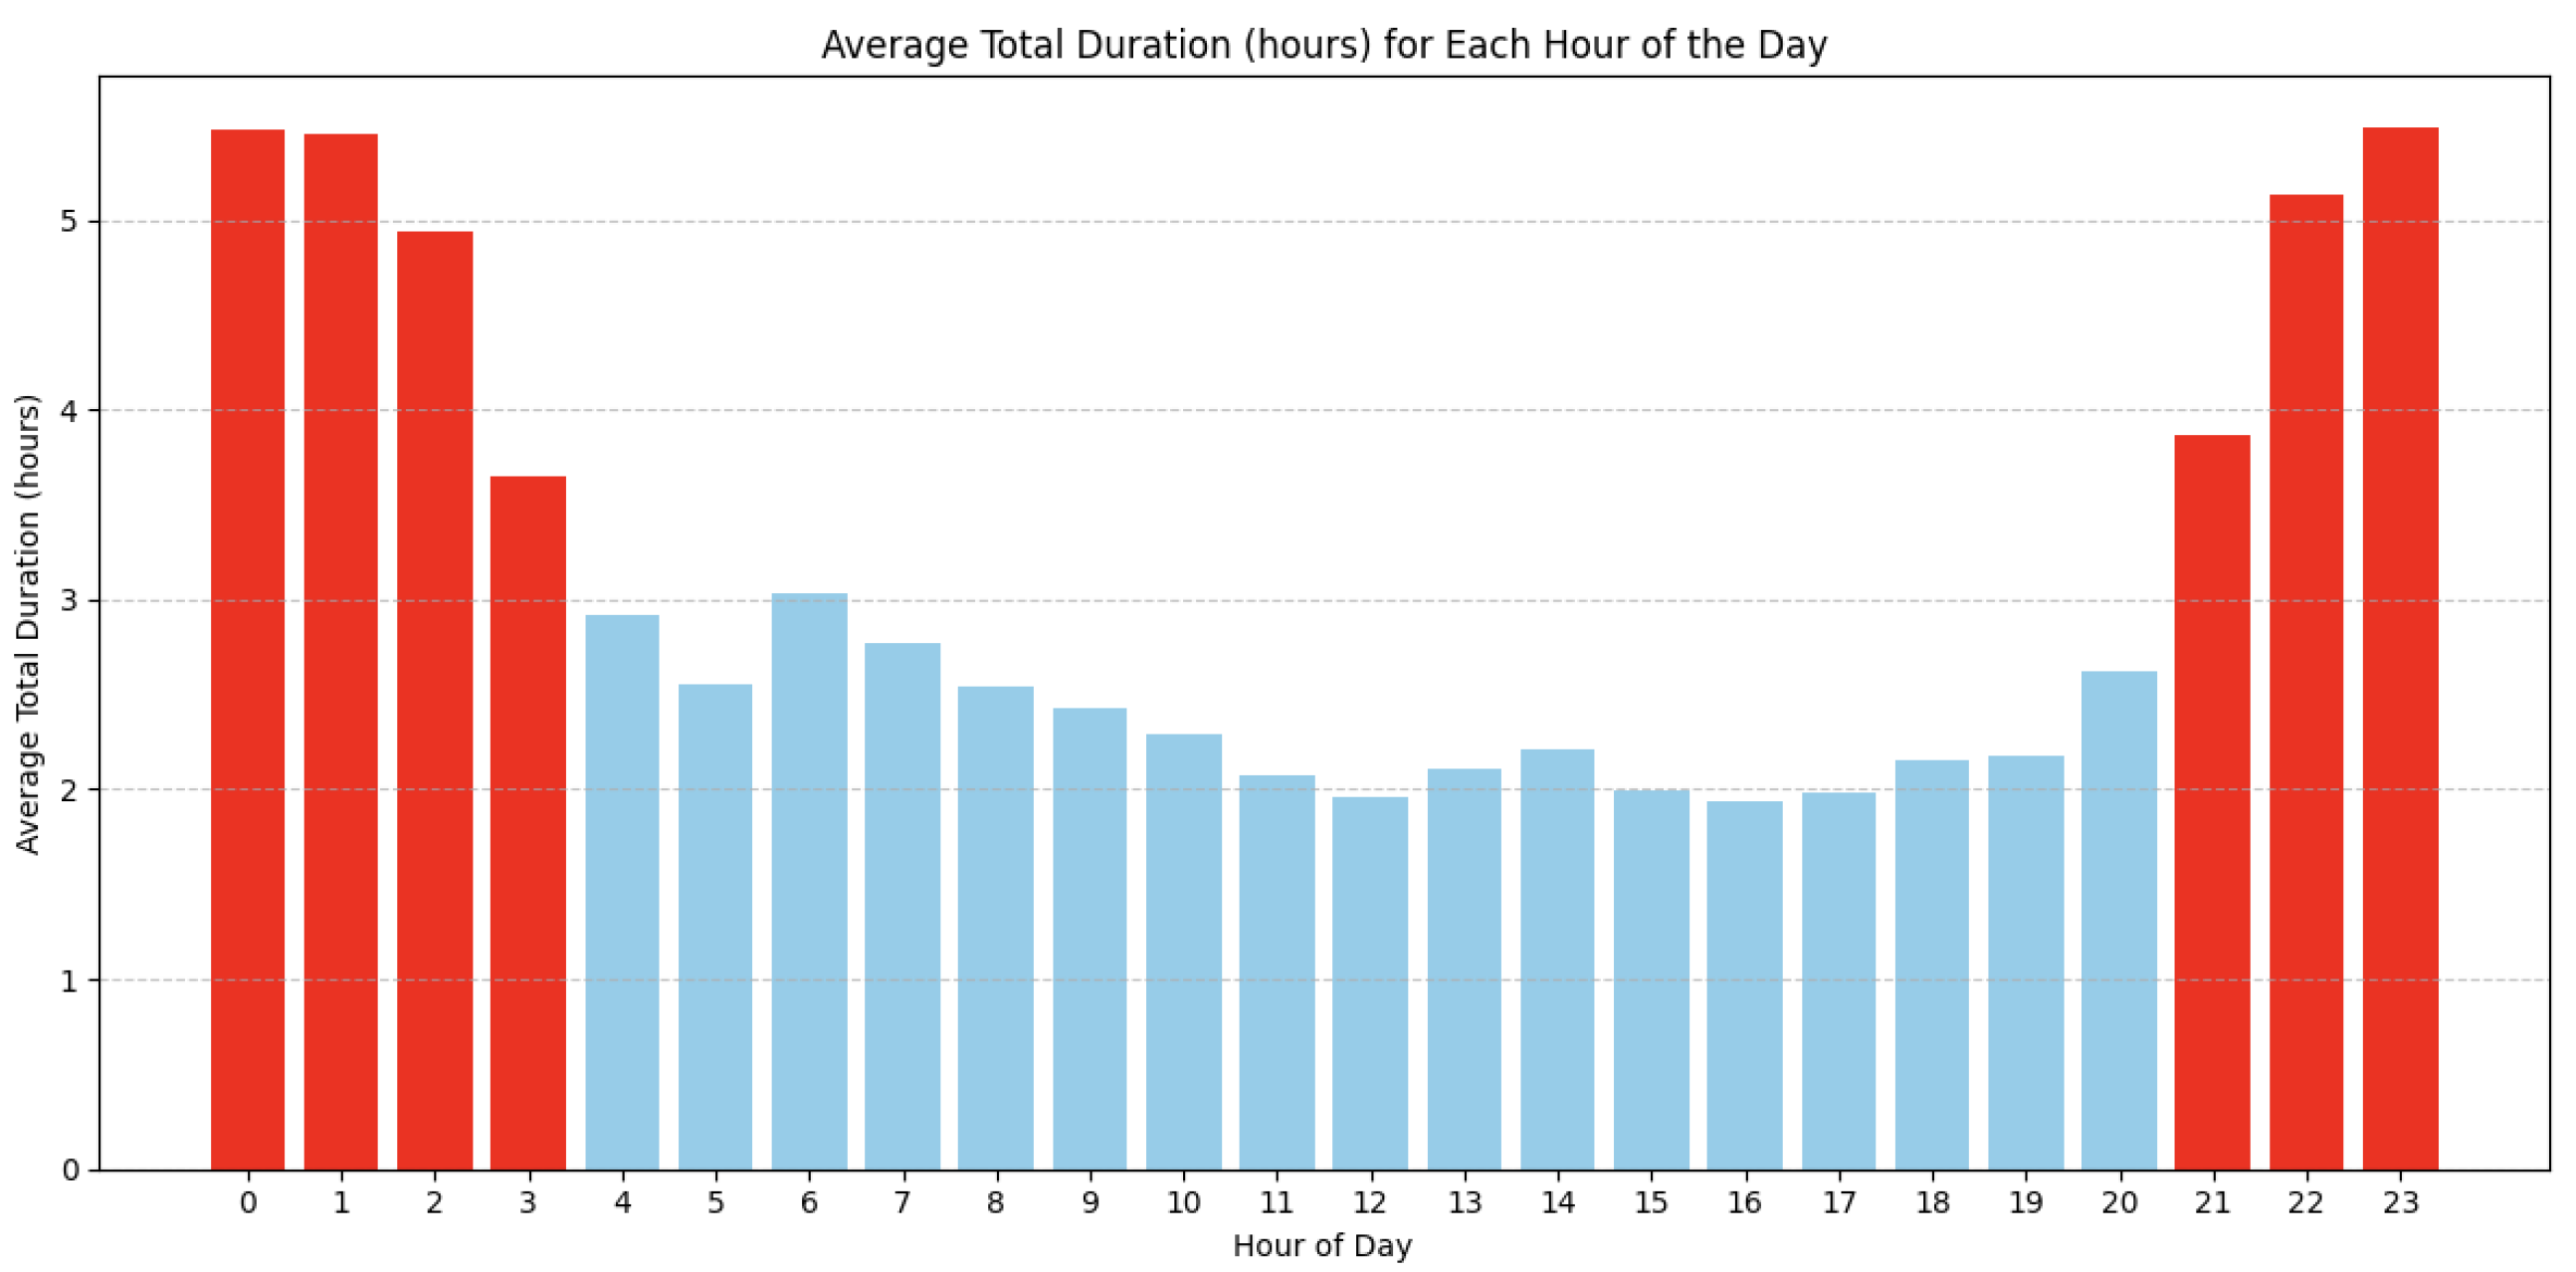
4.2.1. Utilisation Patterns and Peak Times

Upon analysing the daily occupancy rates of EV chargers, it becomes clear that a significant number of chargers remain unused for nearly half of the day or more. This indicates a concentration of charging activity during specific peak hours, highlighting inefficiencies in utilisation. The data suggests that while many stations have the capacity to support more vehicles, the challenge lies in optimising the timing of usage.
By managing when drivers choose to charge—through dynamic pricing that adjusts costs based on the time of day—stations can operate more efficiently. This approach can help
  • Reduce wait times;
  • Distribute demand more evenly throughout the day;
  • Potentially delay the need for additional infrastructure.
Figure 6 supports this analysis by showing a comparison of occupied and empty hours across various charging stations, making it evident that most stations have long periods of inactivity.

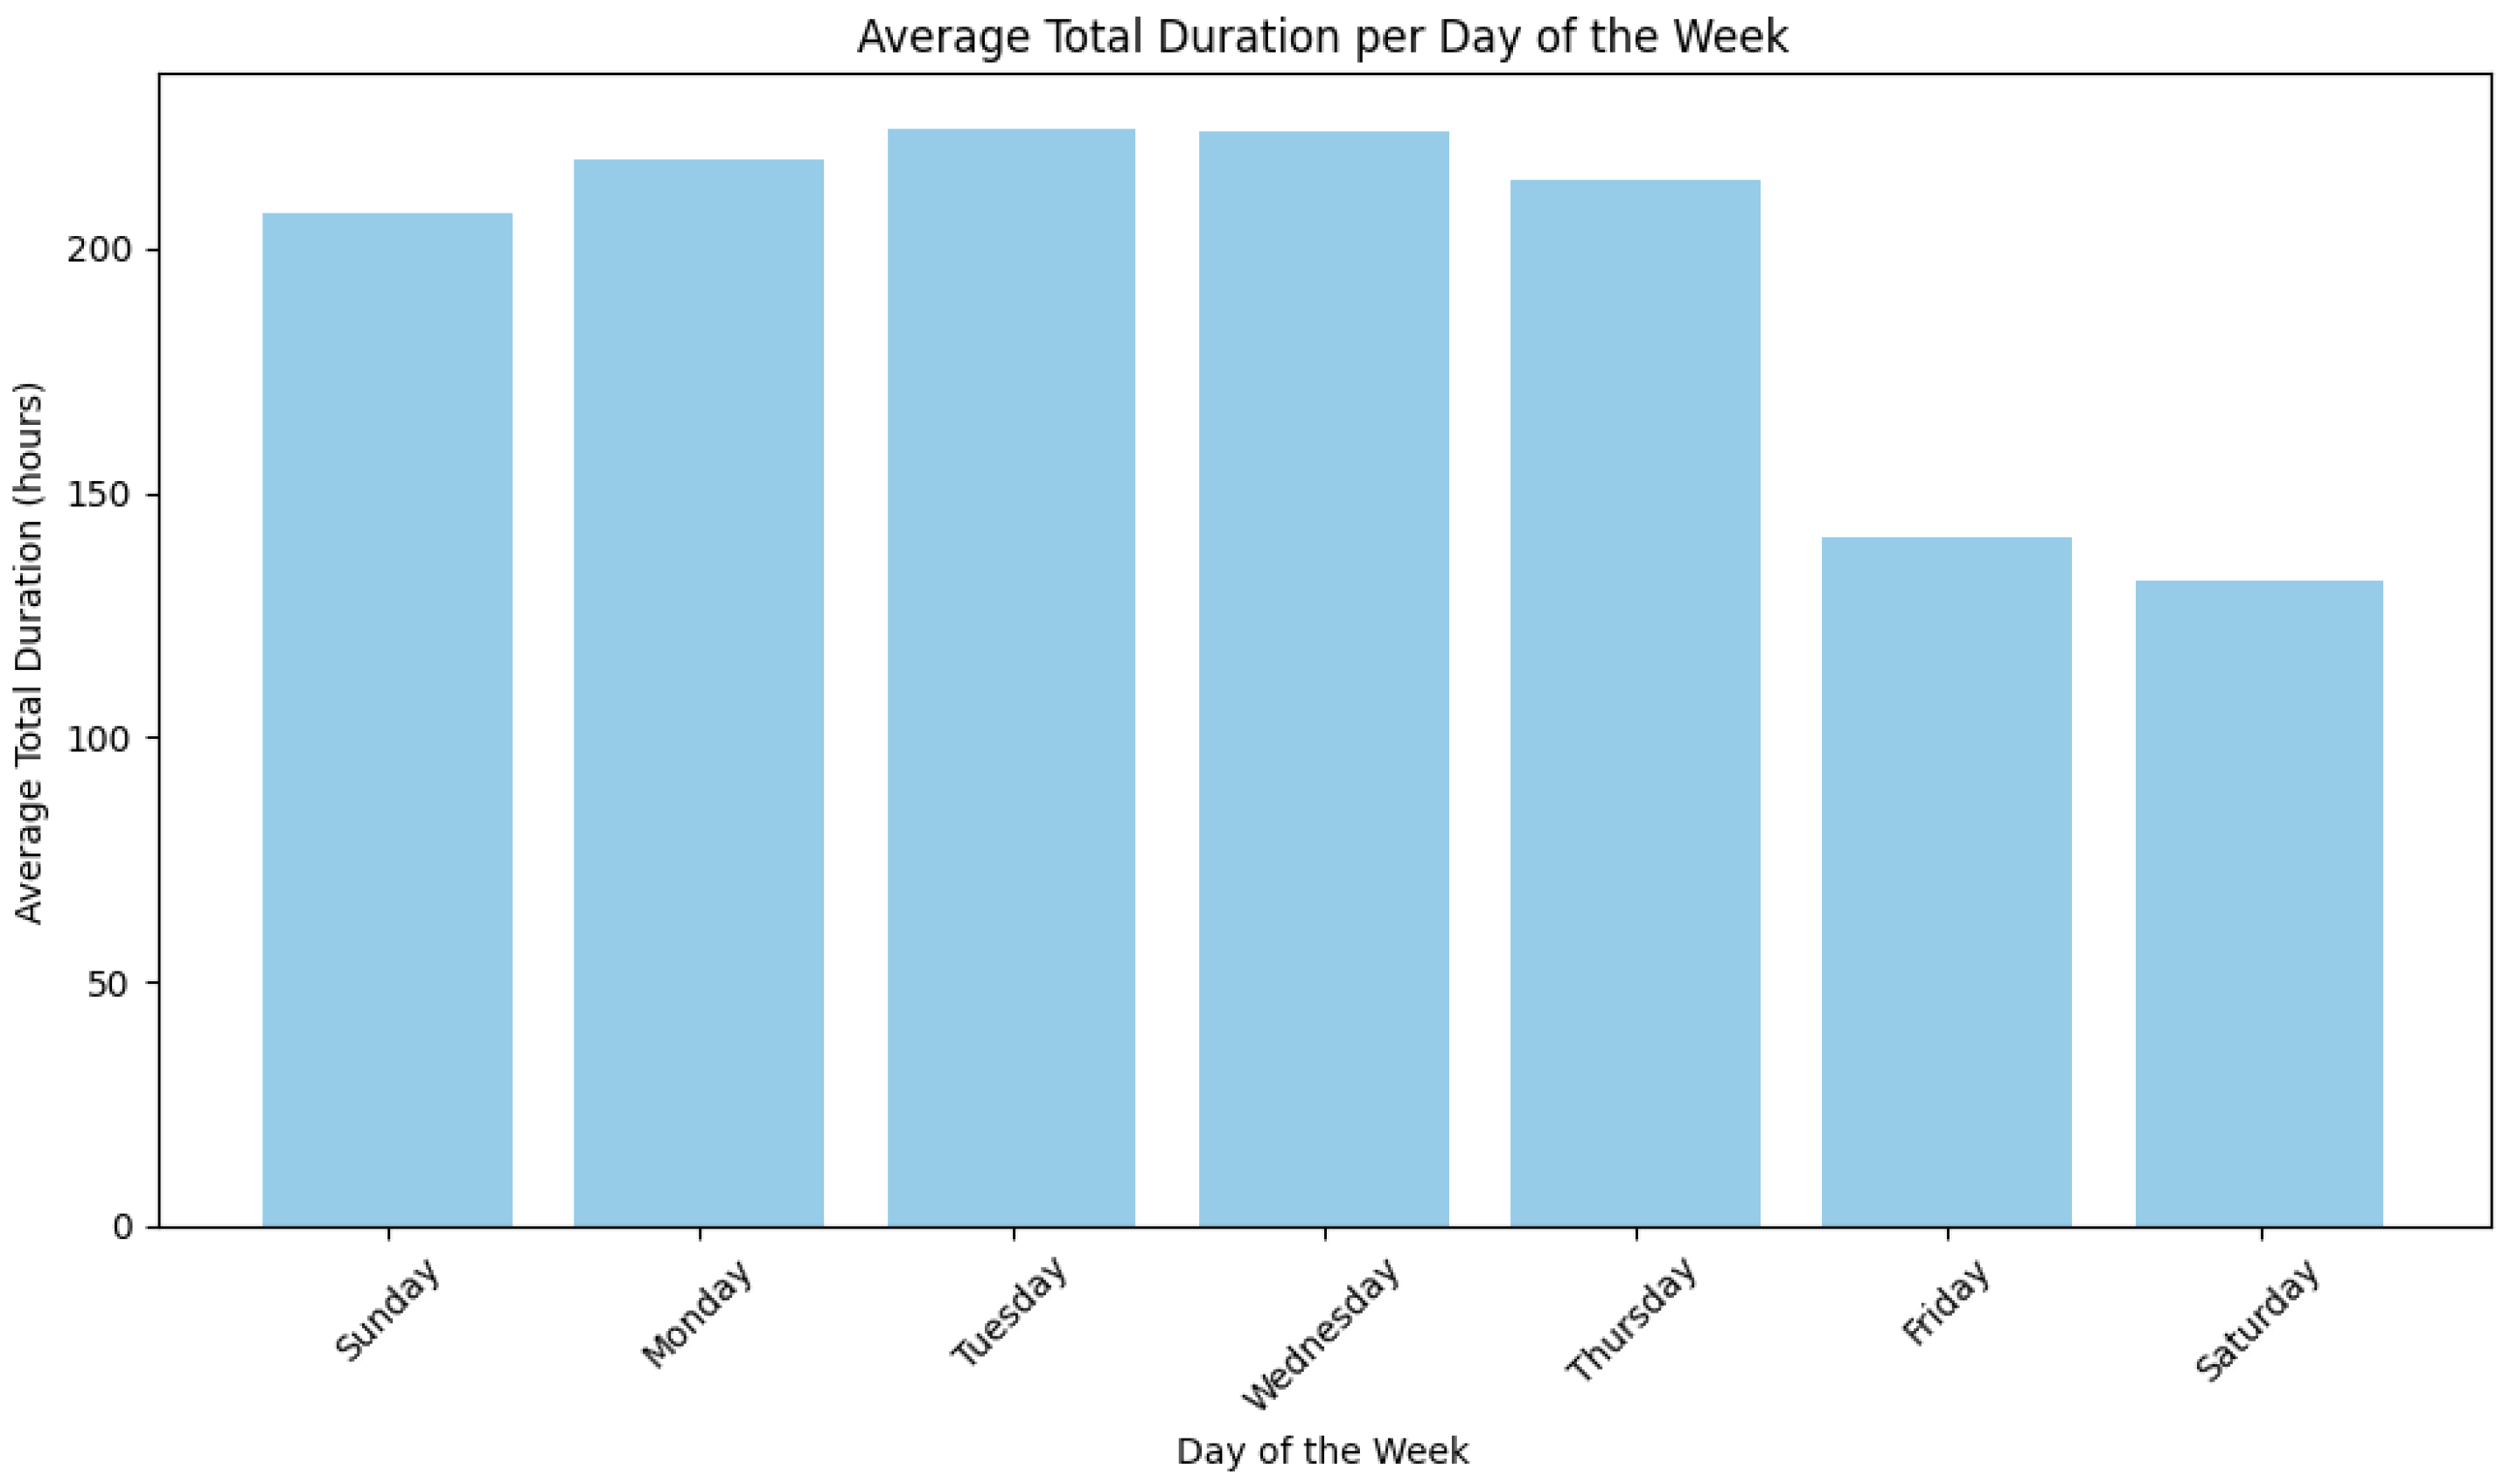
4.2.2. Day-Based Charging Behaviour

The previous hypothesis test (Figure 7) confirmed significant differences in total charging durations between Friday and Saturday and every other day of the week. Further investigation revealed that people tend to charge their vehicles less frequently on these days.

4.2.3. Implementation of Dynamic Pricing

To effectively manage the utilisation of EV charging stations, a day-based dynamic pricing strategy could be introduced. For days with typical usage (Sunday through Thursday), standard rates should be maintained due to consistently high demand. In this study, the average price observed across most stations is approximately USD 0.25 per kWh.
While pricing appears uniform in general, some stations exhibit noticeable deviations. The dataset does not provide specific reasons for these differences, which may be influenced by
  • Local policies;
  • Infrastructure costs;
  • Usage trends.
Figure 8 illustrates the average price per kWh at each station, clearly showing that most stations cluster around the average rate, while a few outliers exhibit significantly higher or lower pricing.
For underutilised days (Friday and Saturday), a 20% price reduction is proposed to encourage charging on these days, setting the price to 0.20 USD/kWh. This adjustment does not account for any hourly price changes that might be implemented.
The price adjustment calculations are as follows:
  • Current Price: 0.25 USD/kWh
  • Reduction (20%):
    0.25 USD / kWh × 0.20 = 0.05 USD / kWh
  • Price for Friday and Saturday:
    0.25 USD / kWh 0.05 USD / kWh = 0.20 USD / kWh
Implementing this pricing strategy aims to balance the load on the EV charging infrastructure by shifting some of the demand from the highly utilised days to the underutilised Fridays and Saturdays. This approach not only optimises the use of existing infrastructure but also improves user satisfaction by reducing congestion during peak times. Continuous monitoring and adjustments will be essential to ensure that the pricing strategy remains effective and responsive to user behaviour and demand patterns.
Based on the bar chart in Figure 9, the peak and off-peak periods are determined using an experimental 3.5 h threshold as follows: Any hour with an average total duration exceeding 3.5 h is considered a peak hour.
  • Peak Hours: [9:00 PM, 4:00 AM)
  • Off-Peak Hours: [4:00 AM, 9:00 PM)
During peak hours, when the average total charging duration is at its highest, a 15% price increase is introduced to help manage station congestion and discourage excessive use. The adjusted pricing during peak hours is calculated as follows:
Current Price = 0.25 USD / kWh Increase ( 15 % ) = 0.25 USD / kWh × 0.15 = 0.0375 USD / kWh New Price During Peak Hours = 0.25 USD / kWh + 0.0375 = 0.2875 USD / kWh
During off-peak hours, standard rates are maintained to encourage usage during periods of lower demand and to optimise station utilisation. This strategy is designed to enhance infrastructure efficiency by aligning user behaviour with station availability. The effectiveness of the pricing model is monitored regularly to inform potential adjustments. Following the implementation of an hour-based dynamic pricing strategy, data revealed that the period from 9:00 PM to 4:00 AM recorded the highest total charging duration but the fewest sessions. This indicates that many users leave their vehicles connected overnight without actively charging throughout the duration, resulting in inefficient station use. Such behaviour limits access for other users and underscores the need for greater awareness and the introduction of a penalty system to encourage more efficient charging practices, thereby improving station availability and operational efficiency.
  • Implementation Plan For A Graduated Penalty System
  • Goal: To optimise the use of EV charging stations by discouraging prolonged usage during peak hours and ensuring efficient turnover for increased user satisfaction.
  • Justification: Efficient use of charging stations reduces wait times, accommodates more users, and enhances overall service quality.
  • Policy Design
  • Duration Thresholds:
- 
10–20% over charging time: Minor penalty
- 
21–40% over charging time: Moderate penalty
- 
More than 40% over charging time: Major penalty
Penalty Scale: The penalty scale is determined based on the average cost to charge an EV with an average battery capacity of 72.2 kWh [44], priced at 0.25 USD per kWh. This results in an estimated cost of 18.05 USD to fully charge a vehicle.
-
Minor penalty: 5 USD
-
Moderate penalty: 10 USD
-
Major penalty: 20 USD
This hypothetical scale is designed to be fair and reflective of real-life scenarios. A grace period equivalent to 10% of the charging time is considered adequate for users to remove their vehicle from the charger, ensuring availability for others. For fast chargers, users are typically expected to stay near their vehicle and disconnect it immediately once charging is complete. For slower chargers, the grace period allows sufficient time for users to return and disconnect their vehicle and remove it after it has finished charging.
This approach encourages responsible use of charging stations and helps balance the needs of all users, regardless of the charging speed.
A previous hypothesis test (Figure 3) showed that users tend to charge less during federal holidays. Therefore, as a hypothetical scenario, an additional discount is proposed to encourage charging on federal holidays.
To find the percentage discount, the percentage increase in charging times that is desired to be encouraged on holidays will be estimated:
  • Observed non-federal holiday mean: Approximately 210 h
  • Observed federal holiday mean: Approximately 135 h
To encourage more usage, the holiday charging time should be aimed to be increased at least 50% of the difference closer to the non-federal holiday mean:
  • Difference:
    Difference = 210 h 135 h = 75 h
  • Target Increase (50% of the difference minimum):
    Target Increase = 75 h × 0.5 = 37.5 h
Now, we calculate the percentage increase needed to reach this new target:
Percentage Increase = 37.5 135 × 100 = 27.8 %
This 27.8% represents the minimum increase in usage that is aimed to be achieved. Offering a discount of 20% reflects the desired increase in usage. Continuous monitoring and iterative adjustments based on real-time data and user feedback are essential to ensure the strategy’s success, as this pricing strategy is based on assumed user responsiveness and therefore warrants empirical validation through behavioural modelling.
Model Summary
The analysis of daily occupancy rates of EV chargers has revealed a significant unused capacity at certain times of the day, indicating that charging activities are concentrated during peak hours. In this speculative trial, the following dynamic pricing measures are proposed to optimise charger utilisation and mitigate congestion. It is important to note that these measures are theoretical and should be continuously adjusted based on real-time observation, user feedback, or insights from a demand elasticity study to ensure their effectiveness and suitability.
It is important to note that these pricing scenarios are theoretical and assume static demand. They should be continuously refined based on real-time observation, user feedback, and system performance data. While this study does not model price elasticity explicitly, incorporating behavioural response models in future work could enhance the realism and effectiveness of pricing strategies.
  • Days with Typical Usage (Sunday-Thursday).
  • Standard Rate: 0.25 USD/kWh.
  • Justification: This rate is maintained due to consistent demand observed from Sunday to Thursday.
  • Expected Impact: Ensures stability in revenue from regular users while maintaining high utilisation.
  • Underutilised Days (Friday and Saturday).
  • Discount: 20% off to encourage charging.
  • New Price: 0.20 USD/kWh.
  • Justification: The lower prices are aimed at increasing charger usage on days with traditionally lower demand.
  • Expected Impact: A projected increase in charger use by 15% during these days, based on previous underutilisation patterns.
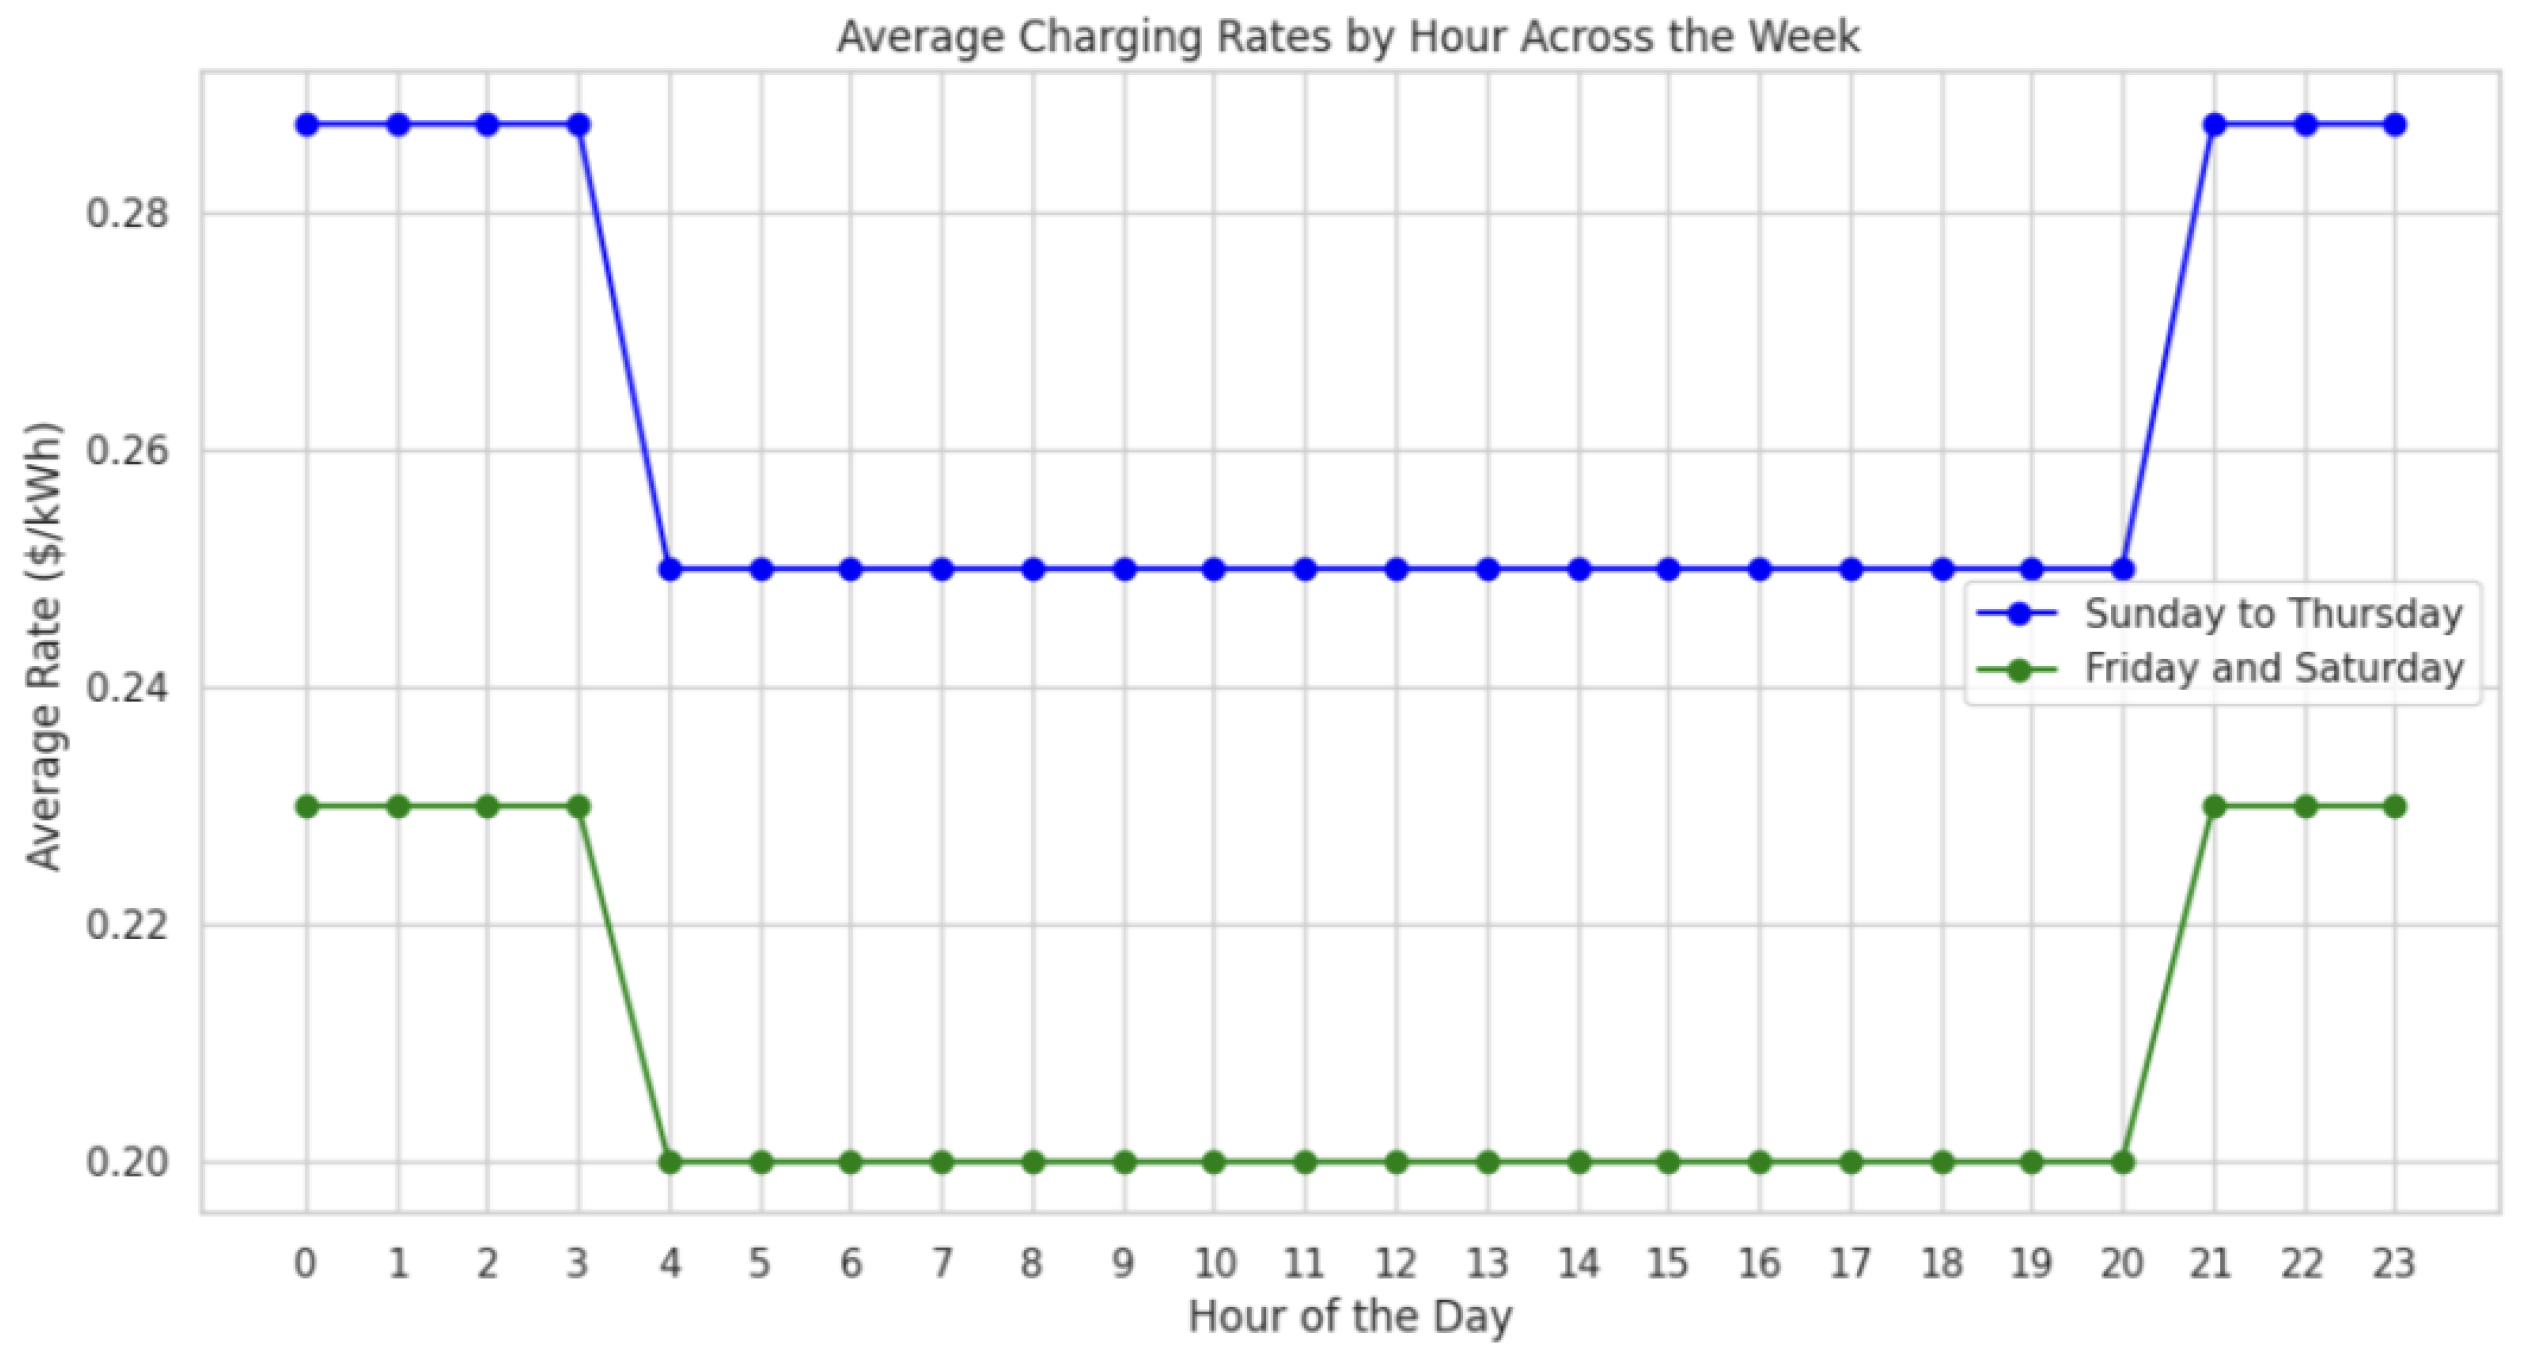
  • Hour-Based Pricing.
  • Peak Hours (9:00 PM to 4:00 AM):
     
    15% price increase to manage congestion.
     
    New Price: 0.2875 USD/kWh (Sunday–Thursday), 0.23 USD/kWh (Friday and Saturday).
  • Justification: Higher prices during peak hours are designed to stagger charging times, reducing peak load.
  • Expected Impact: Reduction in peak hour congestion by 25%, encouraging off-peak usage.
  • Off-Peak Hours (4:00 AM to 9:00 PM):
     
    Standard rate of 0.25 USD/kWh (Sunday–Thursday), 0.20 USD/kWh (Friday and Saturday).
  • Justification: These rates aim to maintain a steady flow of users outside of peak times.
  • Expected Impact: Consistent utilisation during off-peak hours without discouraging users due to high costs.
  • Federal Holiday Pricing.
  • Discount: Additional 20% off the total price to encourage federal holiday charging.
  • Justification: The federal holiday discount is aimed at increasing usage during typically low-usage days, leveraging reduced rates to attract users.
  • Expected Impact: An increase in charger usage by 27.8% on federal holidays compared to current numbers.
Figure 10 shows the pricing rate assigned to each hour, with higher rates applied during peak hours:

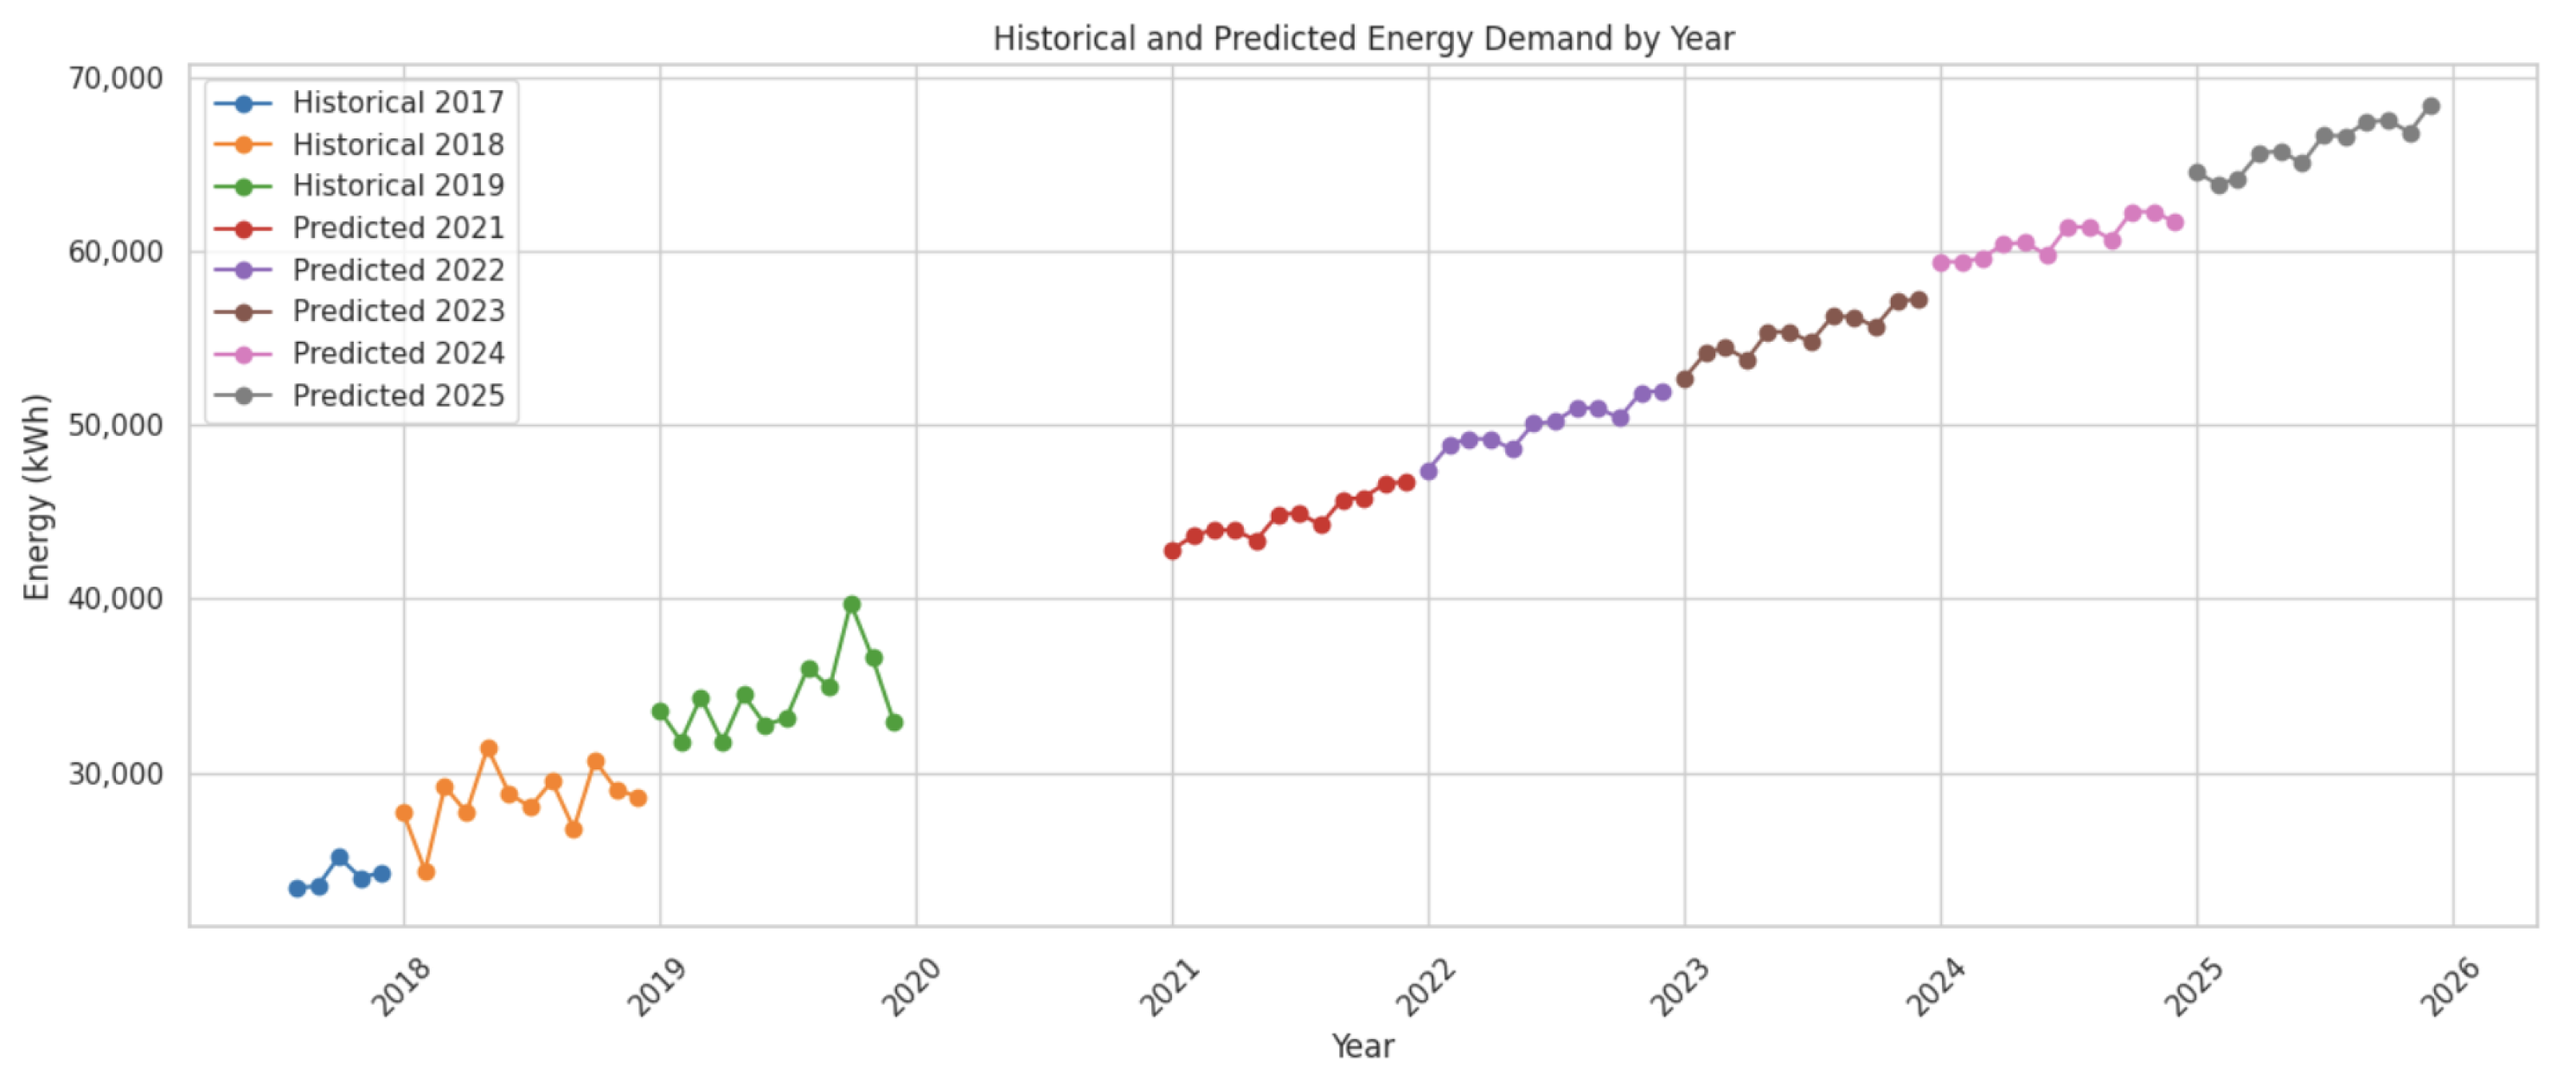
4.3. Demand Forecasting Model 

This model builds on the dynamic pricing strategy by addressing cases where pricing alone fails to manage demand. Such cases include periods of persistent overcapacity, users with fixed schedules, and regions where geographical or socioeconomic constraints limit responsiveness to price signals. The goal is to identify areas that require additional EV charging infrastructure to ensure fair and efficient access.
The SARIMAX model is used to forecast demand at individual charging stations based on historical usage data. The process involves combining date and time into a unified datetime field, extracting temporal features (e.g., year, month), and excluding data from 2020 to avoid distortions. Monthly sessions are aggregated and used to predict demand trends from 2021 to 2025 using tuned SARIMAX parameters.
This approach follows a review of user behaviour under dynamic pricing. Continuous full-capacity periods and limited flexibility in user schedules—due to work, school, or medical commitments—can reduce service reliability and increase dissatisfaction. Forecasting supports proactive infrastructure planning to address such constraints.
The dataset includes 47 charging stations. Of these, 14 were active only during 2020. Since the dataset ends in 2020, two possibilities arise:
  • These stations started and ceased operations within 2020, possibly due to the COVID-19 pandemic.
  • They continued operating beyond 2020, but this cannot be confirmed from the available data.
In both scenarios, lack of prior or follow-up data makes demand forecasting infeasible due to the absence of meaningful trends.
  • Stations operating exclusively in 2020:
1. 
PALO ALTO CA/BRYANT #1
2. 
PALO ALTO CA/SHERMAN 1
3. 
PALO ALTO CA/SHERMAN 11
4. 
PALO ALTO CA/SHERMAN 14
5. 
PALO ALTO CA/SHERMAN 15
6. 
PALO ALTO CA/SHERMAN 17
7. 
PALO ALTO CA/SHERMAN 2
8. 
PALO ALTO CA/SHERMAN 3
9. 
PALO ALTO CA/SHERMAN 4
10.
PALO ALTO CA/SHERMAN 5
11.
PALO ALTO CA/SHERMAN 6
12.
PALO ALTO CA/SHERMAN 7
13.
PALO ALTO CA/SHERMAN 8
14.
PALO ALTO CA/SHERMAN
For the modelling process, while conventional time series approaches often include explicit train–test splitting for accuracy validation, the focus in this study was on long-term trend estimation rather than short-horizon prediction. The model was trained on the full dataset (excluding 2020) to maximise seasonal pattern detection and improve the stability of extended forecasts. Given the policy-oriented context of the analysis, this approach was considered appropriate.
A detailed set of graphs illustrating the monthly kilowatt-hour (kWh) demand for each EV charging station, along with projected future demand, is provided in Supplementary Materials Figures S1–S8. These visualisations highlight historical usage trends and anticipated future needs while omitting data from the year 2020 due to potential anomalies caused by the COVID-19 pandemic.
The graph below illustrates the average duration of charging sessions across some stations throughout the day. Each line represents a specific charging station, capturing how charging durations fluctuate hourly. This clear visual representation allows for a straightforward understanding of when and how long vehicles are typically charged at different locations, highlighting the diverse charging behaviour at each station as the day progresses:
Figure 11 shows notable peaks in charging durations during the early morning and late night hours, with more consistent and shorter durations throughout the day. This consistent pattern across all hours at each station aligns with the findings from previous investigations into hourly demand that have been conducted. Identifying these patterns, where they exist, is crucial for pinpointing which stations are most frequently used and at what times. This provides a comprehensive view of charging station utilisation throughout a typical day, essential for assessing infrastructure needs if dynamic pricing measures are insufficient.
When plotting the geographical locations of each station using their latitude and longitude coordinates, it has been noticed that some stations have multiple pairs of coordinates. This variation can be attributed to several factors, including:
(1) 
Measurement Variability: Small variations in coordinates could be due to GPS accuracy or the way coordinates are recorded. This can result in slightly different coordinates for the same physical location.
(2) 
Location Precision: The coordinates might be reported with different levels of precision, or the station might have multiple charging points or sensors that report slightly different coordinates.
To fulfill the objectives of this research, the multiple coordinates for the same stations were aggregated by calculating the average latitude and longitude for each station and then graphed on a map using GeoPandas, which transforms the DataFrame into a GeoDataFrame that integrates spatial information, enabling the plotting of points based on latitude and longitude. The matplotlib is used to set up the visual framework, plotting the GeoDataFrame with specific aesthetic parameters. Contextily enhances the plot by adding a basemap from OpenStreetMap [45], providing a real-world geographic context to the data points. This approach results in a central geographical point for each station, consolidating various coordinates into a single representative location. Additionally, the stations were grouped based on their location to evaluate the ability of users to move to another station close by or whether they had to move to a completely different location to get the service. The resulting geographic distributions are available Supplementary Materials Figures S9–S17. Based on the SARIMAX analysis, under the assumption that each station is operating at full capacity and that dynamic pricing measures are ineffective, stations have been categorised into three groups: Needs, Might Need, and Does Not Need. This classification is derived from a structured visual interpretation of SARIMAX-predicted demand trends rather than from strict thresholds within the model outputs. The categorisation reflects consistent patterns observed across the forecasted utilisation curves and total plug-in hours, and it was applied uniformly by comparing projected data against historical baselines.
- 
Needs: Stations in this category exhibit a sustained upward trajectory in utilisation, approaching or exceeding practical capacity limits. They are projected to experience a significant increase in energy demand over the next five years, indicating an urgent need for infrastructure expansion or enhancement.
- 
Might Need: These stations display moderate growth trends or intermittent peaks in demand. While not immediately critical, they may require upgrades or additional resources in the near future, particularly if fluctuations in peak demand become more frequent or pronounced.
- 
Does Not Need: Stations in this group demonstrate flat or declining demand, with utilisation expected to remain within current capacity. As such, they do not warrant additional infrastructure investment in the short to medium term.
Table 3 summarises the categorisation of charging stations in Palo Alto based on projected infrastructure needs:
To sum up, the SARIMAX analysis provides a clear framework for future planning and resource allocation among the examined stations. Given the categorisation into “Needs”, “Might Need”, and “Does Not Need”, the decision-maker is better equipped to prioritise investments and interventions. Stations classified under “Needs” require immediate attention to manage the anticipated surge in demand, whereas those in the “Might Need” category present potential risk and need continuous observation. Stations in the “Do Not Need” group can maintain current operations and enhance them with the dynamic pricing measures assigned without additional infrastructure resources for the next five years, allowing for a more focused allocation of funds and efforts towards areas with more pressing demands. This strategy ensures that infrastructure developments are responsive, efficiently meeting the changing needs of the energy sector. Furthermore, this categorisation supports ongoing debates around equitable access to EV charging. Stations flagged as “Needs” are often located in high-demand or underserved areas, where insufficient access could create bottlenecks for users without home charging options. Prioritising infrastructure expansion in these areas can help mitigate socioeconomic disparities in EV adoption and ensure that mobility benefits are equitably distributed. Without such targeted planning, dynamic pricing strategies may risk reinforcing inequality by favouring users with greater schedule flexibility or access to less-congested stations.
Enhancing the infrastructure can be achieved through a variety of strategies, including:
  • Ultra-Fast Charging Networks: The development of ultra-fast charging networks can revolutionise EV charging by significantly reducing charging times to just a few minutes. This advancement will enhance convenience for EV owners, making the charging process comparable to traditional refueling times. As a result, range anxiety will be mitigated, encouraging more people to adopt EVs. Additionally, ultra-fast charging will make EVs more practical for daily use and accessible to those who lack home charging infrastructure [46].
  • Wireless Charging Technology: Wireless charging technology allows EVs to charge through an electromagnetic field without the need for physical cables. This method improves convenience by eliminating the need to connect to a charging point and can reduce installation costs associated with traditional infrastructure. Wireless charging enables continuous charging while the vehicle is in use as charging starts automatically as soon as the vehicle enters an area with a wireless charging pad, thus improving efficiency and reducing wait times at charging stations [46].
  • V2G Technology: V2G technology allows EVs to both draw power from and supply it back to the grid. This bi-directional flow enhances grid stability and helps integrate renewable energy by balancing supply fluctuations. It can offer financial incentives to EV owners through revenue from excess power and provides utilities with a flexible grid resource, potentially reducing the need for costly infrastructure upgrades [46].
  • Providing More Charging Stations: Expanding the network of charging stations involves evaluating potential sites based on available land, accessibility, and regulatory approvals. This expansion can focus on adding stations in high-demand areas or nearby regions. It is essential to consider land availability, obtain necessary approval from landowners and government authorities, and ensure that the new locations are accessible for timely deployment and use.

5. Conclusions

This study provides a comprehensive case study analysis of environmental benefits, dynamic pricing strategies, and infrastructure requirements for EV charging networks. While the results are inherently tied to the conditions in Palo Alto, they offer policy-relevant insights that may inspire similar initiatives in other regions, particularly those with comparable urban and environmental contexts. Utilising an extensive dataset from Palo Alto, California, this study employs statistical analysis, econometrics, and machine learning techniques to offer significant insights into the deployment and optimisation of EV charging systems.

5.1. Environmental Impact Assessment

The environmental analysis demonstrated notable reductions in GHG emissions and significant gasoline savings due to the adoption of EVs. Based on the data available, between 1 August 2017, and the end of 2020, for the 33 stations that began operating before 2020, EV usage has led to a decrease of approximately 367,195 kg of CO2 emissions, which is equivalent to around 367 tons. To put this into perspective, a typical passenger vehicle emits about 4.6 tons of carbon dioxide annually [47]. This reduction is similar to taking approximately 80 conventional vehicles off the road during that period, alongside gasoline savings amounting to roughly 109,284 gallons. Considering that, for example, the average vehicle on U.S. roads gets around 25 miles per gallon [48], these gasoline savings correspond to about 2.73 million miles of driving. Looking ahead, projections indicate that between 2021 and 2025, an additional reduction of approximately 1,392,046 kg of CO2 emissions could be achieved, which is comparable to eliminating the emissions of about 303 passenger vehicles. Furthermore, the anticipated gasoline savings during this period are expected to reach around 414,299 gallons, translating to approximately 10.36 million miles of driving avoided.

5.2. Dynamic Pricing Strategies

The implementation of dynamic pricing models shows potential to optimise profitability and accessibility. The measurements suggested for this model are as follows:
  • Days With Typical Usage (Sunday–Thursday): Standard rate of 0.25 USD/kWh.
  • Underutilised Days (Friday and Saturday): Offers a 20% discount, setting the new rate at 0.20 USD/kWh.
  • Hour-Based Pricing:
     
    Peak Hours (9:00 PM to 4:00 AM): Price increases by 15%, making the price 0.2875 USD/kWh (Sunday–Thursday) and 0.23 USD/kWh (Friday and Saturday).
     
    Off-Peak Hours (4:00 AM to 9:00 PM): Maintains standard rates of 0.25 USD/kWh (Sunday–Thursday) and 0.20 USD/kWh (Friday and Saturday).
    The effectiveness of any hour-based tariff ultimately depends on real-world charging behaviour; rigorous discrete-choice or other behavioural economics studies are still required to confirm that users will actually shift demand in response to these price signals.
  • Federal Holiday Pricing: An additional 20% discount on overall price.

5.3. Implications for Policy and Urban Planning

These findings provide essential data for policymakers and urban planners to create incentives for more EV charging stations and supportive policies. They also highlight the importance of environmental sustainability and economic feasibility for comprehensive development. Moreover, the findings underscore the need to integrate EV charging infrastructure with clean energy sources. As renewable generation becomes more prevalent, aligning charging demand with periods of high solar or wind availability through dynamic pricing and smart grid technologies can significantly enhance grid stability and reduce emissions. This synergy between EV adoption and clean energy integration is vital to achieving national and global climate targets.

5.4. Recommendations for Future Research

We highlight the following future directions related to this work:
(1) 
Dynamic Pricing Based On Location:
Implement dynamic pricing strategies based on the location and congestion levels of each charging station. By adjusting prices according to how crowded each station is, we can effectively redirect traffic from busier locations to less-utilised areas. This strategy will not only improve service quality for users but also optimise station usage across different locations.
(2) 
Hourly Dynamic Pricing and Mobile Tracking:
Create an hourly dynamic pricing model for EV charging stations which adjusts rates based on real-time demand. This pricing strategy could be accompanied with a user-friendly mobile application that allows users to view current charging costs at different stations. This approach encourages users to charge their vehicles during off-peak hours and at stations with less demand, enhancing stations’ efficiency and user convenience while promoting cost savings and reducing congestion at highly frequented locations.
(3) 
Integration of Renewable Energy Sources:
Future studies should explore the practical implications and logistical challenges of integrating solar and wind energy into EV charging networks. This includes focusing on storage solutions for the intermittent nature of renewable sources and the economic impacts of such integrations. Research could also evaluate grid resilience with increased renewable integrations, modelling scenarios where large-scale renewable adoption influences energy prices and charging station profitability [26].
(4) 
Advanced Battery Technology Impact:
Investigate the impact of advancements in battery technologies, such as solid-state or lithium–sulfur batteries, on the dynamics of EV charging demand. Studies should quantify reductions in charging times and analyse the life cycle impacts of new battery technologies, including resource extraction, manufacturing emissions, recycling capabilities, and overall environmental footprints.
(5) 
Smart Charging Systems and Grid Interactions:
Develop models to optimise smart charging systems that can dynamically adjust to changes in electricity supply and demand, user behaviour, and pricing fluctuations. Explore the potential of V2G technologies and other bidirectional energy trade to provide grid services and evaluate the economic incentives necessary to encourage bidirectional energy exchange among EV owners [49,50,51].
(6) 
User Behaviour Longitudinal Studies:
Conduct long-term studies to observe how EV owners adapt their charging habits in response to changes in charging infrastructure, pricing models, and technology. Examine the effectiveness of different informational campaigns and incentives in modifying consumer behaviour towards more efficient and grid-supportive charging practices.
(7) 
Economic Impact Comprehensive Analysis:
Perform analysis on the economic impact of widespread EV adoption, including job creation, industry shifts, and consumer spending, with a focus on the macroeconomic effects of transitioning to electric transport.
(8) 
Cross-City and Cross-Regional Comparative Studies:
Expand research to include comparative analyses between different cities or regions with varying degrees of EV adoption and infrastructure development. Investigate the role of local policies, economic incentives, and urban planning in accelerating the transition to electric mobility.
(9) 
Incorporation of Regionally Adjusted Emission Factors:
This study used fixed conversion rates (0.42 kg CO2/kWh and 0.125 gallons/kWh) to estimate GHG and petrol savings, but this approach overlooks regional differences in grid carbon intensity and changes in energy generation. For example, electricity from coal-heavy grids emits more CO2 than that from renewable sources. Grid decarbonisation, policy shifts, and seasonal variations can all affect EV charging emissions. Future research should use dynamic, region-specific emission factors, possibly from real-time grid data (e.g., via energy regulator APIs). Sensitivity analyses across various energy mixes could also yield more accurate impact assessments. While beyond this study’s scope, these factors warrant further investigation.
(10) 
Behavioural Modelling for Dynamic Pricing Response:
Future studies should integrate behavioural economics and discrete choice theory to simulate and validate EV user responses to dynamic pricing. Models such as multinomial or nested logit can estimate how factors like pricing, convenience, and time-of-day affect user decisions. This behavioural modelling can then inform more accurate pricing strategies that account for variability in user preferences and socioeconomic backgrounds.
(11) 
Integration of Operational Benchmarks into Demand Modelling:
Charging station heterogeneity and operational constraints, such as throughput capacity, plug-in duration, and queue length, can be incorporated into demand forecasting and station categorisation. Using these parameters as benchmarks may improve the accuracy of infrastructure sufficiency assessments and provide actionable guidance for expansion planning. Future iterations could enhance the credibility and reproducibility of this classification by calibrating visual assessments against formal operational benchmarks, such as thresholds for connector occupancy, average plug-in durations, or the frequency of queuing. This would help translate trend-based observations into reproducible and quantifiable metrics.
(12) 
Controlling for Multiple Comparisons in Hypothesis Testing:
To improve the reliability of statistical inferences, future analyses should apply multiple testing correction methods such as Bonferroni or Holm adjustments when conducting hypothesis tests across several categories. This would help control the increased risk of Type I errors resulting from multiple comparisons.
(13) 
Enhancing Accuracy in Environmental Projections:
Incorporating dynamic emissions factors or conducting sensitivity analysis can improve the accuracy of environmental projections.

Supplementary Materials

The following supporting information can be downloaded at: https://www.mdpi.com/article/10.3390/wevj16080410/s1, Figure S1: Monthly kWh Demand and 5-Year Forecast for HAMILTON Charging Stations (Excluding 2020); Figure S2: Monthly kWh Demand and 5-Year Forecast for CAMBRIDGE Charging Stations (Excluding 2020); Figure S3: Monthly kWh Demand and 5-Year Forecast for BRYANT Charging Stations (Excluding 2020); Figure S4: Monthly kWh Demand and 5-Year Forecast for HIGH Charging Stations (Excluding 2020); Figure S5: Monthly kWh Demand and 5-Year Forecast for MPL Charging Stations (Excluding 2020); Figure S6: Monthly kWh Demand and 5-Year Forecast for TED THOMPSON Charging Stations (Excluding 2020); Figure S7: Monthly kWh Demand and 5-Year Forecast for WEBSTER Charging Stations (Excluding 2020); Figure S8: Monthly kWh Demand and 5-Year Forecast for RINCONADA LIB Charging Stations (Excluding 2020); Figure S9: Distribution of Charging Stations for All Locations; Figure S10: Distribution of Charging Stations for HAMILTON Locations; Figure S11: Distribution of Charging Stations for HIGH Locations; Figure S12: Distribution of Charging Stations for BRYANT Locations; Figure S13: Distribution of Charging Stations for TED THOMPSON Locations; Figure S14: Distribution of Charging Stations for CAMBRIDGE Locations; Figure S15: Distribution of Charging Stations for WEBSTER Locations; Figure S16: Distribution of Charging Stations for RINCONADA LIB Locations; Figure S17: Distribution of Charging Stations for MPL Locations.

Author Contributions

Conceptualization, O.J., F.A. and M.N.; Methodology, O.J.; Validation, O.J.; Formal analysis, O.J.; Investigation, O.J.; Resources, F.A.; Data curation, F.A.; Writing—original draft, O.J.; Writing—review & editing, F.A., M.N. and N.S.; Supervision, F.A. and M.N.; Project administration, F.A.; Funding acquisition, N.S. All authors have read and agreed to the published version of the manuscript.

Funding

The research leading to this publication was partially funded by the UKRI/EPSRC Network Plus “A Green Connected and Prosperous Britain”, grant number EP/W034204/1.

Data Availability Statement

The dataset presented in this article is openly available and can be accessed from the following source: https://www.kaggle.com/datasets/venkatsairo4899/ev-charging-station-usage-of-california-city.

Conflicts of Interest

The authors declare no conflicts of interest.

References

  1. Louati, A.; Louati, H.; Kariri, E.; Neifar, W.; Farahat, M.A.; El-Hoseny, H.M.; Hassan, M.K.; Khairi, M.H. Sustainable Urban Mobility for Road Information Discovery-Based Cloud Collaboration and Gaussian Processes. Sustainability 2024, 16, 1688. [Google Scholar] [CrossRef]
  2. Punzo, G.; Panarello, D.; Castellano, R. Sustainable urban mobility: Evidence from three developed European countries. Qual. Quant. 2022, 56, 3135–3157. [Google Scholar] [CrossRef]
  3. Tran, M.; Banister, D.; Bishop, J.D.; McCulloch, M.D. Realizing the electric-vehicle revolution. Nat. Clim. Change 2012, 2, 328–333. [Google Scholar] [CrossRef]
  4. Noel, L.; Zarazua de Rubens, G.; Sovacool, B.K.; Kester, J. Fear and loathing of electric vehicles: The reactionary rhetoric of range anxiety. Energy Res. Soc. Sci. 2019, 48, 96–107. [Google Scholar] [CrossRef]
  5. Ayaz, F.; Nekovee, M. Towards Net-Zero Goal through Altruistic Prosumer based Energy Trading among Connected Electric Vehicles. In Proceedings of the 2023 IEEE Vehicular Networking Conference (VNC), Istanbul, Turkiye, 26 April 2023; pp. 89–96. [Google Scholar] [CrossRef]
  6. Neaimeh, M.; Salisbury, S.D.; Hill, G.A.; Blythe, P.T.; Scoffield, D.R.; Francfort, J.E. Analysing the usage and evidencing the importance of fast chargers for the adoption of battery electric vehicles. Energy Policy 2017, 108, 474–486. [Google Scholar] [CrossRef]
  7. Szabo, L.; Vascan, I. A Brief History of Electric Vehicles; Technical University of Cluj-Napoca: Cluj-Napoca, Romania, 2022; Available online: https://www.researchgate.net/publication/363520342_A_Brief_History_of_Electric_Vehicles (accessed on 13 June 2025).
  8. Arquivo.pt. Today in Technology History—6 July 2009. Available online: https://arquivo.pt/wayback/20091015184824/http:/www.tecsoc.org/pubs/history/2001/jul6.htm (accessed on 13 June 2025).
  9. Vepachedu Sreenivasarao. The History of the Electric Car. 2017. Available online: https://www.researchgate.net/publication/319787053_THE_HISTORY_OF_THE_ELECTRIC_CAR (accessed on 13 June 2025).
  10. Electric Car Charger Australia. The Short History of Electric Car Chargers. n.d. Available online: https://electriccarcharger.au/short-history-of-electric-car-chargers/ (accessed on 13 June 2025).
  11. Vilchez, J.J.; Jochem, P.; Fichtner, W. EV Market Development Pathways – An Application of System Dynamics for Policy Simulation. World Electr. Veh. J. 2013, 6, 1030–1038. [Google Scholar] [CrossRef]
  12. Creutzig, F.; Jochem, P.; Edelenbosch, O.Y.; Mattauch, L.; Van Vuuren, D.P.; Mccollum, D.; Minx, J. Transport: A roadblock to climate change mitigation? Science 2015, 350, 911–912. [Google Scholar] [CrossRef] [PubMed]
  13. City of Palo Alto. Electric Vehicles—City of Palo Alto, CA. n.d. Available online: https://www.cityofpaloalto.org/City-Hall/Sustainability/Electric-Vehicles (accessed on 13 June 2025).
  14. Liu, Z.; Wen, F.; Ledwich, G. Optimal planning of electric-vehicle charging stations in distribution systems. IEEE Trans. Power Deliv. 2013, 28, 102–110. [Google Scholar] [CrossRef]
  15. Zhao, Z.; Lee, C.K. Dynamic Pricing for EV Charging Stations: A Deep Reinforcement Learning Approach. IEEE Trans. Transp. Electrif. 2022, 8, 2456–2468. [Google Scholar] [CrossRef]
  16. Faisal, S.; Soni, B.P.; Goyal, G.R.; Bakhsh, F.I.; Husain, D.; Ahmad, A. Reducing the Ecological Footprint and charging cost of electric vehicle charging station using renewable energy based power system. e-Prime Adv. Electr. Eng. Electron. Energy 2024, 7, 100398. [Google Scholar] [CrossRef]
  17. Jin, L.; Slowik, P. Literature Review of Electric Vehicle Consumer Awareness and Outreach Activities. 2017. Available online: https://theicct.org/wp-content/uploads/2021/06/Consumer-EV-Awareness_ICCT_Working-Paper_23032017_vF.pdf (accessed on 13 June 2025).
  18. Limmer, S. Dynamic Pricing for Electric Vehicle Charging—A Literature Review. Energies 2019, 12, 3574. [Google Scholar] [CrossRef]
  19. Narasipuram, R.P.; Mopidevi, S. A technological overview & design considerations for developing electric vehicle charging stations. J. Energy Storage 2021, 43, 103225. [Google Scholar] [CrossRef]
  20. EZ EV Electric. The History of EV Charging Infrastructure. n.d. Available online: https://www.ezevelectric.com/the-history-of-ev-charging-infrastructure/ (accessed on 13 June 2025).
  21. Helmers, E.; Marx, P. Electric Cars: Technical Characteristics and Environmental Impacts. Environ. Sci. Eur. 2012, 24, 14. [Google Scholar] [CrossRef]
  22. Congressional Budget Office. Emissions of Carbon Dioxide in the Transportation Sector: At a Glance. 2022. Available online: https://www.cbo.gov/publication/58566 (accessed on 13 June 2025).
  23. International Council on Clean Transportation. U.S. Electric Vehicle Sales Soar into 2024. 2024. Available online: https://theicct.org/us-ev-sales-soar-into-24-jan24/ (accessed on 13 June 2025).
  24. Andrenacci, N.; Valentini, M.P. A Literature Review on the Charging Behaviour of Private Electric Vehicles. Appl. Sci. 2023, 13, 12877. [Google Scholar] [CrossRef]
  25. Yap, K.Y.; Chin, H.H.; Klemeš, J.J. Solar Energy-Powered Battery Electric Vehicle charging stations: Current development and future prospect review. Renew. Sustain. Energy Rev. 2022, 169, 112862. [Google Scholar] [CrossRef]
  26. Ayaz, F.; Nekovee, M. Smart Energy Management with Optimized Prosumerism for Achieving Dynamic Net-Zero Balance in Electrified Road Transport Networks. arXiv 2023, arXiv:2312.08162. [Google Scholar] [CrossRef]
  27. Morabito, D.; Imtiaz, M.H. Wireless Charging of Electric Vehicles: A Review. 2023. Available online: https://www.researchgate.net/publication/375924486_Wireless_Charging_of_Electric_Vehicles_a_Review (accessed on 13 June 2025).
  28. Cedillo, M.H.; Sun, H.; Jiang, J.; Cao, Y. Dynamic pricing and control for EV charging stations with solar generation. Appl. Energy 2022, 326, 119920. [Google Scholar] [CrossRef]
  29. Kaggle Contributor: Venkatsairo4899. EV Charging Station Usage of California City. 2024. Available online: https://www.kaggle.com/datasets/venkatsairo4899/ev-charging-station-usage-of-california-city?resource=download (accessed on 25 February 2025).
  30. The Pandas Development Team. Pandas: Python Data Analysis Library. 2024. Available online: https://pandas.pydata.org (accessed on 25 February 2025).
  31. Scikit-learn Developers. Scikit-learn: Machine Learning in Python. 2024. Available online: https://scikit-learn.org/stable/ (accessed on 25 February 2025).
  32. Matplotlib Development Team. Matplotlib: Visualization with Python. 2024. Available online: https://matplotlib.org (accessed on 25 February 2025).
  33. NumPy Developers. NumPy: The Fundamental Package for Scientific Computing with Python. 2024. Available online: https://numpy.org (accessed on 25 February 2025).
  34. The Mercury News. Palo Alto to Charge Fee for Electric Vehicle Charging. 2017. Available online: https://www.mercurynews.com/2017/07/26/palo-alto-to-charge-for-a-charge-at-ev-stations/ (accessed on 13 June 2025).
  35. U.S. Government. Federal Holidays in the United States. 2024. Available online: https://www.usa.gov/holidays (accessed on 13 June 2025).
  36. Moghaddam, Z.; Ahmad, I.; Habibi, D.; Masoum, M.A. A coordinated dynamic pricing model for electric vehicle charging stations. IEEE Trans. Transp. Electrif. 2019, 5, 226–238. [Google Scholar] [CrossRef]
  37. Borenstein, S.; Jaske, M.; Rosenfeld, A.; Org, E. UC Berkeley Recent Work Title Dynamic Pricing, Advanced Metering, and Demand Response in Electricity Markets. 2002. Available online: https://escholarship.org/uc/item/11w8d6m4 (accessed on 13 June 2025).
  38. Scikit-Learn Developers. StandardScaler—Scikit-Learn 1.5.1 Documentation. 2024. Available online: https://scikit-learn.org/stable/modules/generated/sklearn.preprocessing.StandardScaler.html (accessed on 13 June 2025).
  39. Onyeaka, H.; Anumudu, C.K.; Al-Sharify, Z.T.; Egele-Godswill, E.; Mbaegbu, P. COVID-19 pandemic: A review of the global lockdown and its far-reaching effects. Sci. Prog. 2021, 104, 368504211019854. [Google Scholar] [CrossRef] [PubMed]
  40. IBM. What Is Linear Regression? 2021. Available online: https://www.ibm.com/topics/linear-regression (accessed on 13 June 2025).
  41. Shiksha Online. Ridge Regression vs. Lasso Regression. 2021. Available online: https://www.shiksha.com/online-courses/articles/ridge-regression-vs-lasso-regression/ (accessed on 13 June 2025).
  42. Scikit-Learn Developers. Ridge—Scikit-Learn 1.5.1 Documentation. 2024. Available online: https://scikit-learn.org/stable/modules/generated/sklearn.linear_model.Ridge.html (accessed on 13 June 2025).
  43. DataScientest. SARIMAX Model: What Is It? How Can It Be Applied to Time Series? 2024. Available online: https://datascientest.com/en/sarimax-model-what-is-it-how-can-it-be-applied-to-time-series (accessed on 13 June 2025).
  44. EV Database. Useable Battery Capacity of Full Electric Vehicles Cheatsheet. n.d. Available online: https://ev-database.org/cheatsheet/useable-battery-capacity-electric-car (accessed on 13 June 2025).
  45. GeoPandas Developers. GeoPandas 1.0.1 Documentation. 2013. Available online: https://geopandas.org/en/stable/ (accessed on 13 June 2025).
  46. Priyadarshan, P. View of Electric Vehicle Charging Infrastructure: Current Status, Challenges, and Future Developments. 2019. Available online: https://research.tensorgate.org/index.php/IJIAC/article/view/25/23 (accessed on 13 June 2025).
  47. U.S. Environmental Protection Agency. Greenhouse Gas Emissions from a Typical Passenger Vehicle. 2023. Available online: https://www.epa.gov/greenvehicles/greenhouse-gas-emissions-typical-passenger-vehicle (accessed on 5 May 2025).
  48. U.S. Environmental Protection Agency. EPA Report: U.S. Cars Achieve Record High Fuel Economy and Low Emission Levels as Companies Fully Comply with Standards. 2023. Available online: https://www.epa.gov/newsreleases/epa-report-us-cars-achieve-record-high-fuel-economy-and-low-emission-levels-companies (accessed on 5 May 2025).
  49. Ayaz, F.; Nekovee, M. Quantum Optimization for Bidirectional Telecom Energy Exchange and Vehicular Edge Computing in Green 6G Networks. In Proceedings of the 2024 IEEE International Conference on Communications, Control, and Computing Technologies for Smart Grids (SmartGridComm), Oslo, Norway, 17–20 September 2024; pp. 385–390. [Google Scholar] [CrossRef]
  50. Ayaz, F.; Nekovee, M.; Saeed, N. Blockchain-based Energy Trading among UAVs and Base Stations for Net-Zero. In Proceedings of the 2024 IEEE 10th World Forum on Internet of Things (WF-IoT), Ottawa, ON, Canada, 10–13 November 2024; pp. 1–6. [Google Scholar] [CrossRef]
  51. Ayaz, F.; Nekovee, M.; Ibraheem, A.F. Telecom-to-Grid: Supercharging 6G’s Contribution for Reliable Net-Zero. IEEE Reliab. Mag. 2025, 2, 40–48. [Google Scholar] [CrossRef]
Figure 1. Energy consumption trends (2011–2020), highlighting dips in 2018 and 2020.
Wevj 16 00410 g001
Figure 2. Weekly EV charging times vs. average.
Wevj 16 00410 g002
Figure 3. Mean charging times: federal holiday vs. non-federal holiday.
Wevj 16 00410 g003
Figure 4. Correlation heatmap of charging session attributes, highlighting the interdependence between energy (kWh), gasoline savings, and GHG savings.
Wevj 16 00410 g004
Figure 5. Monthly historical and predicted energy demand by year.
Wevj 16 00410 g005
Figure 6. Comparison of daily station utilisation showing occupied and empty hours across various charging stations.
Wevj 16 00410 g006
Figure 7. Average total charging duration per day.
Wevj 16 00410 g007
Figure 8. Price Per kWh For Each Station.
Wevj 16 00410 g008
Figure 9. Average total duration (hours) for each hour of the day with peak hours indicated by red bars exceeding 3.5 h.
Wevj 16 00410 g009
Figure 10. Average charging rates throughout the day.
Wevj 16 00410 g010
Figure 11. Hourly trends in EV charging duration.
Wevj 16 00410 g011
Table 1. Feature Selection for Different Models.
FeatureModelRole
Charging Time (seconds)Green House Gases and Gasoline Savings ModelDuration of the charging session, affecting energy consumption.
Total Duration (seconds)Green House Gases and Gasoline Savings ModelOverall event duration, impacting energy use and GHG savings.
Weekday or WeekendGreen House Gases and Gasoline Savings Model
Dynamic Pricing Model
Demand Forecasting Model
Indicates if the event occurred on a weekday or weekend, influencing charging patterns.
HolidayGreen House Gases and Gasoline Savings Model
Dynamic Pricing Model
Demand Forecasting Model
Indicates if the event occurred on a federal holiday, affecting charging behaviour.
Energy (kWh)Green House Gases and Gasoline Savings Model
Dynamic Pricing Model
Demand Forecasting Model
Amount of energy consumed, directly influencing GHG savings, dynamic pricing, and needed infrastructure.
Port TypeGreen House Gases and Gasoline Savings ModelType of charging port used, which might affect efficiency and energy consumption.
Plug TypeGreen House Gases and Gasoline Savings ModelType of plug used, potentially influencing charging efficiency.
YearGreen House Gases and Gasoline Savings Model
Dynamic Pricing Model
Demand Forecasting Model
Year of the event, capturing trends and technological improvements.
MonthGreen House Gases and Gasoline Savings ModelMonth of the event, accounting for seasonal variations in energy use.
Day of WeekGreen House Gases and Gasoline Savings Model
Dynamic Pricing Model
Demand Forecasting Model
Day of the week, which might influence charging patterns.
Gasoline Savings (gallons)Green House Gases and Gasoline Savings ModelAmount of gasoline saved.
GHG Savings (kg)Green House Gases and Gasoline Savings ModelAmount of green house gases saved.
Price Per kWhDynamic Pricing Model
Demand Forecasting Model
The cost charged for every kilowatt-hour of electricity consumed.
YearMonthDynamic Pricing Model
Demand Forecasting Model
Captures monthly patterns across years.
Table 2. Energy, GHG, and gasoline savings (historical and predicted) across various years.
TypeYearEnergy (kWh)GHG Savings (kg)Gasoline Savings (Gallons)
Historical2017120,236.56150,499.35615,029.570
Historical2018341,885.561143,591.93642,735.695
Historical2019412,152.592173,104.08951,519.074
Predicted2021536,640.843225,389.15467,080.105
Predicted2022599,780.185251,907.67874,972.523
Predicted2023662,919.526278,426.20182,864.941
Predicted2024728,712.560306,059.27591,089.070
Predicted2025792,446.619332,827.58099,055.827
Table 3. Categorised station needs in Palo Alto, CA.
NeedsMight NeedDo Not Need
PALO ALTO CA/CAMBRIDGEPALO ALTO CA/HAMILTONPALO ALTO CA/MPL
PALO ALTO CA/HIGHPALO ALTO CA/BRYANT
PALO ALTO CA/TED THOMPSONPALO ALTO CA/WEBSTERPALO ALTO CA/RINCONDA LIB
Note—Groupings in this table are based on visual inspection of SARIMAX forecast trends, as explained in Section 4.3. Future work may formalise these categories using empirical utilisation thresholds.
Disclaimer/Publisher’s Note: The statements, opinions and data contained in all publications are solely those of the individual author(s) and contributor(s) and not of MDPI and/or the editor(s). MDPI and/or the editor(s) disclaim responsibility for any injury to people or property resulting from any ideas, methods, instructions or products referred to in the content.

