Article

Charging Ahead: Perceptions and Adoption of Electric Vehicles Among Full- and Part-Time Ridehailing Drivers in California

1
Civil and Environmental Engineering, University of California, 109 McLaughlin Hall, Berkeley, CA 94720, USA
2
Transportation Sustainability Research Center, University of California, 2150 Allston Way, Berkeley, CA 94704, USA
3
Civil and Environmental Engineering and Transportation Sustainability Research Center, University of California, 408 McLaughlin Hall, Berkeley, CA 94720, USA
*
Author to whom correspondence should be addressed.
World Electr. Veh. J. 2025, 16(7), 368; https://doi.org/10.3390/wevj16070368
Submission received: 31 May 2025 / Revised: 24 June 2025 / Accepted: 30 June 2025 / Published: 2 July 2025

Abstract

California’s SB 1014 (Clean Miles Standard) mandates ridehailing fleet electrification to reduce emissions from vehicle miles traveled, posing financial and infrastructure challenges for drivers. This study employs a mixed-methods approach, including expert interviews (n = 10), group discussions (n = 8), and a survey of full- and part-time drivers (n = 436), to examine electric vehicle (EV) adoption attitudes and policy preferences. Access to home charging and prior EV experience emerged as the most statistically significant predictors of EV acquisition. Socio-demographic variables, particularly income and age, could also influence the EV choice and sensitivity to policy design. Full-time drivers, though confident in the EV range, were concerned about income loss from the charging downtime and access to urban fast chargers. They showed a greater interest in EVs than part-time drivers and favored an income-based instant rebate at the point of sale. In contrast, part-time drivers showed greater hesitancy and were more responsive to vehicle purchase discounts (price reductions or instant rebates at the point of sale available to all customers) and charging credits (monetary incentive or prepaid allowance to offset the cost of EV charging equipment). Policymakers might target low-income full-time drivers with greater price reductions and offer charging credits (USD 500 to USD 1500) to part-time drivers needing operational and infrastructure support.

1. Introduction

As urban transportation systems continue to evolve, Transportation Network Companies (TNCs, commonly referred to as ridehailing services) such as Uber and Lyft have become notable players in expanding mobility options and influencing travel behavior. However, studies have found that TNC operations have also contributed to increased vehicle miles traveled (VMT) in cities since their emergence around 2012 in San Francisco [1]. In response to concerns about ridehailing emissions, California adopted Senate Bill 1014 (SB 1014), known as the Clean Miles Standard, in 2018 [2]. The California Air Resources Board (CARB) developed regulations under SB 1014, including setting emission reduction targets, while the California Public Utilities Commission (CPUC) is responsible for implementing and enforcing these requirements [2]. The Clean Miles Standard requires TNCs to achieve 90% electric vehicle miles traveled (eVMT) and zero grams of greenhouse gas (GHG) emissions per passenger mile by 2030 [3]. The CARB has projected that the program will contribute to statewide reductions of 93 tons of particulate matter (PM)2.5, 298 tons of nitrogen oxides (NOx), and 1.81 million metric tons of GHGs between 2023 and 2030 [4]. Under the current policy framework, the burden of transitioning to electric vehicles (EVs) largely falls on individual TNC drivers.
While electric vehicles (EVs) may offer lower long-term operating costs due to savings on fuel and maintenance, many ridehailing drivers find that EVs are not affordable and face challenges related to charging availability. Kelley Blue Book suggests that the average price of an EV is USD 57,734, compared to USD 48,799 for a gas-powered vehicle in 2025 [5]. Meanwhile, key components of EV ownership and operating costs are vehicle prices, fuel costs, maintenance costs, insurance, etc. Ju et al. found that the net total operational cost of an EV is still higher than that of an internal combustion engine (ICE) vehicle under most circumstances [6]. When it comes to demographics, a significant portion of TNC drivers come from underserved communities, often speak non-English languages at home, and rely heavily on their TNC income to support family members [7,8,9]. Within the TNC driver population, EV ownership and preferences can vary considerably based on demographic characteristics, housing conditions, and driving patterns. For instance, EV adoption among the general population is more prevalent among higher-income households with greater access to residential charging infrastructure, whereas many ridehailing drivers tend to reside in lower-income, multifamily dwellings where home charging is often not feasible [10,11,12]. These disparities suggest that socio-demographic attributes, such as income, housing types, and access to charging, may significantly influence TNC driver perceptions of EVs and their future acquisition plans.
One of the most important factors that could potentially influence EV preferences among ridehailing drivers is the hours worked and miles driven during a week, namely a full-time or part-time TNC driver status. While the division between full- and part-time drivers is usually loosely defined, full-time drivers typically drive longer hours (e.g., over 30 h per week) and treat ridehailing as their main source of income. As a result, full-time drivers are more likely to be affected by SB 1014 since they have less flexibility to switch jobs if they are not able to acquire EVs for their ridehailing work. Although full-time TNC drivers represent a relatively smaller share of the overall driver population, they account for more than half of all TNC trips [13]. Part-time drivers usually drive infrequently (sometimes occasionally or seasonally) and offer much fewer trips compared to full-time drivers. Part-time drivers may only treat ridehailing as a supplementary/secondary income source, already having a full-time job but needing extra income to support their living/families [14]. Considering the diverging driving patterns among full- and part-time drivers, their perceptions of EVs may also differ. In fact, SB 1014 did not define any driver groups to whom the policy is applicable. Rather, general EV transition requirements were set for all ridehailing drivers. We examine how full- and part-time TNC drivers respond to SB 1014 given a range of EV models and supportive incentive options and the policy’s potential impact on ridehailing job stability.
While the existing literature addresses EV adoption patterns and introduces mathematical algorithms to estimate the determinants of EV adoption from multiple angles, they do not distinguish impacts by different driver types (i.e., full-/part-time drivers). This study explores the distinction between full- and part-time drivers and seeks to investigate ridehailing driver vehicle usage patterns and EV perceptions across a spectrum of individual backgrounds and personal characteristics. We employ a mixed-methods approach, combining qualitative methods (i.e., interviews and small group discussions) and a quantitative analysis (i.e., statistical modeling) to identify the key factors shaping EV adoption and explore policy options that could lower adoption barriers for TNC drivers. In this paper, we will investigate a variety of policy terms and definitions that will be discussed. These terms are defined and used consistently throughout as follows:
  • Vehicle purchase discount (instant rebate at point of sale): The fixed instant vehicle price reduction at the point of sale applied to all customers.
  • Tax credit: A fixed credit that is applied after the vehicle is sold, directly reducing the amount of tax owed by any customer.
  • Credit for charging infrastructure (charging credit): A fixed monetary incentive or prepaid allowance provided to offset the cost of EV charging equipment. This type of credit is aimed at individuals, businesses, or property owners who install charging infrastructure. It can help cover charging equipment costs.
  • Charging discount: A reduction in the cost of charging an EV, typically offered to encourage EV adoption, manage the energy demand, or promote equitable access to charging infrastructure.
  • EV trip bonus: An extra earning per trip with an EV bundled with services such as Uber Green [15,16].
  • Income-based instant rebate at point of sale: An instant rebate available at the time of purchase, based on income eligibility. We define it as the ratio of the vehicle purchase discount relative to the driver household income.
  • Vehicle price-based instant rebate at point of sale: An instant rebate available at the time of purchase, based on the labeled vehicle price. We define it as the ratio of the vehicle purchase discount relative to the vehicle price.
  • Income-based tax credit: A tax benefit where the amount of the credit varies based on the taxpayer’s income. We define it as the ratio of the tax credit relative to the driver household income. Typically, lower-income individuals or households receive a larger credit, while higher-income earners receive a smaller credit or none at all.
  • Vehicle price-based tax credit: A tax incentive where the amount of the credit depends on the price of the vehicle being purchased. We define it as the ratio of the tax credit relative to the vehicle price. For instance, lower-priced vehicles receive a larger credit, encouraging affordability and broader access. Higher-priced vehicles receive a smaller credit or no credit at all.
  • Fuel cost offset: Estimated savings in charging costs resulting from the offered charging discount.
  • Vehicle price-based charging credit: The ratio of the charging credit relative to the vehicle price. A type of incentive for charging that varies based on the price of the EV a driver owns, leases, or rents. We define it as the ratio of the charging credit relative to the driver household income. For instance, low-income drivers receive higher financial support on EV charging [17].
In the sections that follow, we start with an overview of relevant EV and TNC studies in recent years and then introduce the data sources and the qualitative/quantitative methods applied. Following that, we discuss findings and observations relevant to TNC EV adoption patterns as distinguished by the full-/part-time status of the drivers. We conclude with a summary of key findings, policy implications, and future research spaces.

2. Literature Review

In this section, we explore the literature related to the scope of this study, which includes the following: (1) EV adoption among the general population and TNC drivers, (2) EV adoption among full-time and part-time TNC drivers, and (3) driving patterns and concerns of different ridehailing driver groups. Following that, we discuss the existing research gaps and methodological limitations for further exploration.

2.1. EV Adoption Among the General Population and TNC Drivers

Among the broader population of vehicle drivers, research has identified a reluctance to adopt electric vehicles among underserved communities [18]. Early EV adopters are usually male, earning medium–high incomes, highly educated, living in a two- or four-member family, and living in houses in low-density areas [11]. Studies also emphasized the primary use of EVs as private vehicles versus in ridehailing operations. One study that investigated the geographic distribution of EV chargers and the general population found that disadvantaged and low-income communities have less access to EV charging infrastructure [19]. Many TNC drivers come from demographic groups for whom electric vehicles are typically financially inaccessible. For example, Qiao et al. mapped the residential locations of ridehailing drivers and found that they are more likely to reside in lower-income neighborhoods with fewer employment opportunities [20]. In addition, a more recent cost–benefit analysis found that under most circumstances (e.g., intensity of TNC driving, acquired TNC vehicle age) internal combustion engine (ICE) vehicles, regardless of if they were financed, leased, or rented, remained more financially viable for ridehailing drivers compared to EVs [6].
Many studies have employed stated preference (SP) surveys to identify key influencing factors on EV adoption and charging preferences among regular drivers. Jia and Chen conducted an SP survey of 837 drivers in Virginia to investigate customer EV preferences given socio-demographic factors and policy incentives [21]. The study found that individuals who are male, possess higher levels of education, and have higher incomes exhibit a significantly greater interest in EVs. This study also discovered monetary EV incentives, such as price reductions at the time of sale (hereafter sometimes referred to as a “(vehicle) purchase discount” or “instant rebate”) or tax exemptions, to be positively influential in promoting EV adoption. Additionally, Kajanova and Bracinik analyzed socio-economic and charging-related attributes and established a multinomial model to understand the EV user decision-making process on different charging options, including charging and vehicle-to-grid services [22]. The study found that women drivers tend to prefer lower levels of uncertainty and greater reliability, leading them to take measures to minimize the risk of battery depletion. The study also concluded that older drivers (aged 60 and above) are less influenced by an EV’s state of charge when choosing a specific type of charging option. In Sweden, researchers discovered that EV ownership primarily occurs in metropolitan areas and tourism hotspots in the peripheries [23]. Furthermore, their logistic regression analysis revealed that factors such as an older age, higher income, greater educational attainment, residence in suburban or rural areas, and increased availability of EV charging infrastructure are strongly associated with a higher likelihood of EV adoption.
While EV adoption in the general population has been widely researched, studies focused on EV acquisitions among ridehailing drivers are more exploratory than technical. In one of those explorations, Sanguinetti and Kurani concluded from a survey of 732 TNC EV drivers that early EV adopters among ridehailing drivers are mostly male, are homeowners, live in single-family homes, are between 30 and 60 years old, are college-educated, and earn an annual income of roughly USD 88,000 [24]. They were attracted by the lower fuel and maintenance cost, drove more than 20 h a week, and charged their EVs every day. Additionally, Zhang and Liu employed a Stackelberg game model to assess strategies for promoting EVs in the ridehailing sector [25]. They found that non-monetary incentives, such as access to priority lanes, are more effective when the majority drive gasoline vehicles and meeting environmental targets can be costly (e.g., EV acquisition for TNC drivers). In contrast, subsidies, such as a vehicle purchase discount or tax incentive, are more effective in scenarios where most drivers are already inclined to adopt EVs.
For ridehailing drivers, acquiring EVs and finding suitable charging options can be challenging, especially with the electrification requirements of SB 1014. The main barriers to adopting EVs for ridehailing drivers include the costs of acquiring an EV and the availability and costs of EV charging. While some studies suggest that TNC drivers may be more willing to adopt EVs compared to regular household drivers or commuters, it is also recognized that EVs used in ridehailing consume significantly more electricity than those of typical EV drivers [26,27]. Another study that mapped the GPS trajectories of ridehailing vehicles in Beijing found that EV adoption among TNC drivers is influenced by their daily travel patterns and the availability of charging stations [28]. Additionally, EV drivers need to carefully plan their charging schedules to avoid missed trips and reduce costs, particularly during peak periods when charging prices are higher.

2.2. Full- and Part-Time TNC Driver EV Adoption

The transition to EVs among TNC drivers may present different challenges depending on whether drivers are full- or part-time. Ridehailing drivers experience varying challenges related to vehicle electrification based on their specific driving patterns, such as the regularity, duration, and frequency of their driving hours. These patterns can reflect the driver categorization as either full- or part-time, and this distinction influences the financial impact of the TNC electrification on their income.
Studies have shown that although part-time TNC drivers make up the majority of the ridehailing driver population, they contribute a relatively small portion of TNC trips and mileage. It is important to note that there is no consensus on the exact threshold that defines part-time and full-time TNC drivers. Shaheen et al. classified drivers based on their weekly driving hours, defining periodic drivers as those who drive only a few times per month, part-time drivers as those driving less than 30 h per week, and full-time drivers as those driving 30 to 40 h per week [29]. In contrast, Shetty et al. set the division at 25 h per week [30].
There is no agreement among studies on whether part-time drivers are the majority, but there tends to be a consensus that full-time drivers are driving the majority of TNC miles between the two populations. According to Uber’s report, full-time drivers account for 26% of all Uber drivers in California but provide 58% of all trips. Uber also claims that about 91% of their drivers work part-time or under 40 h per week in the U.S., emphasizing that most drivers prioritize flexibility over the stability of a full-time TNC job [31].
In contrast, Parrott and Reich (2018) analyzed data from the Taxi and Limousine Commission (TLC) in New York City, using a threshold of 30 h per week. They found that more than 60% of all drivers were full-time, contributing to 80% of all trips. In Seattle, Reich and Parrott applied a threshold of 32 h per week and found that full-time drivers (represented 33%) provided 55% of TNC trips [32]. Additionally, Ma and Hanrahan conducted 53 open-ended surveys and 10 semi-structured interviews with ridehailing drivers in North America and reported that 83% of respondents were driving under 40 h per week [33].

2.3. Full- and Part-Time TNC Driving Patterns and Concerns

Due to various challenges, some argue that driving a TNC vehicle full-time is not a sustainable option. In a 2024 article, Campbell noted that full-time driving is not recommended due to stress, a lack of job security, unexpected driver deactivations, instability, and the absence of benefits [34]. Similarly, Ma and Hanrahan found in their surveys and interviews that full-time TNC drivers often feel financially vulnerable and locked into driving for a TNC as their sole income source [33]. To maximize earnings, some full-time drivers attempt to work during surge pricing hours or in high-demand areas. However, unlike part-time drivers, who can choose to drive only during these profitable times, full-time drivers often feel obligated to work a fixed schedule, including during low-demand periods when earnings are lower, ultimately reducing their overall income.
While the majority defines part- and full-time drivers based on the number of hours they drive per week, Ma and Hanrahan suggest that the definition is not only determined by the working duration, but it also depends on a driver’s financial dependency on ridehailing for income [33]. For example, drivers who work fewer hours typically view TNC earnings as a supplementary income, unlike those who drive longer hours each week.
Anderson classified drivers into three categories: (1) “incidentals”, who drive mainly during their regular commute, (2) part-time drivers, and (3) full-time drivers. The study concluded that full-time drivers are more likely to work during low-demand times, such as midnight, when the pay is lower [14]. Through 20 interviews and “ride-alongs” in San Francisco, Anderson found that companies often encouraged drivers to work during these low-demand periods [14]. Additionally, the study found that “incidentals” were motivated by social goals, such as meeting new people or helping others, whereas full-time drivers were more focused on economic concerns.

2.4. Research Gaps and Methodological Limitations

The reviewed studies provide valuable insights into EVs, EV charging, and the unique operational patterns of ridehailing drivers. For example, prior studies have documented that EV adoption decisions are largely shaped by driver demographics, access to charging infrastructure, and vehicle costs. In addition, these studies have suggested that drivers with varying weekly driving hours may differ in their financial constraints and EV preferences.
However, several gaps emerge. First, the distinction between full- and part-time TNC drivers is often unclear in the academic literature and the SB 1014 policy, with a limited discussion on how driving behaviors and financial needs differ. While many researchers have developed statistical models to evaluate EV adoption and charging preferences, these studies tend to focus on the general population, leaving the complexities of ridehailing drivers’ EV perceptions and choice underexplored.
Additionally, much of the existing literature is quantitatively focused, whereas this study seeks to balance both qualitative and quantitative approaches to better address the financial scenarios faced by drivers. While prior research has examined driver behavior and vehicle choices separately, this study integrates both aspects across both ridehailing driver populations. Next, we provide an overview of the methodology, followed by the results and discussion of ridehailing driver preferences and trends with respect to EV adoption.

3. Methodology

In this section, we describe the datasets used in this study and the methodology for analyzing them, with the aim of examining the behaviors of full- and part-time TNC drivers, their vehicle preferences, and driving-related concerns regarding EVs.

3.1. Stated Preference Survey Implementation

One of the primary data sources for this study is a survey we implemented with 436 TNC drivers in California in partnership with Rideshare Drivers United (RDU, a grass roots organization founded in 2018, which has grown to over 20,000 members in California) distributed between December 2023 and April 2024. This survey was distributed through RDU’s driver network, through an online invite with the compensation of a USD 20 gift card for completing the survey to 250 randomly selected drivers. We implemented a screening question that confirmed the driver’s full-time and part-time status, in order to keep a relative balance between the two groups.
This survey explored various topics, including current vehicle ownership, preferred fuel types, driving habits, key operating areas, EV perceptions, and demographic and housing information.
The goal of the survey was to identify factors that distinguish full- and part-time drivers, such as their vehicle preferences, driving habits, charging needs, and attitudes toward EVs. We also aimed to gather insights into EV adoption potential within the TNC driver population. Key questions focused on driving behaviors, work schedules, operating areas, and opinions about EVs among other factors.
The survey data also forms the basis for a discrete choice modeling analysis. The discrete choice model is chosen for the purpose of this study because of its capability of comparing different combinations of demographics, vehicle characteristics, and policy elements altogether, rather than evaluating each attribute separately. In addition, it allows us to quantitively investigate drivers’ tradeoffs between several options and their complex features, particularly when it comes to potential adoption of EVs. Discrete choice modeling is a method used to simulate how individuals choose between different alternatives. Introduced by McFadden, this approach is commonly applied to transportation mode choice modeling [35]. One of the most widely used forms is the logit/logistic model, which assumes that each alternative has a deterministic utility term and a random error term, where the error term follows the Gumbel distribution.
To build the discrete choice model, we included four stated preference (SP) questions in the survey, each representing a unique scenario. For example, the first two questions (Q1 and Q2) present two EVs with different characteristics, such as price, range, and charging time. The last two questions (Q3 and Q4) follow a similar format but also incorporate EV-friendly policy interventions, such as purchase price discounts and charging rate discounts. The vehicles considered in these scenarios range from EV sedans (e.g., Tesla Model 3, BMW i4) to EV SUVs and crossovers (e.g., Tesla Model Y, Kia EV6) and EV hatchbacks (e.g., Chevy Bolt, Nissan Leaf). Please see Figure 1 below for an example of the SP questions.
In addition to vehicle-specific characteristics, we asked respondents to consider several environmental/contextual factors shared across both vehicles in each SP scenario. These factors include the time needed to locate the nearest Level 3 fast charger (which adds several hundred miles per charging hour) during regular TNC operations, the distance to the nearest Level 2 charger (240 volt chargers that add 12 to 80 miles per charging hour) from their residence, and the distance to the closest fast charger from their home.
In each of the four SP scenarios, respondents could choose one of the two EVs presented (referred to as “Vehicle 1” and “Vehicle 2” for simplicity) or opt for “Neither”, indicating they would not acquire either vehicle. Those selecting “Neither” were informed that due to SB 1014’s requirement for 90% of TNC miles to be electric by 2030 they would likely be unable to continue as TNC drivers under the current policy.

3.2. Expert Interviews

To better understand the barriers to EV accessibility for ridehailing drivers, we conducted interviews with experts from various sectors, including public, private, and non-profit organizations in May and June 2023. We compiled a list of organizations with the help of Rideshare Drivers United (RDU) and the International Association of Transportation Regulators (IATR). We spoke with experts from ten organizations: two public agencies, three non-profits, two ridehailing companies, and three public companies (e.g., charging and car rental companies). Our discussions covered topics such as the implementation of SB 1014, opportunities and challenges, the EV market, driver status, EV charging, and social equity.

3.3. Small Group Discussions with Full-Time Drivers

In addition to expert interviews, we held virtual small group discussions with TNC drivers to gain deeper insights into the ongoing EV transition among them. We specifically focused on full-time drivers, as they are more dependent on their TNC income and commit more time to driving. These discussions aimed to capture both regulatory and driver perspectives.
In April 2023, we collaborated with RDU to develop and distribute a screening survey for selecting participants. We received 244 responses, 118 of which were from full-time drivers (those driving more than 30 h per week). We then organized two small group discussions, one for EV drivers and one for non-EV drivers, each lasting two hours on consecutive business days. The discussions centered on the barriers to EV adoption, covering topics such as driver profiles, the implementation of SB 1014, vehicle ownership, driving habits, EV charging, income and expenses, additional challenges to adoption, and available EV incentives.
In the results section, we summarize the key takeaways from the discussions. The findings from both the interviews and small group discussions support the quantitative analysis by highlighting the behavioral differences, concerns, and preferences of full- and part-time drivers regarding EVs. Although the small group discussions were conducted only with full-time drivers, they still offer valuable insights into the specific needs, concerns, and motivations that TNC drivers may experience.

3.4. Driver Survey Analysis

To examine the differences in driving habits and EV perceptions between full- and part-time drivers, we compare their responses to each relevant survey question, using a threshold of 30 h per week. These comparisons are summarized through descriptive statistics, such as percentages. For example, we calculate the percentage of respondents selecting each option within the full- and part-time categories separately.
In most cases, we employ statistical tests to assess the significance of any differences observed. These tests help clarify how the two groups differ. The choice of statistical test depends on the nature of the data. For discrete response options, we apply a two-proportion z-test to assess differences between the groups. For continuous or numerical data (e.g., average or maximum daily miles traveled with TNCs), we use the Kolmogorov–Smirnov test to compare the distributions of miles driven between full-time and part-time drivers.

3.5. Binomial Discrete Choice Model Specification

While the descriptive statistical analysis provides insights into the current driving patterns and fuel preferences of ridehailing drivers, it cannot predict their future behaviors or vehicle choices. To address this, we introduce binomial choice models to simulate the decision-making process of the TNC drivers more accurately.
We developed two sets of models for this purpose. The first set (Model Set One or baseline models) is based on the first two SP questions, with no incentive variables included. The second set (Model Set Two or policy-adjusted models) builds on the baseline models by incorporating EV-favoring policy incentives. Model Set Two is further divided into two sub-sets: Set 2-1, which includes only vehicle-related incentives (e.g., vehicle purchase discounts, tax credits), and Set 2-2, which also includes charging-related (e.g., charging credits, charging discounts) and trip-related incentives (e.g., EV trip bonuses). A detailed breakdown of the model specifications is provided in Table 1.
In the SP survey, each driver respondent selects between a financed, leased, or rented “Vehicle 1”, “Vehicle 2”, or “Neither”. Since both Vehicle 1 and Vehicle 2 are EVs, choosing “Neither” is equivalent to selecting a gas-powered or primarily ICE vehicle. Given that each respondent has multiple vehicle options, this structure is more appropriate for a multinomial choice model, where each alternative represents a unique acquisition pathway (i.e., financing, leasing, or renting) and the new or used status of an EV.
However, there are some limitations to applying a multinomial model to this dataset. It is important to note that the primary focus of this study is on the fuel type of the selected vehicle rather than the acquisition pathway (e.g., financing, leasing, or renting) used to obtain it. An earlier study by Ju et al. (2025) compared net TNC driver earnings across various vehicle acquisition methods and fuel types. The authors found that EV leasing is more suitable for short-term, low-mileage drivers; EV financing is ideal for long-term, high-mileage drivers; and EV rentals benefit only short-term, very high-mileage drivers [6].
To adapt the data for a binomial model, a few preprocessing steps are necessary. The original choice set includes three alternatives: C 0 = V e h i c l e 1 ,   V e h i c l e 2 ,   N e i t h e r , with respondent n’s selection set denoted as S 0 ,   n = s V 1 , n , s V 2 , n , s N e i t h e r ,   n . One of these options ( s V 1 , n , s V 2 , n , or s N e i t h e r , n ) will be 1, indicating the selected choice, while the other two will be 0. In the reformatted dataset, the choice set is reduced to two options, and the respondent’s actual selection from C 0 determines which elements are included in the new choice set. The details of this conversion process are presented in Table 2.
According to Table 1, both Model Set One (Q1 and Q2) and Model Set Two (Q3 and Q4) present decisions based on the attributes of the choice set in each SP question. As a result, the total number of observations for each model set development is 2N. Additionally, Vehicle 1 and Vehicle 2 are always EVs with different attributes and policy-related considerations (e.g., purchase discount, charging credit).
To model whether a driver would choose an EV, one additional row is added to the binomial dataset when an EV is selected. If the respondent chooses “Neither”, two extra rows are added, each representing a binary comparison between an EV and no EV (i.e., leaving TNC driving), with the EV deselected. This process expands the original dataset by a factor of K, where 2N ≤ KN = N′ ≤ 4N, depending on the number of “Neither” choices made by respondents.
This explains the notation change from respondent n (n ∈ {1, 2, …, N}) to n′ (n′ ∈ {1, 2, …, N′}). The two tasks assigned to each respondent in each model set double the number of rows (2n), and the presence of “Neither” choices further increases the number of rows, transforming respondent n into a “pseudo” respondent n′, where 2n ≤ n′ ≤ 4n.
For each added row, we included the characteristics of the chosen or unchosen EV, along with relevant contextual and environmental attributes, as well as any EV incentives applied. We also incorporated driver socio-demographics to better capture the factors influencing EV choices in their ridehailing business. This leads to the utility function described in Equations (1) and (2).
U n ,   E V = β 0 , n + β n T X n + ϵ n , E V U n ,   N e i t h e r = ϵ n , N e i t h e r
V n = β 0 , n + β n T X n V n ,   N e i t h e r = 0
where U n is the utility when a pseudo respondent n chooses an EV; V n is the deterministic utility portion of U n ; β 0 , n is the constant assuming all attributes are zeros; and X n is a vector of the vehicle, driver, and policy-related attributes (e.g., incentives) that could potentially have an impact on a respondent’s vehicle choice. β n is a vector of coefficients that indicate the degree of influence each attribute makes to the overall utility of the vehicle perceived by pseudo respondent n , and ϵ n is the random noise. Furthermore, the probability P n that this respondent chooses EV is represented in Equation (3) as follows:
P n = e μ V n 1 + e μ V n
where μ is the scale parameter of a logit model, which approximates zero when the decision is more random, and it approximates infinity when the decision is more deterministic. Inspired by Ben-Akiva and Lerman, the scale parameter μ is normalized to 1 for simplicity [36].
To compare the full- and part-time model performance, we further introduced the Wald test to test the statistical significance of the difference between the estimated coefficients [37].
W = β F T β P T 2 V a r β F T + V a r β P T ~ χ 2 1
In Equation (4), W is the Wald test statistics (later referred to as ‘Wald Diff’), and β F T and β P T are the coefficients estimated for the same independent variable in the full- and part-time models, respectively. This W follows the χ 2 distribution with one degree of freedom.

3.6. Methodological Summary and Limitations

While this study evaluates EV adoption among full- and part-time ridehailing drivers in California employing quantitative and qualitative data, there are a few limitations to note. First, the qualitative discussions offer a variety of perspectives, but they could also lead to biases. Second, the driver survey collected 436 responses in two timeframes (December 2023 and April 2024), aiming for a balanced sample of full- and part-time drivers. However, the sample is more concentrated in Los Angeles than across the state, which may not fully reflect the state’s demographics (e.g., age, county). Despite this, the inclusion of two tasks per respondent and the use of a binary approach significantly expands the sample size.
Another limitation is that only full-time drivers participated in the group discussions, given the notable impact on their employment and need to transition to EVs. The absence of part-time drivers could have biased our identification of certain barriers. Nevertheless, expert interviews helped to address some of the part-time driver concerns, bridging the gap in information.

4. Results and Discussion

In this section, we provide the results and analysis of the survey and modeling. It includes the following subsections: (1) descriptive statistics from the driver survey, (2) baseline choice models, and (3) policy-adjusted choice models.

4.1. The Descriptive Summary of the Driver Survey

The survey gathered 436 responses between December 2023 and April 2024, with more than half of the respondents from Southern California (66% from Los Angeles and San Diego). We acknowledge that this skewed sample might introduce a bias to the descriptive analysis and may affect the generalizability of the later discussed discrete choice model results. Nonetheless, we proceeded with this collection of driver responses, given that reports have shown that ridehailing activities in California share similarities. For example, both Northern and Southern California exhibit a high penetration of TNCs, a dense travel demand in urban areas, as well as a great reliance on public charging facilities [38]. That said, we need to be mindful of extending these findings to less urbanized areas, where the TNC adoption, charging access, and driving patterns may differ significantly.
Additionally, the data collection timeframes may not fully capture the rapidly fluctuating dynamics such as electricity/gas prices, EV technology advancements, as well as charging network expansions. This data limitation may also affect ridehailing driver preferences for EVs over time.
Using this sample, we conducted a descriptive statistical analysis to identify differences between full- and part-time TNC drivers. We examined disparities in demographics, household compositions, driving patterns and mileage, earnings and expenses, driver tenure and vehicle ownership, and EV perceptions. The following sections provide a detailed discussion of each topic.

4.1.1. Demographics

We analyzed demographic differences between full- and part-time drivers in terms of their age, gender, income, education, and race/ethnicity (see Figure 2). In Figure 2, Figure 3, Figure 4, Figure 5, Figure 6, Figure 7 and Figure 8, asterisks next to each demographic category indicate statistically significant differences between the full- and part-time groups.
In this survey sample, there are much more male drivers in both the full- and part-time groups. Full-time drivers are more concentrated among male and middle-aged (30–65 years) individuals, whereas part-time drivers consist of more female, much younger, or much older age groups. In addition, part-time drivers are more likely to hold a bachelor’s or post-graduate degree, likely because these drivers also have another job as their major income source. However, part-time drivers are found to be more concentrated at lower income levels (i.e., less than USD 50 K) due to the fewer hours committed to TNC driving. As for race and ethnicities, full-time drivers are more likely to be Black, Hispanic, or White, whereas Asian drivers exhibit a greater tendency to be part-time drivers.

4.1.2. Households and Children

In addition to the basic demographics, we further summarize the household-related information in Figure 3 below.
Figure 3 shows that full-time drivers are more likely to have family responsibilities, with a higher percentage married and having children under 18 (48% of full-time vs. 40% of part-time). This suggests that full-time drivers may need a higher-paying job to support their families. Additionally, the majority of drivers (65%) rent their homes, and only one-third own detached homes (i.e., a standalone residential building/dwelling). Part-time drivers are slightly more likely to own detached homes (35% part-time vs. 33% full-time).

4.1.3. Driving Patterns, Mileage, and Charging Access

Disparities between full- and part-time drivers also arise in terms of TNC driving patterns. Figure 4 below shows the difference in the distribution of the full- and part-time driver activity by the day of week and the time of day.
According to Figure 4, full-time drivers primarily work on weekdays. While both full- and part-time drivers drive less on weekends, their work patterns differ. The peak working days for part-time drivers are more concentrated on Fridays and Saturdays (76 to 82%) compared to the remaining days of the week, 55% to 68%. In contrast, over 80% of full-time drivers drive Monday through Saturday, and there is a noticeable drop to 63% on Sundays. In terms of the time of day, significantly more full-time drivers drive from 8:00 a.m. to 8:00 p.m. on weekdays, whereas more part-time drivers are “moonlighting”, starting to operate later at night (8:00 p.m. to 12:00 a.m.) and earlier in the morning (12:00 a.m. to 4:00 a.m.) of the next day when they do not need to work for their other job(s). As for the land-use context, significantly more full-time drivers primarily operate TNCs in highly urban and high-density areas (69%), and they generally live farther away from their TNC operation areas (i.e., 16% of full-time drivers live 30 miles away from their primary operating areas vs. 11% of part-time drivers). In contrast, part-time drivers exhibit a slightly lower preference for highly urban areas (56%) and a slightly greater preference for lower-density and smaller metropolitan areas. Additionally, we examined the EV (left of Figure 5) and non-EV (right of Figure 5) driver access to charging at home.
Results show that while the majority of EV drivers have access to home charging (65%) and most gas-powered vehicle drivers do not (75%). The percentages also differ in terms of their full- and part-time status. Compared to full-time drivers, significantly more part-time EV drivers primarily rely on Level 1 charging (i.e., usually 120 volt Level 1 chargers that add three to five miles of range per charging hour) at home (i.e., 26% part-time vs. 10% full-time). One possible reason is that full-time drivers need to be constantly driving on the road throughout the day and have less charging flexibility during their shift. They may thus need access to both fast chargers during operation and faster overnight charging facilities (e.g., Level 2) at home; rather than a Level 1 charger that only adds approximately three to five miles per hour. Part-time drivers, on the other hand, can potentially utilize the time at home and/or when they work for their other job to charge their EVs. The expert interviews and driver group discussions also suggest that full-time drivers need to rely more on public fast charging due to the longer hours they spend driving, and they usually start their daily shifts with a full battery after charging overnight on the previous day. While many ICE drivers report no home charging access, a significant share of part-time ICE drivers report at least one type of charging infrastructure at home relative to full-time ICE drivers (i.e., 36% part-time vs. 24% full-time). This contrast between full- and part-time and EV and non-EV access implies that there is a potential mismatch between EV ownership and charging access. In other words, current non-EV part-time drivers may be better positioned with respect to home charging access relative to full-time drivers who may be faced with more EV home charging access challenges due to their relatively non or under-equipped charging at home.

4.1.4. Earnings and Expenses

Figure 6 further illustrates the full- and part-time comparison of their weekly TNC earnings and expenses.
As observed in Figure 6, full-time drivers earn significantly more (i.e., 88% over USD 500 per week) and spend significantly more on fuel (i.e., 65% over USD 100 per week) than part-time drivers. In contrast, almost half of the part-time drivers earn less than USD 500 per week via their TNC income (49%), and more than half of them spend less than USD 100 per week on fuel (63%). This finding highlights the financial burden of EVs and charging among full-time drivers since they have less flexibility to change jobs and have higher pressure to earn an income exclusively through their TNC income. This distinction also emerged in the expert interviews where stakeholders highlighted the different challenges full- and part-time drivers face in an EV transition due to variations in their income dependency.

4.1.5. Driver Tenure and Vehicle Ownership

In Figure 7, we investigated the TNC driver tenure and vehicle ownership status below.
We observe that full-time drivers typically have a longer tenure (e.g., more than five years), while significantly more part-time drivers have only one to five years of ridehailing tenure. While gasoline remains the most popular vehicle fuel type (45%) overall, full-time drivers are significantly much more likely to drive an EV for their ridehailing business (27%) vs. part-time drivers (19%). In addition, most drivers own the vehicles they use for their TNC jobs, while full-time drivers have a slight tendency toward leasing/renting a vehicle. This is likely because full-time drivers contribute to more intensive driving and may lead to more wear and tear on their personal vehicles. As a result, they may need more frequent access to newer vehicles that make them qualify for better paid TNC service options (e.g., Uber Comfort, Uber Green) and circumvent long-term maintenance and depreciation costs [15,16].

4.1.6. EV and EV Charging Perceptions

In addition to driver demographics and their existing driving patterns, we further investigate ridehailing driver perceptions toward EVs and EV charging infrastructure in Figure 8 below. These attitudinal factors can potentially become crucial determinants of their EV choices.
Compared to part-time drivers, full-time drivers were more likely to report that “EV ranges are too short” (42% vs. 34%). Full-time drivers are also much more suspicious about taking the same number of trips as if they were driving an ICE vehicle (i.e., 26% full-time vs. 17% part-time), while part-time drivers are generally more indifferent to this concern (i.e., 34% part-time vs. 23% full-time). However, a significantly greater share of full-time drivers strongly agreed (i.e., 17% full-time vs. 11% part-time) that EV ranges are sufficient to support TNC use. This indicates that vehicle ranges alone cannot alleviate ridehailing driver concerns about EVs.
Full-time drivers were found to be less confident in public fast charger availability, where 24% of them strongly agreed that public chargers are too difficult to find (i.e., vs. 21% in part-time drivers). Several full-time drivers in our group discussions mentioned that the time spent locating and waiting for a working public charger is a major source of anxiety and potential income loss for them. Full-time drivers were also much more concerned with EV battery degradation (i.e., 52% full-time vs. 41% part-time) due to their intensive use of vehicles with a full-time schedule.

4.2. Baseline Choice Models (Model Set 1)

The survey responses provide initial insights into the factors influencing ridehailing driver decisions to adopt EVs and highlight key differences between full- and part-time drivers. Building on these findings, we introduce two sets of discrete choice models to validate these observations: (1) Model Set 1: baseline models without incentives and (2) Model Set 2: policy-adjusted models that include various EV incentives. Both sets are applied to all drivers, as well as separately to full- and part-time drivers.
The survey collected responses from 436 ridehailing drivers, 402 of whom are currently driving for TNCs, and 399 of whom completed the SP survey questions. Using 30 h per week as the threshold, the sample splits into 204 full-time drivers and 195 part-time drivers. As detailed in Table 1 and Table 2 in Section 3.5, the SP responses are converted from a trifold structure into a binomial format, based on the two questions in each model set. This results in 798 independent observations (doubling the 399 drivers), which we further used to generate 1079 observed choices for Model Set 1 and 1047 for Model Set 2.
To assess the model performance, we split the dataset into a training set (80% of records) and a test set (20% of records). We trained the models using the training set and tested using the test set.

4.2.1. Baseline Applied to All Drivers

As noted in Section 3.5, the baseline models incorporate the vehicle-related characteristics, environmental/contextual attributes, and driver socio-demographic characteristics, without a consideration of relevant incentives that favor EV adoption. These models illustrate ridehailing driver reactions to EV prices, ranges, and charging functionalities.
We begin by estimating parameters of a full binary logit model applied to all 1079 “pseudo” drivers (or 863 in the training set) in our survey pool (i.e., a pooled model). This model incorporates a full set of fifty-one explanatory variables (including one constant term β 0 , n ), including six vehicle characteristics, three contextual attributes, and forty-one socio-demographic characteristics of the drivers. All variables are normalized to a scale between 0 and 1. The most significant coefficients obtained from this model can help to identify the key determinants of EV acquisitions among TNC drivers. This model reports back with 19 out of 51 variables being significant at the 0.05 p-value level.
To avoid overfitting, which can limit the generalizability of a model, we removed variables with relatively weak predictive power and further introduced an L1 regularization term C . We employed the estimation to update the original setup to a cross-validated Lasso model. This Lasso model leads to an increase in the total number of significant variables (19 to 34). Next, we used the 34 selected variables (35 variables including the constant term) to conduct another round of feature selection, which includes another naïve binary model and another cross-validated Lasso model with only these variables. We summarize the key model results in Table 3 below.
Considering all evaluation metrics (i.e., R 2 and accuracies), we conclude that the reduced Lasso model with a C = 1000 penalty is the best option. This is because this model retains the most feeder variables that are significant, while ensuring a McFadden’s R 2 (0.3054) close enough to the highest value (i.e., 0.3093 of the full standard logit model) and a best test set accuracy of 76.39% true predictions.
Among the factors removed from the original model, we observe that, overall, the TNC drivers are generally unresponsive to public charging-related factors. These include fast charging costs, the nearest Level 2 charger distance from home, the fast charging distance from their homes, and the time to find the closest fast charger while driving. In the expert interviews and driver group discussions, however, barriers to public charging (e.g., fast charging access, charging speed and downtime) were identified as a major concern of TNC EV operations. This highlights the discrepancy between the lived experience (among current EV drivers) and hypothetical perceptions (among those yet to adopt EVs). Drivers, especially ICE drivers, who are not familiar with EVs may find it difficult to internalize the operational factors (e.g., EV charging variables) in an SP question. In other words, charging aspects may be perceived as less immediate or tangible compared to cost-related factors such as the vehicle price. Actual EV drivers may also exhibit an indifference to marginal charging effects due to their experience with routine charging habits. We present the most significant variables in this reduced model in Table 4 and discuss their physical implications. These variables are summarized into predefined categories to ensure an easier interpretation.
By default, the constant variable is significantly negative (−6.3469), meaning that most drivers are automatically discouraged from acquiring an EV for their TNC driving, assuming that all variables are set to zero. Additionally, past EV exposure (1.6593) and accessibility to EV home charging (1.5492) are both positively associated with the likelihood of EV adoption for TNC use, where past EV exposure/history refers to whether a driver had ever driven an EV for ridehailing before, regardless of whether or not they were still doing so by the time of the survey. This trend is confirmed by the group discussion, where EV drivers expressed a greater willingness to follow future trends and adjust their driving routines in exchange for greater long-term cost savings and environmental benefits. Non-EV drivers in the group discussions tended to be more hesitant or likely more risk averse, often citing unfamiliarity with EVs and concerns about the SB 1014 policy complexity and feasibility.
Drivers who primarily undertake TNC trips in highly urban and high-density areas are more reluctant (−0.6405) to adopt EVs. One possible reason for this is that there is usually a higher charging demand in urban areas, which yields a higher opportunity cost from the charging downtime in contrast to a gasoline vehicle that can be refueled in minutes. Some drivers may also face concerns about being led into an unfamiliar area with limited charging infrastructure due to the higher trip demand in dense regions. This finding seems counterintuitive from the qualitative discussions, where EV TNC drivers typically aim for demand “hotspots” and strategically plan for EV charging in the areas where they pick up passengers in cities. However, this may be due to differences between the lived experience with EVs and SP questions. These results highlight that, even in dense urban areas, challenges related to public charging remain a significant barrier to EV adoption.
EVs are also more favorable among those who treat ridehailing as their primary income source (1.2404) or full-time drivers. Similarly, this model indicates that long hours contributed to TNC driving per week (5.2324) are significantly correlated with a higher likelihood of EV acquisition. We verify this finding in two separate full- and part-time driver models employing the same structure as this reduced Lasso model.
One of the most frequently mentioned a priori expectations from our expert interviews, driver virtual discussion groups, and the literature was that EVs would gain considerable popularity among those residing in single-family homes and/or own their homes. Our model, however, suggests that owning their homes alone does not necessarily contribute to a higher likelihood of EV adoption among TNC drivers. On the contrary, owning a house (−19.7481) or living in an attached (−0.6513) or detached (−0.9107) single-family home is a negative predictor of a future EV acquisition among these drivers. According to the model, it is the interaction between home ownership and the current EV use (i.e., whether they currently drive an EV for TNCs) that matters the most, where the current EV use usually implies greater access to EV charging at home. In other words, home-owning ridehailing drivers exhibit a minor interest in going electric unless their homes are currently equipped with EV charging facilities. This finding supports our qualitative insights, where both experts and drivers highlighted that the lack of home charging access creates logistical barriers to EV adoption. In contrast, drivers with home charging can more easily incorporate EV use and charging into their daily routines.
With respect to EV characteristics, higher prices appear to be strong negative predictors regardless of driver EV financing (−1.1133), leasing (−1.6054), or renting (−1.5825). Similarly, when we interviewed experts and drivers, they also expressed major concerns over upfront EV purchase costs and income instability since the vehicle acquisition costs will directly cut to their TNC earnings. Not surprisingly, longer vehicle ranges (1.012) can positively foster EV adoption among TNC drivers, likely due to the higher vehicle use intensity of ridehailing. Longer 0 to 80% fast charging times (such as early-generation EV models like the Nissan Leaf or EVs not eligible for Tesla Superchargers) can also lead to a lower likelihood of EV adoption (−0.967). This was also noted in the expert interviews and driver group discussions, where many drivers noted that longer EV charging times relative to ICE vehicles are an important EV adoption deterrent.
Moreover, the socio-demographic characteristics of ridehailing drivers can also have a noticeable impact on their choice of EVs in the future. For example, EVs are better perceived among drivers who self-identify as Asian, Hispanic, and White. Female and married drivers also tend to have a greater EV preference in the model. This finding contrasts the literature where male drivers are found to dominate the early EV adopters, which highlights a difference between regular drivers and TNC drivers, as well as a difference between lived experience and SP questions. More specifically, many ridehailing platforms offer better paid programs, such as bonus tiers and green trip incentives. For example, Uber Comfort Electric offers low-emission rides to riders and bonuses to EV-operating drivers [15,16]. It is likely that women drivers prioritize predictable earnings and are especially responsive to these incentives. In addition, married ridehailing drivers may have greater household stability and reflect higher household incomes, meaning that EVs might be more financially accessible to them. This added financial security can increase their willingness to try EVs for their TNC job.

4.2.2. Comparison of Baseline Models: Full- vs. Part-Time Drivers

The baseline models consist of 1079 choices, including 546 choices from full-time drivers and 533 choices from part-time drivers. Using the significant variables that we found in the reduced model, we applied the same model structure to the full- and part-time subsets, respectively. The goal of doing this was to compare the numeric values of the explanatory variables and significance levels, and thus we aim to understand EV perceptions given different ridehailing driving patterns. Results of the two models are presented in Table 5 below.
We cross-validated the final full- and part-time models given a range of penalty C values, and C = 10 , 000 is selected considering McFadden’s R 2 and the test set accuracy. Both models exhibit a better performance than the all-driver model. This indicates that the model is better at capturing the full- and part-time nuances in the subgroups vs. in a pooled model fitted with all TNC drivers. Furthermore, the full- and part-time models also retain a relatively high number of significant explanatory variables (28 and 27, respectively) out of the 35 selected variables, meaning that the key determinants of TNC EV adoption choices are largely stable among drivers with a varying working intensity. In addition, these variables display different directions and magnitudes, which necessitates further investigations into these distinctions (see Table 6 below).
In Table 6, the p-value column reports the significance level of the comparison between the full- and part-time coefficients, and the “Wald Diff” is the Wald test statistics that indicate the difference between coefficients estimated in both models. The constant term suggests that full-time drivers are by default indifferent to vehicle fuel types, but part-time drivers would strongly avoid (−10.2686) acquiring an EV. This difference may reflect economic barriers specifically to part-time TNC drivers, such as risk-aversion and less certainty about future driving commitments, which can make them less willing to consider acquiring an EV for their TNC businesses.
Both groups appear to be significantly encouraged to acquire EVs if they have access to home charging and have EV experience. In contrast, part-time drivers are much more sensitive (1.99 vs. 1.49 and 2.82 vs. 1.43) to these factors, which means that charging access and EV experience can reduce part-time driver’s perceived EV operational barriers, such range anxiety, uncertain payoffs, unfamiliarity with EV operations/incentives, etc.
The survey specifically asks whether drivers consider a TNC as their major income source. Correspondingly, in the SP modeling results, when TNC driving is treated as the main source of income, both groups are much more likely to acquire an EV. Interestingly, part-time drivers who express a heavier reliance (1.69 vs. 0.95) on TNC income are even more likely to acquire one relative to full-time drivers. In addition, the income effect exhibits a completely opposite pattern among the two groups. More specifically, the EV acquisition propensity increases with income among full-time drivers (10.14) and decreases with income among part-time drivers (−4.27). This may reflect the greater financial flexibility that comes with higher TNC earnings among full-time drivers, which encourages them to turn to EVs for long-term savings, such as charging discounts and EV incentives. On the other hand, higher-income part-time drivers may rely less on TNCs since their other/main job(s) absorbs a much greater proportion of their income. In this case, part-time drivers may treat an EV as unnecessary or not worthwhile.
In terms of housing conditions, part-time drivers who own their homes are significantly less likely to acquire an EV (−25.76) in contrast to a less negative and insignificant coefficient for home-owning full-time drivers (−0.84). Explanations for this pattern are similar to that for income. Part-time TNC homeowners may be less financially dependent on a ridehailing income, and they may thus be less economically motivated to switch to an EV, especially if ridehailing is not the primary income source for them.
Another distinguishing factor is the driving intensity of TNC vehicles. Full-time drivers are positively affected (4.02) by longer weekly working hours, while part-time drivers react to weekly hours much more negatively (−1.13). This is because full-time drivers may be better positioned to realize the cost–benefits of EVs due to higher vehicle usage rates.
Both groups react negatively to EV purchase prices and positively to increased EV ranges, which coincides with the observations from all TNC drivers. Additionally, part-time drivers are far more sensitive to prices and less sensitive to ranges. This was noted in the descriptive survey analysis where full-time drivers are found to be more concerned with EV ranges and public EV charging availability (see Figure 8). This observation suggests shorter driving durations and overnight/off-peak charging flexibilities among part-time drivers may reduce the importance of extended EV ranges.
Another observation is that the EV rental costs appear to be a significant negative predictor in both the pooled model and the full- and part-time subgroups. However, our qualitative analysis suggests a more complex picture. Some experts recommended that an EV rental is a viable option for full-time high-mileage drivers, and several full-time EV drivers in the group discussions shared positive experiences with EV rentals given the associated flexibility and reduced maintenance and insurance fees. On the other hand, many other TNC drivers expressed concerns over the high weekly rental costs (i.e., about USD 500 per week) and the unreliable charging access that can be offered in rental bundles. Nevertheless, the fact that part-time drivers appear to be more sensitive to rental costs (i.e., −2.12 part-time vs. −1.4 full-time) confirms the expert interpretation that the higher trip volumes of full-time drivers can make them more open to EV rental options.
Gender is another factor that distinguishes the two TNC driver groups. Female full-time drivers are much more willing to consider EVs, whereas female part-time drivers are relatively more reluctant to acquire an EV. As discussed in Section 4.2.1, female full-time drivers may be more strategic and intentional about their TNC jobs and may value the cost efficiency and environmental benefits that EVs can offer. In contrast, part-time women drivers may be more risk averse and are indifferent to the potential fuel savings in the future. Lastly, full-time TNC drivers are also more likely to favor EVs if they are married, given their higher household stability and potentially their ability to participate in long-term investment planning.

4.2.3. Discussion of Variable Nonlinearity

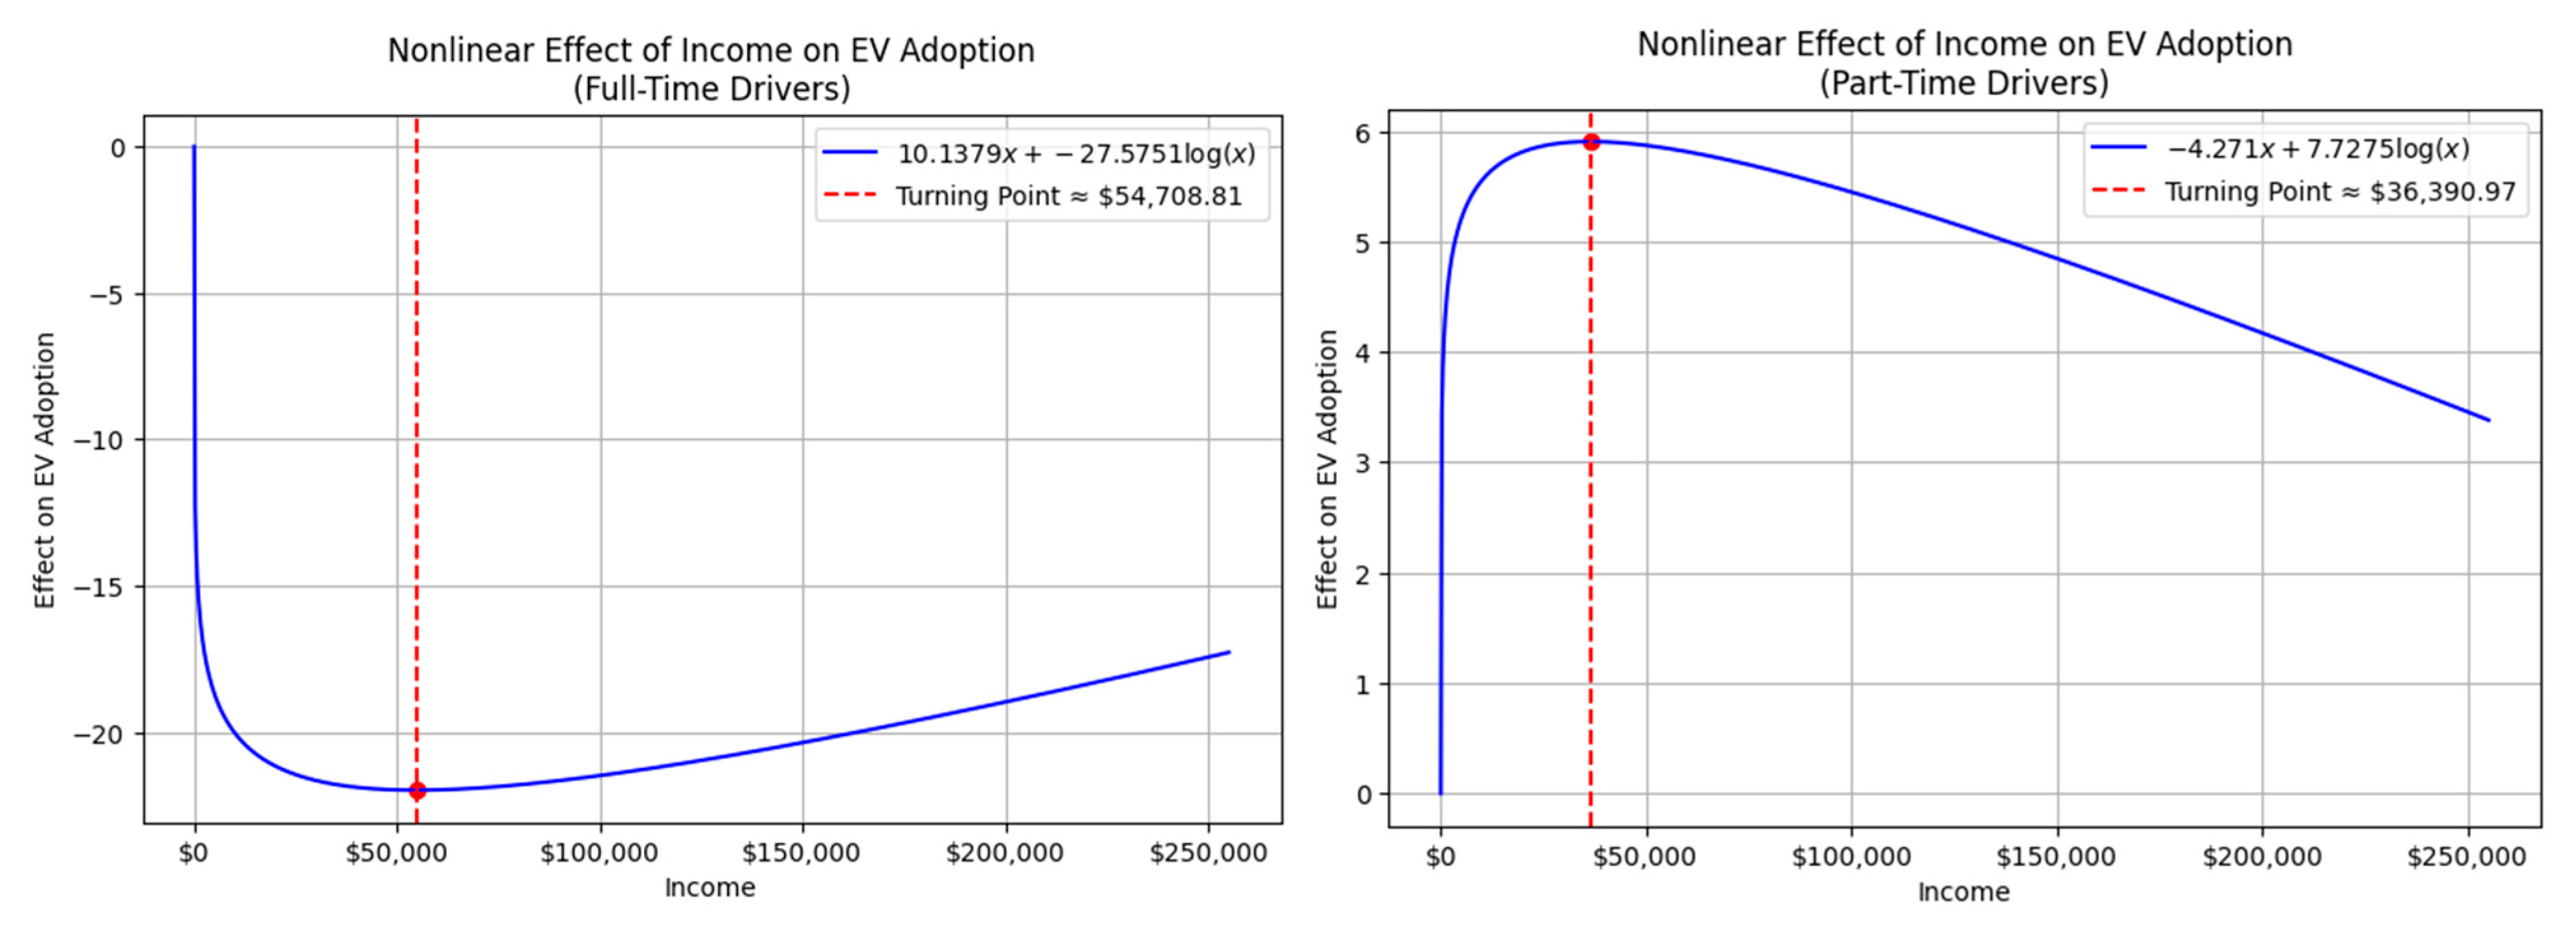
Noticeably, a few nonlinear relationships are present in the baseline model. For example, the TNC driver income alone does not lead to a predictive result. It is the combined effect of the income and the log income that reveals whether a driver favors an EV. Similar patterns are observed in the age and current vehicle prices as well. We visualize these variable nonlinearities among full- and part-time models in Figure 9.
In Figure 9, the left graph illustrates the effect of age on the ridehailing driver EV adoption, and the right graph summarizes the fuel type of their current ridehailing vehicle by age groups. It is important to note that the constant terms are not included in Figure 9, Figure 10 and Figure 11, meaning that the absolute values and signs on the y-axis do not reflect the positivity/negativity in the actual effect. The key insight of these graphs lies in the trend and the curvature vs. the mathematical values.
The overall trend observed in both graphs coincides with each other. In other words, the probability of adopting an EV increases with the increased age in drivers younger than 41 years old. After that, their EV preference shrinks around middle age (41 to 54 years old) and increases again beyond 54 years old. This suggests that younger and older ridehailing drivers are more willing to acquire EVs for their TNC jobs, possibly because of younger drivers’ willingness to try new technologies and older drivers’ greater financial stability. In contrast, middle-aged drivers might be relatively more risk averse due to family and job responsibilities.
In Figure 10, the price of the current TNC vehicle also shows a nonlinear effect on TNC driver EV choices. Unlike the effect of age, our modeling and survey results exhibit opposite trends in terms of current vehicle prices. The probability of acquiring an EV increases with the current vehicle price and drops after the price reaches USD 43 K and beyond. This discrepancy in nonlinear patterns may reflect several behavioral and financial dynamics. For example, it is likely due to the survey capturing past behaviors of early EV adopters among the TNC driver fleet; the model predicts the future vehicle choices of these drivers. More specifically, a driver who currently drives an expensive EV may be unwilling to acquire an EV for their TNC job. We also observe that drivers with mid-priced vehicles tend to be more receptive to adopting EVs. This may reflect a balance between financial capacity and cost-conscious decision making, although further research would be needed to confirm the underlying implications of this finding.
Another comparison is made on the income effect between full- and part-time drivers (see Figure 11 above). In general, higher-income drivers are more likely to adopt EVs, as lower-income individuals often face affordability concerns and tend to be more risk averse. EVs regain their popularity among full-time drivers after they reach a USD 55 K annual income. However, this pattern is reversed in the part-time driver model. The part-time driver EV adoption likelihood sharply increases at lower income levels and gradually decreases when they earn more than USD 36 K in a year. This contrast likely reveals a different relationship between the income levels and ridehailing reliance (e.g., for income) among the two groups.

4.3. Policy-Adjusted Models (Model Set 2)

Baseline models in Set 1 include only the vehicle, contextual, and individual characteristics. While these models reflect the natural EV choices among ridehailing drivers without any policy considerations, we seek to understand how to increase the TNC EV adoption. Thus, it is important to introduce EV policy-related variables into the model and evaluate the marginal impacts of policies on ridehailing driver EV choices. For this purpose, we further trained a collection of policy-adjusted models, or Model Set Two (2). Set Two models are built upon all final variables obtained in the baseline models and additionally incorporate the policy-related variables collected from SP questions 3 and 4 (Q3 and Q4). This adjusted experiment incorporates 1047 “pseudo” drivers, which is different from the 1079 “pseudo” drivers derived from the baseline models because the proportion of “Neither” answers are different in Q1 and Q2 vs. Q3 and Q4.
In addition, these models can be further split into Model Set 2-1 and Model Set 2-2, where Set 2-1 includes the vehicle-related incentives, and Set 2-2 includes both vehicle- and charging-related incentives. All proposed incentives are monetary.

4.3.1. Vehicle-Related Incentives (Model Set 2-1)

The first set of policy-adjusted models builds on the full set of 51 variables from the baseline models and adds 12 vehicle-related incentive variables (e.g., vehicle purchase discounts or price reductions), expanding the total number of explanatory variables to 63. Retaining all 51 baseline variables (rather than using the reduced set of 35) ensures a consistent model structure and allows for potential interaction effects between baseline factors and policy incentives. To address the risk of overfitting, we applied the same regularization techniques (i.e., the cross-validated Lasso model) to avoid the inclusion of insignificant variables. This approach also accounts for the possibility that TNC drivers may respond differently to existing factors when EV policies are introduced. Among all incentive variables, EV trip bonuses were initially considered but were later discovered to be statistically insignificant across all model specifications and were excluded from both Model Set 2-1 and 2-2.
Following the same modeling process as with the baseline models, we present the results in Table 7 below. For clarity, only the incentive variables are shown.
In Table 7, the high-value purchase discount indicator is a binary variable equal to one if the offered price reduction exceeds the median discount amount in the SP dataset (USD 4500). Additional transformations include the square of the purchase discount (to capture nonlinear effects) and the natural logarithm of the purchase discount (to capture diminishing sensitivity to incentive size). The same interpretation applies to tax credit variations.
One of the key takeaways from this analysis is that TNC part-time drivers generally respond less to high-value purchase discounts. In fact, they exhibit a greater reluctance to acquire EVs when the purchase discount (i.e., instant rebate at point of sale) exceeds USD 4500, with a stronger negative coefficient compared to full-time drivers (−1.1006 vs. −0.5215). This suggests that high instant rebates may be less effective among part-time drivers. In contrast, full-time drivers are much more responsive to income- and vehicle price-based instant rebates.
As for tax credits, TNC drivers are significantly more likely to acquire an EV if the vehicle price-based tax credit is high. In contrast, all drivers react negatively to EV options when the income-based tax credits increase. This pattern is consistent across both TNC driver groups. In addition, part-time drivers are significantly discouraged from acquiring EVs (−2.9294) given high-value tax credits (i.e., when tax credits exceed the median value at USD 3750). In other words, high-value tax credits may oftentimes be perceived as an added complexity, delayed benefit, and eligibility uncertainty, particularly among part-time drivers who rely less on ridehailing as their primary income source.
While Model Set 2-1 identifies several significant policy-related predictors for ridehailing EV adoption, its scope is limited to the vehicle price and tax-based incentives. However, EV adoption decisions may also be shaped by operational factors such as the charging rate and fuel cost savings, which are not captured in this specification and could impact the results. This necessitates the incorporation of Model Set 2-2.

4.3.2. Vehicle- and Charging-Related Incentives (Model Set 2-2)

Model Set 2-2 builds on the baseline specification (51 variables) by incorporating 10 incentive variables, including both vehicle-related and charging-related variables. Some vehicle-related incentives (e.g., tax credit, log tax credit) discussed in Model Set 2-1 are removed in Model Set 2-2 due to their insignificance. These results (see Table 8) offer a more comprehensive view of how both financial (vehicle-related) and operational (charging-related) incentives influence EV adoption among TNC drivers.
Table 8 suggests that Model Set 2−2 demonstrates a stronger performance in capturing the behavioral dynamics of both full-time and part-time TNC drivers. This model achieves an overall higher predictive power and reveals a diverse range of significant incentive effects, likely due to the addition of charging incentives and the refined incentive structure (i.e., removal of insignificant tax incentives) compared to Set 2-1.
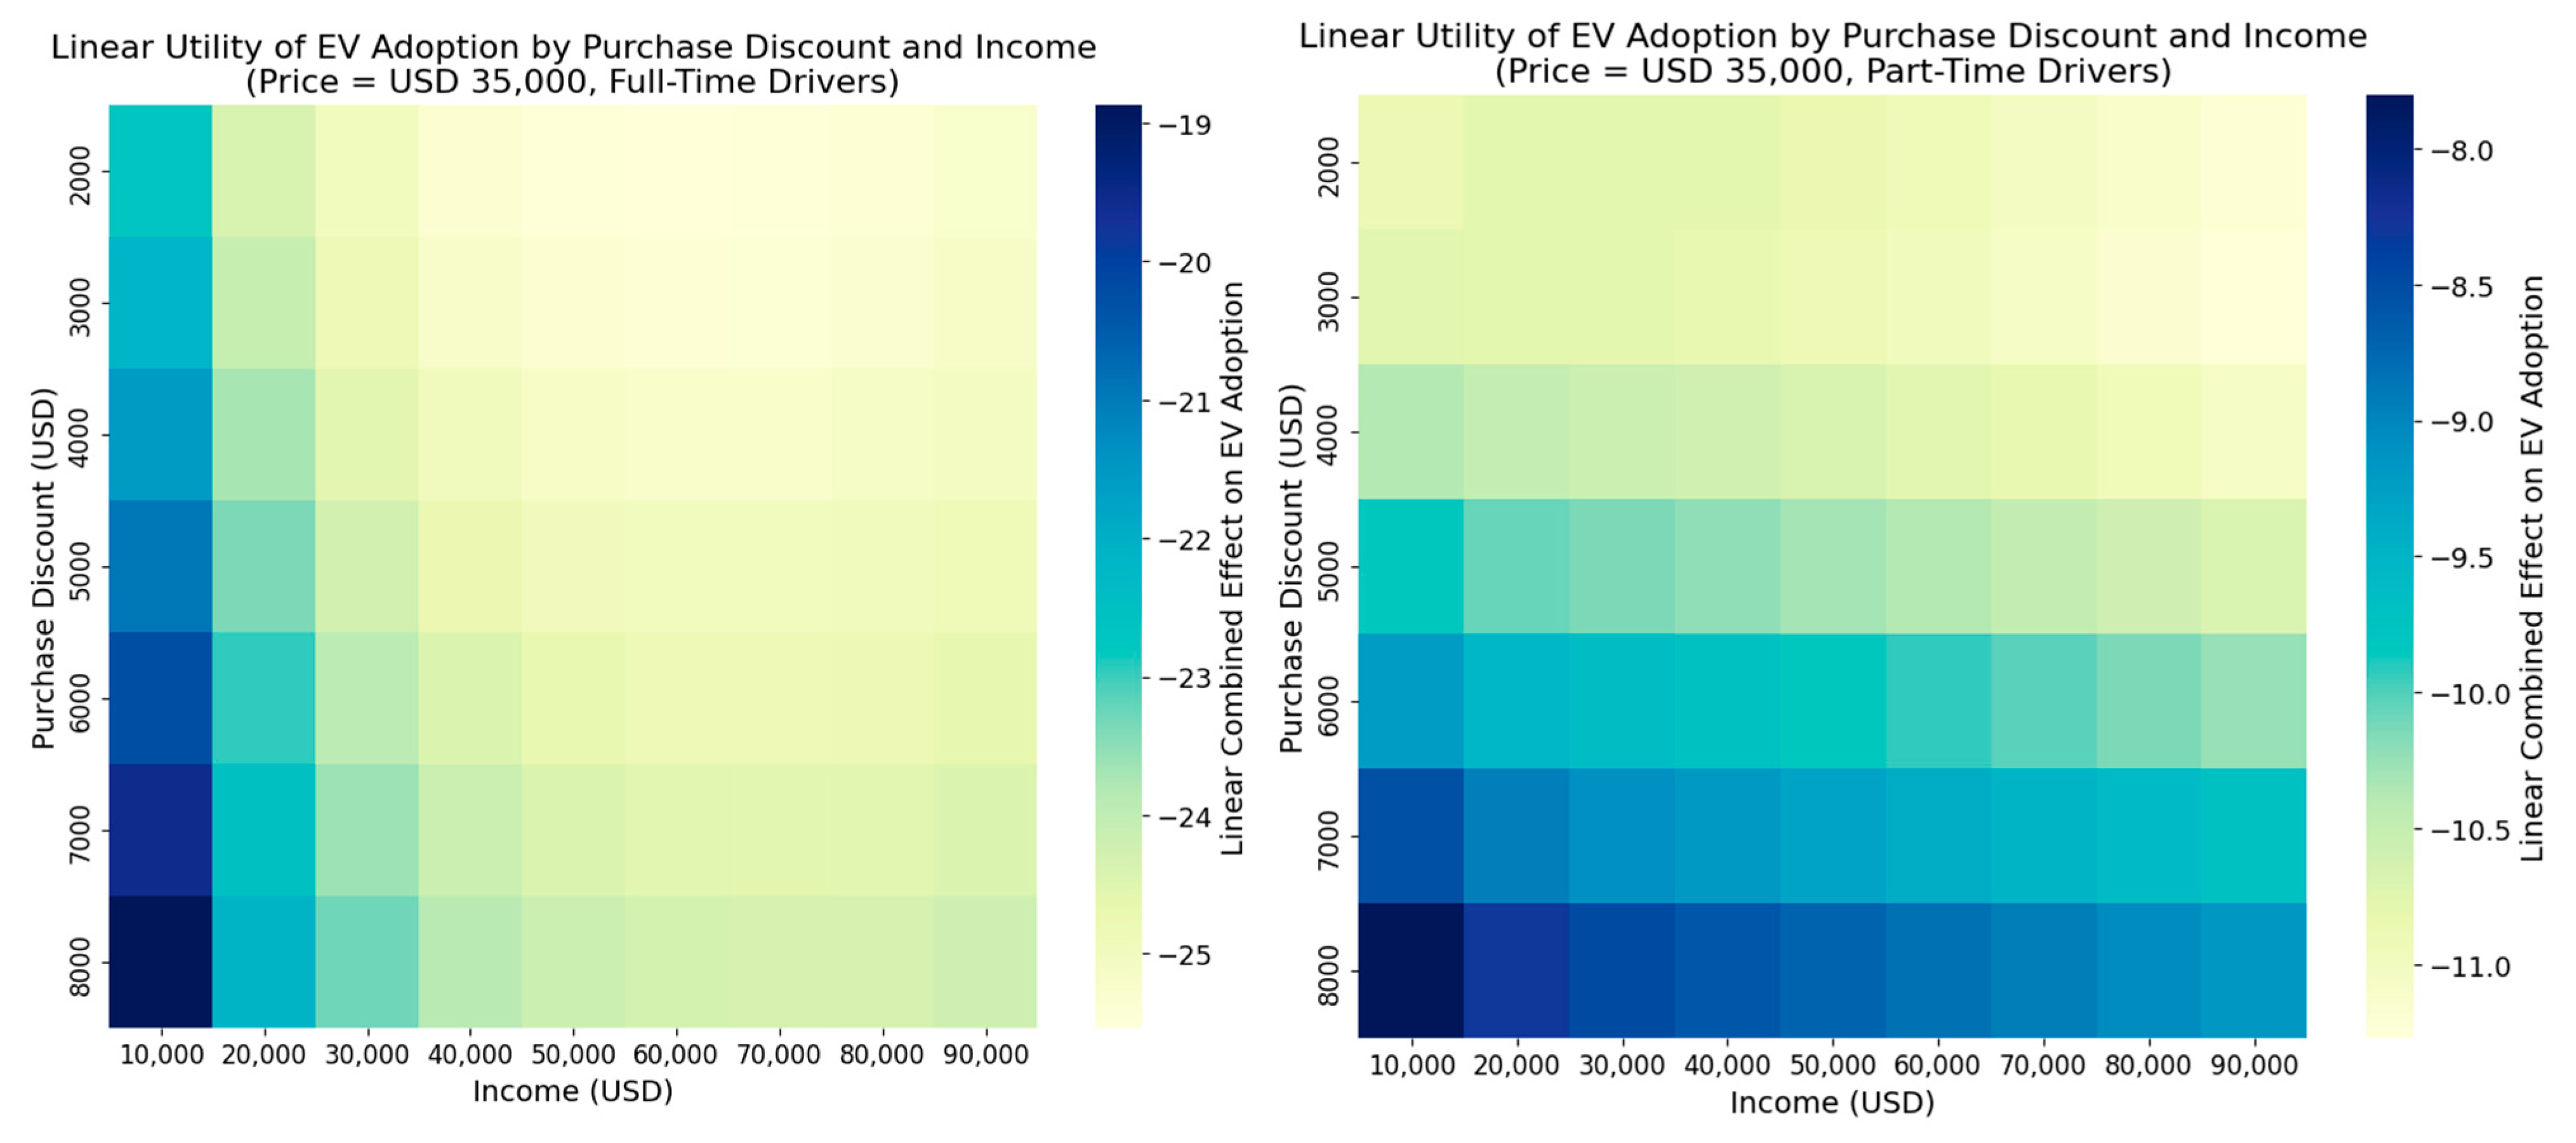
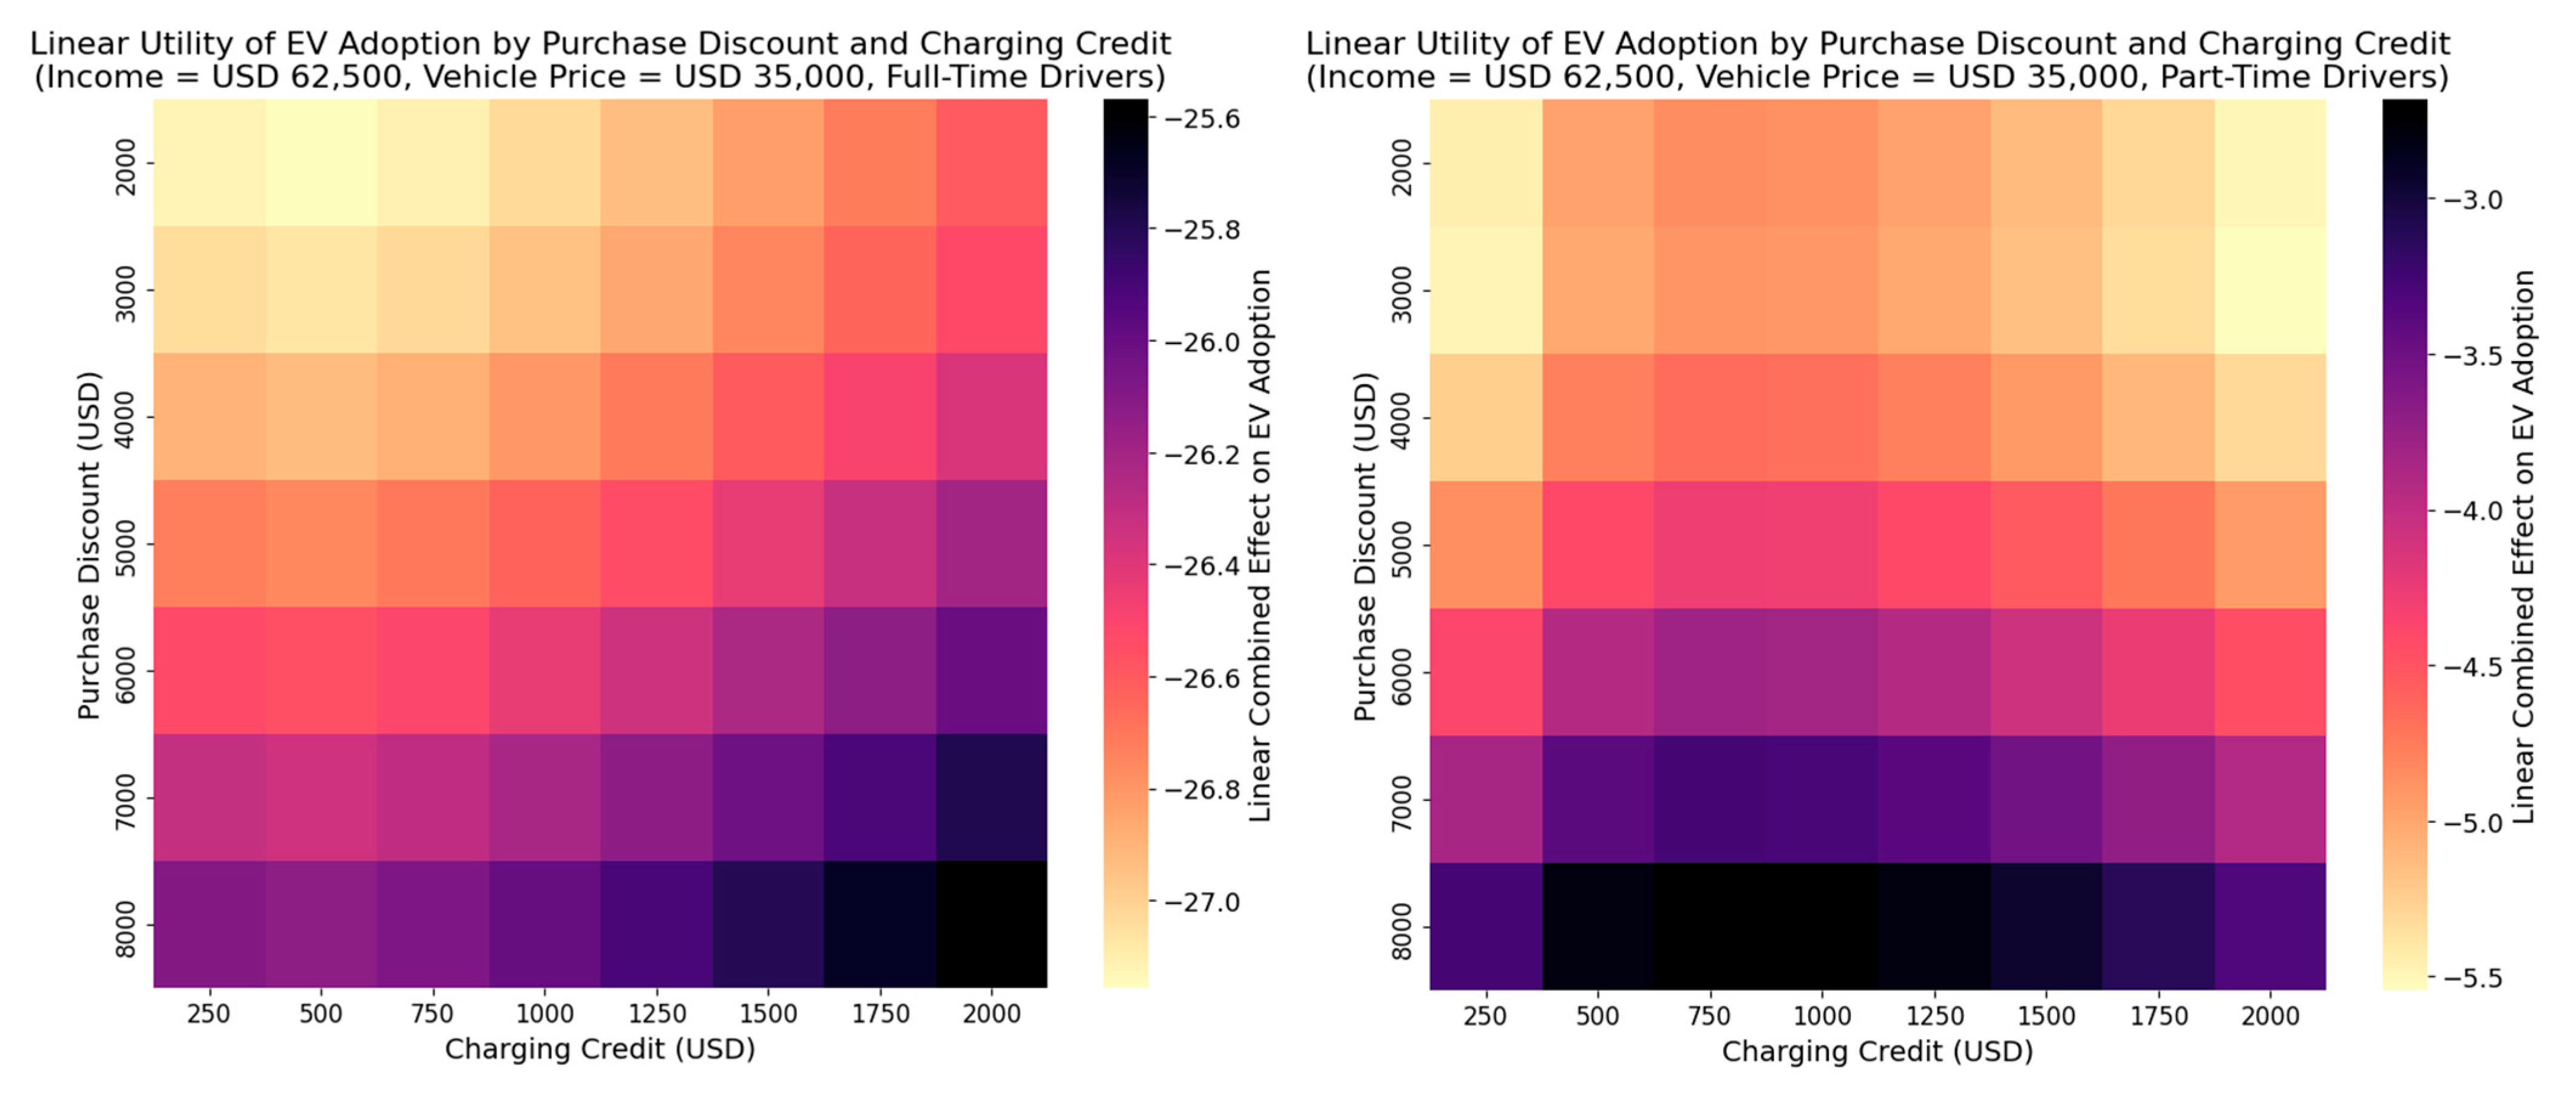
Unlike Model Set 2-1, all drivers in this model appear to be significantly responsive to purchase discounts (3.2125) and the income-based instant rebates (1.5433). This suggests that purchase discounts may only become effective when paired with charging-related support (e.g., charging credits). In addition, part-time drivers are much more motivated by purchase discounts (7.0379) compared to full-time drivers (1.3423), likely because they do not see the benefits of instant rebates unless they also perceive EV operations (i.e., charging logistics and fuel costs) as manageable. In other words, the addition of charging incentives unlocks the salience of purchase discounts by making ridehailing EV operations more affordable overall.
In Table 8, the fuel cost offset captures the estimated savings in the 100-mile charging cost resulting from the offered charging discount. The largest randomly generated 100-mile charging cost was USD 20, and the largest randomly generated charging discount was 100%, which reaches a total fuel cost offset range of USD 0 to USD 20 per 100 miles of driving. Additional transformations include the natural logarithm of the charging credit, used to model diminishing returns to the incentive size.
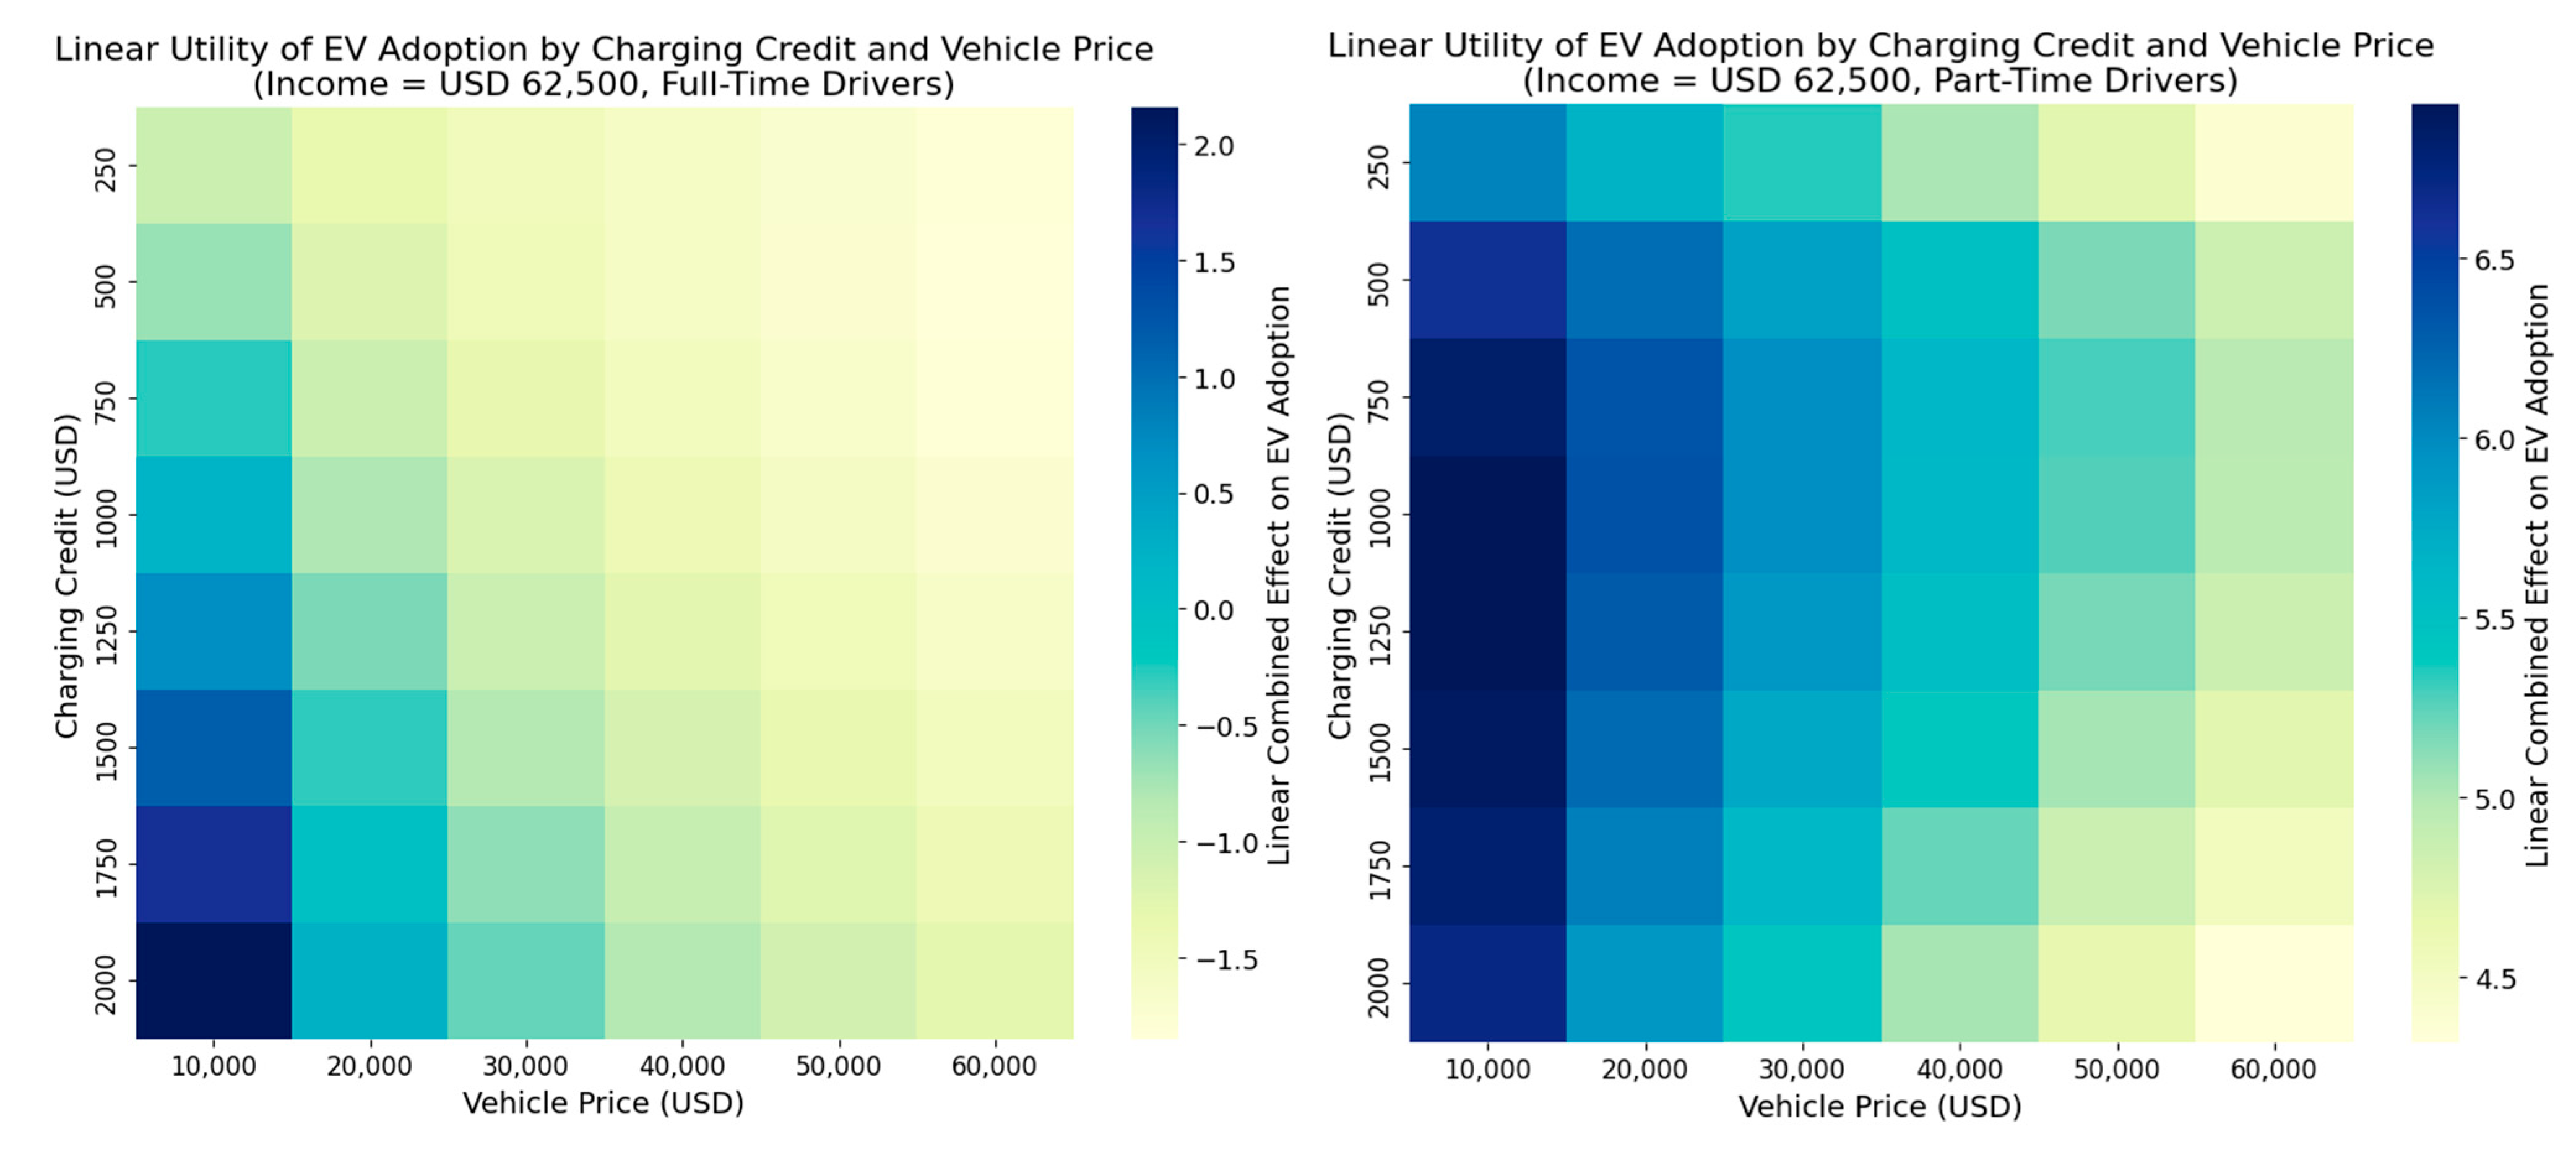
According to the modeling results, part-time TNC drivers are significantly more likely to adopt an EV as the total fuel cost offset increases (1.8793). They are also strongly motivated by smaller charging credits (e.g., log charging credit, 9.5909), but larger credit amounts appear to have a discouraging effect on their EV adoption decisions (e.g., charging credit, −3.0813). This likely reflects the more limited financial flexibility typically associated with part-time drivers. While smaller charging credits seem effective in helping with EV purchases, there is a diminishing marginal effect as the incentive size increases. In contrast, full-time drivers are relatively more indifferent to charging credits (0.6258 full-time vs. −3.0813 part-time), but they are more sensitive to vehicle price-based charging credits (2.3798 full-time vs. 0.6442 part-time) tailored to EV prices.
Our qualitative data support these findings, with both experts and drivers emphasizing the need for clearer, TNC driver-focused incentives and educational programs to help drivers understand and choose the most suitable options. During discussions, drivers also expressed that the primary responsibility for advancing the EV transition in the ridehailing sector rests with the state and TNC companies, particularly through financial and infrastructural support.

4.3.3. Comparison of Model Set 2-1 and Model Set 2-2

The EV policy-adjusted models assess how monetary incentives influence EV adoption decisions among full- and part-time ridehailing drivers. Model Set 2-1 includes only vehicle-related incentives. It captures key responsiveness patterns, particularly the strong influence of income- and price-based instant rebates and income-based tax credits, among full-time drivers.
Model Set 2-2 builds on this by incorporating charging-related incentive variables, which enhances the model’s explanatory power among both driver groups, especially among part-time drivers (see Table 9). The inclusion of fuel cost offsets and charging credits allows the model to account for EV operational concerns (e.g., charging accessibility and affordability) that vehicle-related incentives alone do not fully capture. Notably, part-time drivers are found to be more motivated by purchase discounts, smaller (e.g., log-transformed) charging credits, and predictable total fuel cost offsets.
Key performance metrics for both model sets are summarized in Table 9 below.
Overall, both model sets perform well across driver groups. When we used McFadden’s R2 and the test set accuracy as key performance metrics, we found that Model Set 2-2 provides only minor (or occasionally negative) improvements over Model Set 2-1 for all drivers and full-time drivers. However, it shows a substantial improvement for part-time drivers across both metrics. This indicates that while vehicle-related incentives are generally effective in promoting EV adoption among TNC drivers, charging-related incentives may better match the preferences and perceived needs of drivers who use TNC work as a supplementary income source. These results highlight the importance of broadening the EV policy design beyond EV price reductions to include incentives that address drivers’ ongoing operational needs, particularly charging-related support.

4.4. Policy Simulations and Implications

This study establishes baseline and policy-adjusted discrete choice models to identify key determinants that shape ridehailing driver decisions on EV adoption. However, the estimated coefficients alone cannot inform of their combined effects on EV adoption under different policy scenarios (e.g., different inputs of purchase discounts, charging credits). In this section, we perform a series of policy simulations to investigate ridehailing drivers’ perceived utility of EV adoption given a range of incentive variables, EV prices, and driver incomes (Figure 12, Figure 13 and Figure 14), using coefficients estimated from Model Set 2-2. While many incentive variables are examined in the policy-adjusted models, we only evaluate the effect of purchase discounts and charging credits in this exercise, which are representative of vehicle-related variables and charging-related variables, respectively. In the policy-adjusted models, most incentive variables involve nonlinear forms (e.g., logarithmic purchase discounts) and interactions with other variables (e.g., vehicle price-based charging credits), which necessitates a multi-dimensional inspection of their combined effects on ridehailing EV adoption.
While the logistic model takes the sigmoid form of the derived utility, the sigmoid function is highly compressed toward extreme values (0 or 1), making the results not visually prominent. Therefore, we present the linear utilities to ensure the better interpretability of the figures. Similarly to Figure 9, Figure 10 and Figure 11, the estimated constant terms are not included in these utility computations, meaning that key insights in Figure 12, Figure 13 and Figure 14 are informed by the relative values and general trends, rather than the absolute values.
Figure 12 presents the linear combined effect of purchase discounts across a range of income levels (i.e., USD 10,000 to USD 90,000) on ridehailing EV adoption, assuming that the EV price is USD 35,000. Darker blue colors suggest a greater EV affection and lighter yellow colors indicate a lower EV adoption likelihood. In both full-time and part-time driver groups, the general preference for EVs increases with the increase in purchase discounts. In the meantime, drivers become less motivated by EVs as their income increases. For example, both groups respond most positively to the highest purchase discount (e.g., USD 8000) when they earn the least annual income (e.g., USD 10,000). This is consistent with Section 4.3.2’s findings that income-based instant rebates have a positive effect on EV adoption. It is observable that full-time drivers are much more sensitive to the point-of-sale rebates over their household income because their EV adoption utility diminishes much more rapidly when their income increases. In contrast, part-time drivers exhibit a more modest utility gain from purchase discounts, with smaller differences among income groups.
Overall, these findings suggest that full-time drivers are more motivated by purchase discounts, especially when their incomes are relatively low.
In Figure 13, we examine the effect of charging credits given a range of vehicle prices (i.e., USD 10,000 to USD 60,000), assuming the driver’s income is USD 62,500. Like Figure 12, full-time drivers are most motivated to acquire an EV when they are offered the most charging credit (e.g., USD 2000) for the most affordable vehicle (e.g., USD 10,000). Utility values decrease noticeably as the vehicle price increases, indicating that as EVs become more expensive, the positive effect of charging credits is weakened.
Among part-time drivers, the income-associated utility diminishing effect also persists. However, the charging credit becomes most effective around moderate levels (i.e., USD 1000 to USD 1500) and slightly declines when the incentive reaches beyond USD 1500. This reflects a threshold beyond which an additional charging credit no longer significantly improves the perceived utility of the EV adoption, particularly among part-time drivers who may charge less frequently due to the fewer hours they contribute to TNC driving every day. In other words, once enough charging credit is offered to part-time drivers, further charging support becomes less appealing.
Lastly, Figure 14 illustrates the combined effect of both purchase discounts and charging credits, assuming that the EV price is USD 35,000 and the driver income is USD 62,500. Darker purple and lighter yellow colors indicate greater and smaller EV adoption probabilities, respectively. For full-time drivers, it is always the most incentive package (e.g., USD 8000 instant rebate and USD 2000 charging credit) that yields the strongest positive influence on their EV choice. The utility increases steadily across both dimensions of incentives.
Among part-time drivers, however, their reaction toward incentive bundles is more nuanced. Moderate charging credits (e.g., USD 500 to USD 1500) tend to offer a greater EV adoption potential among them. This finding is consistent with the findings from Figure 13, suggesting diminishing marginal benefits of charging credits for part-time drivers.
Overall, full-time drivers, especially those with lower incomes, are highly responsive to EV purchase discounts and charging incentives. These drivers should be prioritized for the most generous subsidies possible. In contrast, part-time drivers also respond positively to purchase discounts, but they exhibit diminishing marginal preferences for increasing charging credits. Moderate charging incentives (e.g., USD 500 to USD 1500) and stronger purchase discounts should be targeted at these drivers. Policymakers should consider applying layered EV incentives, rather than individual incentives in isolation, to ensure that EVs are both affordable and appealing to TNC drivers.

5. Conclusions

This study explores the perceptions and inclinations toward EVs among full-time and part-time TNC drivers. It contributes to the growing body of EV research by focusing on the ridehailing driver context, distinguishing between full- and part-time drivers, applying a structured discrete choice modeling framework, and integrating qualitative and quantitative research methods. The findings deepen our understanding of the needs and concerns of TNC drivers with respect to the SB 1014 implementation, identify key factors influencing ridehailing EV adoption, and assist policymakers in developing effective, tailored EV incentives for full- and part-time drivers.

5.1. EV Adoption Predictors

The two key predictors of ridehailing EV adoption identified in the modeling are home charging access and past EV experience, both of which have a strong predictive power. These factors are particularly significant for part-time TNC drivers, suggesting that a familiarity with EVs helps bridge knowledge gaps and reduce risk concerns. Access to home charging also alleviates range anxiety, especially for part-time drivers with irregular shifts. Full-time drivers, while confident about EV ranges, express concerns about the availability of public fast chargers and the potential for lost income or trips due to longer EV charging times. This suggests that charging infrastructure accessibility and reliability could be an important factor in ridehailing driver decisions regarding EV operations. That said, public charging-related factors were not significant in the model, likely due to the unfamiliarity and perceived intangibility of operational factors in the SP survey. We discuss the corresponding policy recommendations in Section 5.2.
Additionally, this study finds that highly urban environments, while appealing to existing EV drivers due to the higher demand, may present challenges for non-EV drivers with limited access to home charging. This highlights the need for an investment in expanding urban charging infrastructure and ensuring charging reliability.
Our models also reveal that viewing TNC work as a primary income source makes EVs more attractive to drivers. This is connected to the working intensity, particularly the distinction between full- and part-time drivers. The analysis shows that full-time drivers are more likely to currently drive an EV and are more likely to choose an EV for their TNC work in hypothetical scenarios. In contrast, part-time drivers exhibit limited familiarity with EVs and are more risk averse in considering EV adoption. Over 80% of full-time drivers work long shifts (8:00 a.m. to 8:00 p.m.) Monday through Saturday, indicating a greater need for cost-effective, economically viable vehicles like EVs. Part-time drivers, who primarily drive to supplement their income, are less likely to view EVs as a worthwhile investment.

5.2. Incentive Effects on EV Adoption

In terms of incentives, full-time drivers are more likely to value financial support that is based on their income eligibility and vehicle prices, such as income-based instant rebates or vehicle price-based charging credits. These incentive structures scale benefits in proportion to a driver’s income or an EV’s price, which can be especially powerful among low-income full-time drivers whose EV adoption decision is primarily constrained by EV affordability.
Part-time drivers, on the other hand, tend to respond more favorably to fixed vehicle purchase discounts and EV fuel cost savings. They are most responsive to charging credits in the moderate USD 500 to USD 1500 range, where the predicted EV adoption likelihood is the greatest (see Figure 13 and Figure 14). This highlights that the charging incentive is particularly effective among part-time drivers who contribute a lower frequency of TNC driving and may be more concerned about EV operational support (e.g., charging).
Overall, policymakers should offer more purchase discounts to low-income full-time drivers, while making sure that charging is accessible and affordable among part-time drivers. All incentives should be supplemented by more affordable EV models.
With respect to EV charging, most full-time EV drivers rely on Level 2 home charging, likely overnight, while many part-time EV drivers use Level 1 outlets. This highlights the limited flexibility of full-time drivers, who have longer working hours. In terms of charging infrastructure access, while more than half of full-time EV drivers use Level 2 home charging, a significantly larger proportion of part-time non-EV drivers have access to both Level 1 and Level 2 charging at home. This suggests that while fewer part-time drivers express an interest in EVs, they may have more EV-ready homes with better charging access.
To conclude, policymakers should develop tailored (vs. one-size-fits-all) and layered (vs. isolated) EV incentive programs, accounting for the diverse needs and driving patterns of full-time and part-time ridehailing drivers. TNCs should work closely with state agencies to communicate the most suitable incentive options for individual drivers.

5.3. Quantitative and Qualitative Finding Divergence

It is important to note that the qualitative findings from expert interviews and driver group discussions sometimes support and challenge the insights drawn from the descriptive survey and modeling analyses. For example, while homeownership (detached or attached) is expected to correlate with a higher EV adoption, the model suggests that homeownership alone is not a strong predictor unless it is paired with better access to private EV charging. This discrepancy underscores the value of using mixed research methods, since relying on a single approach may overlook key nuances that offer a more comprehensive understanding of the ridehailing electrification process. Combining methods allows for the capture of unexpected dynamics and the identification of areas for future research.

5.4. Limitations and Future Research

This study has several methodological limitations. While SB 1014 is a statewide policy, our survey sample is skewed toward Southern California drivers, which may introduce biases in perceptions of EVs and policy responses. Additionally, the survey was conducted during specific timeframes in late 2023 and early 2024, while ridehailing dynamics, such as fluctuating electricity and gas prices, may evolve rapidly, affecting driver preferences and acquisition plans. Driver small group discussions focused on full-time TNC drivers. While part-time driver views were partially addressed in our expert interviews, their perspectives may not be fully represented. Finally, while the discrete choice models allow for flexibility in vehicle and policy attribute combinations, the randomly generated variables may not align with actual vehicle models available in the market. Nevertheless, the modeling exercise provides valuable insights that can guide policymakers and ridehailing companies in developing incentives that effectively support EV adoption among both full- and part-time drivers in the TNC sector.
Future research could expand on this study by conducting a higher-resolution geographic analysis of the public charging distribution and its alignment with ridehailing driver activities and the potential EV charging demand. A specific look can be taken at the urban–rural disparities, charger densities, charger proximity to high-demand TNC services areas, as well as charging accessibility in multifamily driver communities. Longitudinal studies could also be conducted to track how TNC driver perceptions of EVs and policies evolve over time. In addition, as shared automated vehicles (SAVs) continue to gain momentum as a transformative mobility option in this era, future work could examine the applicability of these findings to driverless ridehailing fleets, particularly with respect to the SAV charging behavior, policy design, and fleet management strategies.

Author Contributions

Study conception and design: S.S., M.J. and E.M.; data collection: M.J., E.M. and S.S.; analysis and interpretation of results: M.J., E.M. and S.S.; draft manuscript preparation: M.J., E.M. and S.S. All authors have read and agreed to the published version of the manuscript.

Funding

This study was funded by the Road Repair and Accountability Act (SB 1) under the Statewide Research Transportation Program (STRP), grant number UC-ITS-2023-24.

Institutional Review Board Statement

This study was conducted in accordance with the Decla-ration of Helsinki, and it was approved by the Institutional Review Board of the University of California, Berkeley (2023-03-16130 on 17 November 2023).

Informed Consent Statement

Informed consent was obtained from all subjects involved in the study.

Data Availability Statement

This study collected first-hand data through surveys, interviews, and driver group discussions. These data are confidential and are not publicly available.

Acknowledgments

The authors thank the Road Repair and Accountability Act (SB 1) under the Statewide Transportation Research Program (STRP) for supporting this research at University of California, Berkeley, via the Transportation Sustainability Research Center. The authors would like to thank Rideshare Drivers United (RDU) for commenting and advising on this work. We thank the California Public Utilities Commission (CPUC), the California Air Resources Board (CARB), and the International Association of Transportation Regulators (IATR) for supporting this research proposal. Please note that Shaheen is a member of the CARB’s Board. As noted earlier, this research is funded by SB 1, which is an independent funding source.

Conflicts of Interest

The authors of this study declare no known competing interests that may affect this reported work.

References

  1. San Francisco County Transportation Authority (SFCTA). TNCs & Congestion. 2018. Available online: https://www.sfcta.org/sites/default/files/2019-05/TNCs_Congestion_Report_181015_Finals.pdf (accessed on 1 May 2022).
  2. SB 1014; Bill Text—SB-1014 California Clean Miles Standard and Incentive Program: Zero-Emission Vehicles. California Legislature: Sacramento, CA, USA, 2018. Available online: https://leginfo.legislature.ca.gov/faces/billTextClient.xhtml?bill_id=201720180SB1014 (accessed on 1 May 2022).
  3. Latham and Watkins. 4 Things to Know About CARBs Clean Miles Standard. 24 November 2020. Available online: https://www.jdsupra.com/post/fileServer.aspx?fName=123e974d-4c43-4f46-9c83-d8e40a1c8ff3.pdf (accessed on 1 May 2022).
  4. California Air Resources Board, Clean Miles Standard. Available online: https://ww2.arb.ca.gov/our-work/programs/clean-miles-standard/about (accessed on 13 May 2025).
  5. Valdes, R. How Much Are Electric Cars? Kelley Blue Book. Available online: https://www.kbb.com/car-advice/how-much-electric-car-cost/ (accessed on 23 June 2025).
  6. Ju, M.; Martin, E.; Shaheen, S. Transitioning Ridehailing Fleets to Zero Emission: Economic Insights for Electric Vehicle Acquisition. World Electr. Veh. J. 2025, 16, 3. [Google Scholar] [CrossRef]
  7. City of Seattle. TNC Driver Outreach and Engagement—Final Report. 2020. Available online: https://durkan.seattle.gov/wp-content/uploads/sites/9/2020/08/Final-Outreach-Report.pdf (accessed on 1 May 2022).
  8. Benner, C.; Johansson, E.; Feng, K.; Witt, H. On-Demand and On-The-Edge: Ride-Hailing and Delivery Workers in San Francisco; UCSC Institute for Social Transformation: Santa Cruz, CA, USA, 4 May 2020; Available online: https://transform.ucsc.edu/on-demand-and-on-the-edge/ (accessed on 1 May 2022).
  9. Waheed, S.; Herrera, L.; Gonzalez-Vasquez, A.L.; Shadduck-Hernández, J.; Koonse, T.; Leynov, D. More Than a Gig: A Survey of Ride-hailing Drivers in Los Angeles. UCLA Labor Center: Los Angeles, CA, USA, 2018. Available online: https://escholarship.org/uc/item/4w6112md (accessed on 1 May 2022).
  10. Hunt, J.; McKearnan, S. Accelerating Ride-Hailing Electrification: Challenges, Benefits, and Options for State Action; Northeast States for Coordinated Air Use Management: Boston, MA, USA, 2020. [Google Scholar]
  11. Vassileva, I.; Campillo, J. Adoption Barriers for Electric Vehicles: Experiences from Early Adopters in Sweden. Energy 2017, 120, 632–641. [Google Scholar] [CrossRef]
  12. Hardman, S.; Fleming, K.L.; Khare, E.; Ramadan, M.M. A Perspective on Equity in the Transition to Electric Vehicles. MIT Sci. Policy Rev. 2021, 2, 46–54. [Google Scholar] [CrossRef]
  13. Reich, M.; Parrott, J.A. A Minimum Compensation Standard for Seattle TNC Drivers. 2020. Available online: https://escholarship.org/uc/item/1fw4q65g (accessed on 1 May 2022).
  14. Anderson, D.N. “Not Just a Taxi”? For-Profit Ridesharing, Driver Strategies, and VMT. Transportation 2014, 41, 1099–1117. [Google Scholar] [CrossRef]
  15. Uber. Uber Comfort Electric. Available online: https://www.uber.com/us/en/drive/services/comfort-electric/ (accessed on 8 April 2025).
  16. Uber. Uber Green—Sustainable Rides in Electric or Hybrid Vehicles on Uber. Available online: https://www.uber.com/ca/en/ride/ubergreen/ (accessed on 3 May 2025).
  17. CPUC. CARE/FERA Program. 2024. Available online: https://www.cpuc.ca.gov/industries-and-topics/electrical-energy/electric-costs/care-fera-program (accessed on 1 May 2025).
  18. Choi, S.J.; Jiao, J.; Mendez, T. Who Owns Electric Vehicles (EVs)? The Relationship between EV Adoption and Socio-Demographic Characteristics across Different Price Segments and Brands in the Texas Triangle. Res. Transp. Bus. Manag. 2024, 57, 101225. [Google Scholar] [CrossRef]
  19. Hsu, C.-W.; Fingerman, K. Public Electric Vehicle Charger Access Disparities across Race and Income in California. Transp. Policy 2021, 100, 59–67. [Google Scholar] [CrossRef]
  20. Qiao, S.; Huang, G.; Yeh, A.G.-O. Who Are the Gig Workers? Evidence from Mapping the Residential Locations of Ride-Hailing Drivers by a Big Data Approach. Cities 2023, 132, 104112. [Google Scholar] [CrossRef]
  21. Jia, W.; Chen, T.D. Are Individuals’ Stated Preferences for Electric Vehicles (EVs) Consistent with Real-World EV Ownership Patterns? Transp. Res. Part D 2021, 93, 102728. [Google Scholar] [CrossRef]
  22. Kajanova, M.; Bracinik, P. Definition of Discrete Choice Models of EV Owners Based on Different Socio-Demographic Aspects. Appl. Sci. 2021, 11, 8. [Google Scholar] [CrossRef]
  23. Westin, K.; Jansson, J.; Nordlund, A. The Importance of Socio-Demographic Characteristics, Geographic Setting, and Attitudes for Adoption of Electric Vehicles in Sweden. Travel Behav. Soc. 2018, 13, 118–127. [Google Scholar] [CrossRef]
  24. Sanguinetti, A.; Kurani, K. Electrifying Ridehailing: Characteristics and Experiences of Transportation Network Company Drivers Who Adopted Electric Vehicles Ahead of the Curve; UC Office of the President: University of California Institute of Transportation Studies: Oakland, CA, USA, 2022; Available online: https://doi.org/10.7922/G2HM56RD (accessed on 9 June 2022).
  25. Zhang, Q.; Liu, Y. Promoting Electric Vehicle Adoption in Ride-Hailing Platforms: To Control or Subsidize? Comput. Ind. Eng. 2024, 191, 110146. [Google Scholar] [CrossRef]
  26. Rye, J.; Sintov, N.D. Predictors of Electric Vehicle Adoption Intent in Rideshare Drivers Relative to Commuters. Transp. Res. Part A 2024, 179, 103943. [Google Scholar] [CrossRef]
  27. Hao, X.; Wang, H.; Lin, Z.; Ouyang, M. Seasonal Effects on Electric Vehicle Energy Consumption and Driving Range: A Case Study on Personal, Taxi, and Ridesharing Vehicles. J. Clean. Prod. 2020, 249, 119403. [Google Scholar] [CrossRef]
  28. Tu, W.; Santi, P.; Zhao, T.; He, X.; Li, Q.; Dong, L.; Wallington, T.J.; Ratti, C. Acceptability, Energy Consumption, and Costs of Electric Vehicle for Ride-Hailing Drivers in Beijing. Appl. Energy 2019, 250, 147–160. [Google Scholar] [CrossRef]
  29. Shaheen, S.; Wolfe, B.; Cohen, A.; Broader, J. Challenges and Opportunities Facing App-Based Gig Drivers Extend Beyond Driver Pay. 2024. Available online: https://escholarship.org/uc/item/514205n7 (accessed on 1 May 2025).
  30. Shetty, A.; Li, S.; Tavafoghi, H.; Qin, J.; Poolla, K.; Varaiya, P. An Analysis of Labor Regulations for Transportation Network Companies. Econ. Transp. 2022, 32, 100284. [Google Scholar] [CrossRef]
  31. Zakir, T. Working for Uber: Full-Time Employment or Just a Side ‘Gig’? NYUJLB, 13 October 2022. Available online: https://www.nyujlb.org/single-post/working-for-uber-full-time-employment-or-just-a-side-gig (accessed on 1 May 2022).
  32. Parrott, J.A.; Reich, M. An Earnings Standard for New York City’s App-Based Drivers; The New School: Center for New York City Affairs: New York, NY, USA, 2018; Available online: https://www.centernyc.org/s/Parrott-Reich-NYC-App-Drivers-TLC-Jul-2018jul1.pdf (accessed on 16 October 2024).
  33. Ma, N.F.; Hanrahan, B.V. Part-Time Ride-Sharing: Recognizing the Context in Which Drivers Ride-Share and Its Impact on Platform Use. Proc. ACM Hum. Comput. Interact. 2019, 3, 1–17. [Google Scholar] [CrossRef]
  34. Campbell, H. Is Driving Uber/Lyft Full Time A Viable Option in 2024? LinkedIn. 12 May 2024. Available online: https://www.linkedin.com/pulse/driving-uberlyft-full-time-viable-option-2024-harry-campbell-ny9df/ (accessed on 17 October 2024).
  35. McFadden, D. Conditional Logit Analysis of Qualitative Choice Behavior; UC Berkeley: Berkeley, CA, USA, 1972; Available online: https://escholarship.org/content/qt61s3q2xr/qt61s3q2xr.pdf (accessed on 7 April 2025).
  36. Ben-Akiva, M.E.; Lerman, S.R. Discrete Choice Analysis: Theory and Application to Travel Demand; MIT Press: Cambridge, MA, USA, 1985; Available online: https://books.google.com/books?hl=en&lr=&id=oLC6ZYPs9UoC (accessed on 23 March 2025).
  37. Allison, P.D. Comparing Logit and Probit Coefficients Across Groups. Sociol. Methods Res. 1999, 28, 186–208. [Google Scholar] [CrossRef]
  38. SFCTA. TNCs 2020: A Profile of Ride-Hailing in California; San Francisco County Transportation Authority: San Francisco, CA, USA, 2023; Available online: https://www.sfcta.org/sites/default/files/2023-04/SFCTA_Board_TNCs%202020%20Report_2023-04-25.pdf (accessed on 23 March 2025).
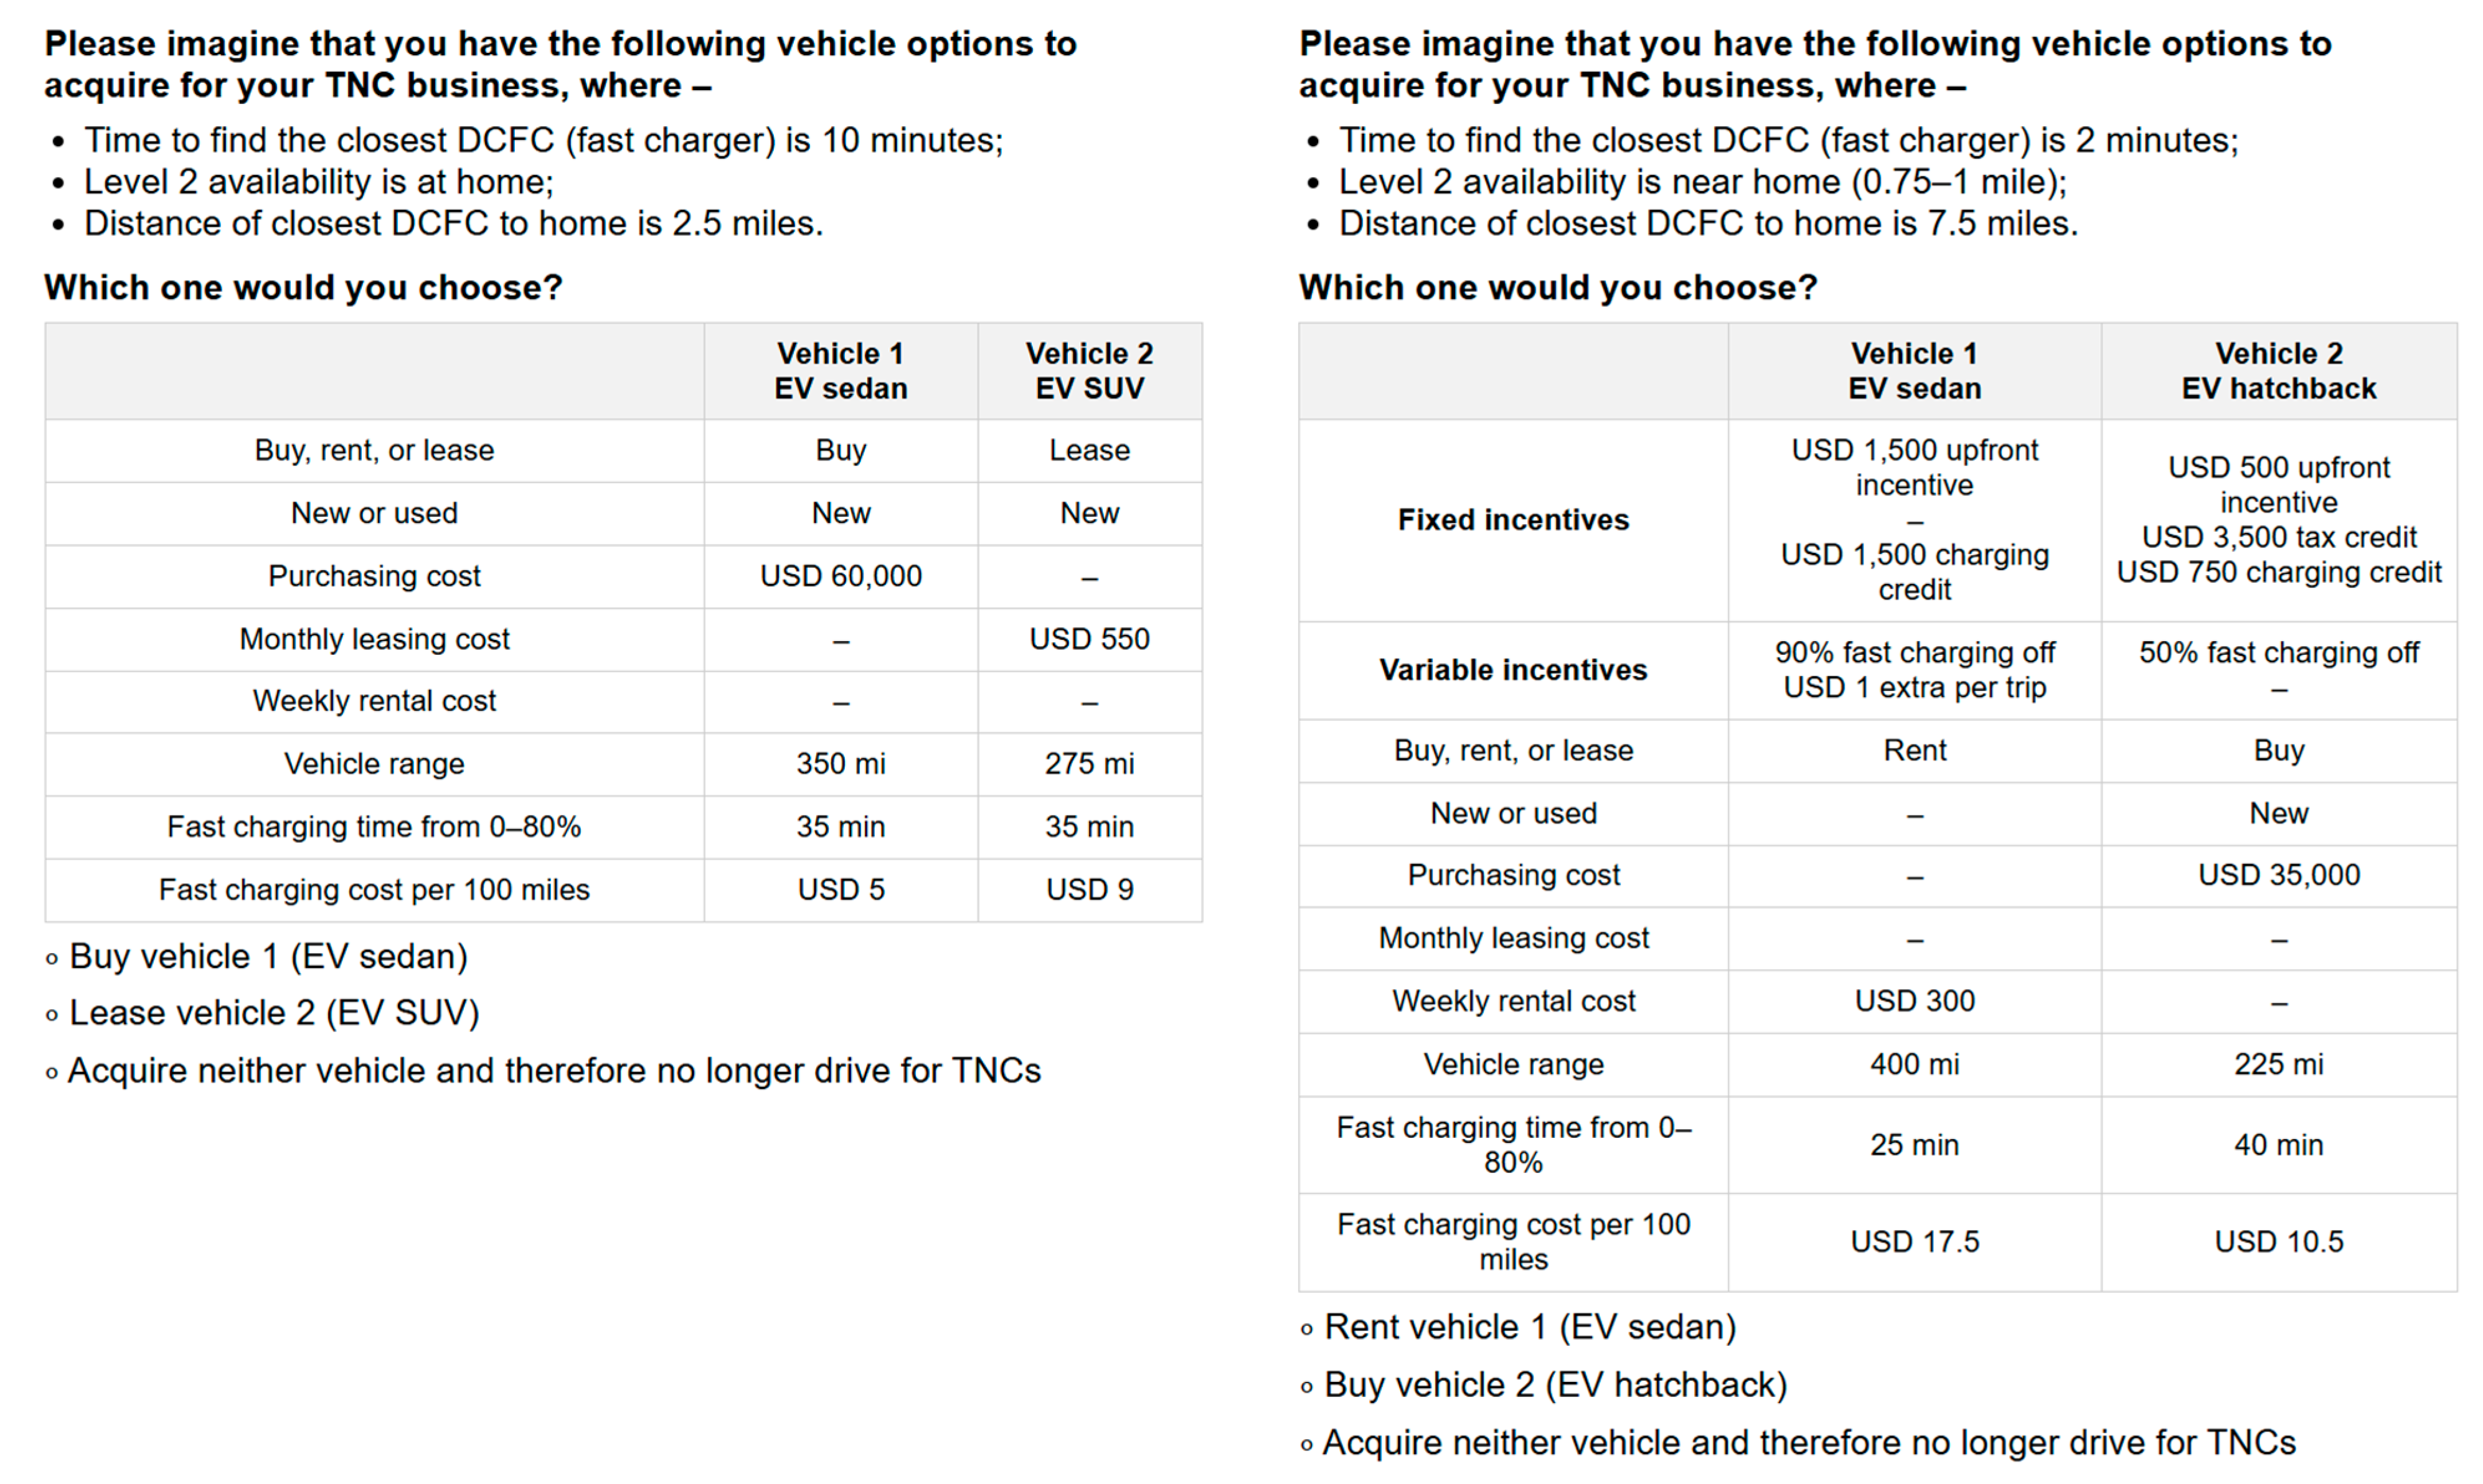
Figure 1. Example of SP questions without EV incentives (left, Q1 and Q2) and with EV incentives available (right, Q3 and Q4).
Wevj 16 00368 g001
Figure 2. Age (left) and income (right) distribution among full- and part-time ridehailing drivers. *: p-value < 0.1; **: p-value < 0.05; and ***: p-value < 0.01.
Wevj 16 00368 g002
Figure 3. Children (left) and housing type (right) distribution among full-time and part-time ridehailing drivers. *: p-value < 0.1; **: p-value < 0.05; and ***: p-value < 0.01.
Wevj 16 00368 g003
Figure 4. Weekly (left) and daily (right) driving schedule among full-time and part-time drivers. *: p-value < 0.1; **: p-value < 0.05; and ***: p-value < 0.01.
Wevj 16 00368 g004
Figure 5. EV (left) and non-EV (right) driver’s home charging access among full-time and part-time ridehailing drivers. *: p-value < 0.1; **: p-value < 0.05; and ***: p-value < 0.01.
Wevj 16 00368 g005
Figure 6. Weekly TNC income (left) and vehicle fuel cost (right) among full-time and part-time ridehailing drivers. *: p-value < 0.1; **: p-value < 0.05; and ***: p-value < 0.01.
Wevj 16 00368 g006
Figure 7. TNC driver tenure (left) and current TNC vehicle acquisition pathways (right) among full- and part-time ridehailing drivers. *: p-value < 0.1; **: p-value < 0.05; and ***: p-value < 0.01.
Wevj 16 00368 g007
Figure 8. TNC driver perceptions on EV range (left) and EV opportunity cost (right) for ridehailing use among full- and part-time ridehailing drivers. *: p-value < 0.1; **: p-value < 0.05; and ***: p-value < 0.01.
Wevj 16 00368 g008
Figure 9. The nonlinearity of the age effect in the model and TNC driver survey.
Wevj 16 00368 g009
Figure 10. The nonlinearity of the current vehicle price effect in the model and the survey.
Wevj 16 00368 g010
Figure 11. The nonlinearity of the income effect in the full- and part-time models.
Wevj 16 00368 g011
Figure 12. Linear utility of EV adoption by purchase discount and income among full-time (left) and part-time (right) ridehailing drivers.
Wevj 16 00368 g012
Figure 13. Linear utility of EV adoption by charging credit and vehicle price among full-time (left) and part-time (right) ridehailing drivers.
Wevj 16 00368 g013
Figure 14. Linear utility of EV adoption by purchase discount and charging credit among full-time (left) and part-time (right) ridehailing drivers.
Wevj 16 00368 g014
Table 1. Specifications of binomial logit models fitted to surveyed ridehailing drivers.
Model Set One (1)
(Baseline)
Model Set Two (2)
(Policy-Adjusted)
Model Set 2-1Model Set 2-2
SP Questions UtilizedQ1, Q2
(No Incentive)
Q3, Q4
(Incentives Available)
Key VariablesDemographicsAge, Gender, Education, Income, Housing Type, etc.
Contextual AttributesTime to Find the Closest Fast Charging Station
Level 2 Charger Availability
Closest Fast Charging Station from Home
EV CharacteristicsNew/Used
Purchasing Cost, Leasing Cost, Rental Cost
EV Range
0 to 80% Fast Charging Time
100-mile Fast Charging Cost
EV Incentives--Purchase Discount
Tax Credit
Purchase Discount
Tax Credit
Charging Credit
Charging Discount
EV Trip Bonus
Study SampleAll Drivers
Full-Time Drivers
Part-Time Drivers
Table 2. Converting a trifold survey structure into a binomial setup.
Original Choice Set ( C 0 ) Original Selection Set ( S 0 , n ) New Choice Set(s) ( C 1 , n ) New Selection Set ( S 1 , n )
Vehicle
1 chosen
V e h i c l e 1 ,   V e h i c l e 2 ,   N e i t h e r 1 , 0 , 0 V e h i c l e 1 ,   N e i t h e r 1 , 0
Vehicle
2 chosen
0 , 1 , 0 V e h i c l e 2 ,   N e i t h e r 1 , 0
Neither
chosen
0 , 0 , 1 V e h i c l e 1 ,   N e i t h e r
V e h i c l e 2 ,   N e i t h e r
0 , 1
0 , 1
Table 3. Summary of baseline models applied to all “pseudo” drivers (1079 “pseudo” drivers, with 863 in training set).
Full ModelReduced Model
Model TypeStandard LogitCross-Validated Lasso
( C   =   100 )
Standard LogitCross-Validated Lasso
( C = 1000 )
Number of Variables5135
Significant Variables19342234
McFadden’s R 2 0.30930.30790.30550.3054
Test Set Accuracy75.46%75.93%76.39%76.39%
Table 4. Key variables of pooled baseline models applied to all “pseudo” drivers (1079 “pseudo” drivers, with 863 in training set).
CategoryVariableCoefficient
Constant--−6.3469 ***
EV experience and charging accessHome charging availability1.5492 ***
EV history1.6593 ***
Income and TNC incomeTNC as main income source1.2404 ***
Income1.9092 ***
Log income−4.819 ***
Housing conditionsUsing EV and own home2.0217 ***
Housing value−3.9073 ***
Log housing value22.7081 ***
Own home−19.7481 ***
Attached single-family home−0.6513 ***
Detached single-family home−0.9107 ***
Apartment building0.2544 ***
Driving patternsWeekly TNC hours5.2324 ***
Age times weekly TNC hours−9.8606 ***
Highly urban operation−0.6405 ***
Vehicle mileage−0.8362 **
Vehicle mileage squared1.2227 ***
Driver tenure squared−1.4184 ***
Age effectsAge82.0725 ***
Age squared−143.9289 ***
Age cubed82.6014 ***
Vehicle costs, range, and fast charging timeCurrent vehicle price squared8.8913 ***
Current vehicle price cubed−10.43 ***
Purchase price−1.1133 ***
Leasing cost−1.6054 ***
Rental cost−1.5825 ***
EV range1.012 ***
Fast charging time 0 to 80%−0.967 ***
Fast charging distance from home0.1808 *
Driver socio-demographicsAsian0.9579 ***
Hispanic0.8169 ***
White0.5933 ***
Female0.3798 ***
Married0.2601 ***
*: p-value < 0.1; **: p-value < 0.05; ***: p-value < 0.01.
Table 5. Summary of baseline models applied to all full- and part-time drivers.
Full-Time Model
(546 “Pseudo” Drivers)
Part-Time Model
(533 “Pseudo” Drivers)
Model TypeCross-Validated Lasso
( C = 1000 )
Cross-Validated Lasso
( C = 1000 )
Number of Variables3535
Significant Variables2827
McFadden’s R 2 0.36960.3701
Test Set Accuracy78.81%79.59%
Table 6. Key variables of baseline models applied to all full- and part-time drivers.
CategoryVariableCoefficient
(Full-Time)
Coefficient
(Part-Time)
Wald Diff
Constant--3.6933−10.2686 ***9.72 ***
EV experience and charging accessHome charging availability1.49 ***1.99 ***8.5 ***
EV history1.43 ***2.82 ***55.15 ***
Income and TNC incomeTNC as main income source0.95 ***1.69 ***15.53 ***
Income10.14 ***−4.27 ***233.33 ***
Log income−27.57 ***7.73 ***150 ***
Housing conditionsUsing EV and own home2.45 ***2.23 ***0.4
Housing value−4.3576 **−2.10010.85
Log housing value3.05928.0854 ***3.13 *
Own home−0.84−25.76 **4.15 **
Attached single-family home−0.29−1.33 ***16.06 ***
Detached single-family home−1.07 ***−1.06 ***0
Apartment building0.3246 **0.02412.19
Driving intensityWeekly TNC hours4.02 **−1.135.97 **
Highly urban operation−0.2574 **−1.0998 ***26.14 ***
Age times weekly TNC hours−7.79 ***−0.963.65 *
Vehicle mileage−1.6438 ***−0.9140.89
Vehicle mileage squared2.0307 ***1.2326 **0.86
Driver tenure squared−0.3194−2.3404 ***27.47 ***
Age effectsAge68.39 ***90.22 ***1.26
Age squared−118.94 ***−172.39 ***2.72 *
Age cubed65.37 ***103.64 ***4.65 **
Vehicle costs and rangeCurrent vehicle price squared5.5621 ***10.1301 ***4.64 **
Current vehicle price cubed−8.0805 ***−10.3091 ***0.88
Purchase price−0.53−2.03 ***7.51 ***
Leasing cost−1.79 ***−1.97 ***0.12
Rental cost−1.4 ***−2.12 ***1.88
EV range1.57 ***0.78 **2.78 *
Fast charging time (0 to 80%)−1.10 ***−1.09 ***0.00
Fast charging distance from home0.10140.12760.02
Driver socio-demographicsAsian1.07 ***0.92 ***0.36
Hispanic0.44 ***1.71 ***29.58 ***
White0.75 ***0.46 ***2.21
Female0.90 ***−0.0720.72 ***
Married0.46 ***0.153.21 *
*: p-value < 0.1; **: p-value < 0.05; and ***: p-value < 0.01.
Table 7. Summary of policy-adjusted models with vehicle-related variables, applied to all, full-time, and part-time drivers.
VariableCoefficient
(All Drivers)
Coefficient
(Full-Time)
Coefficient
(Part-Time)
Model performance metricsModel typeCross-validated Lasso
( C = 100 )
Cross-validated Lasso
( C = 100 )
Cross-validated Lasso
( C = 10 )
Number of observations837/1047425/536412/511
Significant variables37 out of 6343 out of 6335 out of 63
McFadden’s R 2 0.32910.50730.4716
Test set accuracy73.33%75.68%71.72%
Purchase discountsPurchase discount3.2747−3.15630
Income-based instant rebate1.272711.7468 ***0.3998
Price-based instant rebate−0.11442.1946 ***−2.1353 ***
Purchase discount squared0.07792.53033.2921 *
Log purchase discount−7.5589 **0−6.6354
High purchase discount−0.9762 ***−0.5215 **−1.0006 ***
Tax creditsTax credit−2.5541−3.75010
Income-based tax credit−1.5854 *−5.0081 **−6.6339 ***
Price-based tax credit3.2568 ***3.7386 ***1.334
Tax credit squared2.5657 *3.7159 **4.6275 **
Log tax credit0.1722−0.33060.4794
High tax credit−0.9289 ***−0.1071−2.9294 ***
*: p-value < 0.1; **: p-value < 0.05; and ***: p-value < 0.01.
Table 8. Summary of policy-adjusted models with vehicle- and charging-related variables, applied to all, full-time, and part-time drivers.
VariableCoefficient
(All Drivers)
Coefficient
(Full-Time)
Coefficient
(Part-Time)
Model performance metricsModel typeCross-validated Lasso ( C = 100 ) Cross-validated Lasso ( C = 100 ) Cross-validated Lasso ( C = 100 )
Number of observations837/1047425/536412/511
Significant variables37 out of 6147 out of 6143 out of 61
McFadden’s R 2 0.32770.50560.4885
Test set accuracy73.33%77.48%70.71%
Purchase discountsPurchase discount3.2125 ***1.3423 *7.0379 ***
Income-based instant rebate1.5433 *8.3958 ***3.0699 ***
Price-based instant rebate0.40971.5546 **−0.7149
Log purchase discount−7.8016 ***−4.6556 **−20.6165 ***
High purchase discount−0.8937 ***−0.5094 **−1.1176 ***
Tax creditsIncome-based tax credit−0.8459−1.137−3.4044 ***
Charging incentivesCharging credit−1.14 ***0.6258−3.0813 ***
Fuel cost offset0.2425−0.32941.8793 ***
Price-based charging credit1.3121 ***2.3798 ***0.6442
Log charging credit2.8424 ***−2.1537 *9.5909 ***
*: p-value < 0.1; **: p-value < 0.05; and ***: p-value < 0.01.
Table 9. Comparison of Model Set 2-1 and Model Set 2-2.
Model SetMcFadden’s R 2 Test AccuracyMcFadden’s R 2 ImprovementTest Accuracy Improvement
All DriversSet 2-10.329173.33%−0.00140
Set 2-20.327773.33%
Full-TimeSet 2-10.507375.68%−0.00160.018
Set 2-20.505777.48%
Part-TimeSet 2-10.471670.71%0.01690.0303
Set 2-20.488573.74%
Disclaimer/Publisher’s Note: The statements, opinions and data contained in all publications are solely those of the individual author(s) and contributor(s) and not of MDPI and/or the editor(s). MDPI and/or the editor(s) disclaim responsibility for any injury to people or property resulting from any ideas, methods, instructions or products referred to in the content.