Article

Recommendations for Preventing Free-Stroke Failures in Electric Vehicle Suspension Dampers Based on Experimental and Numerical Approaches

1
Department of Mechanical Engineering, Changchun Technical University of Automobile, Changchun 130011, China
2
Department of Automotive Engineering, Changchun Technical University of Automobile, Changchun 130011, China
3
Department of Control Science and Engineering, Harbin Institute of Technology, Harbin 150080, China
*
Author to whom correspondence should be addressed.
World Electr. Veh. J. 2025, 16(7), 392; https://doi.org/10.3390/wevj16070392
Submission received: 16 May 2025 / Revised: 9 July 2025 / Accepted: 10 July 2025 / Published: 13 July 2025
(This article belongs to the Special Issue Intelligent Electric Vehicle Control, Testing and Evaluation)

Abstract

Free stroke, which means the intermittent no-load operation state of dampers, can cause an abnormal noise and unavoidably lead to the deterioration of vehicle NVH performance. In electric vehicles, the noise is particularly intolerable because there are no engine sounds to mask it. Focusing on this, the mechanism of the free-stroke phenomenon is analyzed. A method, which involves parametric models and numerical simulation, is proposed to prevent free-stroke phenomena during the damper design phase. This paper proposes a free-stroke mechanism based on a fluid–structure interaction (FSI) numerical method, combined with experiments, which intends to provide a design reference with guaranteed performance for dampers. Initially, according to parametric cavitation models and by applying numerical methods, simulations for the proposed FSI model are calculated. By analyzing the simulation results, strain variation characteristics near the bottom of the damper valves are revealed, which establish the relationships between strain change, cavitation and the free-stroke phenomena. Meanwhile, the specific position and distribution of free-stroke failure are clearly located by running diverse loading speeds. Finally, all the theoretical analysis results are verified using damper noise tests and indicator bench tests.

1. Introduction

Ride comfort and road handling have usually been considered important factors for suspension performance evaluation [1,2,3]. Increasing concerns about the compromise between these two factors call for continuous research on suspension components [4]. Hydraulic dampers are indispensable suspension parts [5,6,7], which transform kinetic energy into thermal energy and thereby minimize structural shock propagation caused by road excitations [8,9]. However, when high-frequency or high-speed vibration acts on suspensions, air bubbles may be formed in the damper fluid, which is known as the cavitation phenomenon [10,11,12]. This phenomenon results in the ineffectiveness of dampers in a certain stroke section, which is habitually called free damper stroke in applications. Free stroke will inevitably increase vehicle vibrations, and/or an abnormal bird-like noise will appear which can be heard by passengers. Moreover, free stroke may reduce the life cycle of damper products [13].
Because eliminating free-stroke phenomena is of great significance for improving product competitiveness, many related studies have been carried out. Chen et al. [14] have analyzed the dynamic characteristics of the damper throttle valves at the initial stage of the compression stroke, which has provided a reference and a foundation for the study of free strokes caused by structural properties. However, this perspective does not take into account the effect of cavitation on the dynamic characteristics of the damper. Therefore, Luo et al. [15] analyzed the generating process of damper cavitation. Their results indicate that damper cavitation can be reduced and is related to the diameter of the throttle hole and the viscosity of oil flow. Further considering the connection between throttle holes and gas pressure, in their study, An et al. [16] revealed that throttle holes and gas pressure are responsible for cavitation phenomena and abnormal piston rod vibrations. To gain a better understanding of the cavitation effect, Viktor Skrickij et al. [17] analyzed three physical models of shim stack valves. They found that the damping force during cavitation mainly depends on the initial pressure and the absorber’s inner diameter.
The above studies show that the vibration or shock of the valve system in dampers is the root cause of abnormal noise. The structure and operating characteristics of dampers determine the occurrence of cyclic switching between compression and rebound. During the cyclic process, due to the dynamic and static conversion of the piston, the fluctuation of the piston speed, the damping effect of the valve hole, the inertia of the oil, gasification and other factors, air bubbles will inevitably be generated in the oil. Therefore, free stroke is a typical phenomenon of damper dynamic behavior, which will cause prominent and unavoidable structural noise.
Focusing on the above problems, this paper is focused on revealing the specific mechanism of the damper free-stroke phenomenon, locating the specific location of air bubbles, and clarifying the dynamic distribution of the internal flow field. With this goal in mind, ADINA software was firstly used to establish high-precision 3D solid and 3D FEM models for dampers, and then the corresponding fluid–solid coupling dynamic simulation was carried out. According to the simulation data, this paper further analyzes the free-stroke phenomenon at different damper operation speeds, and the relationship between the stress and strain of the superimposed throttle valve plate and air bubbles. Theoretical and simulation analysis results are finally verified experimentally using an indicator machine test and a noise test.
The causes of free-stroke phenomenon and the cavitation parametric model are outlined in Section 2. Section 3 further describes the finite element numerical simulation method used and the corresponding simulation results. The experimental verification procedure and results are provided in Section 4, and conclusions are drawn in Section 5.

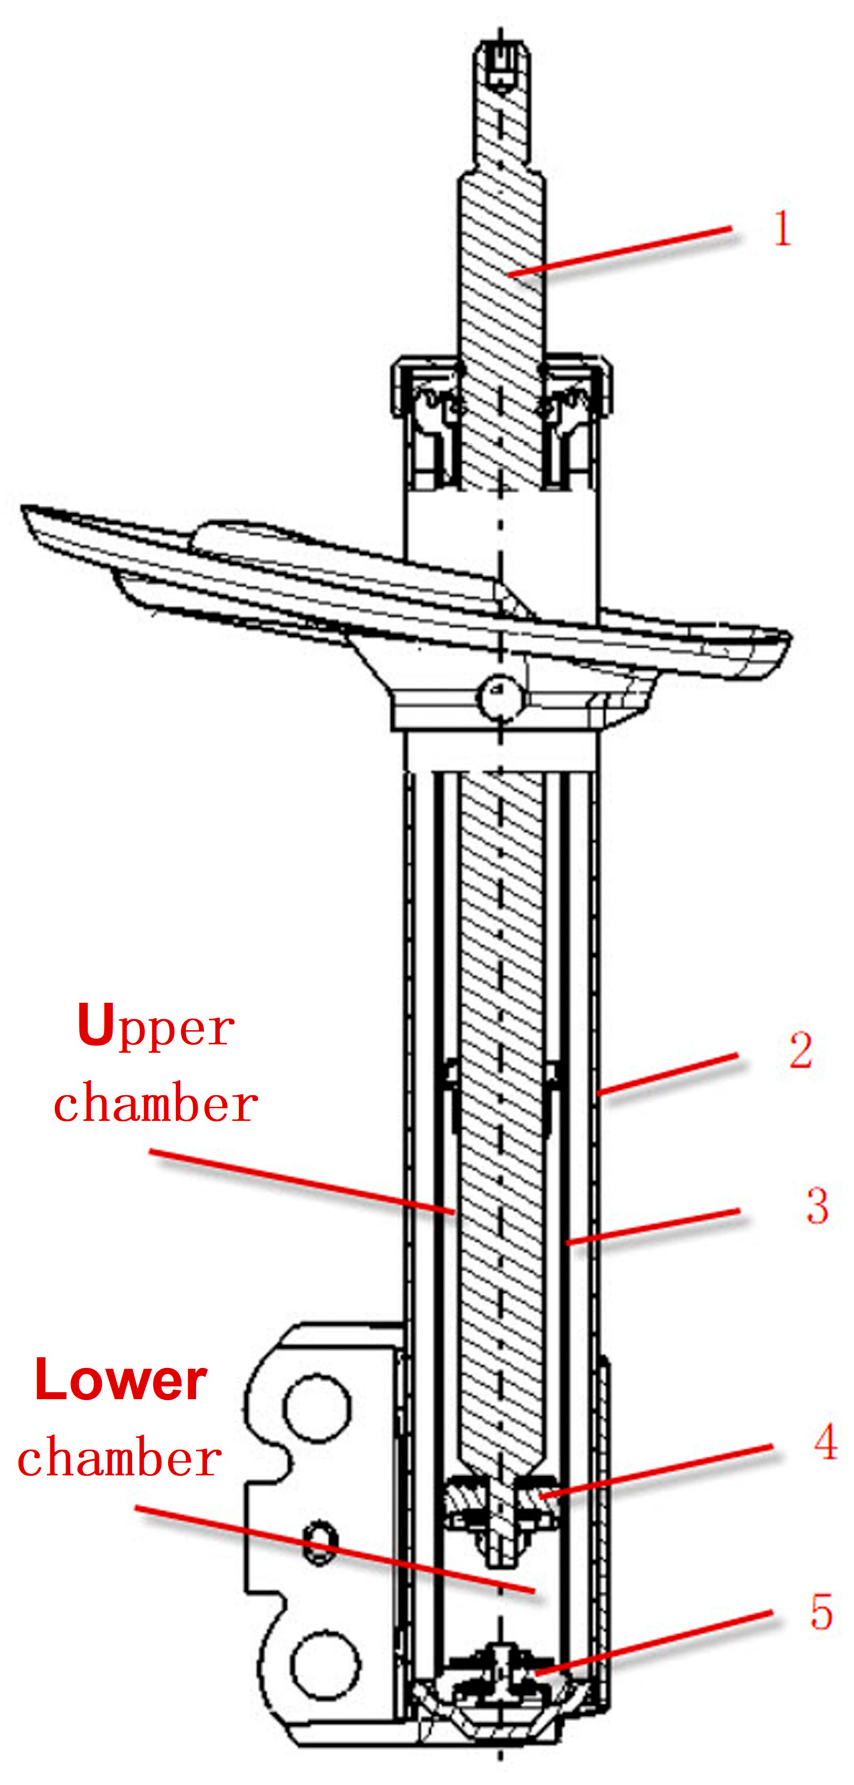
2. Cause Analysis of Oil-Hydraulic Damper Free Stroke

2.1. Damper Oil Cavitation Mechanism

The damper cylinder contains a mixture of oil and gas. As the pressure fields within the cylinder vary, the amount of air dissolved in the oil can either increase or decrease accordingly [18,19].
Figure 1 presents a schematic illustration of the damper, highlighting its intricate internal structure [20,21]. The main reason for the cavitation phenomenon is as follows. The damper rebound valves divide the damper into the top and bottom chambers. When the piston rod begins its upward and downward movement, the fluid in the top and bottom chambers is compressed. With increasing oil pressure, more gas dissolves into the fluid within the chamber. When the oil pressure increases to a level that causes the piston stack throttle valves to open, the pressure in the compressed chamber drops rapidly. When it falls below the oil’s saturation vapor pressure, the previously dissolved gas is released from the fluid, resulting in the formation of numerous bubbles within the damper. This phenomenon is called hydraulic damper cavitation [22].

2.2. Damper Cavitation Parameter Model [23]

The cavitation coefficient is commonly used to quantify the degree of cavitation at a constant temperature σ , using Equation (1):
σ = P 2 P v ρ v 2 / 2
where P2—damper bottom chamber pressure; Pv—damper fluid cavitation critical pressure; ρ—density of the hydraulic oil in the damper; v—average velocity of the hydraulic fluid.
When the hydraulic damper undergoes reciprocating motion, the fluid flows through the rebound valves’ assembly and transfers between the top and bottom chambers, thereby generating a pressure difference, ΔP, within the damper. ΔP is defined as follows:
Δ P = P 1 P 2 = ρ v 2 / 2
where P1—pressure in the upper chamber of the damper.
Pv, the critical cavitation pressure of the damper fluid, is negligible in comparison to P1 and P2, i.e., Pv = 0. This can be simplified from Equations (1) and (2) as:
σ = P 2 P 1 P 2
When σ is less than 0.4, the cavitation phenomenon occurs [24]. σ = 0.4 is the critical point at which the oil damper begins to exhibit cavitation. As a result, Equation (3) is simplified as:
ξ = P 1 P 2 = 3.5
where ξ is the oil-hydraulic damper cavitation critical pressure ratio.

3. FSI-Based Finite Element Analysis Approach

To visualize the cavitation phenomenon in oil-hydraulic dampers, this study establishes a finite element model capturing the fluid–structure interaction behavior associated with cavitation. The experimentally required temperature for the damper test by the host manufacturer is typically 22 °C, and thus, in this study, the saturated vapor pressure value of the damper oil corresponding to this temperature value was selected.

3.1. FSI Finite Element Mathematical Model [25]

FSI finite element analysis was employed to address the interaction between fluid and solid motion. Its fundamental principle is to ensure that both the dynamic and kinematic boundary conditions are simultaneously satisfied at the fluid–solid interface for both domains.
d f = d s
The kinetic conditions are
n × τ f = n × τ s
where df and ds represent the displacements at the fluid and solid boundaries, respectively; τf and τS denote the fluid and solid stress tensors; and n is the outward unit normal vector. Based on the kinematic interface conditions, the fluid velocity continuity at the coupling boundary can be expressed as
n × v f = n × v s

3.2. FSI FM Analysis Based on ADINA

In applying FSI finite element theory to analyze the fluid–structure interaction within an oil-hydraulic damper, two key aspects need be considered:
(1)
Ensuring the accurate transmission of interaction forces across the fluid–solid coupling interface.
To address the fluid–solid interaction problem, independent solid and fluid models were constructed in ADINA, with appropriate boundary conditions specified on their respective coupling interfaces. It is not required that the fluid and solid meshes be identical [26]; rather, compatibility can be maintained within an acceptable tolerance range [27]. Consequently, the displacement of fluid nodes on the fluid–solid interface is interpolated from the adjacent solid node displacements, while the forces on solid nodes are computed by integrating the fluid stresses over the surrounding interface region, as expressed by
F ( t ) = h d τ f d S
where hd is the solid virtual displacement
(2)
Enabling efficient solutions in FSI systems
Currently, the Arbitrary Lagrangian–Eulerian (ALE) method is employed to address the fluid mesh deformation resulting from structural displacement.
ADINA provides both iterative and direct solvers, which are crucial for ensuring consistency between the integration points of the fluid and solid domains during dynamic analysis. Both methods require iterative solutions to solve the fluid and solid equations separately. In the direct solution method, the fluid and solid models are placed in the same matrix, and the finite element equations are expressed as follows:
A f f A f s A s f A s s Δ X f k Δ X s k = B f B s
X k + 1 = X k + Δ X k
A f f = F f k X f A f s = λ d F f k X s
A s f = λ τ F f k X f A s s = F s k X s
where λd (0 < λd ≤ 1) denotes the displacement relaxation factor, and λτ (0 < λτ ≤ 1) represents the stress relaxation factor. The direct solution method is highly accurate for solving non-contact transient models that are not computationally large. In this paper, the parameters were set up as λd = 0.6, λτ = 0.4.

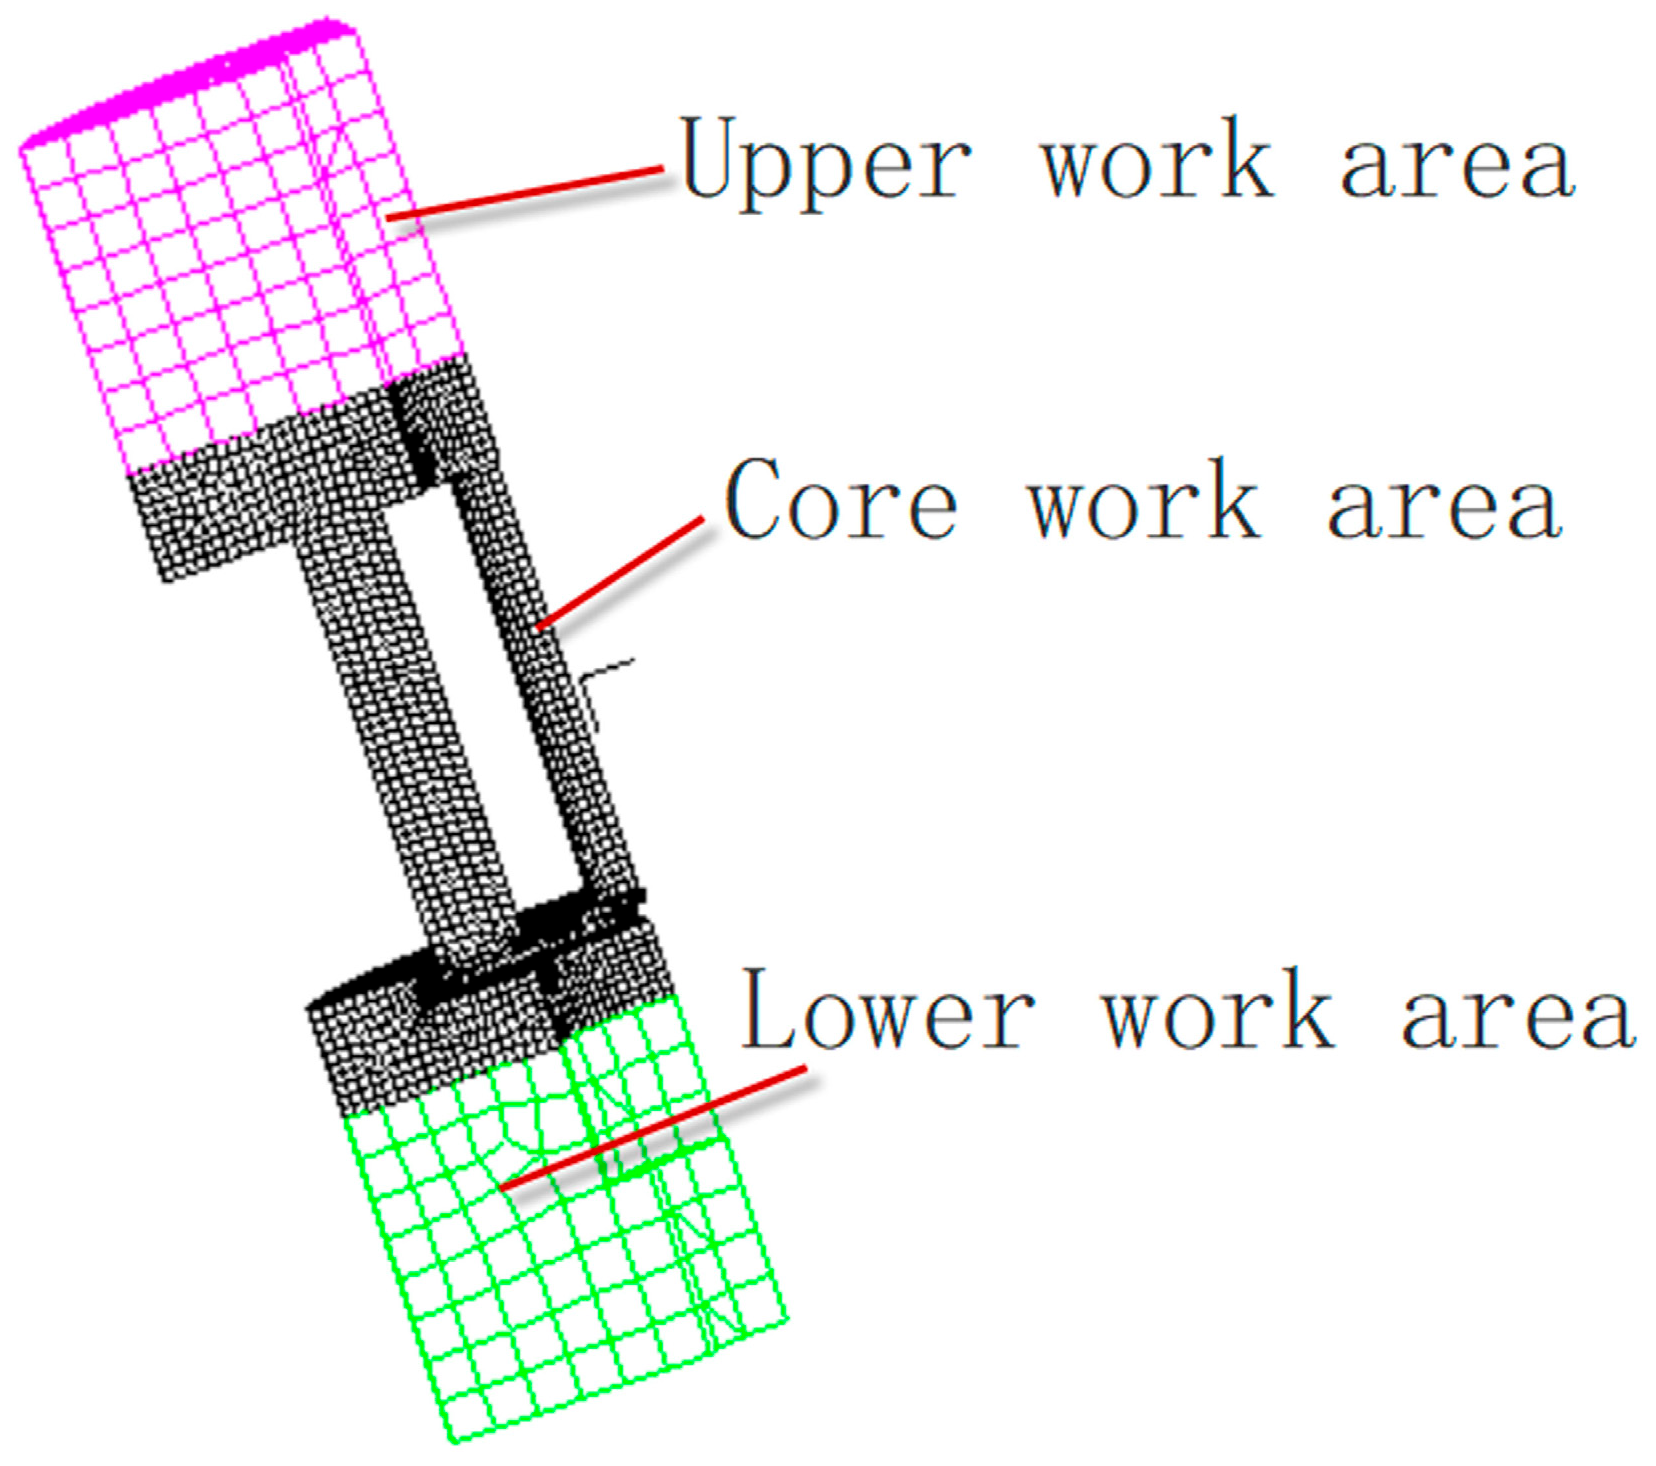
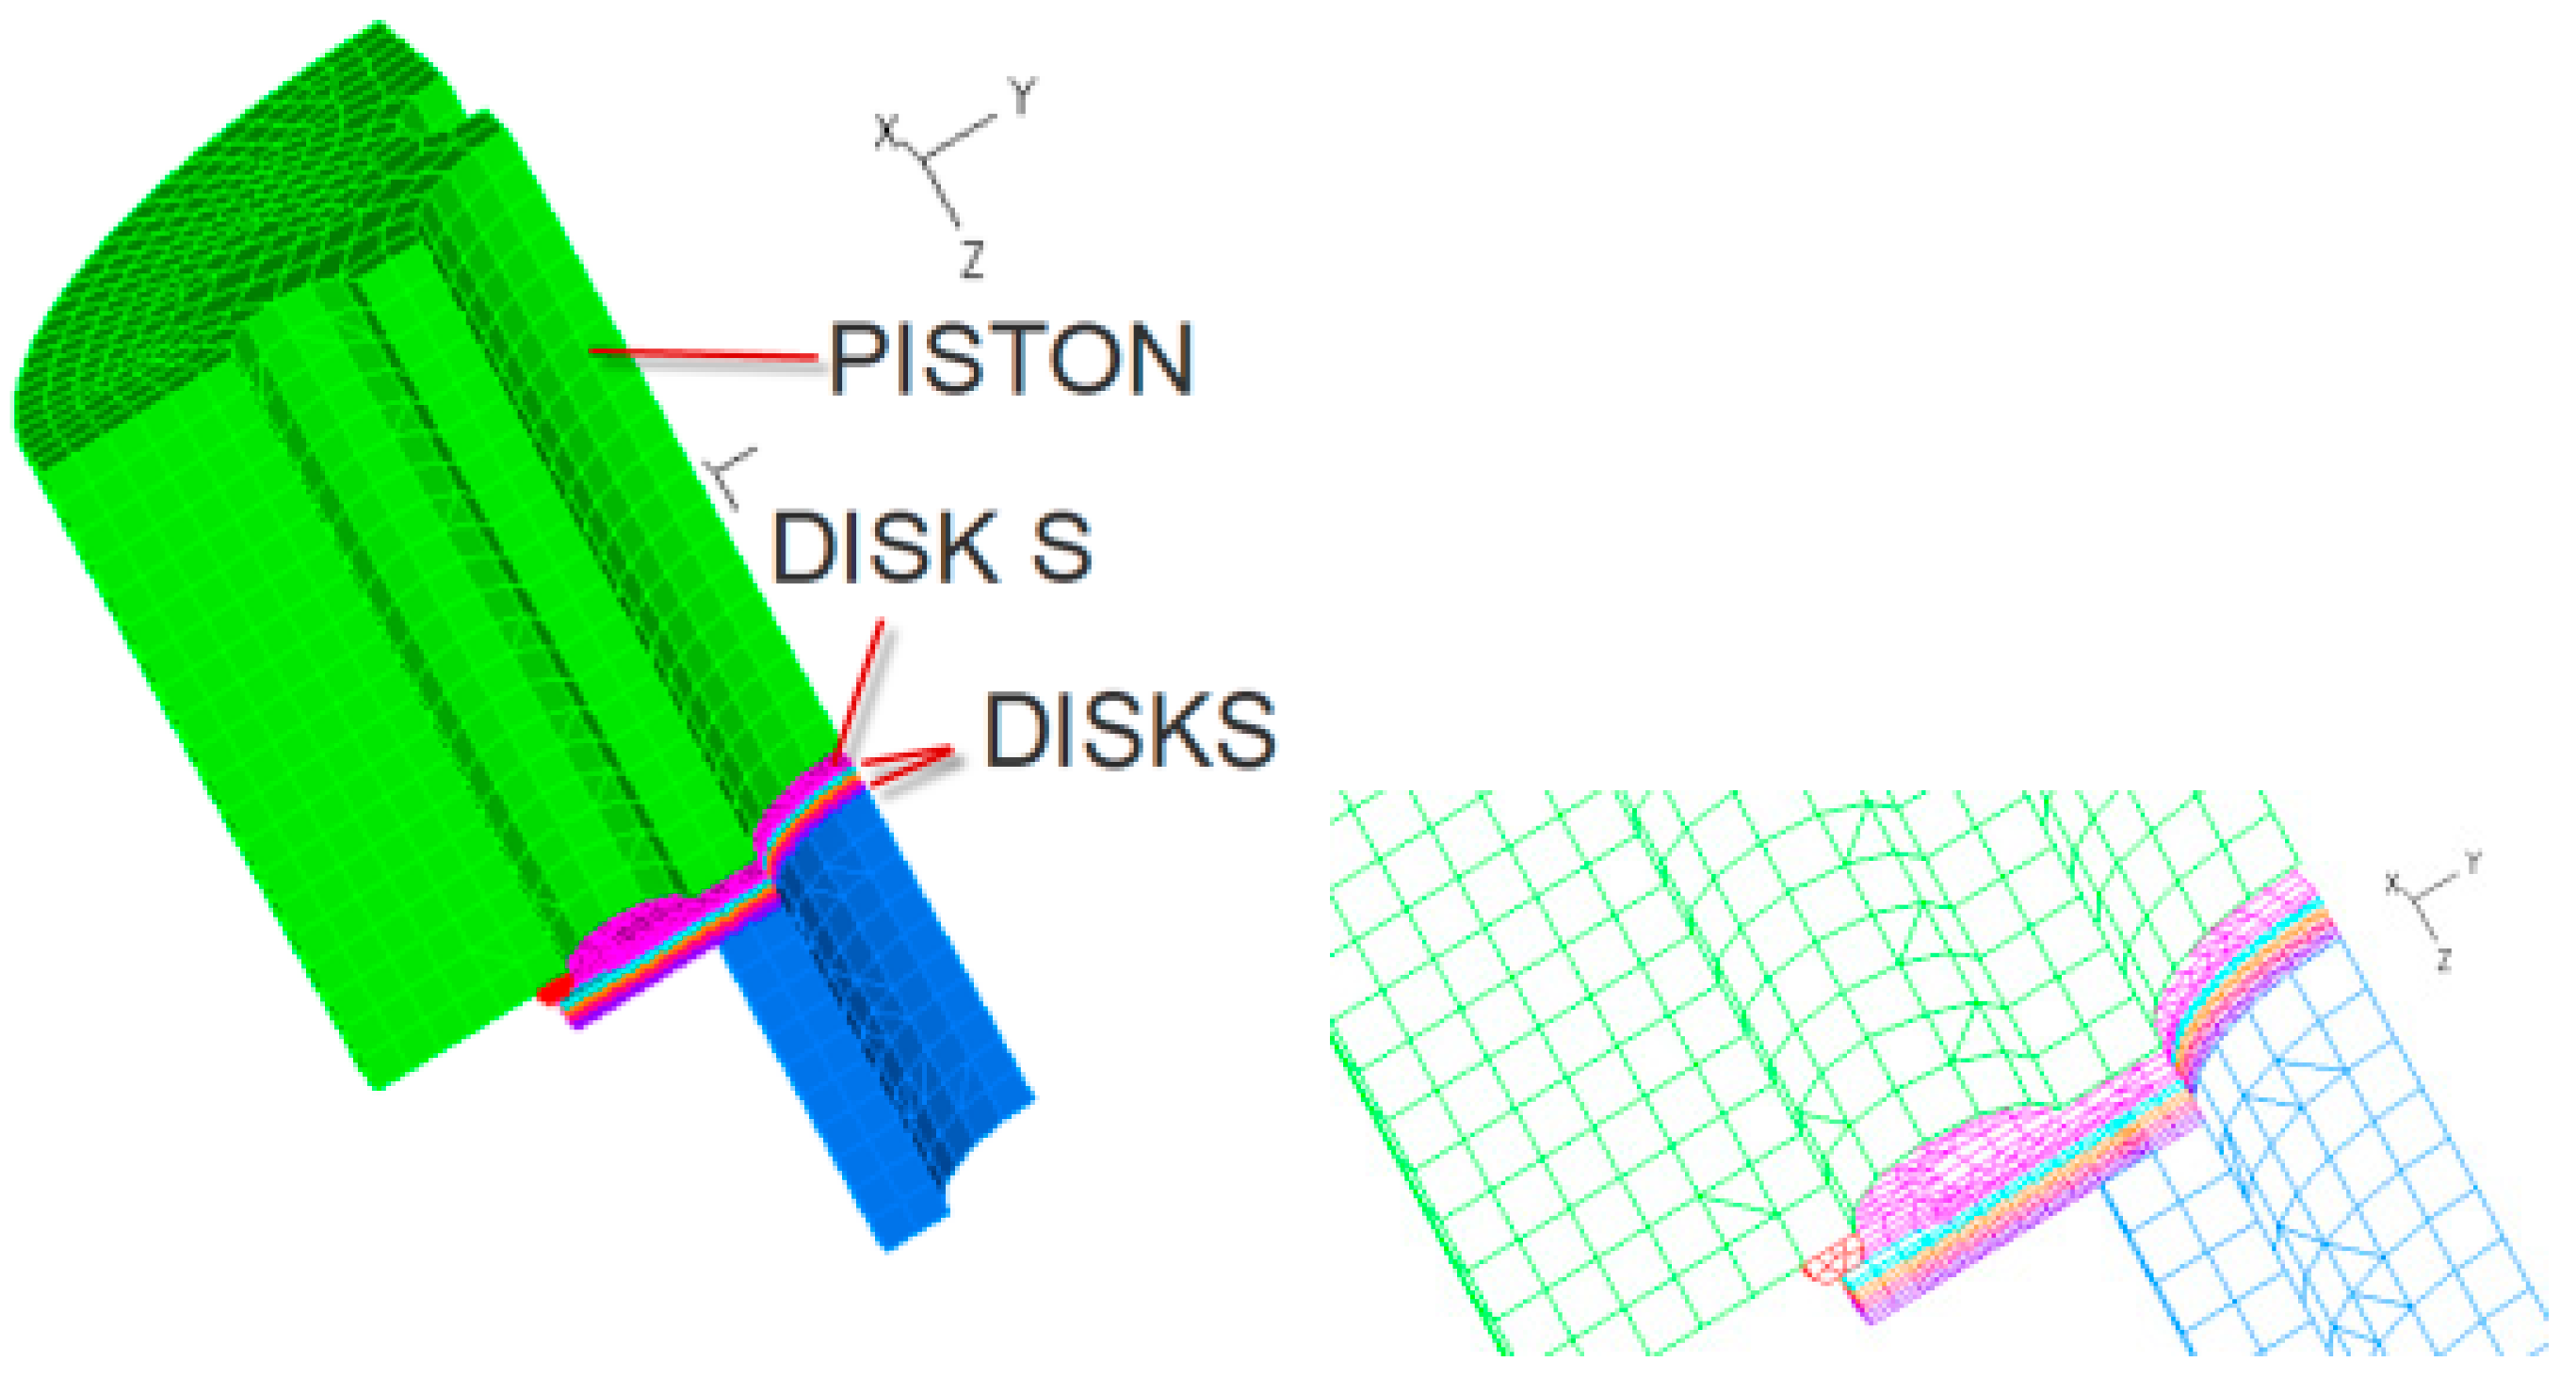
3.3. Establishment of FEM for Oil Damper Stacks with Throttle Systems

To construct a stacked throttle valve system for the oil damper, the entire valve structure must be simplified to ensure the accuracy of the finite element model while remaining within the computational limits.
(1)
Given the symmetrical nature of the damper valve system, a 1/4 finite element model is sufficient to meet the analysis requirements.
(2)
Converting the sum of the disk-sheet areas to the contact areas does not affect the accuracy of the calculation.
(3)
The piston chamfer is removed from the valve system to avoid mesh distortion.
The objective of the simulation was to capture and analyze the cavitation phenomenon occurring within the fluid domain of the oil damper, as well as the correlation between strain and cavitation at the valve seat of the valves system. Therefore, a high-fidelity FSI finite element model of the damper valve system was developed. Figure 2 illustrates the finite element mesh of the fluid domain within the damper valve system and Figure 3 displays the solid finite element mesh model of the damper valves system. The top and bottom chambers of the fluid model are represented by 8-node hexahedron cells, while the core region, which is the primary location of cavitation phenomena, is represented by 4-node tetrahedral cells. The solid structure is represented by 8-node hexahedron cells, and all variables are defined at the corner nodes of each element. This configuration satisfies the inf-sup stability condition and optimal convergence requirements, providing second-order accuracy for variable interpolation [28], thereby improving the accuracy of the calculation results. To make the FSI solver more efficient, a slightly compressible fluid model was used [29]. Considering the computer’s calculation capacity and solution time, only the mesh of the stacked valves and fluid coupling parts was subdivided. This ensures accurate fluid–solid coupling, with the relative displacement on the coupling interface maintained within an acceptable tolerance. The solid domain was discretized using 8-node hexahedral elements, comprising 11,277 solid elements and 29,733 fluid elements, thereby ensuring mesh density compatibility at the fluid–solid interface. To balance computational efficiency and accuracy in the fluid–structure interaction (FSI) simulation, a mesh independence verification was performed on the established damper solid and fluid models. Three sets of mesh sizes were selected: for the solid domain, the non-core and core region mesh sizes were set to (4 mm, 2 mm), (2 mm, 1 mm), and (1 mm, 0.5 mm); for the fluid domain, the corresponding sizes were (2 mm, 0.5 mm), (1 mm, 0.5 mm), and (0.5 mm, 0.2 mm), respectively. Simulation results demonstrated that reducing the mesh size led to a decrease in fluctuations in the simulation results. Based on comprehensive considerations, the optimal mesh sizes selected were (2 mm, 1 mm) for the solid domain and (1 mm, 0.5 mm) for the fluid domain.
The velocity was applied at the fluid input of the rebound valves, with a magnitude equal to the velocity of the piston movement but in the opposite direction, and a sine wave was loaded. No boundary condition was specified at the fluid outlet, with the default outlet pressure set to zero. The fluid–solid coupling interface was defined with symmetric boundary conditions, while the remaining fluid boundaries were treated as walls. Because the sliding interface in the FCBI (Flow-Condition-Based Interpolation) element formulation requires the use of a sparse solver, the flow-induced deformation of multiple throttle valves constitutes a transient nonlinear motion. To ensure directional consistency of the fluid flow, the leader–follower command in ADINA was employed. In the post-processing stage, the entire fluid boundary surface was integrated to obtain the relevant physical quantities.
In the solid model, a stack of five throttle valves (each with a thickness of 0.203 mm) was constructed to form the complete valve assembly. Contact interactions were defined between adjacent throttle valve layers. The boundary of the entire stacked valve assembly was specified as being in contact with the piston. The solid analysis employed the implicit dynamic method to capture the structural response under transient conditions.

3.4. Numerical Results Analysis

3.4.1. Analysis of Fluid Simulation Results

The cavitation phenomenon was analyzed under three representative velocities (0.3 m/s, 0.6 m/s, and 1.0 m/s) selected in accordance with Toyota’s standard specifications, maintaining a constant displacement amplitude of ±30 mm. These conditions facilitate clear observation and detailed characterization of the cavitation behavior in the damper valve system. The simulated cavitation at 0.3 m/s can be seen in Figure 4, which shows that when the valves are just open, the pressure suddenly drops, and the cavitation phenomenon occurs at the position where the valves are open. At this time, the pressure drop is not obvious, and there is no obvious cavitation phenomenon. The maximum pressure value at the throttle valve inlet occurs at node 437, and the input and output pressure ratio is about 621/270 = 2.3, which is less than the cavitation coefficient 3.5 in Section 2.2, indicating that the oil damper is working in a normal state.
As shown in Figure 5, the valves have opened at this stage. With the increasing pressure drop, cavitation becomes more pronounced in the lower chamber of the valve system. The input and output pressure ratio of the throttle valves is approximately equal to 3.5. At this moment, the oil damper is not working normally, but it is not obvious.
Figure 6 shows a simulation of a cavitation diagram when v = 1 m/s. At this stage, the stacked throttle valves are fully open and the pressure drop is the greatest, which means the cavitation phenomenon occurs in the entire lower chamber. This demonstrates that the oil damper cavitation phenomenon is the most obvious, and the input and output pressure ratio of the throttle valves is much greater than 3.5. During this work stroke, the oil damper fails.
As can be seen in Figure 4, Figure 5 and Figure 6, the cavitation phenomenon is initially distributed around the stacked throttle valves and gradually spreads to the lower chamber. With the oil damper piston increasing its speed, the damper cavitation phenomenon becomes more obvious.

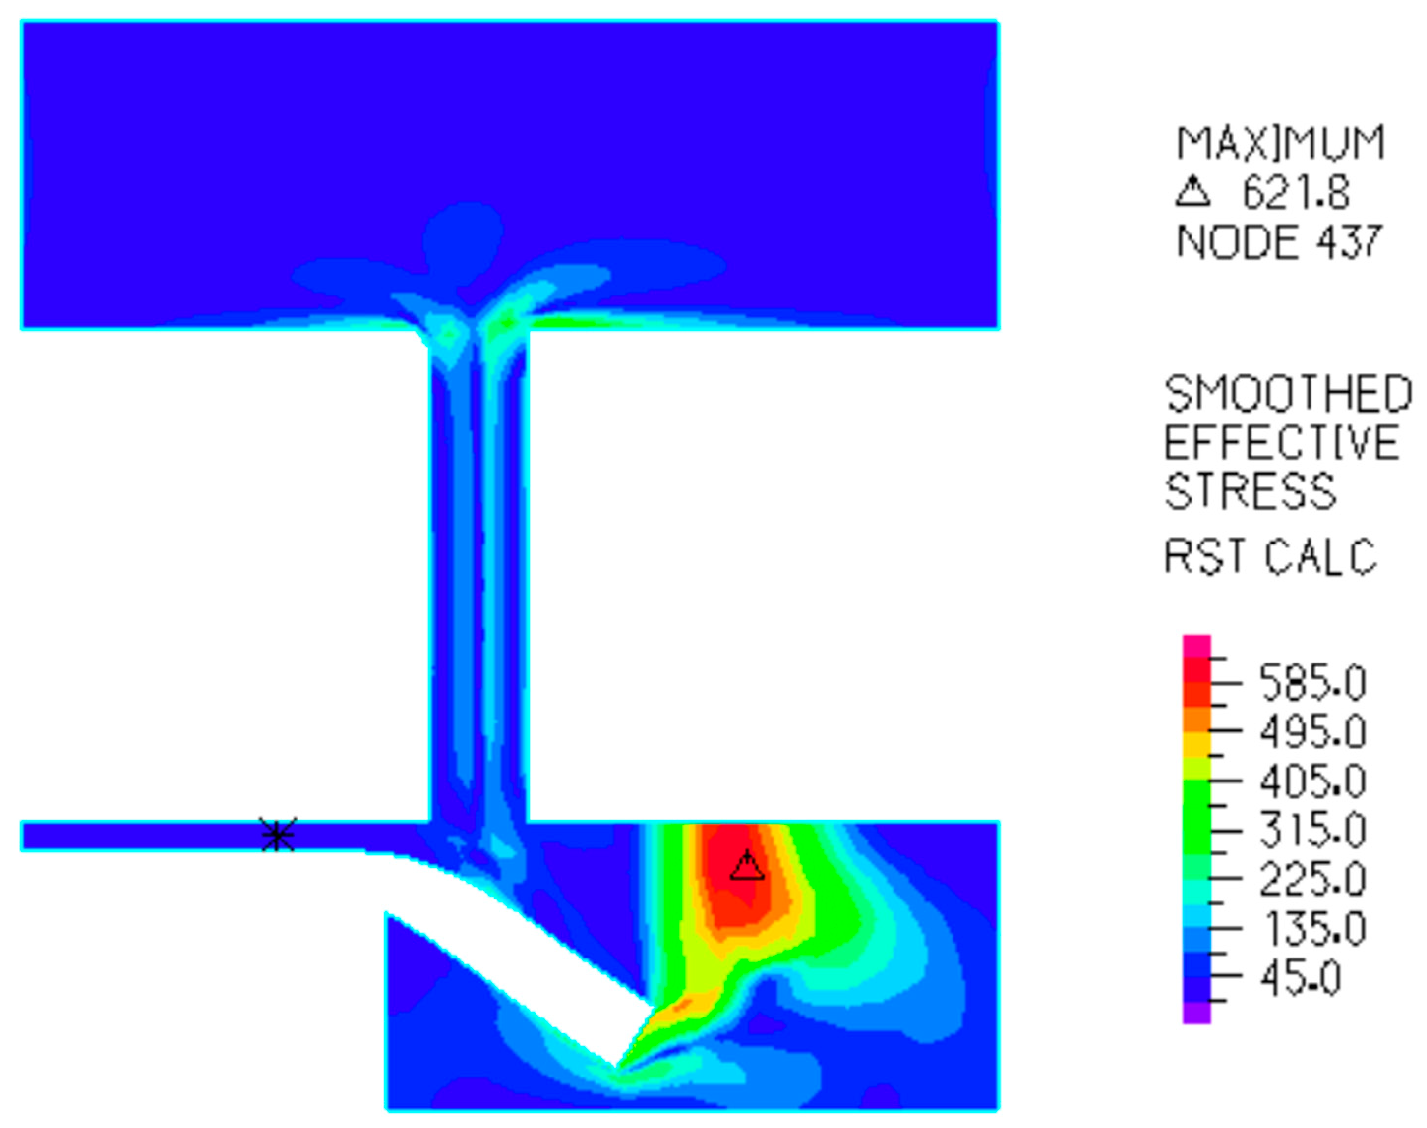
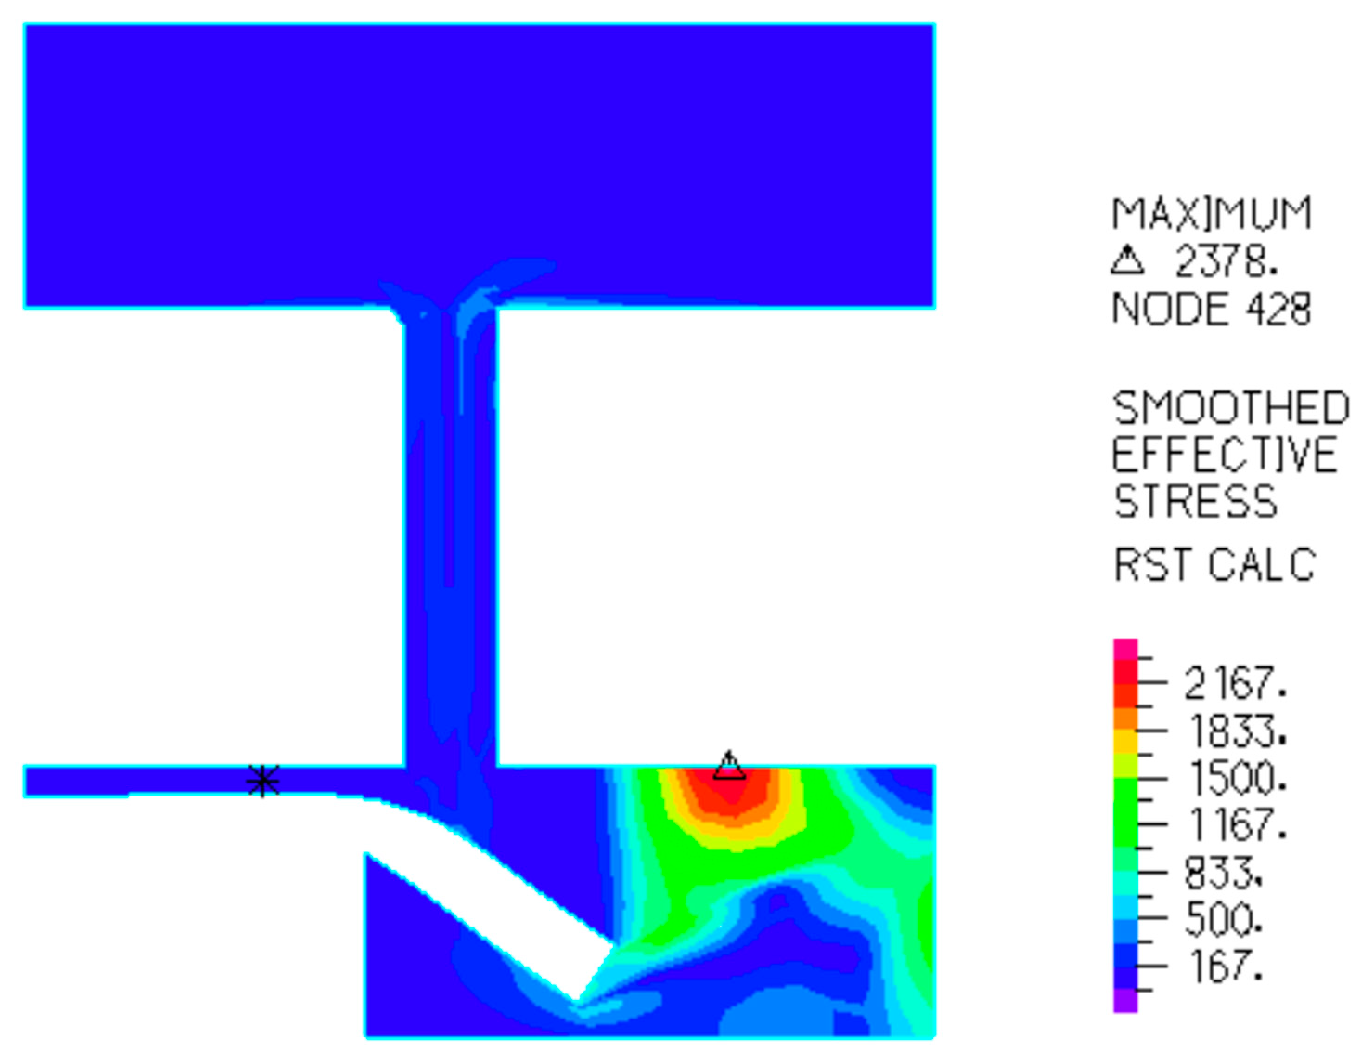
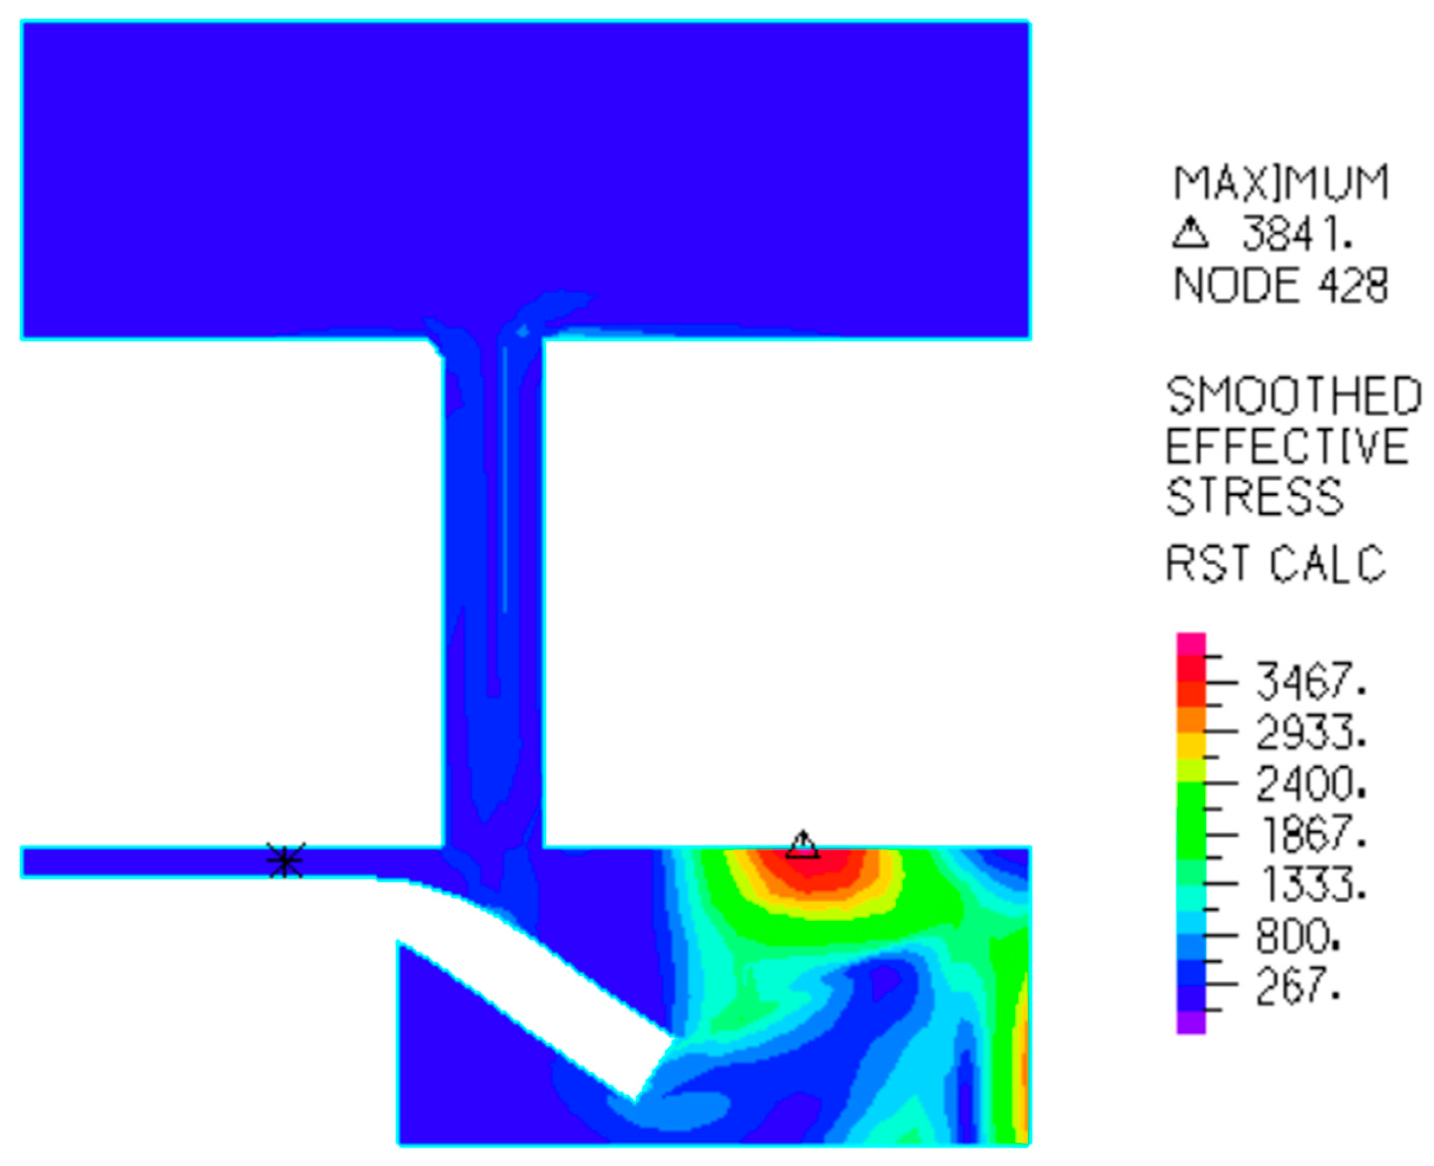
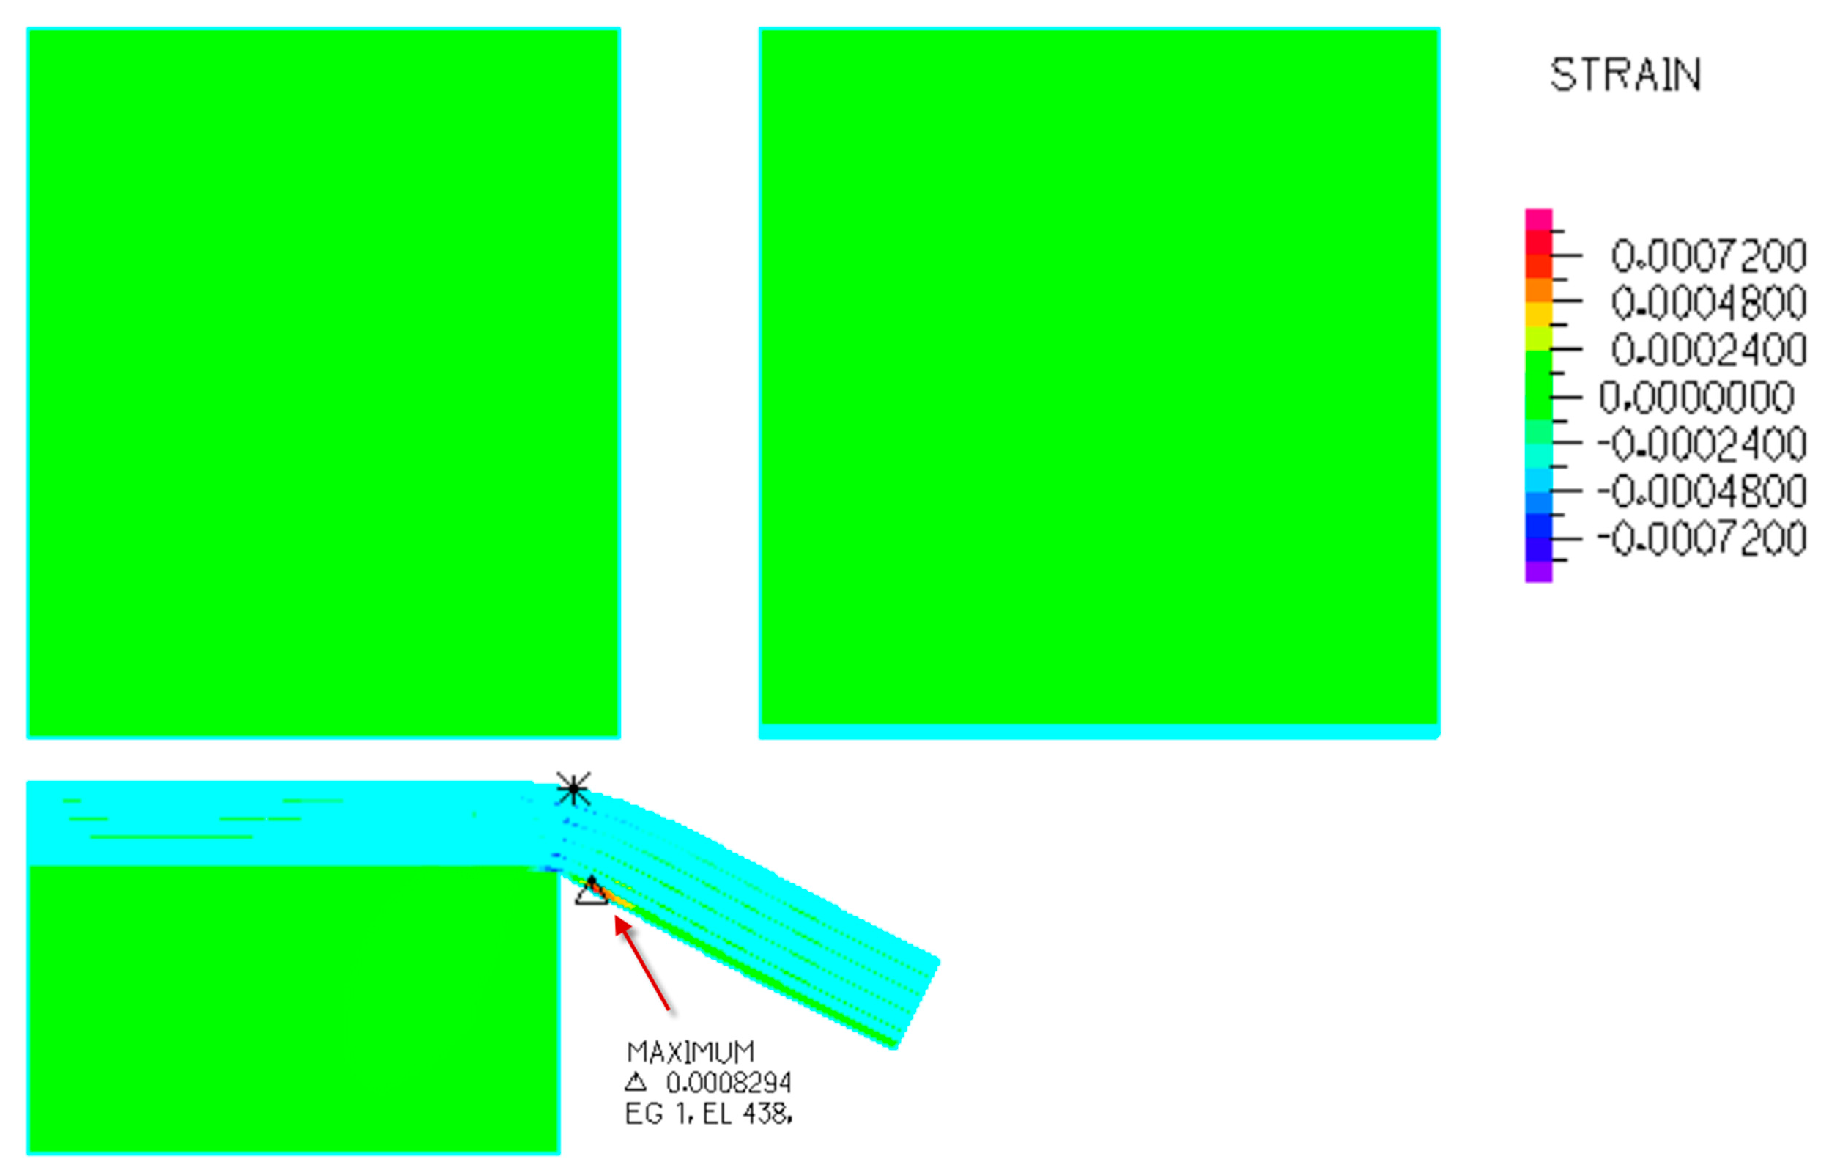
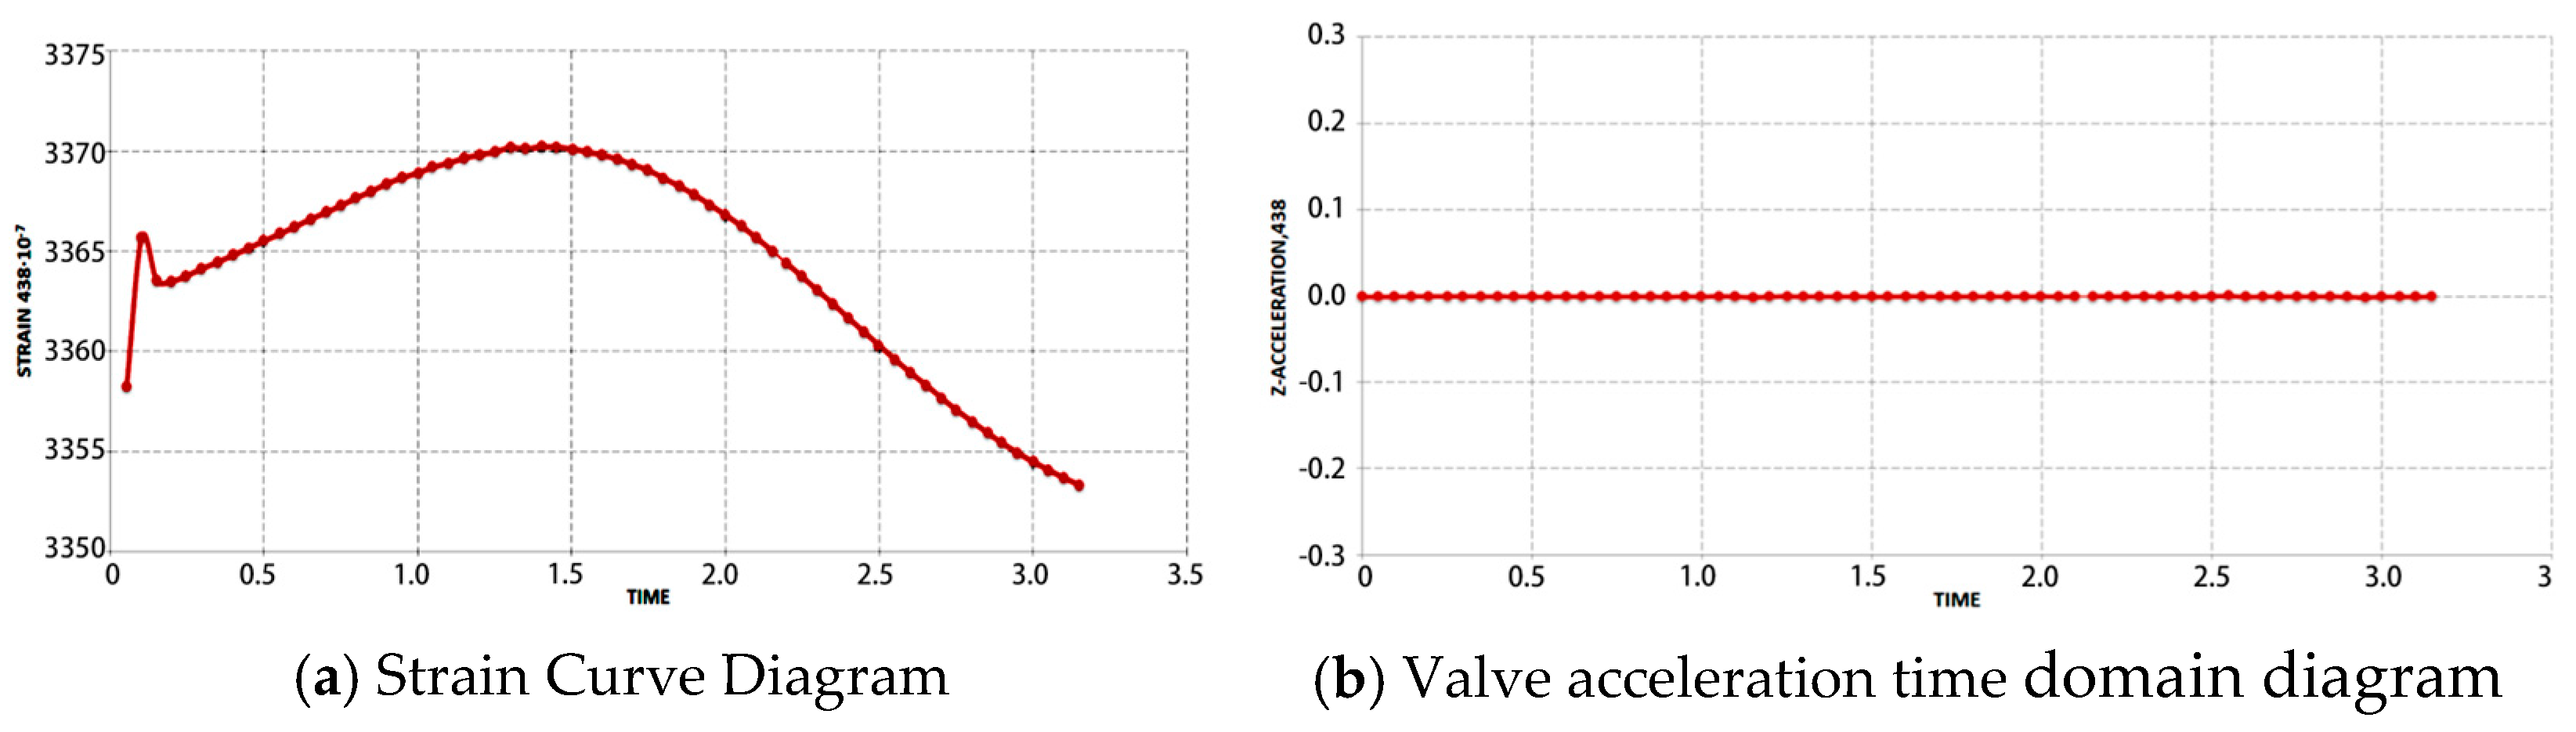
3.4.2. Analysis of Solid Simulation Results

The oil leakage occurs due to the deformation of the valves. During cavitation, the pressure exerted by the oil on the valves rapidly decreases, causing the valves to experience sudden acceleration. This phenomenon results in a free-stroke condition within the damper. To better illustrate the deformation, an enlarged view of a single-valve disc is provided in Figure 7. Figure 8 presents a strain cloud diagram of the damper valves, clearly indicating that the maximum strain is located near the valve seat, specifically at element 438. Subsequent analysis will focus on examining element 438 in greater detail.
Figure 9, Figure 10 and Figure 11 show the strain and acceleration time domain curves of element 438 at the velocities of 0.3 m/s, 0.6 m/s and 1.0 m/s. In Figure 9, there is no sharp peak in the strain variation spikes, and the acceleration value is zero for the entire time period, indicating that there is no free-stroke phenomenon, which is consistent with the cavitation phenomenon shown in Figure 4 in Section 3.4.1. In Figure 10, the strain curve exhibits a sharp peak during the t = 1.2–1.8 s phase, and the strain value is 3.65 × 10⁻³. At the same moment, the acceleration curve also has a sharp peak, indicating that the valves suddenly accelerate at this time, and the free-stroke phenomenon occurs, which is consistent with the cavitation phenomenon shown in Figure 5 in Section 3.4.1. In Figure 11, the strain curve exhibits a sharp peak during the t = 0.5–2.5 s stage. At the same time, a peak appears in the acceleration curve, and the valves suddenly accelerate at this moment, which means the cavitation phenomenon appears. The strain value is 7 × 10⁻³. The period during which the sharp strain peak appears is longer, the strain value is higher than that observed at 0.6 m/s, and the cavitation phenomenon is more pronounced, which is consistent with the cavitation phenomenon shown in Figure 6 in Section 3.4.1.

4. Experimental Verification

To validate the accuracy of the FSI simulation results for the damper valve system, two independent experimental tests were conducted. First, a noise experiment was conducted for the damper, followed by an indicator bench test. By conducting both experiments, the reliability of the validation was increased, fully demonstrating the correctness of the FSI simulation results.

4.1. The Purpose and Requirements of Damper Noise Test

As shown in Figure 12, the SIEMENS LMS SCADAS MOBLILE portable dynamic signal analyzer acquires the damper reverberation acceleration signal. The parameters were set as follows:
Sampling rate: f = 2048
Frequency resolution: δf = 5
Hanning Window
No weighting rights
Overlap rate: 66.6%

4.2. Analysis of Experimental Results

Figure 13 presents the acceleration signal obtained from a damper exhibiting abnormal noise, measured on the damper noise test bench. At 1 m/s, the simulation results shown in Figure 11b indicate an acceleration of approximately −0.3 m/s2 during the rebound stroke, closely matching the experimentally measured acceleration value of around −0.3 m/s2 shown in Figure 13. The acceleration profiles derived from the fluid–structure interaction (FSI) simulation align well with the corresponding experimental results for the damper valve system experiencing abnormal noise. It is important to highlight that the experimental data incorporate influences from factors such as free-stroke impacts, friction, and adhesion, whereas the numerical simulation exclusively considers fluid–structure interactions. Consequently, these additional real-world factors account for observed discrepancies in the amplitude of acceleration between the simulated and experimental results.
Further power spectrum analysis was conducted on the collected data. Figure 14, Figure 15 and Figure 16 show the self-power spectrum density curves of axial acceleration at velocities of 0.3 m/s, 0.6 m/s, and 1.0 m/s. It can be observed that the free-stroke of the damper has a significant impact on its self-spectrum amplitude and main frequency band. Comparing Figure 14 and Figure 15, it can be seen that the self-spectral density of 0.6 m/s reaches a maximum value of 255 g at about 250 Hz, while 0.3 m/s reaches a maximum value of 2.7 g at about 50 Hz. Similar conclusions can be drawn by comparing Figure 14 and Figure 16. By comparing Figure 15 and Figure 16, it can be observed that the cavitation phenomenon had little impact on the maximum value of the self-spectral density. However, the more obvious the cavitation phenomenon, the larger the amplitude. The self-power spectral density function can represent the average energy per unit frequency band, so the larger the self-spectral density amplitude is, the greater the abnormal noise generated by the vibration damper is.

4.3. The Purpose and Requirements of the Damper Indicator Bench Test

To ensure the reliability of the FSI simulation results, a second experiment was conducted to verify the accuracy of the simulation. As shown in Figure 17, the damper indicator bench test was carried out to avoid relying solely on one experiment for verification purposes.
The ROEHRIG indicator damper experimental equipment was manufactured by the MTS company, USA. Its performance parameters are as follows:
Load: ±25 kN max
Displacement: ±30 mm
Temperature: 22 °C
Lateral force: 0
Speed: 2 m/s max.
Signal: Sine, Square, Triangle
Frequency: 100 Hz max

4.4. Analysis of Experimental Result

Figure 18 illustrates the damper indicator diagrams obtained at velocities of 0.3 m/s, 0.6 m/s, and 1.0 m/s. At a velocity of 0.3 m/s, the indicator diagram appears complete and free from distortion, indicating normal damper operation without free-stroke occurrence. This observation aligns with the simulation results presented in Figure 4, where no cavitation phenomenon is evident. At a velocity of 0.6 m/s, slight distortions emerge in the indicator diagram, suggesting potential free-stroke conditions. The corresponding simulation results depicted in Figure 5 similarly indicate cavitation initiation at critical locations, thus confirming consistency between the experimental and simulated outcomes. At the highest velocity of 1.0 m/s, the indicator diagram becomes significantly distorted, clearly signaling severe free-stroke conditions and pronounced cavitation phenomena. This condition closely matches the simulation results provided in Figure 6.

5. Conclusions

The cavitation parameter model, combined with an FSI finite element model of the damper’s stacked throttle valve system, was employed to investigate the failure mechanisms underlying the free-stroke phenomenon in hydraulic dampers. The analysis results led to the following conclusions:
(1)
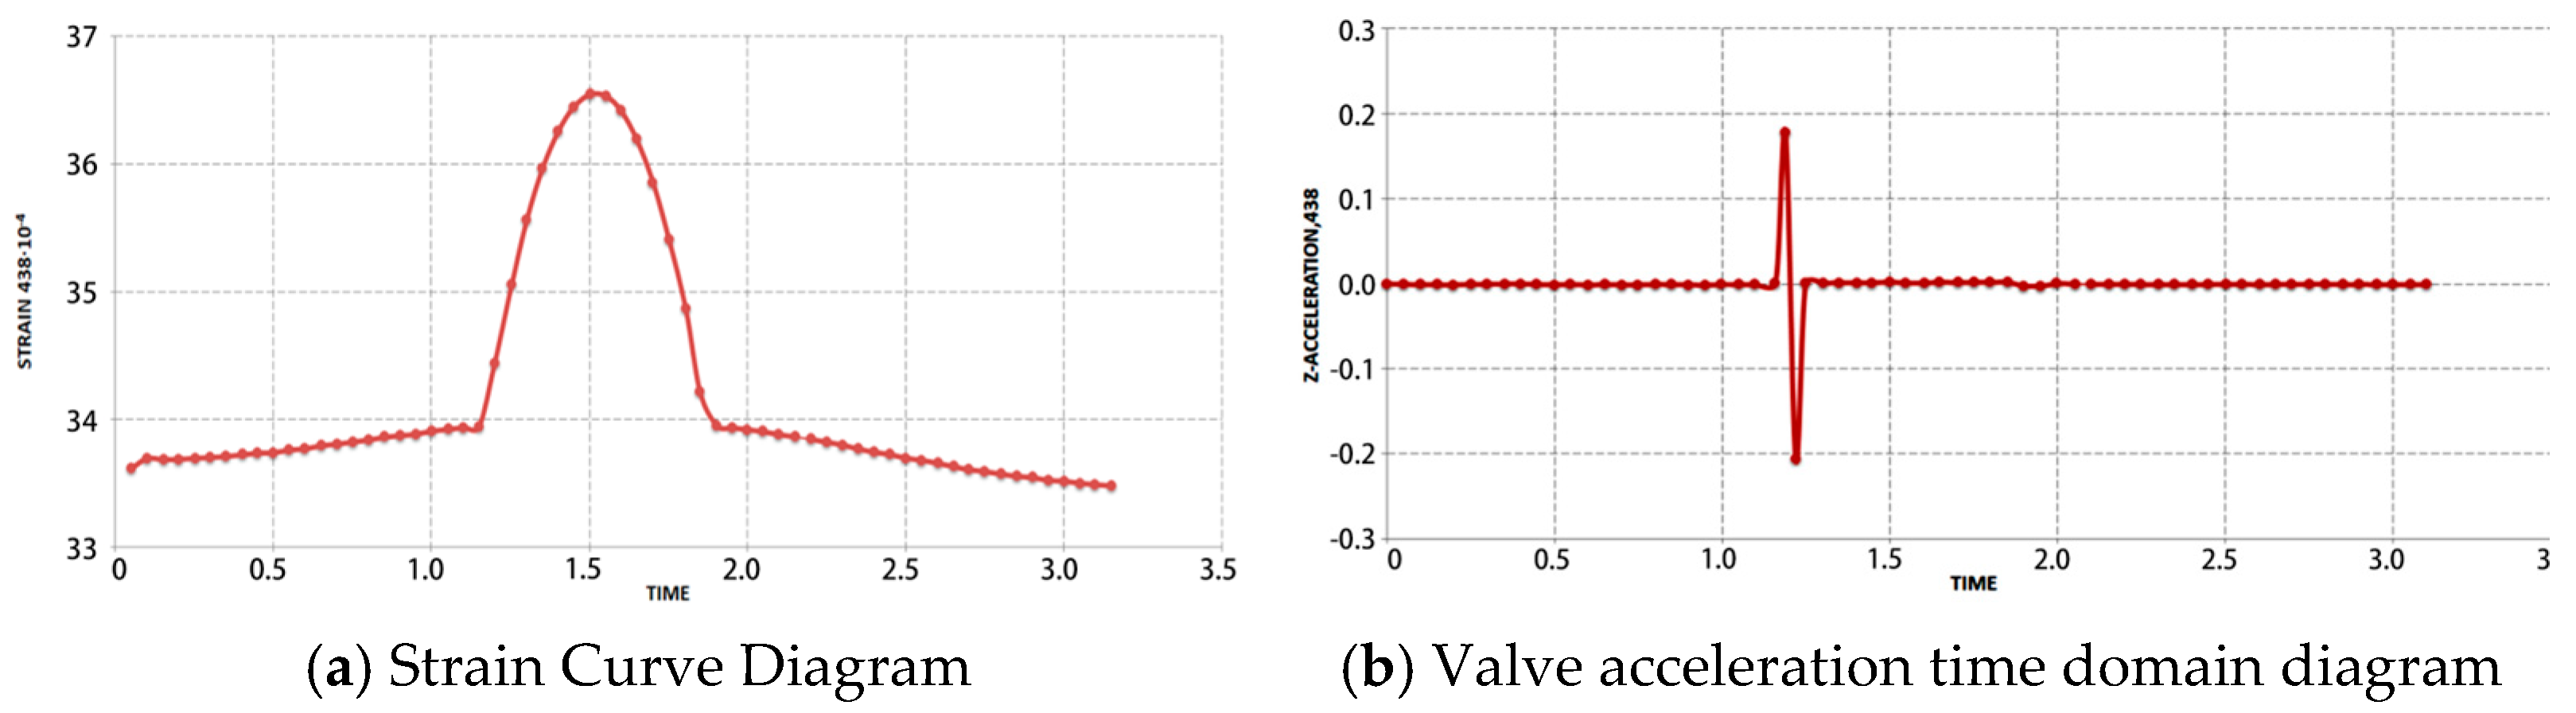
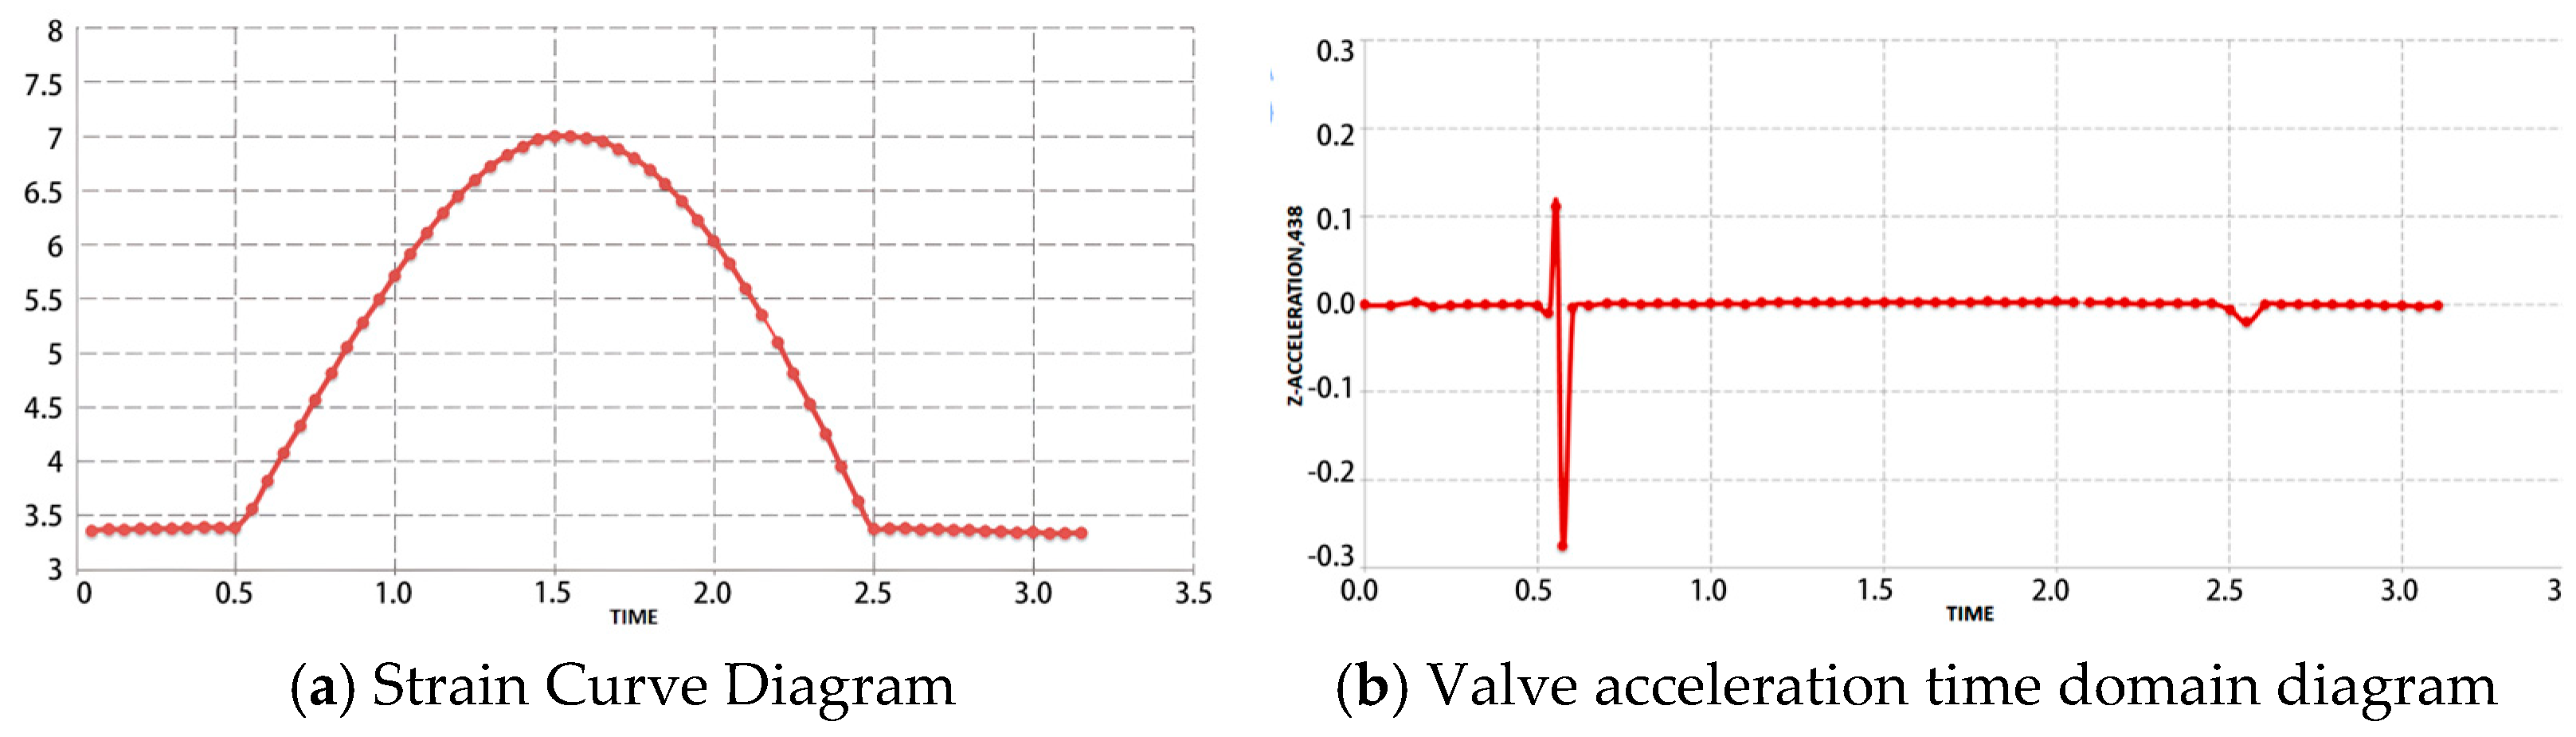
As piston speed increases, the occurrence of cavitation near the damper valve system becomes more pronounced. The maximum strain on the valves is concentrated internally, with a peak value of approximately 7 × 10⁻³. As cavitation intensifies, both the magnitude and duration of the strain increase. Furthermore, the outer edges show the greatest displacement of the valves. These insights provide a strategic approach to prevent performance distortion.
(2)
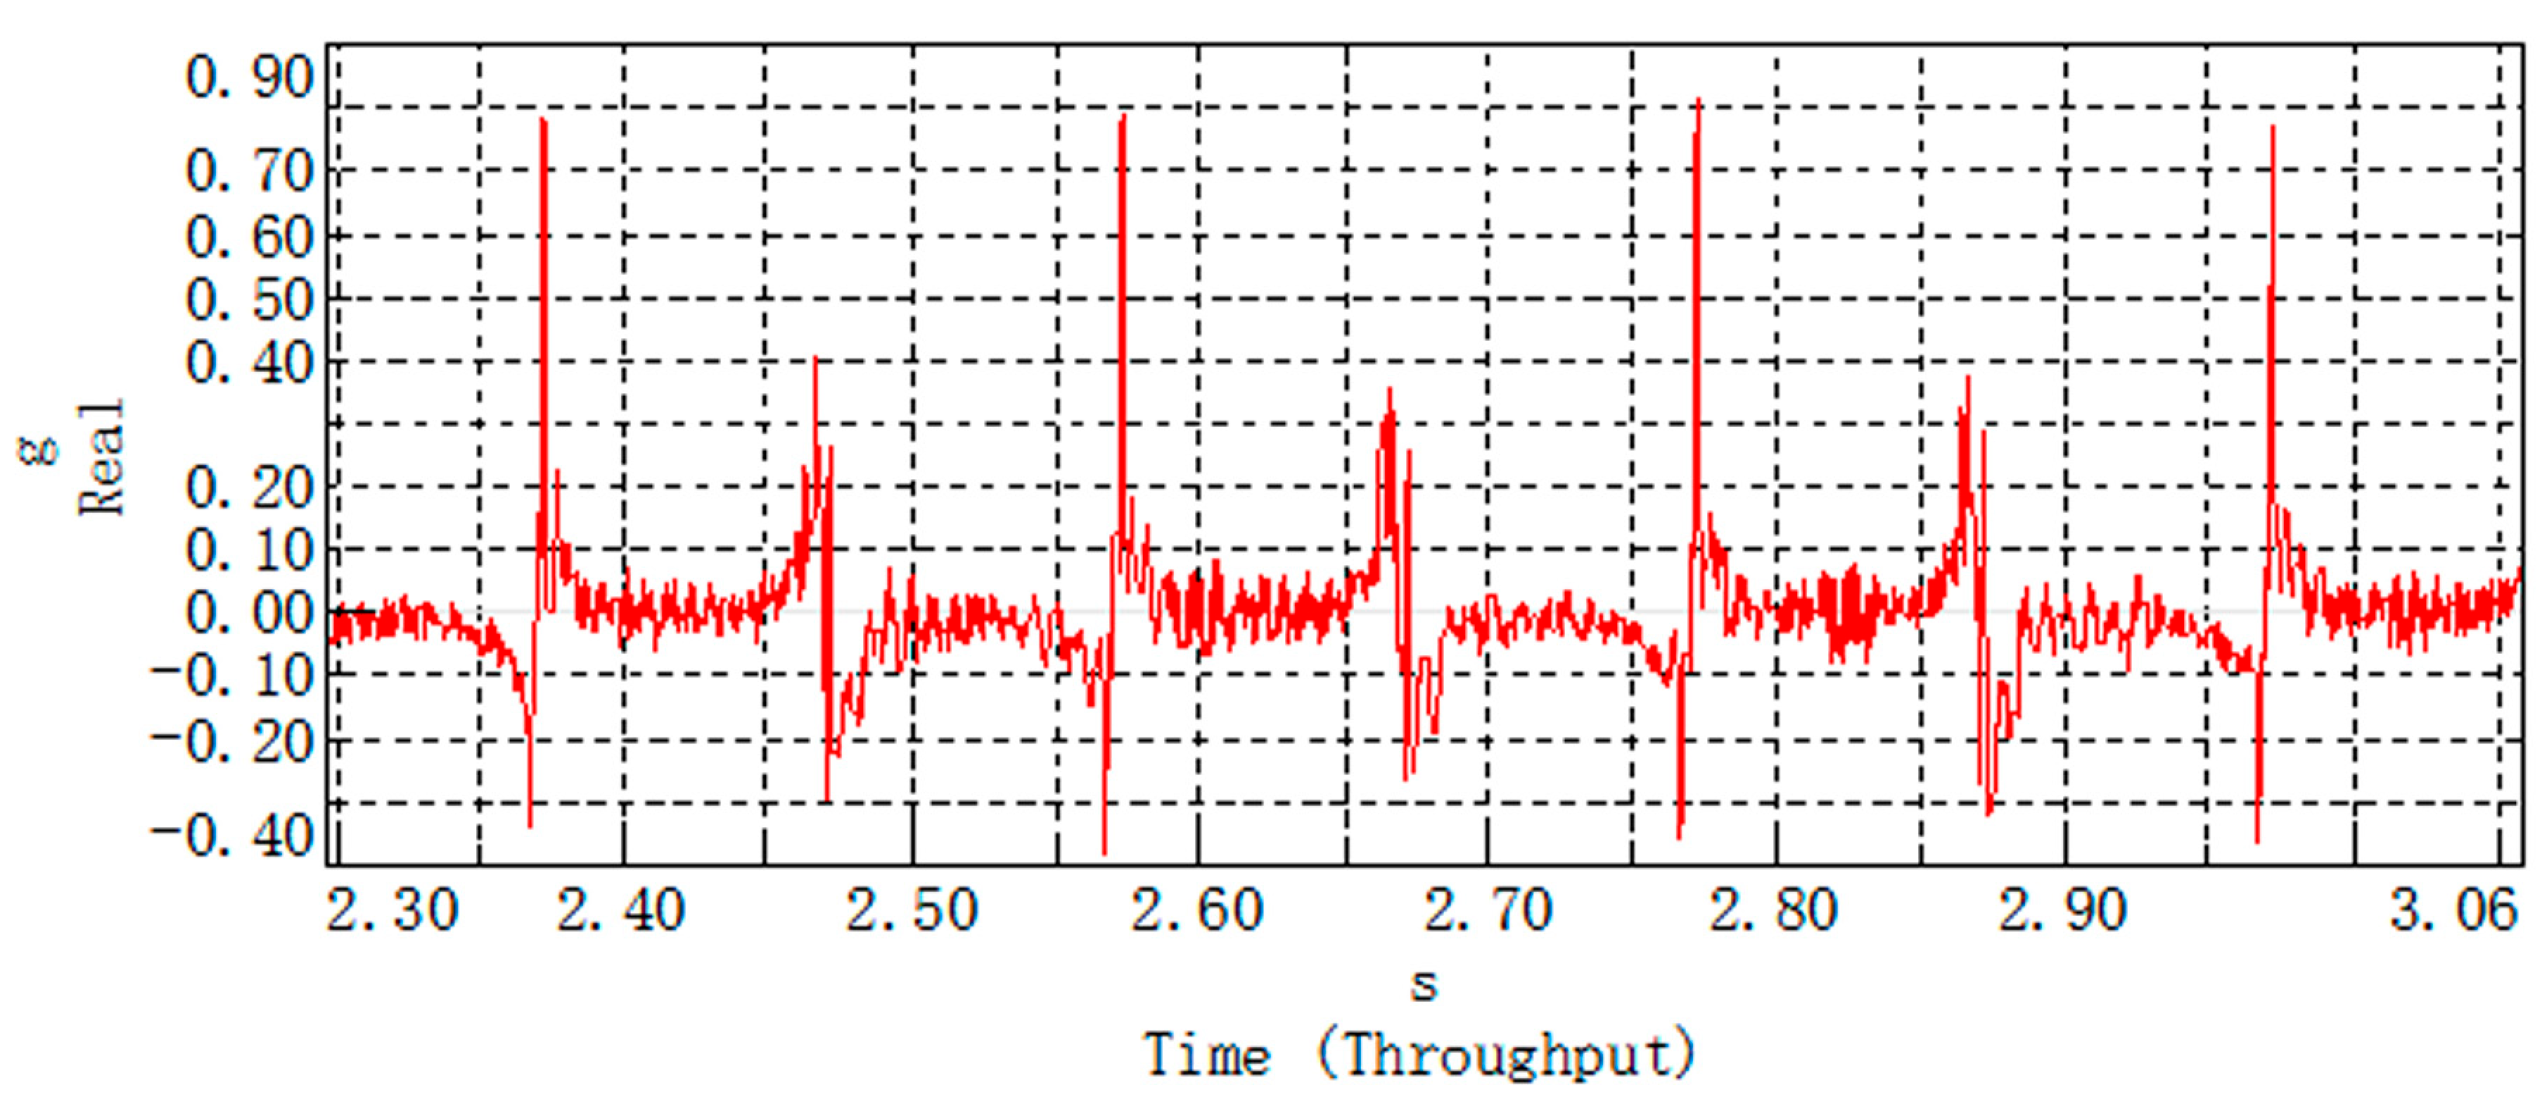
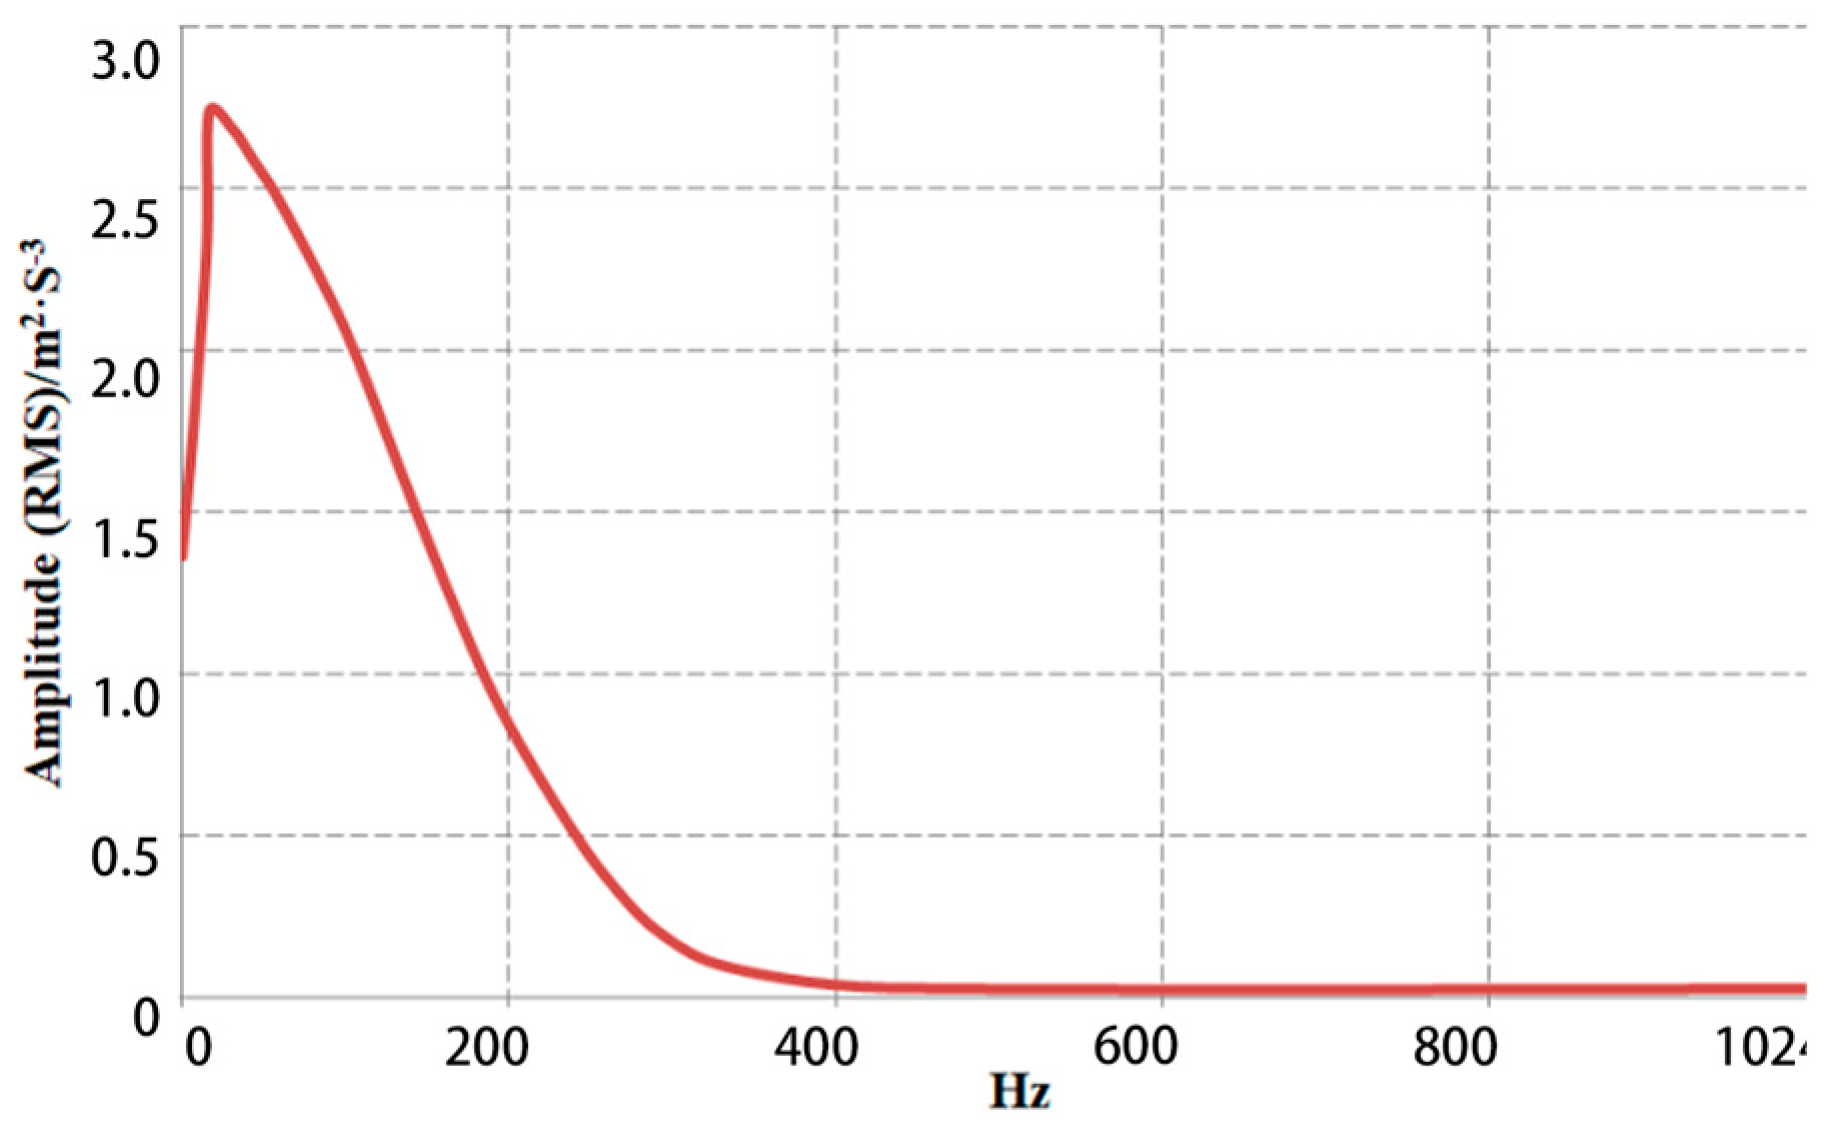
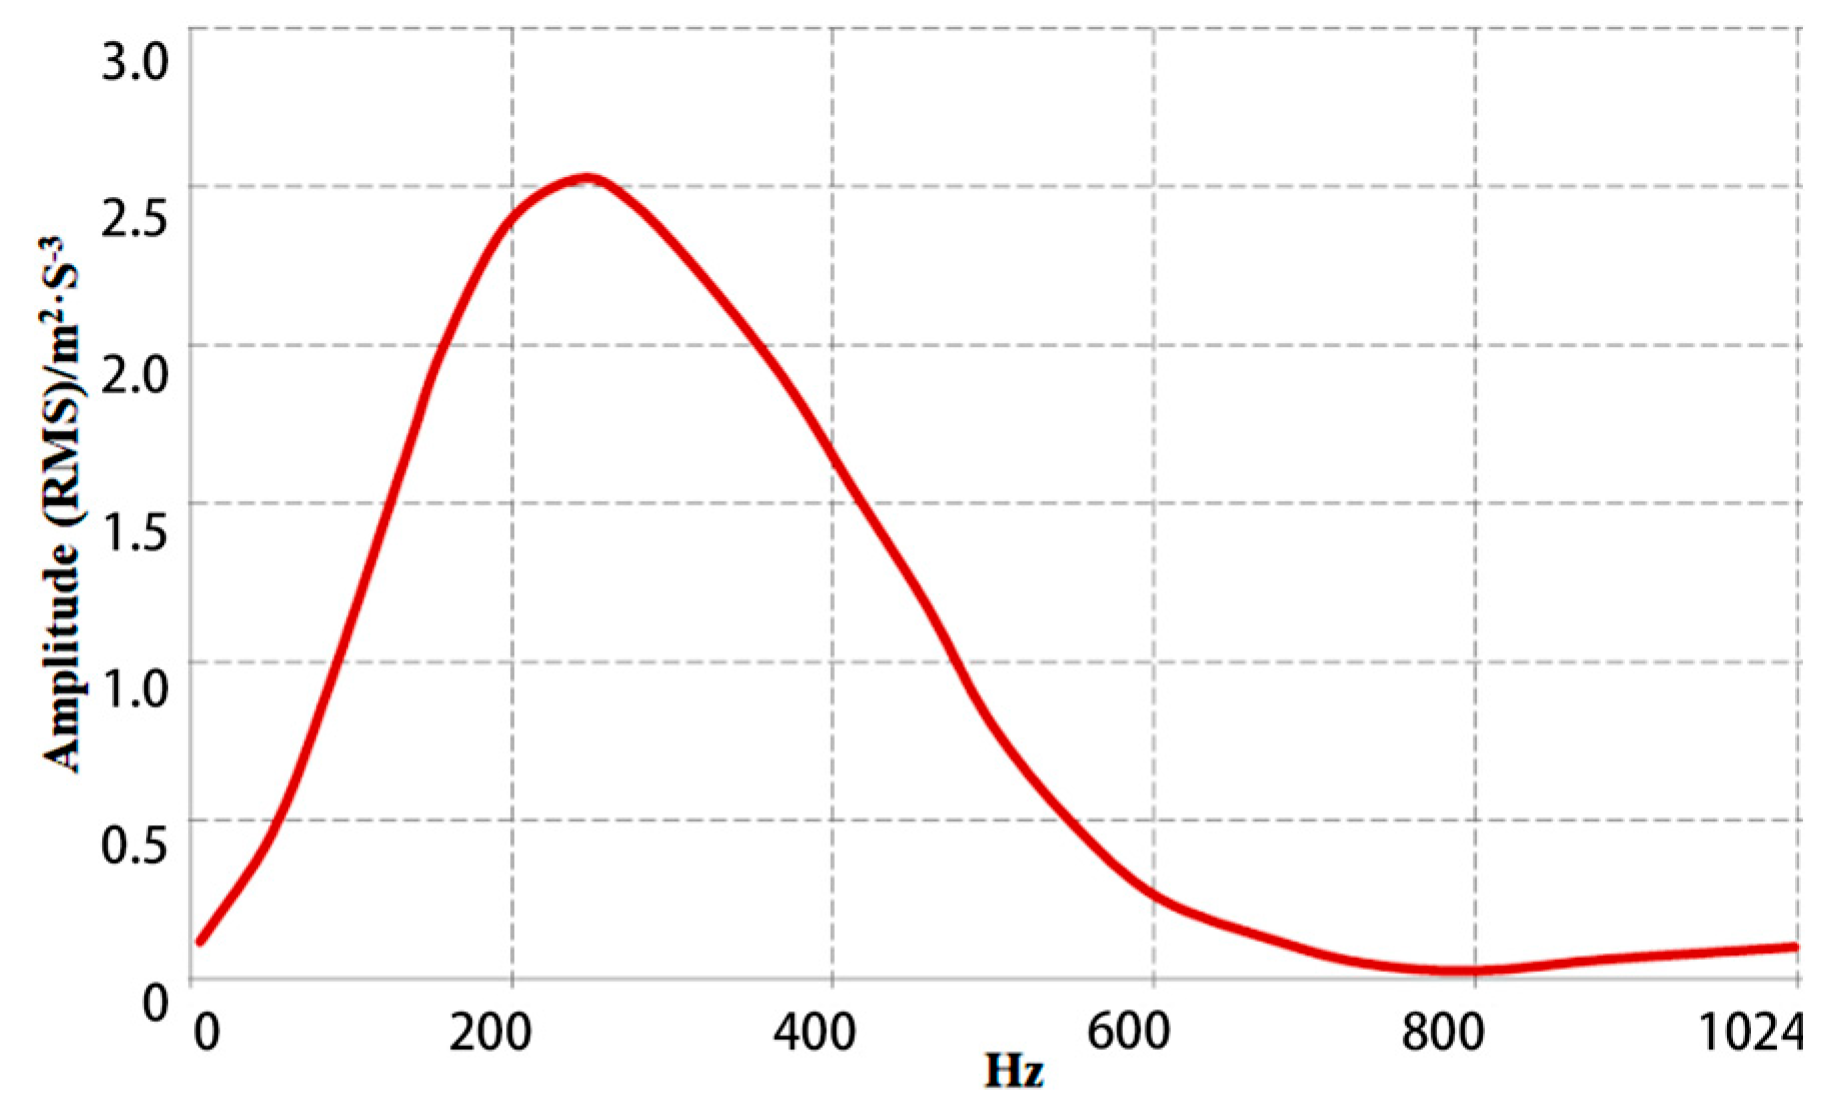
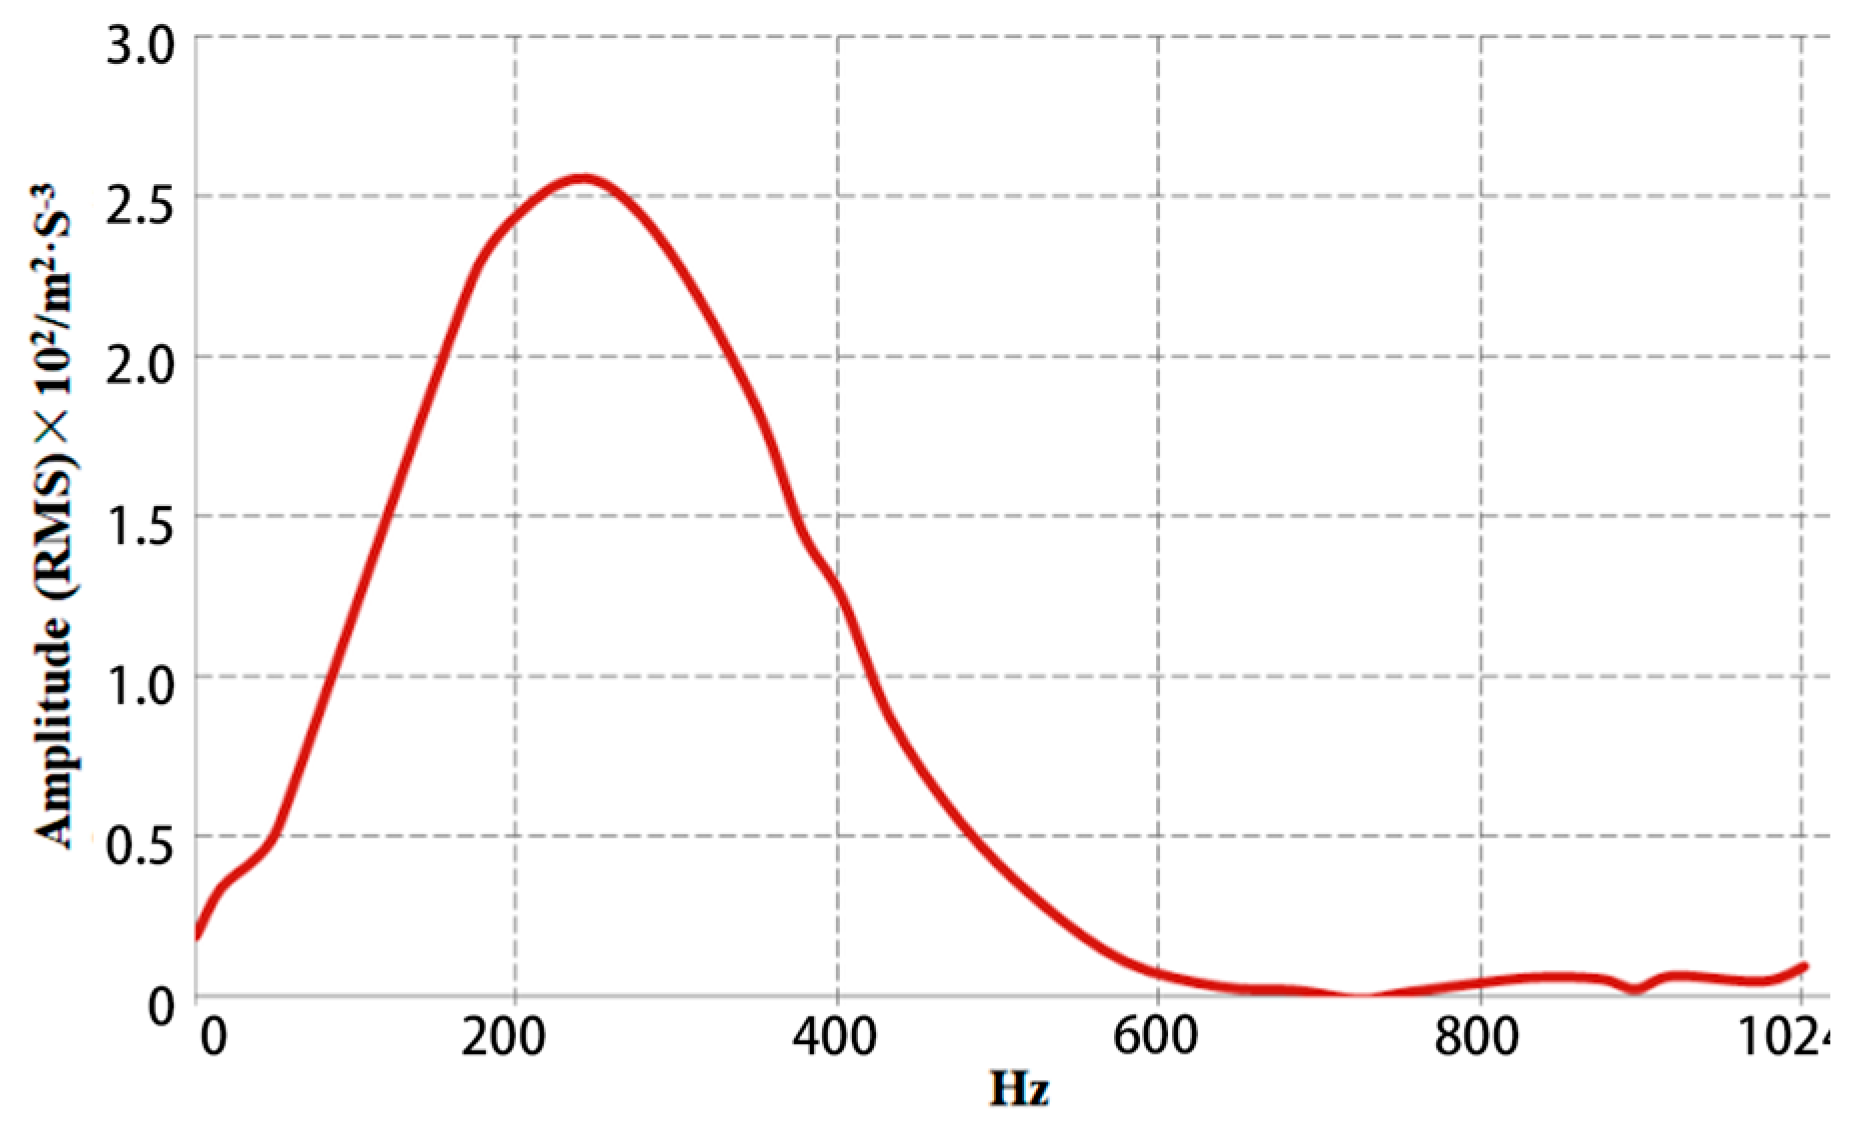
The self-spectral density of 0.6 m/s reaches a maximum value of 255 g at about 250 Hz, while 0.3 m/s reaches a maximum value of 2.7 g at about 50 Hz. The peak values of self-spectral density are not much affected by cavitation. As the cavitation becomes more pronounced, the amplitude increases, which causes an increase in abnormal noise from the vibration damper.
(3)
Two different experimental methods were employed to validate the accuracy of the finite element simulation for the fluid–structure interaction (FSI) of the damper. By adjusting the model parameters, occurrences of free stroke within the damper can be prevented, thereby reducing dependence on experimental trials during the development phase of the damper valve system and enhancing its development efficiency.

Author Contributions

Conceptualization, Z.Y.; methodology, Z.Y.; software, N.Z.; validation, N.Z.; formal analysis, Z.Y.; investigation, Z.L.; data curation, Z.L.; writing—original draft preparation, N.Z.; supervision, Z.L. All authors have read and agreed to the published version of the manuscript.

Funding

This work was supported by the Natural Science of JiLin Province Education Department (Grant No. JJKH20251899KJ).

Data Availability Statement

All data generated or analyzed during this study are included in this published article.

Acknowledgments

The authors thank Jian Wu for his assistance in polishing the writing of this research.

Conflicts of Interest

The authors declared no potential conflicts of interest with respect to the research, authorship, and/or publication of this article.

References

  1. Ahmed, M.R.; Yusoff, A.R.; Romlay, F.R.M. Adjustable valve semi-Active suspension system for passenger car. Int. J. Automot. Mech. Eng. 2019, 16, 6470–6481. [Google Scholar] [CrossRef]
  2. Meng, X.; Kong, L.; Ding, R.; Liu, W.; Wang, R. Research on Active Suspension Control Based on Vehicle Speed Control Under Transient Pavement Excitation. World Electr. Veh. J. 2025, 16, 232. [Google Scholar] [CrossRef]
  3. Lu, X.; Chen, H.; He, X. A Frequency Domain Fitting Algorithm Method for Automotive Suspension Structure under Colored Noise. World Electr. Veh. J. 2024, 15, 410. [Google Scholar] [CrossRef]
  4. Graczykowski, C.; Faraj, R. Development of control systems for fluid-based adaptive impact absorbers. Mech. Syst. Signal Process. 2019, 122, 622–641. [Google Scholar] [CrossRef]
  5. Schickhofer, L.; Wimmer, J. Fluid–structure interaction and dynamic stability of shock absorber check valves. J. Fluids Struct. 2022, 110, 103536. [Google Scholar] [CrossRef]
  6. Deshmane, S.M.; Dhage, P.P.; Gaikwad, V.J.; Mali Pravin, K.; Daspute, S.G. Magnetic suspension system with electricity generation. Int. J. Adv. Res. Innov. Ideas Educ. 2017, 3, 1880–1889. [Google Scholar]
  7. Qi, H.; Chen, Y.; Zhang, N.; Zhang, B.; Wang, D.; Tan, B. Improvement of both handling stability and ride comfort of a vehicle via coupled hydraulically interconnected suspension and electronic controlled air spring. Proceedings of the Institution of Mechanical Engineers, Part D. J. Automob. Eng. 2020, 234, 552–571. [Google Scholar] [CrossRef]
  8. Zou, J.; Guo, X.; Abdelkareem, M.A.; Xu, L.; Zhang, J. Modelling and ride analysis of a hydraulic interconnected suspension based on the hydraulic energy regenerative shock absorbers. Mech. Syst. Signal Process. 2019, 127, 345–369. [Google Scholar] [CrossRef]
  9. Carabias, E.; Cabrera, J.; Castillo, J.; Pérez, J.; Alcázar, M. Non-intrusive determination of shock absorber characteristic curves by means of evolutionary algorithms. Mech. Syst. Signal Process. 2023, 182, 109583. [Google Scholar] [CrossRef]
  10. Faraj, R.; Holnicki-Szulc, J.; Knap, L.; Seńko, J. Adaptive inertial shock-absorber. Smart Mater. Struct. 2016, 25, 035031. [Google Scholar] [CrossRef]
  11. Yu, L.; Ye, L.; Wang, Q.; Huang, G. Design and dynamics investigation for a silicone rubber damper. J. Macromol. Sci.-Phys. 2011, 50, 540–550. [Google Scholar] [CrossRef]
  12. Pracny, V.; Meywerk, M.; Lion, A. Full vehicle simulation using thermomechanically coupled hybrid neural network damper model. Veh. Syst. Dyn. 2008, 46, 229–238. [Google Scholar] [CrossRef]
  13. Alsaydalan, M. Influence of cavitation phenomenon on the hydraulic behavior of leaks in water distribution systems. J. Water Supply Res. Technol.-Aqua. 2017, 66, 327–339. [Google Scholar] [CrossRef]
  14. Chen, Q.-P.; Shu, H.-Y.; Fang, W.-Q.; He, L.-G.; Yang, M.-J. Fluid structure interaction for circulation valve of hydraulic damper. J. Cent. South Univ. 2013, 20, 648–654. [Google Scholar] [CrossRef]
  15. Luo, T.; Jin, R.; Jiang, J. Hydraulic model and cavitations of hydraulic Buffer. J. Chongqing Jiaotong Univ. (Nat. Sci.) 2014, 33, 153–156. [Google Scholar]
  16. An, C.; Cao, Y.; Zhang, J. Hydraulic damper orifice cavitation and noise analysis. J. Shanghai Jiaotong Univ. 2018, 52, 297–304. [Google Scholar]
  17. Skrickij, V.; Savitski, D.; Ivanov, V.; Skačkauskas, P. Investigation of cavitation process in monotube shock absorber. Int. J. Automot. Technol. 2018, 19, 801–810. [Google Scholar] [CrossRef]
  18. Witcher, D. Seismicanalysis of wind turbinesin the time domain. Wind Energy 2005, 8, 81–91. [Google Scholar] [CrossRef]
  19. Syrakos, A.; Dimakopoulos, Y.; Tsamopoulos, J. Theoretical study of the flow in a fluid damper containing high viscosity silicone oil: Effects of shear-thinning and viscoelasticity. Phys. Fluids 2018, 30, 030708. [Google Scholar] [CrossRef]
  20. Hassanzadeh, A.; Bakhsh, M.S.; Dadvand, A. Numerical study of the effect of wall injection on the cavitation phenomenon in diesel injector. Eng. Appl. Comput. Fluid Mech. 2014, 8, 562–573. [Google Scholar] [CrossRef]
  21. Chen, Q.; Wu, M.; Kang, S. Study on Heat Generating Mechanism of Hydraulic damper Based on CFD. Mach. Des. Manuf. 2021, 365, 141–147. [Google Scholar]
  22. Yuan, C.; Song, J.; Liu, M. Comparison of compressible and incompressible numerical methods in simulation of a cavitating jet through a poppet valve. Eng. Appl. Comput. Fluid Mech. 2019, 13, 67–90. [Google Scholar] [CrossRef]
  23. Zhou, C.C.; Wang, G.L.; Xu, W. Study on air pockets and rebound phenomena of tele-scope shock absorber. Hydraul. Pneum. 2007, 8, 3–7. [Google Scholar]
  24. Zhou, C.C.; Li, D. Analysis and study on hydraulic cavitation mechanism of dampers. Lift. Conveying Mach. 2008, 1, 53–56. [Google Scholar]
  25. ADINA R&D. ADINA: Theory and Modeling Guide Report ARD01-9.USA; ADINA Engineering Inc.: Watertown, MA, USA, 2001; pp. 235–262. [Google Scholar]
  26. Dou, W.; Guo, S.; Zhang, L.; Zhu, Y.; Stichel, S. A feature points-based method for data transfer in fluid-structure interaction. Int. J. Mech. Sci. 2022, 234, 107696. [Google Scholar] [CrossRef]
  27. Yu, Z.; Zhang, N.; Liu, S. Simulation analysis of dynamic nonlinear characteristics of vehicle damper based on fluid-structure interaction. J. Jilin Univ. (Eng. Technol. Ed.) 2015, 45, 16–21. [Google Scholar]
  28. ADINA R&D. ADINA-F Theory and Modeling Guide: ARD08-9; ADINA R&D, Inc.: Watertown, MA, USA, 2008; pp. 26–28, 230–262. [Google Scholar]
  29. Tandis, E.; Ashrafizadeh, A. A numerical study on the fluid compressibility effects in strongly coupled fluid–solid interaction problems. Eng. Comput. 2021, 37, 1217. [Google Scholar] [CrossRef]
Figure 1. Schematic diagram of a twin-tube hydraulic vehicle damper. 1. piston rod; 2. tube reservoir; 3. pressure tube; 4. valve rebound; 5. valve compression.
Wevj 16 00392 g001
Figure 2. Fluid finite element model.
Wevj 16 00392 g002
Figure 3. Solid finite element model.
Wevj 16 00392 g003
Figure 4. Oil damper cavitation distribution cloud diagram v = 0.3 m/s.
Wevj 16 00392 g004
Figure 5. Oil damper cavitation distribution cloud diagram v = 0.6 m/s.
Wevj 16 00392 g005
Figure 6. Oil damper cavitation distribution cloud diagram v = 1 m/s.
Wevj 16 00392 g006
Figure 7. Valve deformation diagram.
Wevj 16 00392 g007
Figure 8. Valve strain cloud.
Wevj 16 00392 g008
Figure 9. Diagram of valve operating state at v = 0.3 m/s.
Wevj 16 00392 g009
Figure 10. Diagram of valve operating state at v = 0.6 m/s.
Wevj 16 00392 g010
Figure 11. Diagram of valve operating state at v = 1.0 m/s.
Wevj 16 00392 g011
Figure 12. Damper noise test bench.
Wevj 16 00392 g012
Figure 13. Experimental result of abnormal damper.
Wevj 16 00392 g013
Figure 14. Acceleration PSD (power spectral density) curve of 0.3 m/s load.
Wevj 16 00392 g014
Figure 15. Acceleration PSD (power spectral density) curve of 0.6 m/s load.
Wevj 16 00392 g015
Figure 16. Acceleration PSD (power spectral density) curve of 1.0 m/s load.
Wevj 16 00392 g016
Figure 17. Damper indicator test bench.
Wevj 16 00392 g017
Figure 18. Indicator diagram of damper with different speeds.
Wevj 16 00392 g018
Disclaimer/Publisher’s Note: The statements, opinions and data contained in all publications are solely those of the individual author(s) and contributor(s) and not of MDPI and/or the editor(s). MDPI and/or the editor(s) disclaim responsibility for any injury to people or property resulting from any ideas, methods, instructions or products referred to in the content.

