Abstract
This paper analyzes the impact of electromobility on distribution grids and voltage stability. In line with current legislation and the European Commission’s plans for the future of electromobility, the aim is to increase the share of electric vehicles to 50% by 2050. However, achieving this target can be challenging due to the characteristics and features of the electric vehicle charging stations and the associated charging methods, which can lead to constraints within the network. The analysis includes the integration of single-phase and three-phase chargers on a radial feeder, as well as the determination of the maximum number of vehicles that can be accommodated on a given feeder without compromising voltage stability. Five scenarios are evaluated using the DigSilent software package to gain a better understanding of the impact of electromobility on the distribution grid.
1. Introduction
The European Commission launched the European Green Deal in 2020, which defines a legally binding target to achieve a 55% reduction in greenhouse gases by 2030 with the aim to achieve a climate-neutral Europe by 2050 [1]. All economic sectors are expected to contribute to this reduction, including transportation, which has been increasing gradually since 1990 and is responsible for 20% of all greenhouse gas emissions in the EU. If the right steps are not taken, it is estimated that the transportation sector’s greenhouse gas emissions might rise by over 20% by 2030 and nearly 50% by 2050. In order to meet the shared objectives of lowering greenhouse gas emissions, a significant proportion of new passenger car and cargo vehicle sales must be of electric vehicles (EVs). Additionally, the European Union must expedite the development of electric vehicle charging infrastructure, while the automotive sector employs almost 15 million people in Europe and contributes more than 7% of the EU’s GDP, thus being a vital sector [2]. By 2030, fewer than 20% of road traffic will consist of electric vehicles, but 30% of these investments will need to go toward infrastructure to reduce carbon dioxide emissions from traffic, according to the electric charging strategy. This is due to the fact that only 18% of the renewable energy sources that will be deployed by 2030 will be used for EV charging. A 17% share, or 42.8 million electric passenger vehicles (battery electric vehicles, or BEVs, and plug-in hybrid electric vehicles, or PHEVs), 4.4 million electric light delivery vehicles, or 13% of the total number, and 0.3 million electric trucks, or 3.5% of the total number, should be on the road by the end of the decade. In terms of chargers, this translates to 6.8 million chargers for passenger vehicles, 0.7 million for light delivery vehicles, and 0.1 million for trucks and buses. These figures are necessary to achieve a 55% reduction in greenhouse gas emissions by 2030 [2,3].
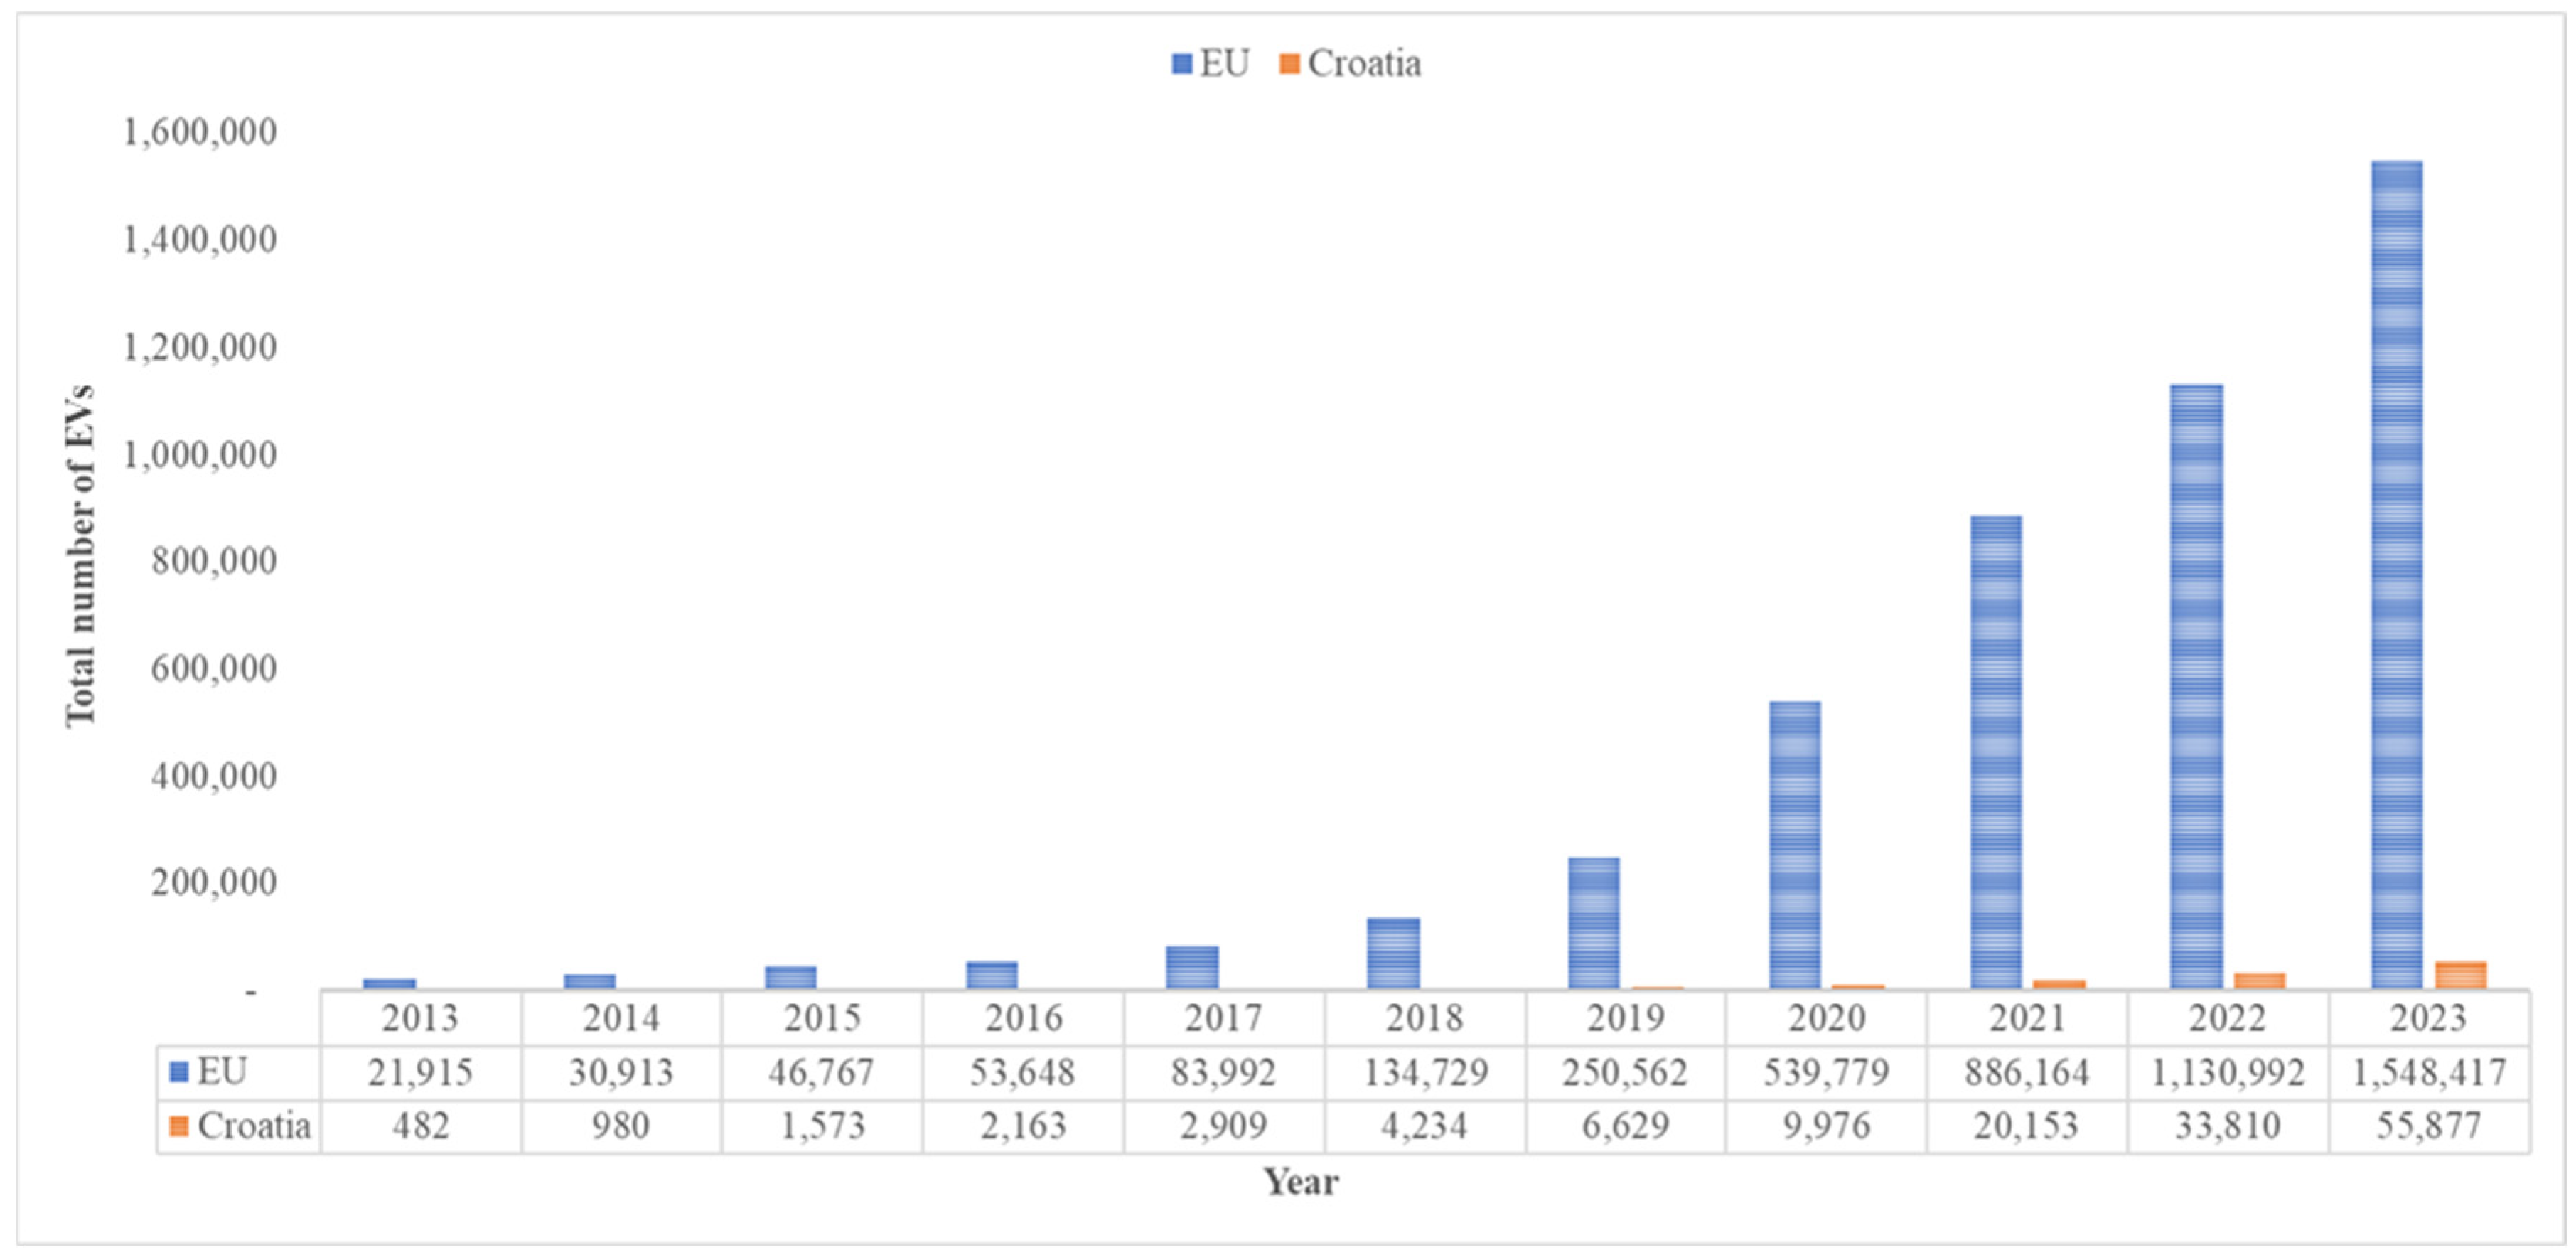
European directives and national laws contain technical requirements and regulatory regulations for electric car charging stations that are applicable to all EU member states. The section of the Building Act that deals with promoting electromobility and installing charging infrastructure in buildings is in effect in Croatia [4], defining the necessary conditions and terms for EV chargers. The number of charging stations and charger types has significantly increased globally in recent years. Fast and public chargers are the most common forms, offering electric vehicle drivers without a home connection a reliable and safe method of charging. According to [5] the first fully electric EV was registered in Croatia in 2007. The promotion of electromobility, the reduction in vehicle prices and the greater availability of EV and charging stations have led to a significant increase in the number of EVs since 2015. According to same source, in the year 2024, 9987 full EVs and almost 79,000 hybrid vehicles were registered in Croatia. Figure 1 shows a comparison of the number of EVs (all types) in the European Union and in Croatia for the time period between 2013 and 2023 [5,6].
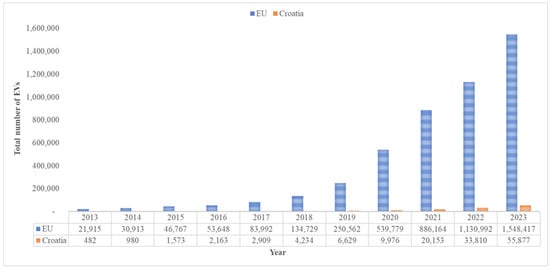
Figure 1.
Comparison of total EVs registered in EU and Croatia in 2013–2023.
According to the above data and projections, it is clear that the direction of development will involve a further increase in the number of electric vehicles. However, the current state of the electricity grid and the methods of calculating electricity consumption represent a limitation that will not be easily overcome in a short period of time. This paper analyzes the impact of the increase in the number of EV charging stations on the grid. A passive output without photovoltaic (PV) power plants and with EV integration as provided for by the directives of the European Commission is assumed, corresponding to 50% of electric vehicles. According to the current habits of EV owners, charging is conducted during the night, primarily because EV owners are home during the night and can connect to their chargers, and the secondly because of the price of electricity, which is lower at night. With assumed charging during the night, the rooftop PV power plant that could be integrated in the grid would not provide energy to the grid anyway, and the impact of EVs on the distribution feeder and the voltage conditions could be observed.
In this paper, the impact of single-phase and three-phase EV charger integration on a realistic distribution feeder is analyzed. In scenario 1, which is also a basic scenario, the voltage stability of a passive feeder without integrated EV chargers is observed. Afterwards, in scenarios 2 and 3 it is assumed that the integration level reaches 50%, as aimed by the legislative directives. Finally, in the last two scenarios the maximum number of single-phase and three-phase EV chargers that will not have a negative effect on the voltage profile of the feeder is determined. For each scenario the voltage profiles and the amount of energy taken from the distribution grid are presented, and the results are compared. This paper consists of five chapters, with Introduction as the first chapter, in which the key motivation for this research is presented. The second chapter describes the Materials and Methods used to conduct the research, as well as the key settings for conducting the case study. The third chapter provides the current state of the art and indicates how EV integration affects a distribution grid. In the fourth chapter, a mathematical background regarding voltage calculation in a radial grid is given, while a feeder model and scenarios are presented in the fifth chapter. In the sixth chapter, the results are discussed, and the paper ends with the seventh chapter, containing the conclusions and suggestions for future work.
2. Materials and Methods
The feeder model was based on a real case of radial distribution grid in Croatia, starting from the transformer at the connection with the external grid, including all cables (parameters, lengths, current limits), and modeled according to the actual distribution feeder. The arrangement of consumers, in this case households, corresponded to that of a realistic feeder, and the consumer characteristics were obtained by measurements according to the EN50160 standard over a period of one week. A load profile corresponding to the average working day load was selected. In this case, since the feeder consisted of households, there was no significant deviation in load distribution between working days and weekends, nor were there any significant consumers that would affect the load curve (for example, a small industrial facility).
In addition to the load profile, a harmonic spectrum was assigned to each consumer, which was taken into account during consumer modeling, although harmonic analysis was not conducted in this study. The EV charging load curve was also modeled according to the characteristics of three-phase and single-phase EV chargers obtained from measurements. All data not specified in this paper or in the referenced literature can be obtained upon request from the authors; they were omitted because this is a long-term research project whose results have already been partially presented.
For the analysis, the DIgSILENT PowerFactory 2022 SP3 software package was used, in which the model was created, and quasi-dynamic simulations were performed for the considered 24 h period, observing the voltage profile and the energy exchange with the external grid during that period. EV chargers were distributed so that in two scenarios, the European Commission’s requirement for a 50% share of EVs in the transport sector was met, and subsequently, the voltage profile was analyzed for a limited number of vehicles whose simultaneous charging would not compromise voltage quality. All simulations were conducted under the assumption that two electricity tariff rates existed, as is the case in Croatia.
PV integration was not considered in this paper because the focus was on the implementation of the directive that promotes a 50% share of EVs in transport. The analysis was made according to the current electricity charging framework in Croatia (two tariffs) and EV owners’ preferences for charging at night due to lower electricity prices and their being at home at night. The price of electricity in Croatia is still affordable, which hardly motivates property owners to integrate PV systems. EV owners are more interested in installing PV systems, but as can be seen from the number of EVs in Croatia, their number is still negligible compared to that in leading EU countries. The analysis of the voltage profiles was made in previous works by the author, where significant PV integration and vehicle charging according to different patterns were assumed, considering daytime, nighttime, and finding the optimal charging plan if the vehicle had the ability to operate the vehicle-to-grid technology (V2G), with or without limiting the battery charge state [7]. However, in comparison to these works, the emphasis is here placed on the network load if the provision of 50% EVs were to be respected with the current state of electricity charging.
3. Integration of EV Charging Stations into the Distribution Grid
Following the requirements of the directives and in an effort to reduce harmful greenhouse gas emissions, the number of EVs is increasing year by year. Given that this is changing the existing power system, it is first necessary to define the legal and regulatory frameworks and enable access for users interested in purchasing an electric vehicle. An overview of possibilities and limitations from the technical, economic and regulatory sides, for the distribution system operator (DSO) and the end consumer, is presented in [8]. In addition, possibilities for utilizing and increasing flexibility with EV integration are proposed, as well as an overview of significant projects in European Union countries. With the increasing number of electric vehicles, different types of vehicle charging are also being developed. There are two basic groups of methods: unidirectional and bidirectional charging [9,10,11]. Unidirectional charging exclusively directs the energy towards the car and can be carried out as uncontrolled, delayed and controlled. Uncontrolled charging creates the greatest problems in the distribution grid, since it takes place at full power until the battery is fully charged. The negative sides are primarily the consumption of high power at any time of the day, which can lead to thermal loads and stresses on lines and transformers, and increased losses in the grid [12,13,14,15].
A second type of unidirectional charging is delayed charging [16], which can have a smaller impact on the grid, since charging takes place at a time when price signals are more favorable (lower electricity prices), thus affecting the total load on the system. However, apart from the adjustable period, there is no possibility of controlling the maximum power; so, in this case, charging is also performed with the highest available power [17]. Due to the lower prices, a second peak load may be created during the day because all owners will decide to charge when the electricity price is lower [18]. A third type, which is also the most favorable among unidirectional charging methods, is controlled charging. In this case, the charging time and the maximum power are controlled, reducing the negative impact on the grid [19,20,21,22]. Among unidirectional methods, this appears as the most favorable, with the least impact on the state of the distribution grid.
However, in order to achieve the least dependence on the external grid and at the same time use the full potential of the EV considering its positive impact on the grid, bidirectional charging methods have been developed in which the car battery can serve as an energy storage and provide energy at the moment when it is needed in the system [23,24]. These solutions are known as the vehicle-to-grid (V2G), vehicle-to-home (V2H) or vehicle-to-building (V2B) technologies. In V2B and V2H, energy is used to regulate energy consumption at the household or building level without affecting the external grid and is used for self-powering only in the event of a power outage or reducing dependence on the external grid [25,26,27]. In these cases, the only communication is between the EV and the building to which it is connected, and these systems do not provide a high level of service flexibility. On the other hand, the V2G concept offers various possibilities such as providing ancillary services, frequency regulation and energy storage, smoothing the daily consumption diagram, reducing the impact of renewable energy sources (RESs) on the grid, reducing dependence on the external grid and reducing the load on lines and transformers by reducing the energy exchange with the external grid. Of all the methods, the V2G technology is also the most common, with the negative aspect of causing accelerated aging of the EV battery. Also, the question arises of how much an individual car owner allows access to and management of his battery and to what extent EV battery discharge is allowed.
The integration of EV chargers can present a significant challenge to the system from the perspective of power quality. If the directive’s target—namely, that 50% of vehicles are electric—were met, most owners, given the limited number of public chargers and fixed tariffs (as is the case in Croatia), as well as the low electricity prices, the need of personal time management, and the desire to have their car nearby and available at their convenience, would likely choose to charge their vehicles at home. In such a scenario, three-phase chargers would not cause significant problems for the network; they can be considered simply as an additional load and would not substantially increase the system’s asymmetry. On the other hand, single-phase chargers—which constitute the majority of home chargers—can lead to significant asymmetry in the system, since the DSO cannot regulate or determine where and to which phase an owner will connect their charger. In the worst-case scenario, all consumers might be connected to one- or two-phase chargers, thereby increasing unbalance. In Croatia, as in other countries facing similar challenges, periodic system balancing is carried out to equalize the load between phases and mitigate these effects.
Effects of EV Integration in the Distribution Grid
The integration of EVs into the distribution grid has a wide range of impacts on the grid. As with all technologies, EVs have both positive and negative impacts on the grid. In general, their impact is viewed in terms of power quality, the effect on line and transformer loads and that on grid losses. The integration of EV chargers increases the total power in the system, which can lead to an increase in peak loads. EV integration, in addition to its positive impact on the environment in the form of reduced emissions, can also have a positive impact on the operation of the power system. In general, the impact is primarily on the quality of electricity, which is improved, but also on grid management. The first positive effect includes load management and the possibility of demand side management [28]. EVs with their energy storage participate as a variable load and can therefore be used in the way the system is managed to smoothen the load curve. Charging vehicles during the day increases the load on the system during peak periods; however, if charging takes place at night during periods of lower load, the load on the system during the day is flattened, and EVs are used in order to flatten the voltage profile [29]. In addition, an increased load during the day would lead to a decrease in the voltage of the end consumers, while at night the voltages could be significantly higher. By managing EV charging in this way, smaller voltage deviations are achieved during the day, and the system is relieved during the peak period, which means that it is not necessary to ensure significantly higher production power during that period. For prosumer-rich feeders, the opposite happens—voltages increase if a large number of integrated rooftop PV systems are installed, and charging cars reduces the voltages and at the same time ensures less energy exchange with the external grid. Delayed charging thus both affects congestion control and relieves the load on the lines and transformers, which significantly affects their lifespan [30,31,32]. The increased load caused by the additional consumers in the grid increases the thermal stress of the grid components and the losses. A large number of integrated EVs means higher currents, and the load on the equipment can be brought to thermal limits. The problem can be eliminated by controlled charging, in which the maximum power and charging time of the vehicles are monitored, or by additional investment in the grid to upgrade the existing infrastructure and prepare for a larger number of electric vehicles.
EVs as a variable load can also be used in frequency regulation [33,34]. The frequency is constant if the active power of production and that of consumption are equal at all times. If production is higher than consumption, for example due to a large production from DG that cannot be consumed, the excess energy is stored in the EV battery energy storage system (BESS). In this way, the production/consumption ratios are kept constant, and there will be no frequency deviations. In addition, the EV BESS can be used as an additional energy source in the event of a drop in production. In this sense, EVs can be used as a variable load and enable greater grid flexibility [35]. A further step in increasing flexibility and achieving greater economic benefits is the use of EV BESS for providing ancillary services [36,37]. In addition to active power regulation, due to the way capacitors are designed and implemented as an integral part of the EV BESS, reactive energy regulation can be ensured. Analogous to the active power, the reactive powers of production and consumption must also be equalized in order to keep the voltages within the desired values. In this way, the EV BESS can be used for voltage regulation [38,39] and the management of reactive energy flows. From the above-mentioned considerations, it can be seen that the use of EVs can significantly affect the way the grid is managed, especially in terms of reducing losses and reducing dependence on external energy sources, and directly reduce financial losses for owners with regard to consumption management at times when the price signals are favorable on the market.
However, the use of EVs in improving energy quality (especially if used with the V2G technology) also has negative sides, as stated in the literature [40,41,42]. This primarily refers to the stochastic behavior of the users depending on price signals and, above all, user habits. Thus, charging most often takes place at night due to the lower prices but also to the fact that users are at home at that time and have the possibility of connecting to their home charger. Connecting to a charger during daytime peak loads will create a higher peak load and therefore a higher thermal load on connecting cables/lines and transformers. On the other hand, if too many users are connected during the night, the same problems can occur because there will be a higher voltage drop and problems in the grid. Due to poor planning and management of the system, as well as to too many integrated sources on the existing infrastructure that cannot handle such a large number of vehicles, the previously mentioned leveling will not occur, but rather another extreme peak loading will occur. The maximum number of vehicles that can be connected without significantly affecting the voltage conditions in the grid was determined [38,43]. The main criteria for determining the maximum number of EVs are based on voltage limitations and allowed voltage deviation, i.e., on terms aiming at maintaining voltage stability. In addition, voltage deviation is strongly correlated with the type of used charger. Three-phase chargers, which are usually of higher power, will load all three phases equally [44]. Single-phase chargers will significantly increase the power of only one phase, and considering that they are consumers of significant power (about 3.8 kW) in relation to household consumption, there will be an increase in the load of the individual phase [45,46]. EV users cannot determine the location or the phase to which they will be connected, as it is a matter of stochasticity, and there may be a significant unbalance that will impair the quality of electricity, with unbalance values above the deviation limits provided by the standard. Closely related to unbalance, harmonic distortion will also be affected due to power electronics circuits. Each charger has its own harmonic spectrum, and with a smaller number of chargers, the problem will not be so pronounced, as it has been shown that vehicles have little impact on the rest of the grid [47,48].
4. Calculation of the Voltage at the End of the Feeder
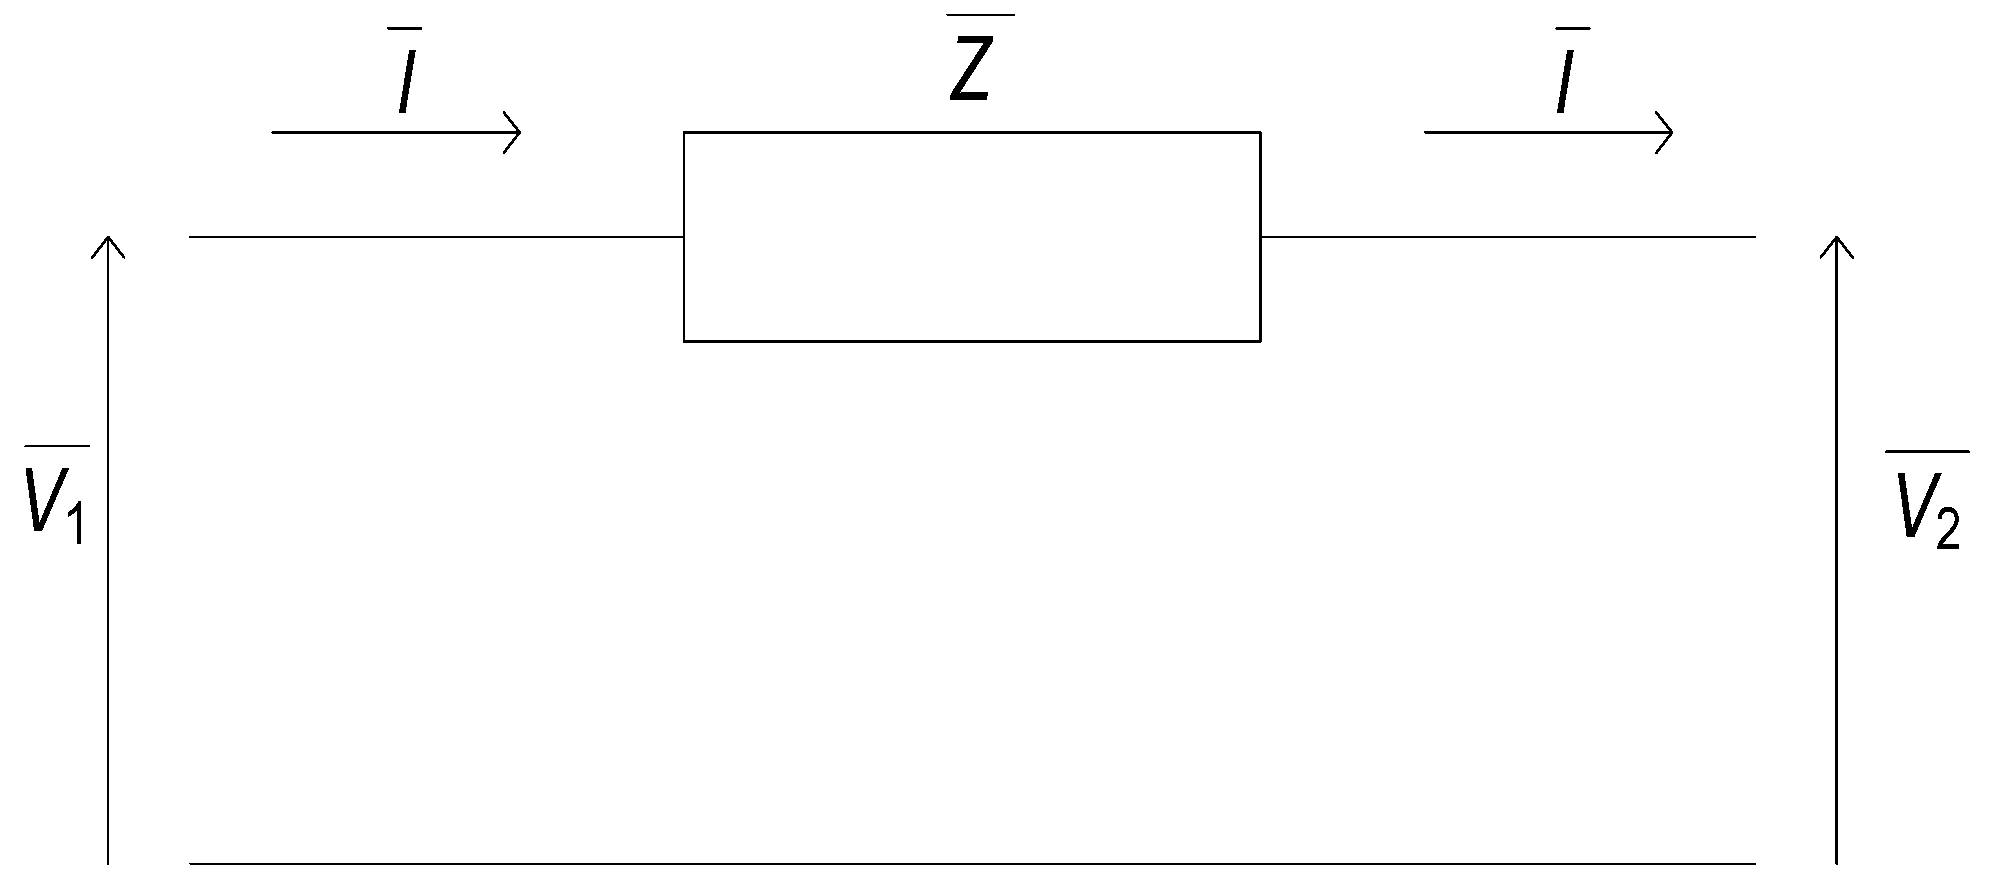
According to the European standard EN 50160 [49], which defines the power quality parameters, voltage needs to be kept within the limits of ±10% of the rated voltage. In radial distribution grids, characteristic for rural grids, there are consumers distributed along the feeder. At the beginning of the feeder, there is usually a transformer that defines the voltage of the feeder. In some grids, this transformer can be used to control the voltage. Since the lines are short with a specific X/R ratio, the capacity of the lines can be neglected, and it is assumed that also the angle difference can be neglected. With these neglected terms taken into account, the feeder can be understood as a longitudinal impedance consisting of resistance R1 and inductance with corresponding reactance X1 (both expressed in Ω/km), as shown in Figure 2.
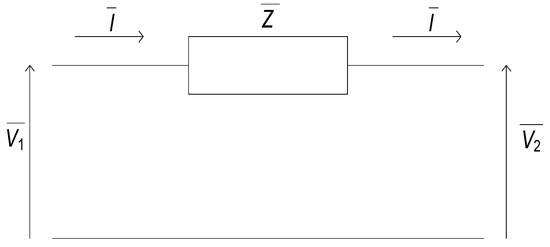
Figure 2.
Feeder replacement scheme.
The following calculation of the end voltage is performed based on Ref. [50]. For the feeder shown in Figure 2, the voltage at the beginning of the feeder (in V or kV) can be calculated using Equation (1)
where represents the voltage at the end of the feeder expressed in V or kV, is the current through the feeder in A or, rarely, for the distribution grid, in kA, and is the impedance of the feeder in Ω. The impedance of a feeder with length l (in km) is calculated using Equation (2):
If the apparent power (in kVA or MVA) is known, for , the current can be calculated using Equation (3)
The voltage drop along the feeder can now be calculated using Equation (4)
As mentioned before, the angle difference is neglected, and the voltage drop at the end of the feeder consists only of the longitudinal component of the voltage drop, as shown by Equation (5)
Equation (5) can be written in a general form if the losses are also neglected, in which case, , , and , where is the rated voltage. However, the feeder does not consist of a single consumer but of a series of n loads integrated along the feeder. In this case, the total apparent power is the sum of the apparent power of each load (as shown in Equation (6)):
The total power towards the end of the feeder is reduced by the individual consumer powers as follows in Equation (7) for the second load on the feeder
and consequently, the power of the last load is given by the Equation (8)
Combining Equations (2) and (5)–(8), the voltage drop at the end of the feeder can be calculated by Equation (9)
where is the cumulative active power of the i-th load, expressed in kW or MW, is the cumulative reactive power of the i-th load (in kVAr or MVAr), and is the length of the i-th section of the feeder in the corresponding unit, m or km.
5. Voltage Stability at the End of the Feeder
With the expected projections and set goals regarding the share of EVs in the total number of means of transport, the question arises as to what impact such a level of integration will have on the grid. Vehicle charging must be provided at various locations—office buildings, public parking lots, highways, in front of shopping malls, at rest areas, etc. However, despite the availability of public charging stations, most drivers will charge their cars at home. A large number of chargers integrated into the distribution grid represents a significant increase in load, especially if charging is performed with three-phase chargers of higher power. The primary focus of this study is on the provisions of the directive, specifically, the targeted 50% share of electric vehicles (EVs) in the transport sector, and how achieving this share would affect a realistic distribution network. While it is indeed important and interesting to consider public charging stations in the analysis—especially given spatial constraints such as limited parking availability in residential buildings, where not every EV owner can have a dedicated charging spot, as well as the potential to increase the driving flexibility—this particular work intentionally concentrates on a segment of a radial feeder composed exclusively of single-family homes. Consequently, the need for a significant number of public chargers in this context is minimal. Also, the analyzed feeder represents a typical configuration of a rural grid in Croatia, with old infrastructure.
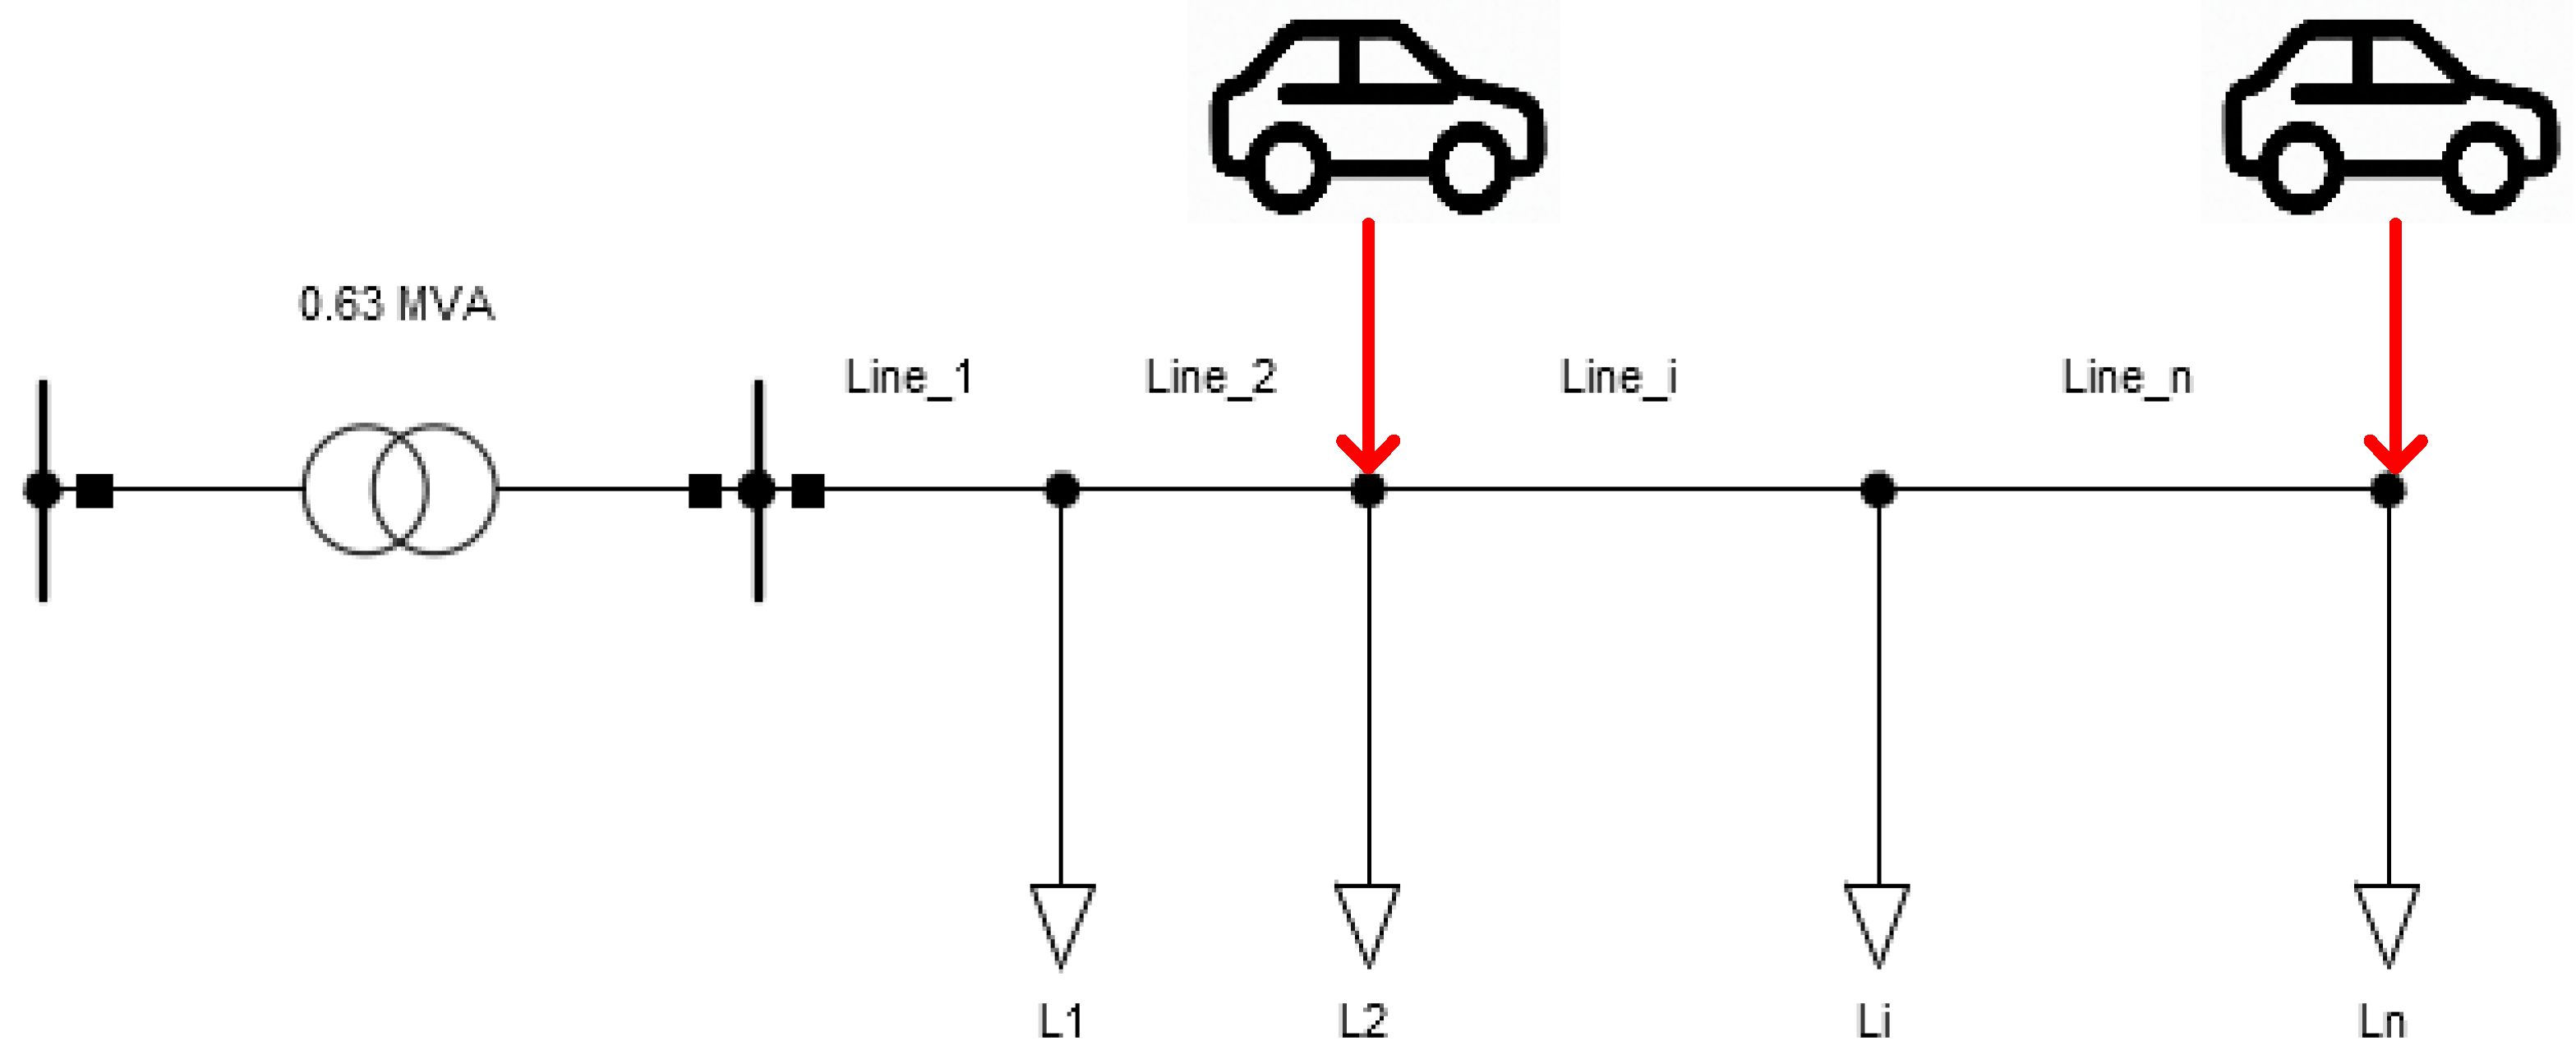
This work used a model of a real grid (Figure 3)—a distribution low-voltage feeder with a load characteristic of a household. Given that it was a rural feeder, the assumption was that there would be no integrated rooftop PV power plants and that it would not affect the voltage conditions on the feeder. In addition, charging took place during the night; so, the possible integration of the rooftop PV plants would not have an impact on the voltage conditions. Charging at night was considered for two key reasons:
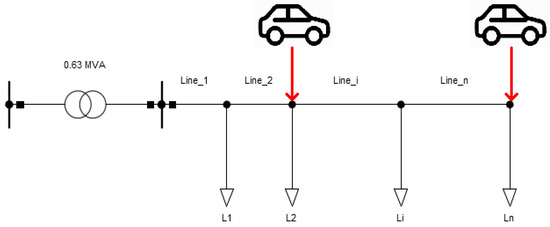
Figure 3.
Distribution grid model with integrated EV.
- −
- A two-tariff electricity billing model was used, as currently in effect in Croatia, for which the analysis was conducted, according to which the electricity price is lower during the night and higher during the day.
- −
- EV users are predominantly working individuals who are not at home during the day; therefore, it is not possible to charge the car at home during daytime hours. Even with installed rooftop PV systems, charging could not take place during the peak production period. The high price of rooftop PV power plants and energy storage systems, along with the low price of electricity and a long payback period, will not encourage electric vehicle owners to build a PV power plant.
All the simulations were made using DIgSILENT PowerFactory 2022. This research was also a based on previous research conducted by the authors [51,52,53].
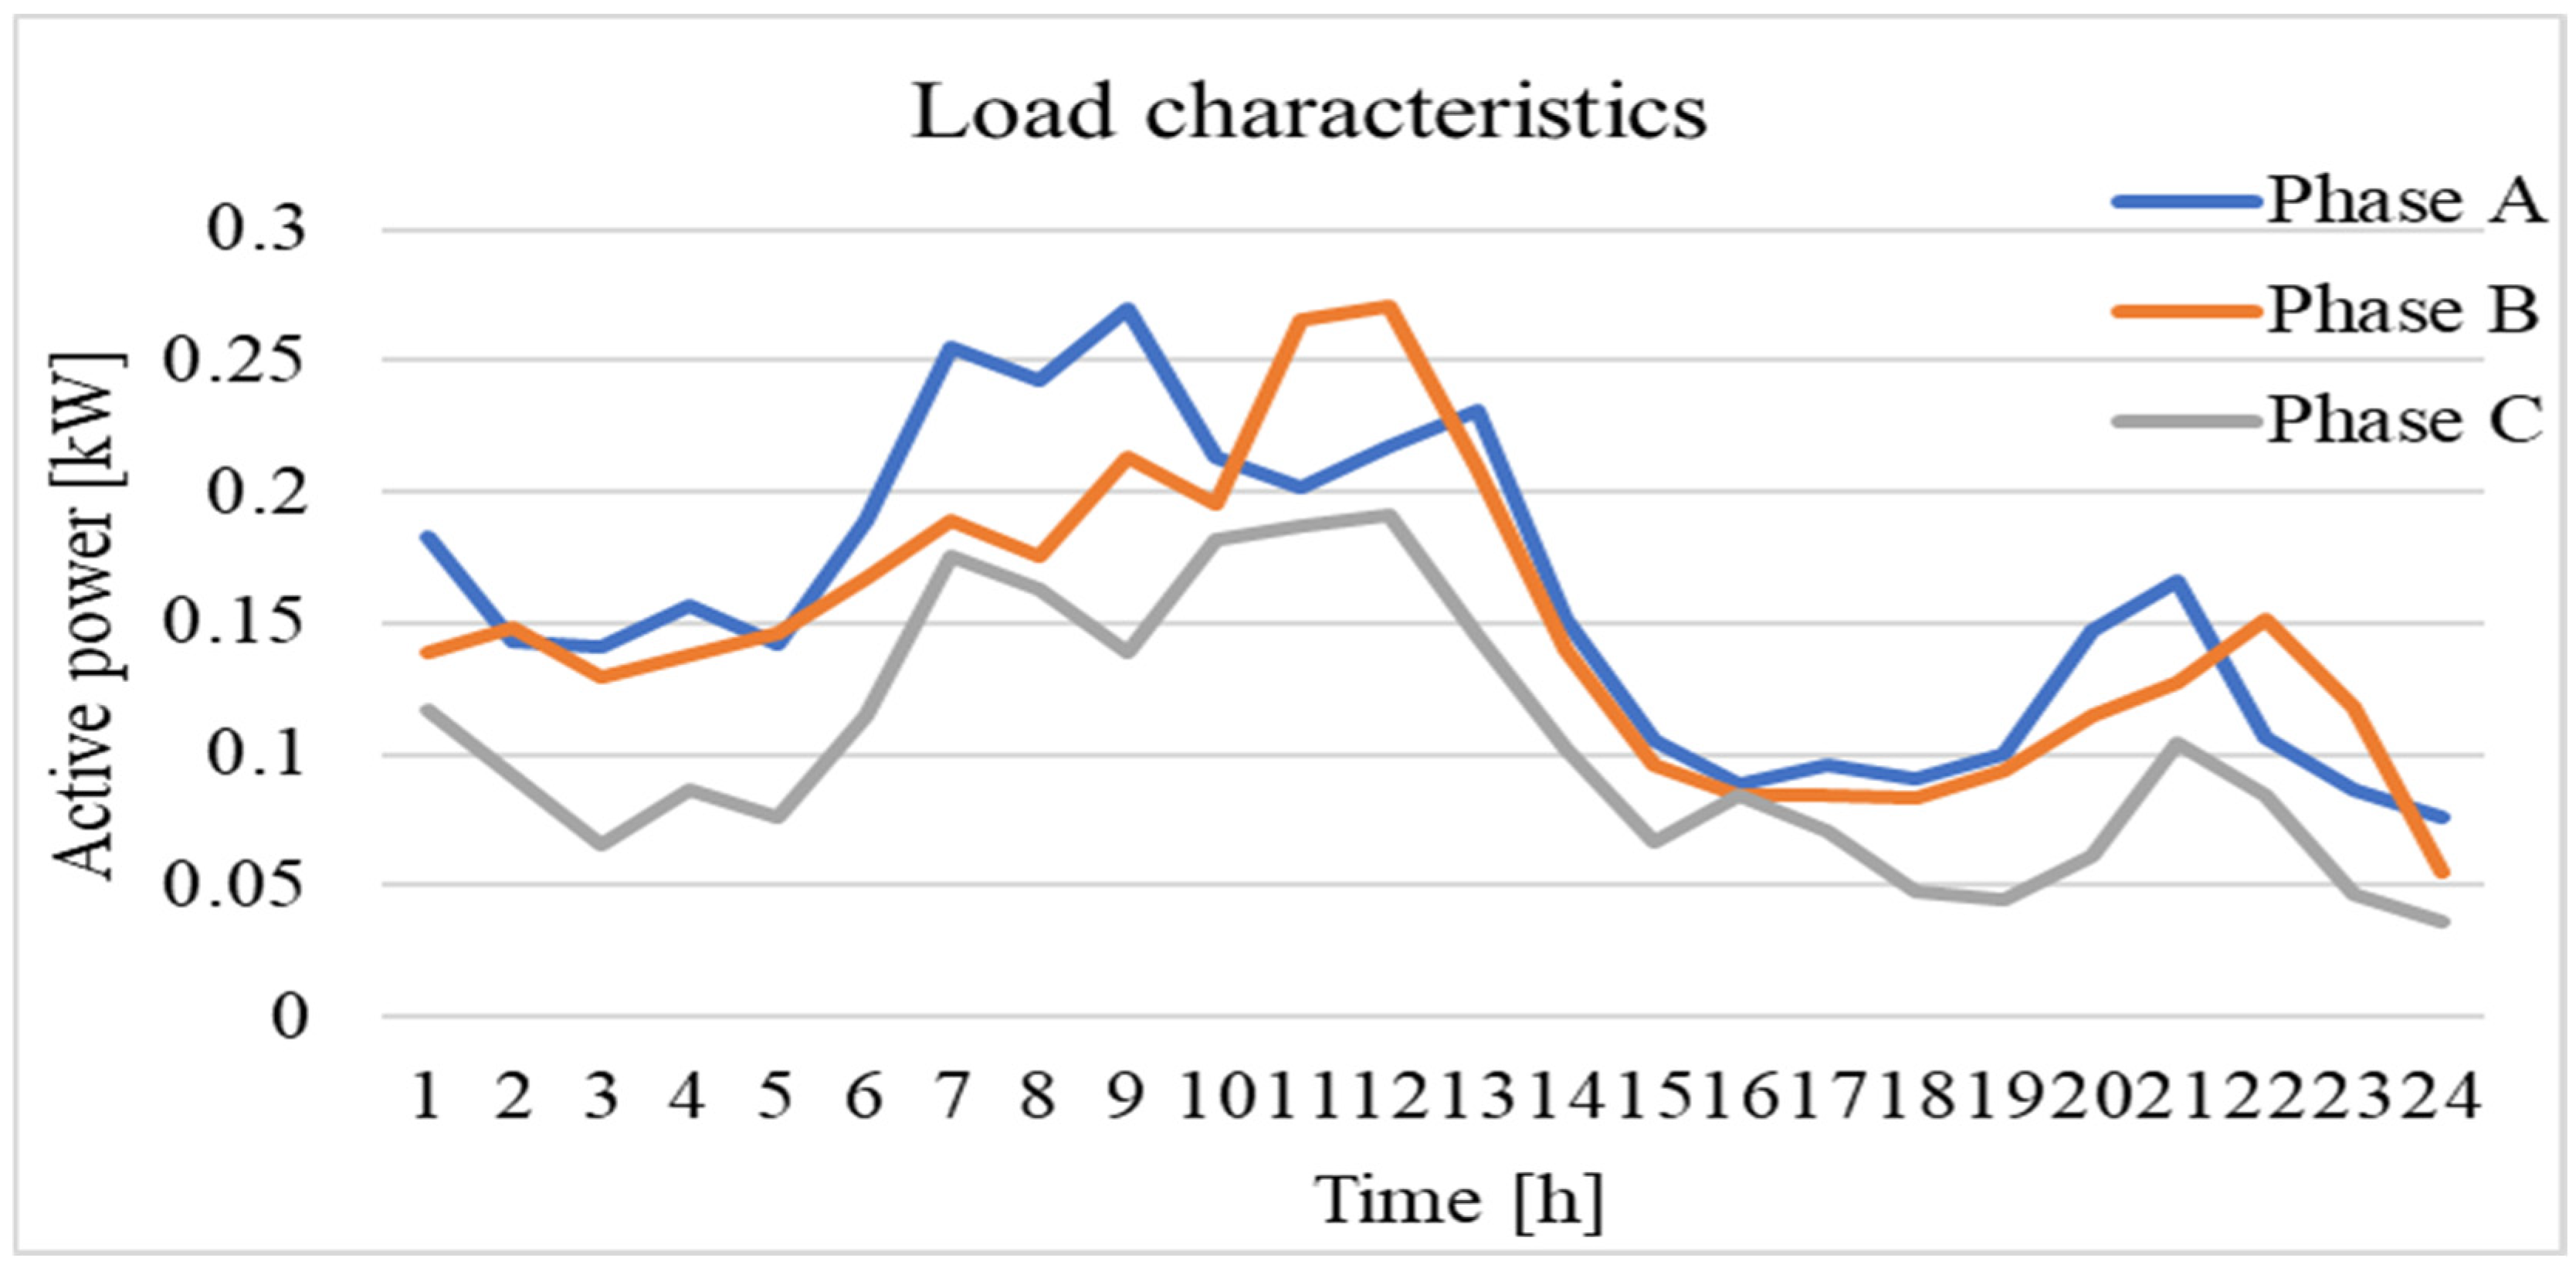
The test grid was modeled with 90 households evenly distributed along the feeder with a three-phase unbalanced load and a peak power of each household of approximately 0.8 kW. The feeder was connected to the distribution grid via a 10/0.4 kV transformer with 0.63 MVA apparent power. The load characteristics were obtained by measurement for a normal working day and are shown in Figure 4.
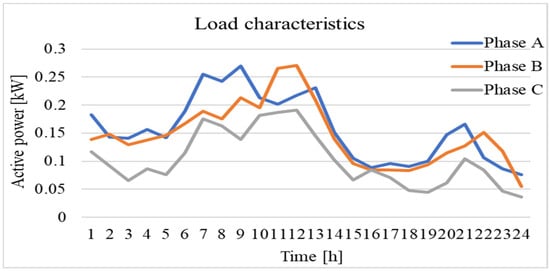
Figure 4.
Load characteristics.
Five scenarios were analyzed for different shares of EV chargers and their output power during a 24 h period. In Scenario 1, the voltage profile and energy exchange were calculated for a feeder without EV chargers. This scenario was also used as base scenario for comparison. In Scenario 2, an unbalanced single-phased charger with 3.7 kW was implemented with a share of 50% EVs. The same share of balanced three-phase EV chargers was implemented in Scenario 3. In Scenario 4, the grid was loaded with maximum number of EV chargers. Single-phase 3.7 kW chargers were used in this scenario. In the last scenario, the maximum number of three-phase EV chargers (11 kW) was integrated on a feeder. For all scenarios, the voltage profiles for the end user are shown, as well as the energy exchange. In Scenarios 4 and 5, the number and power of chargers was defined in order to keep the voltages and thermal limitations of the cables within the allowed range. The assumption was that the cars had an empty battery and that charging was conducted over a certain period in all scenarios.
5.1. Scenario 1—Base Scenario
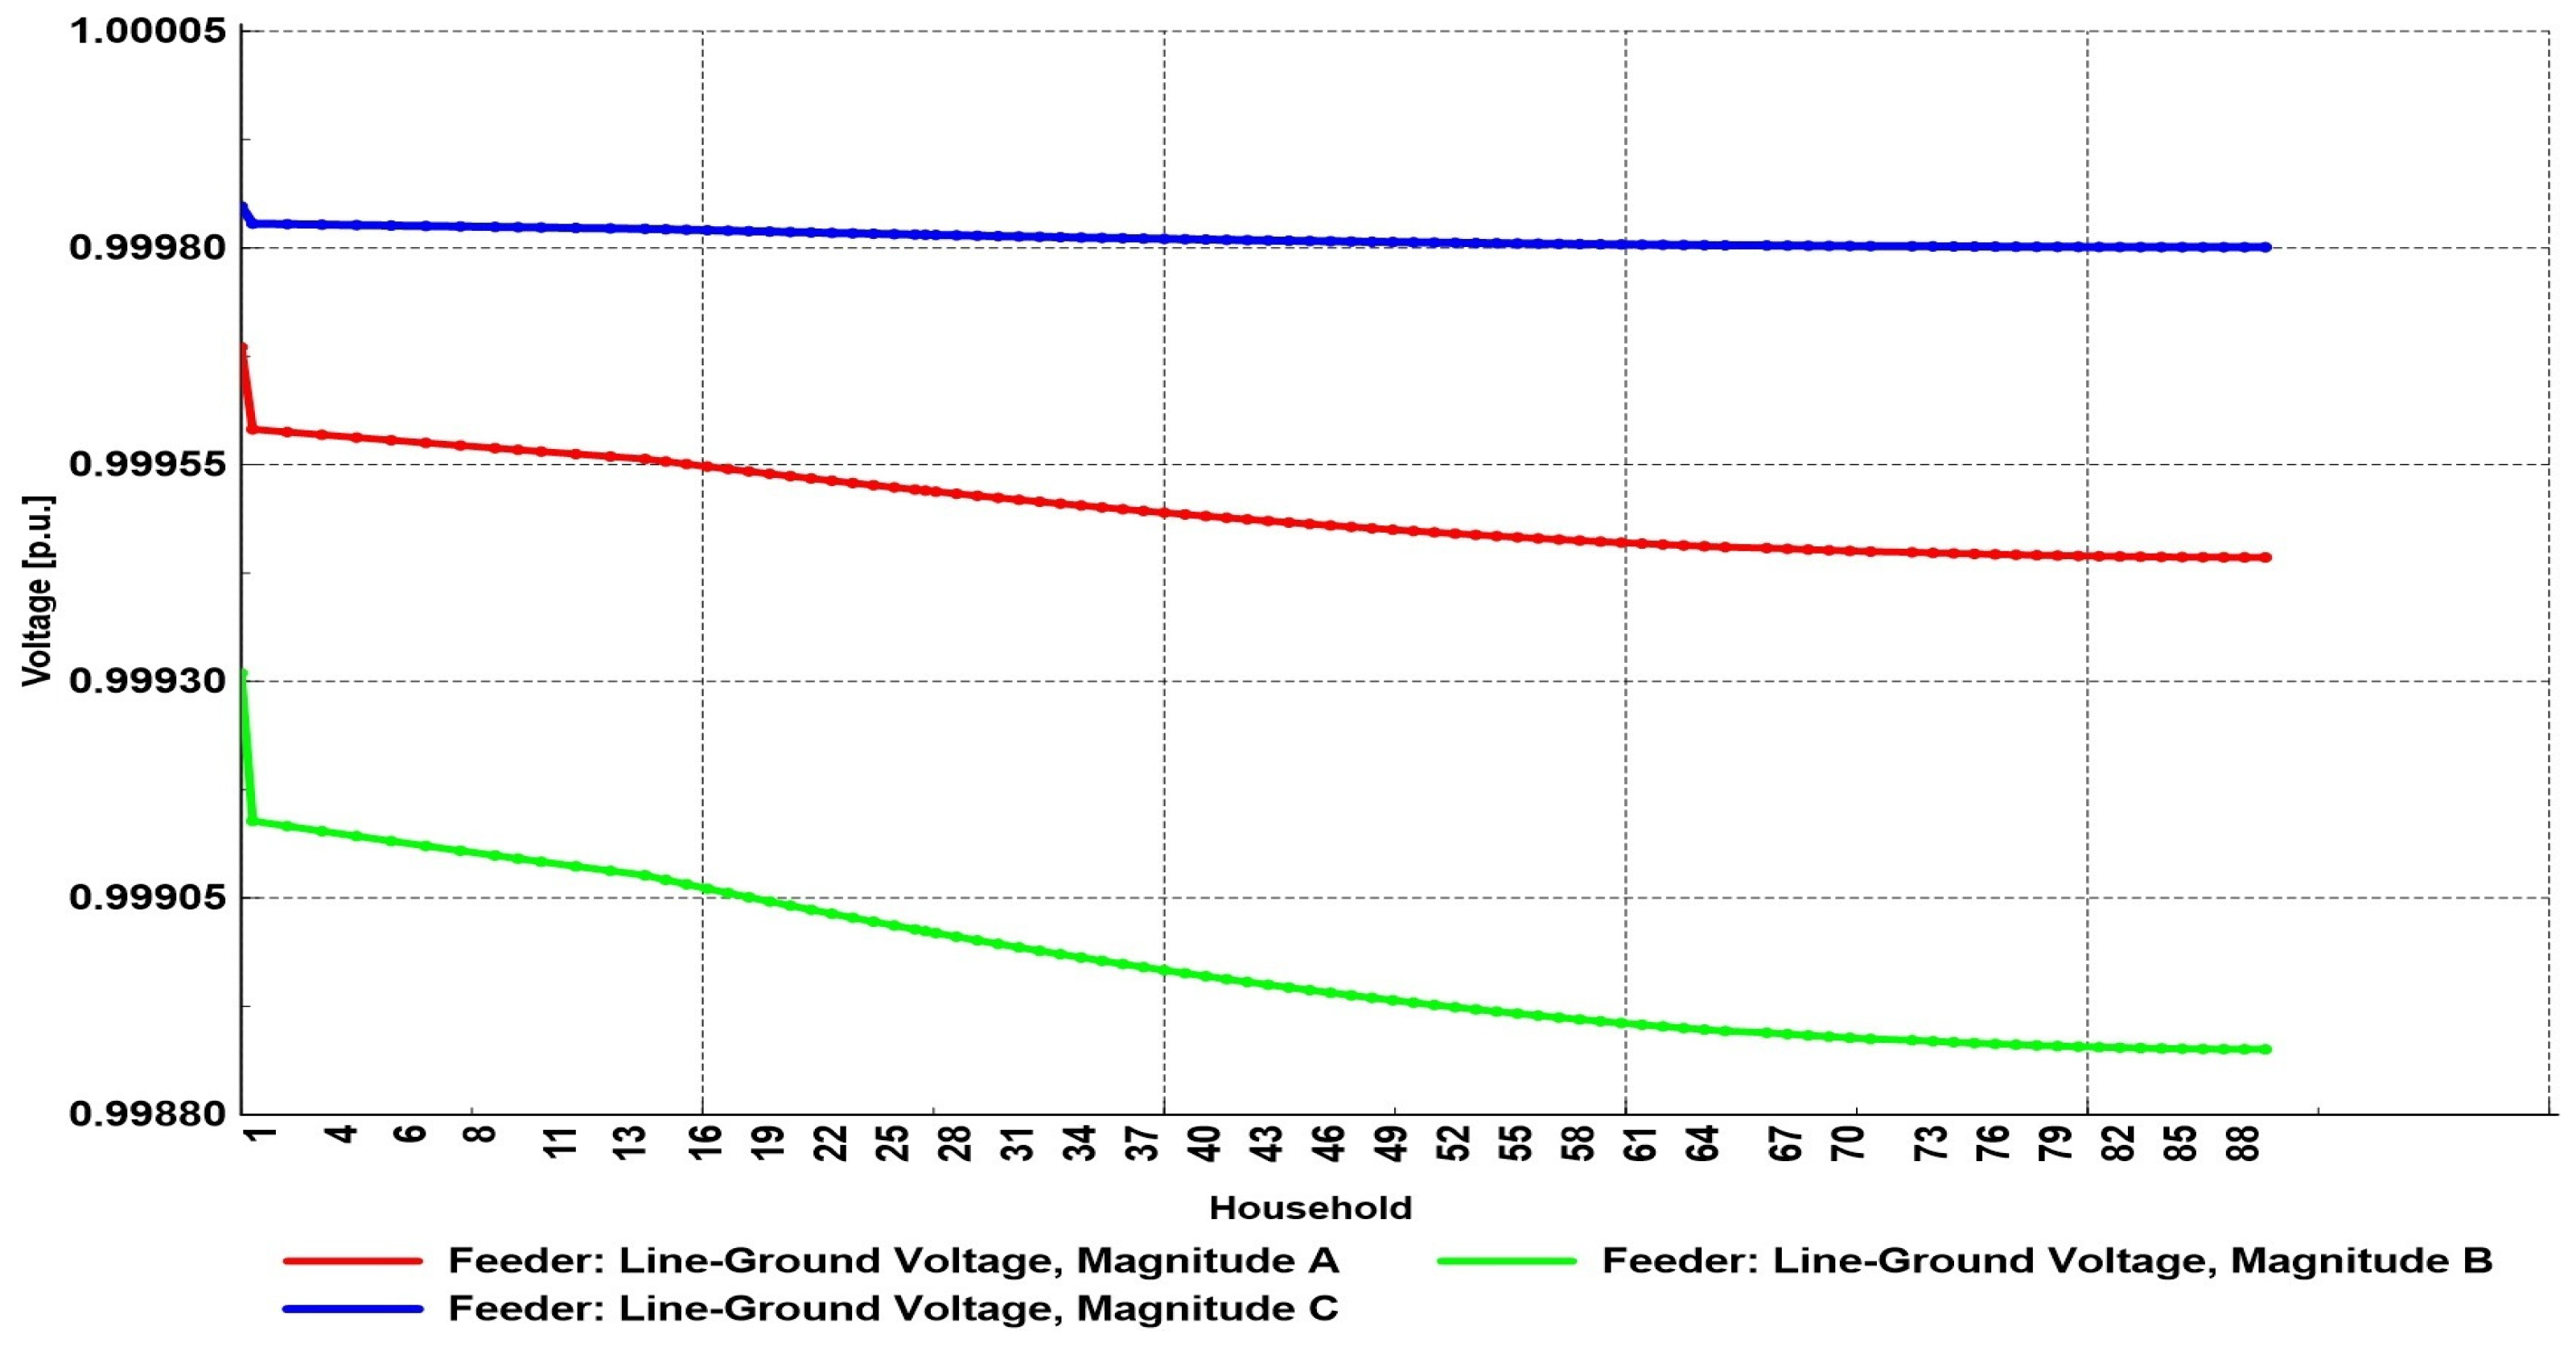
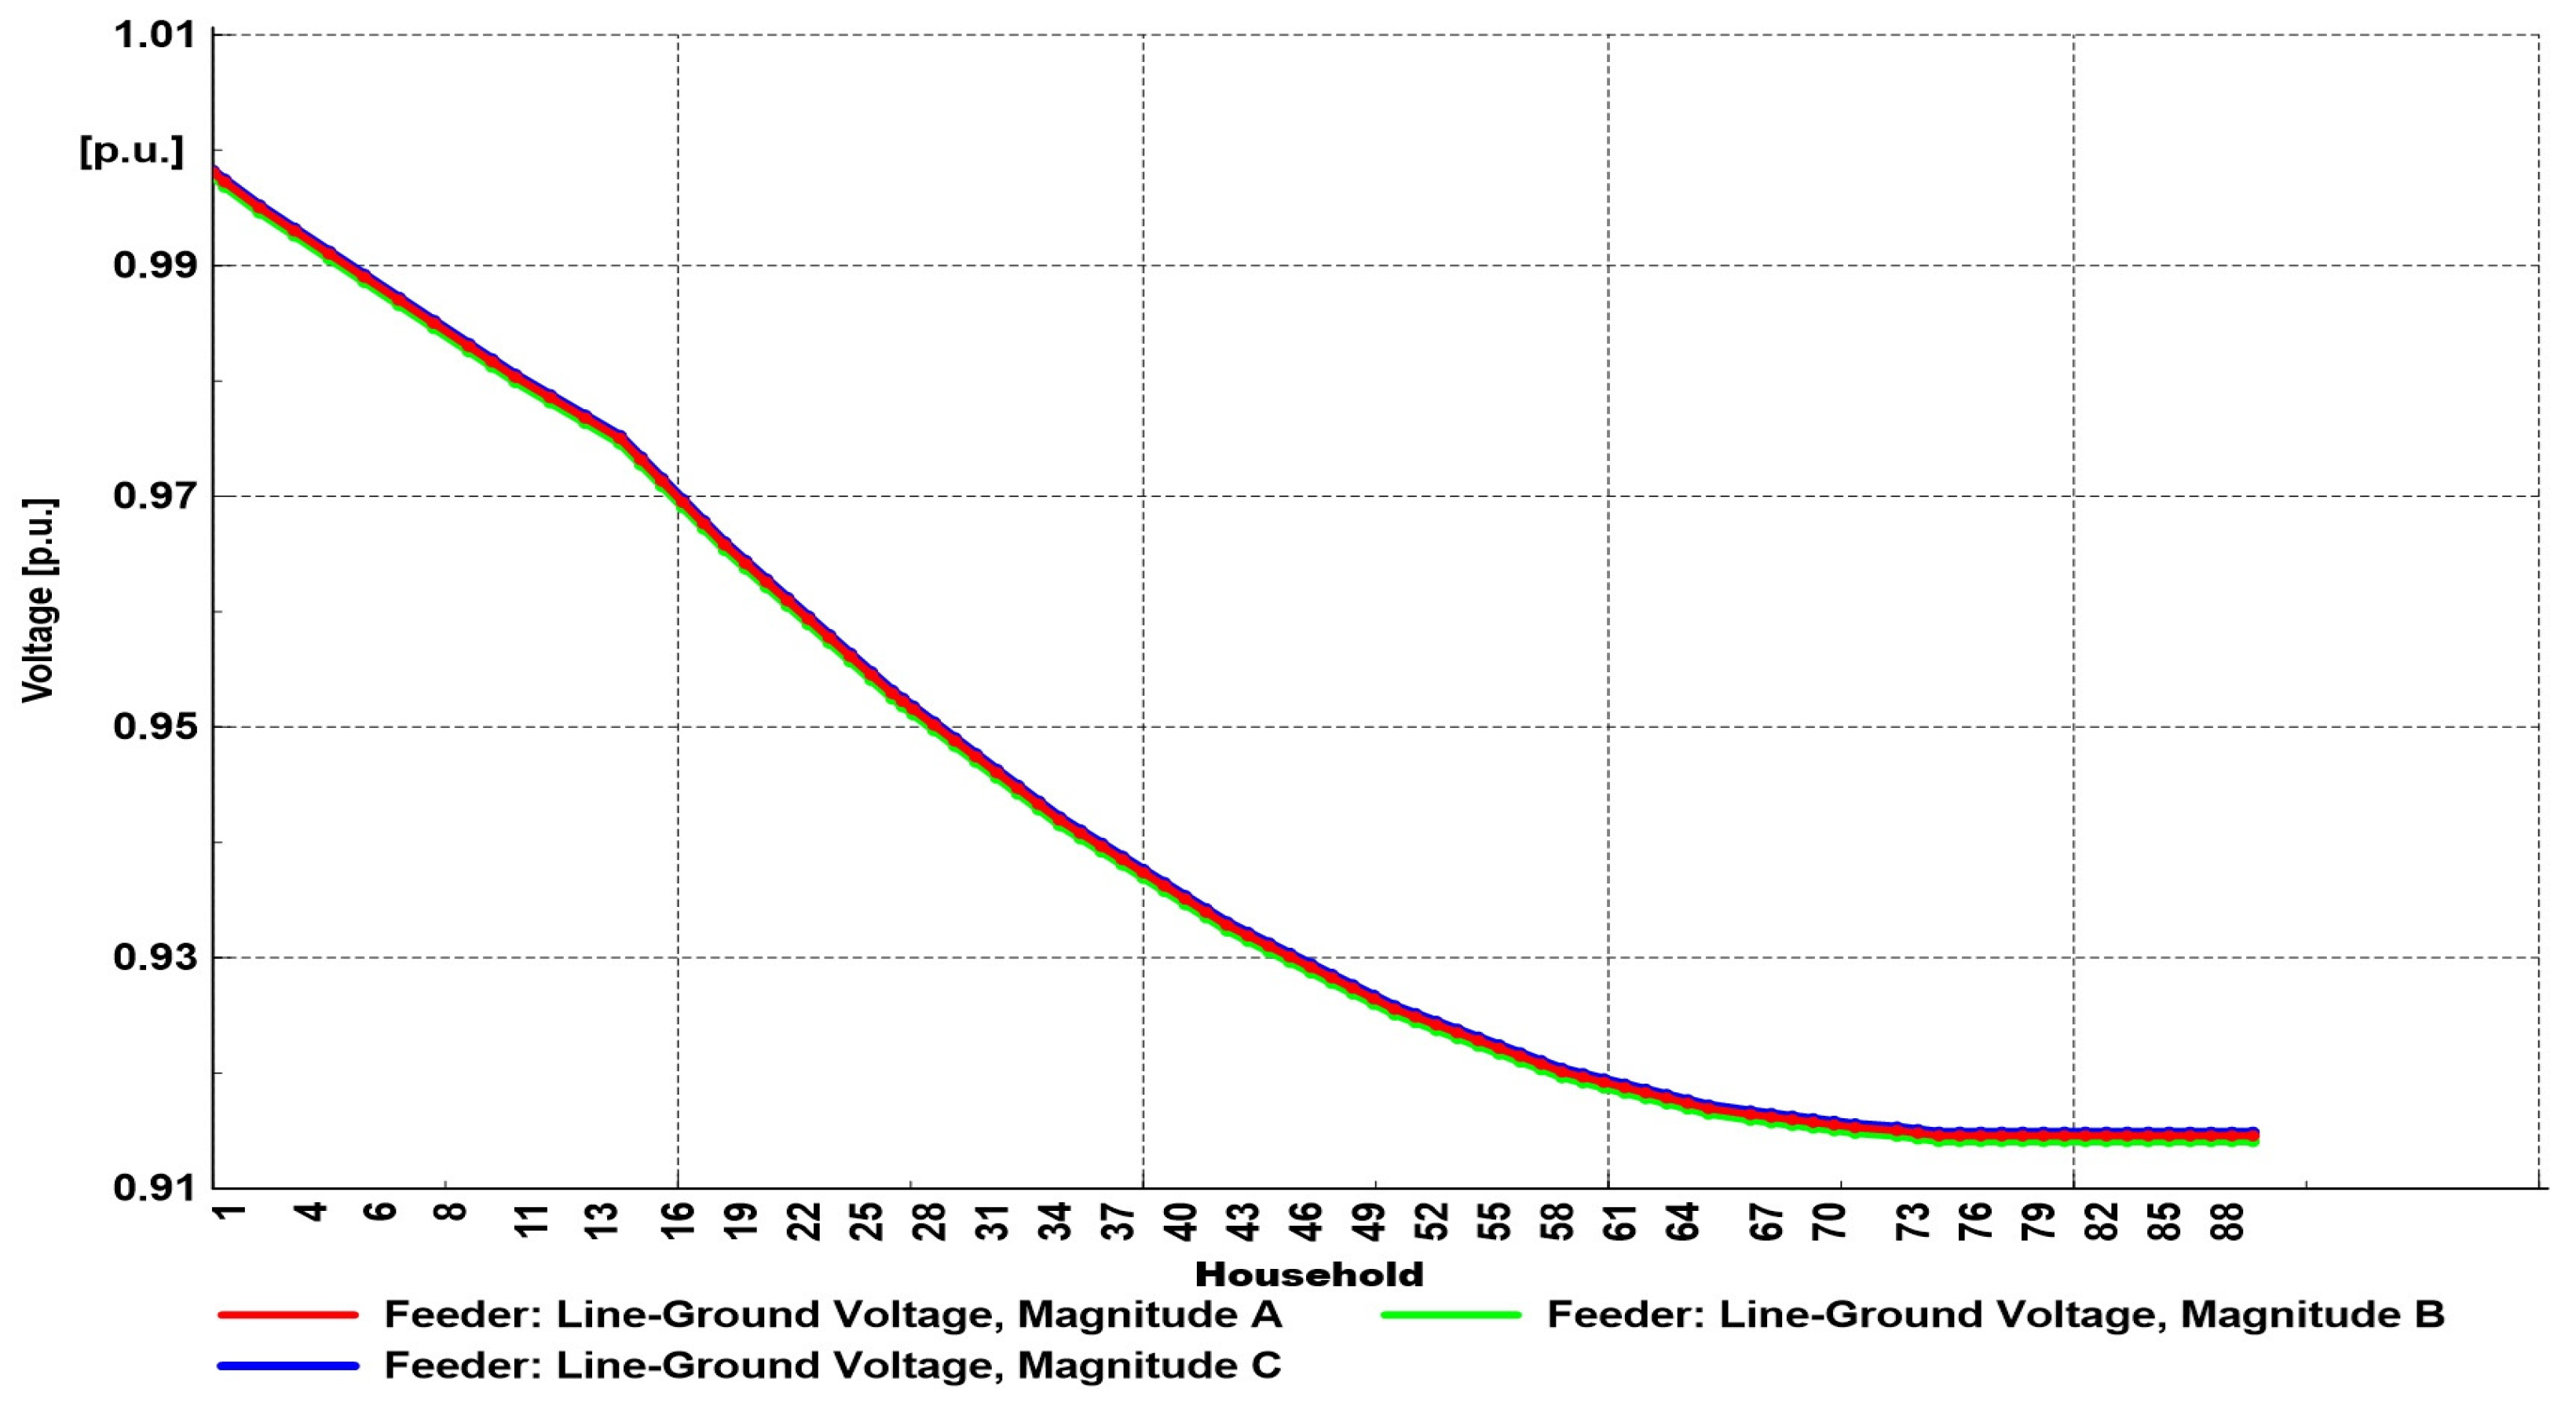
The key feature of the basic scenario was a completely passive load of the feeder, characterized by a large number of consumers with an unbalanced low load characteristic. It was assumed that there were no integrated chargers, and therefore all the energy was used to cover the consumption and losses along the cable. Figure 5 shows the voltage profile along the feeder (for all 90 loads), and it is shown that there was an unbalance, which was almost insignificant, since the voltage between phases was around 0.001 p.u.
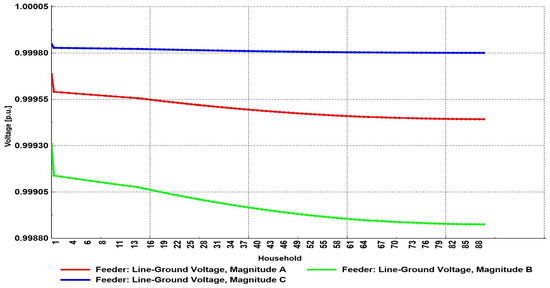
Figure 5.
Voltage profile for Scenario 1.
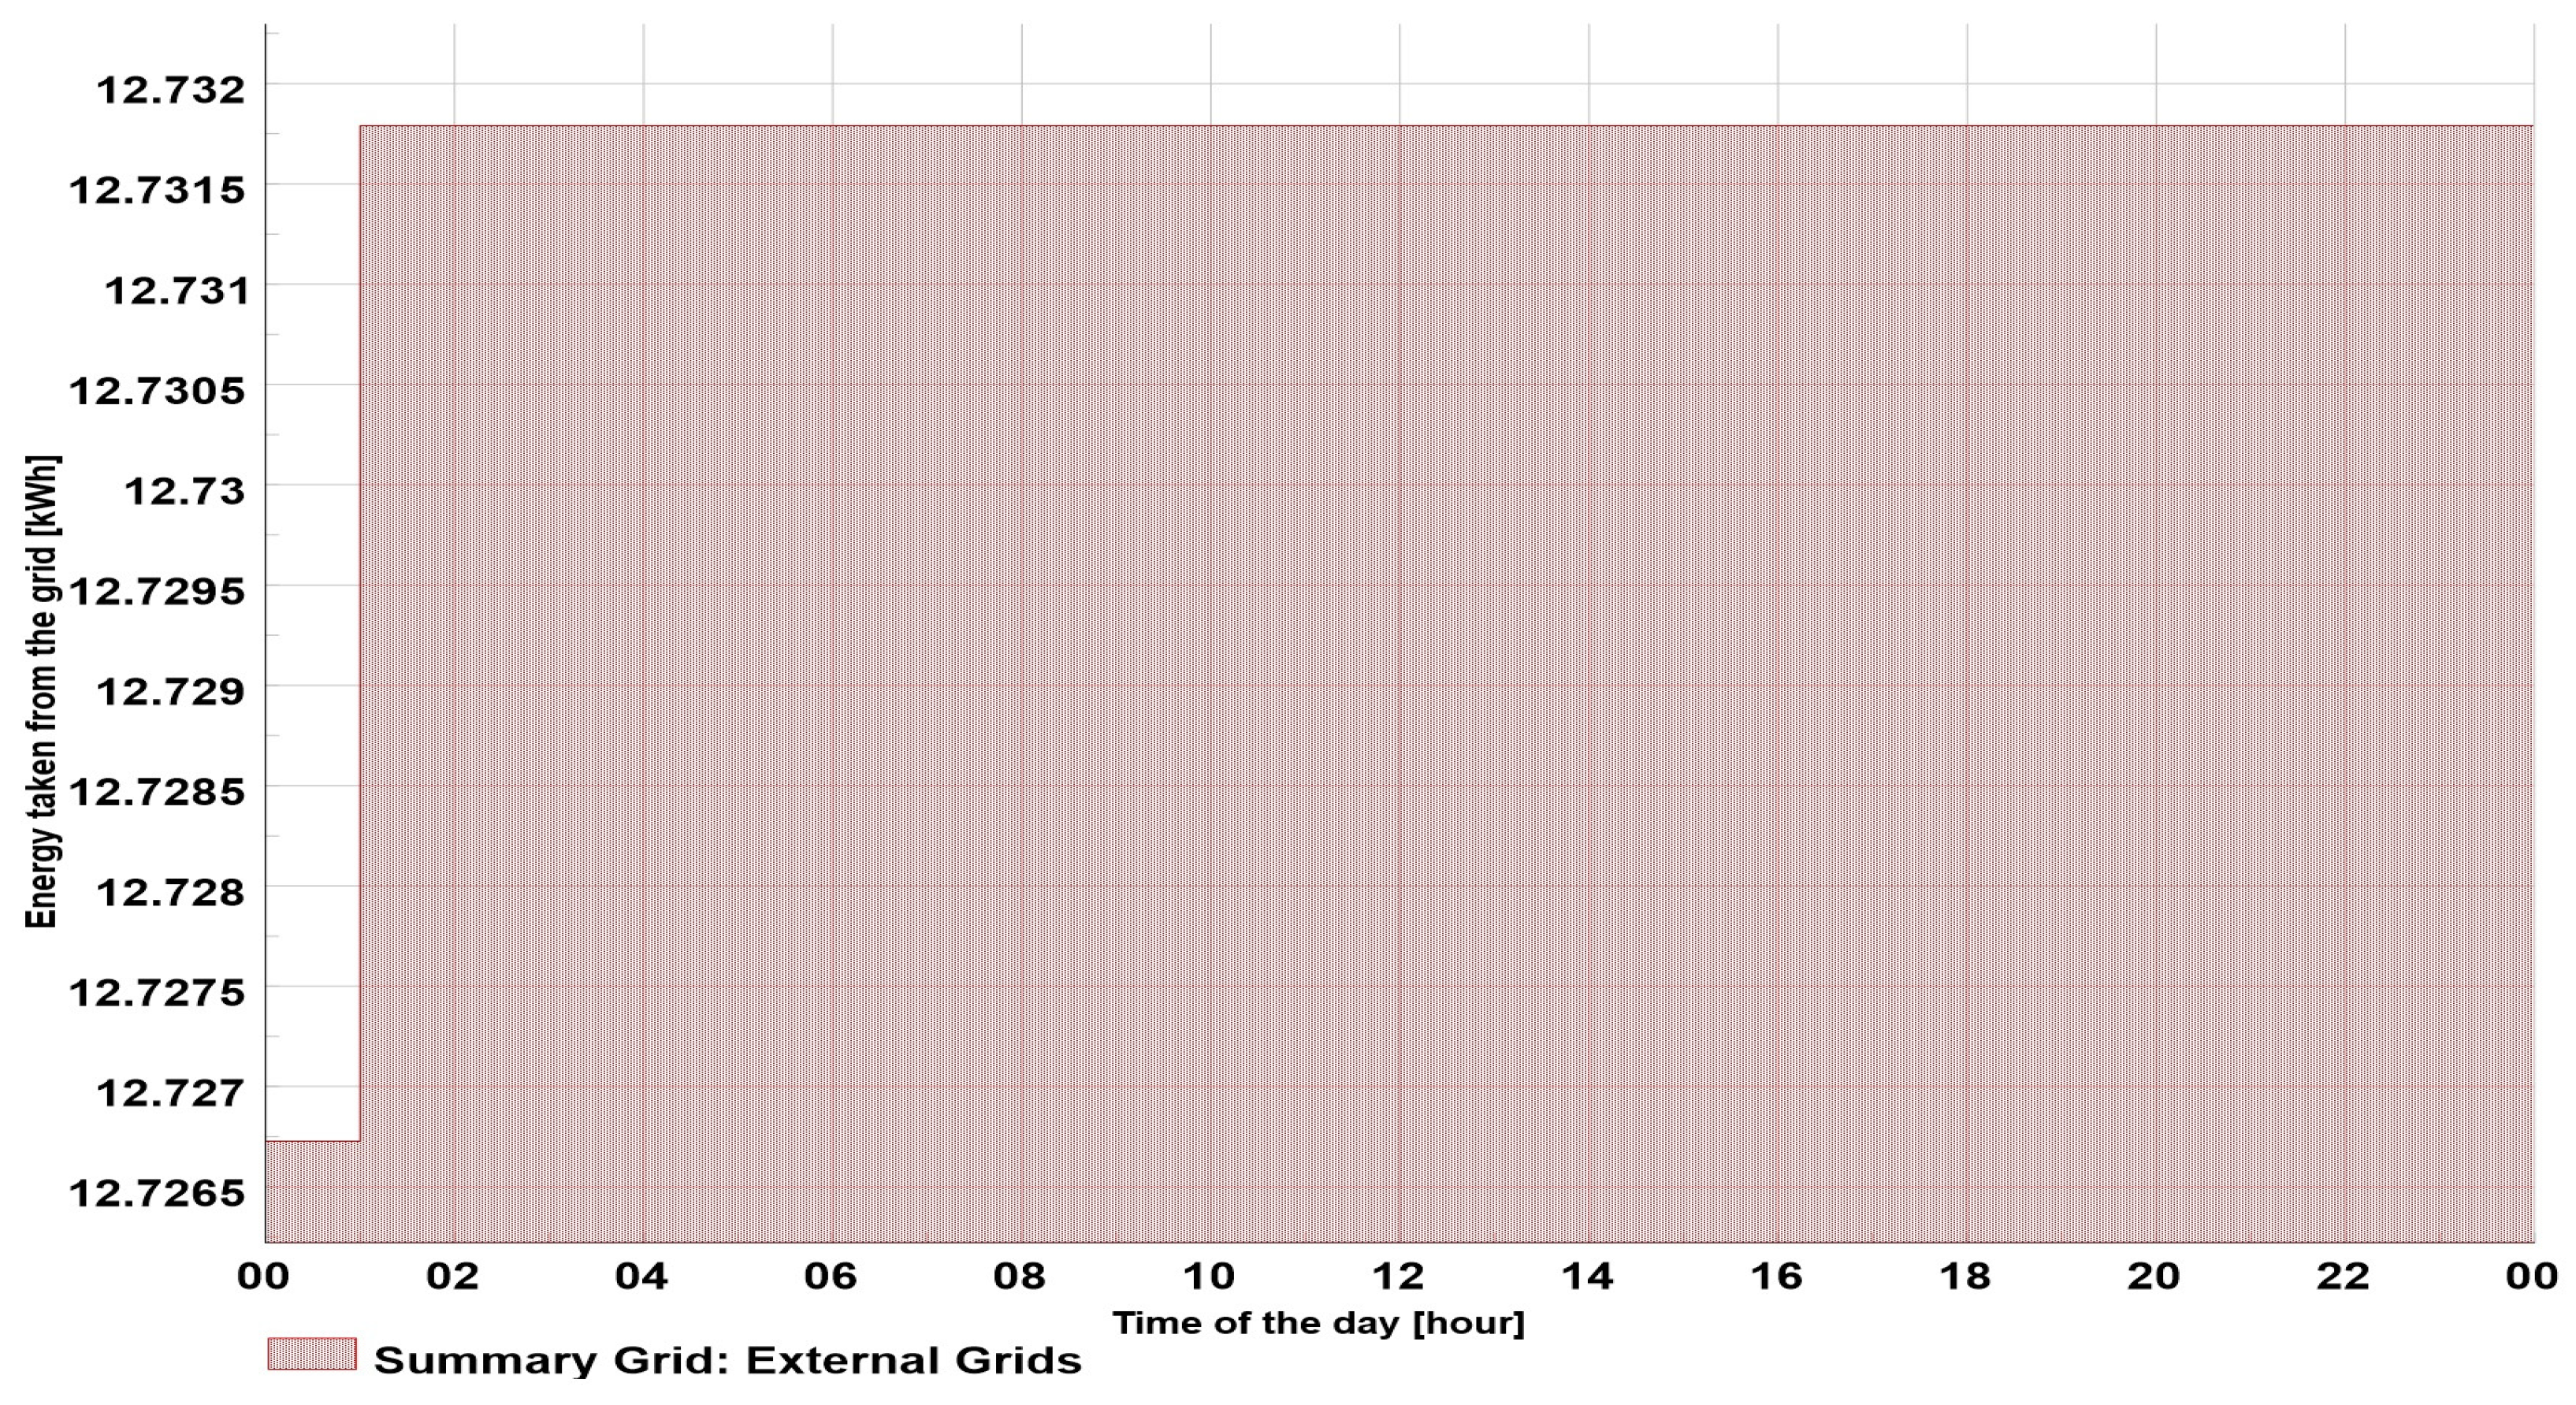
Since all the consumers had a similar load pattern, the load curve and energy exchange during the day were constant (Figure 6). The maximum load was around 12.5 kW, resulting in approximately 300 kWh of energy taken from the grid during the 24 h period.
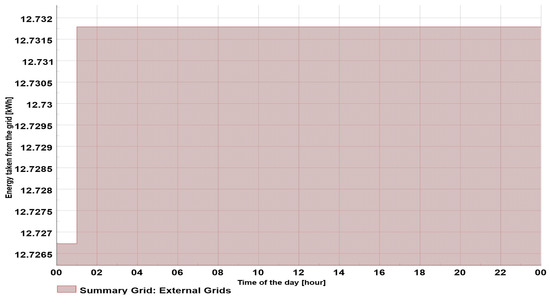
Figure 6.
Energy exchange for Scenario 1.
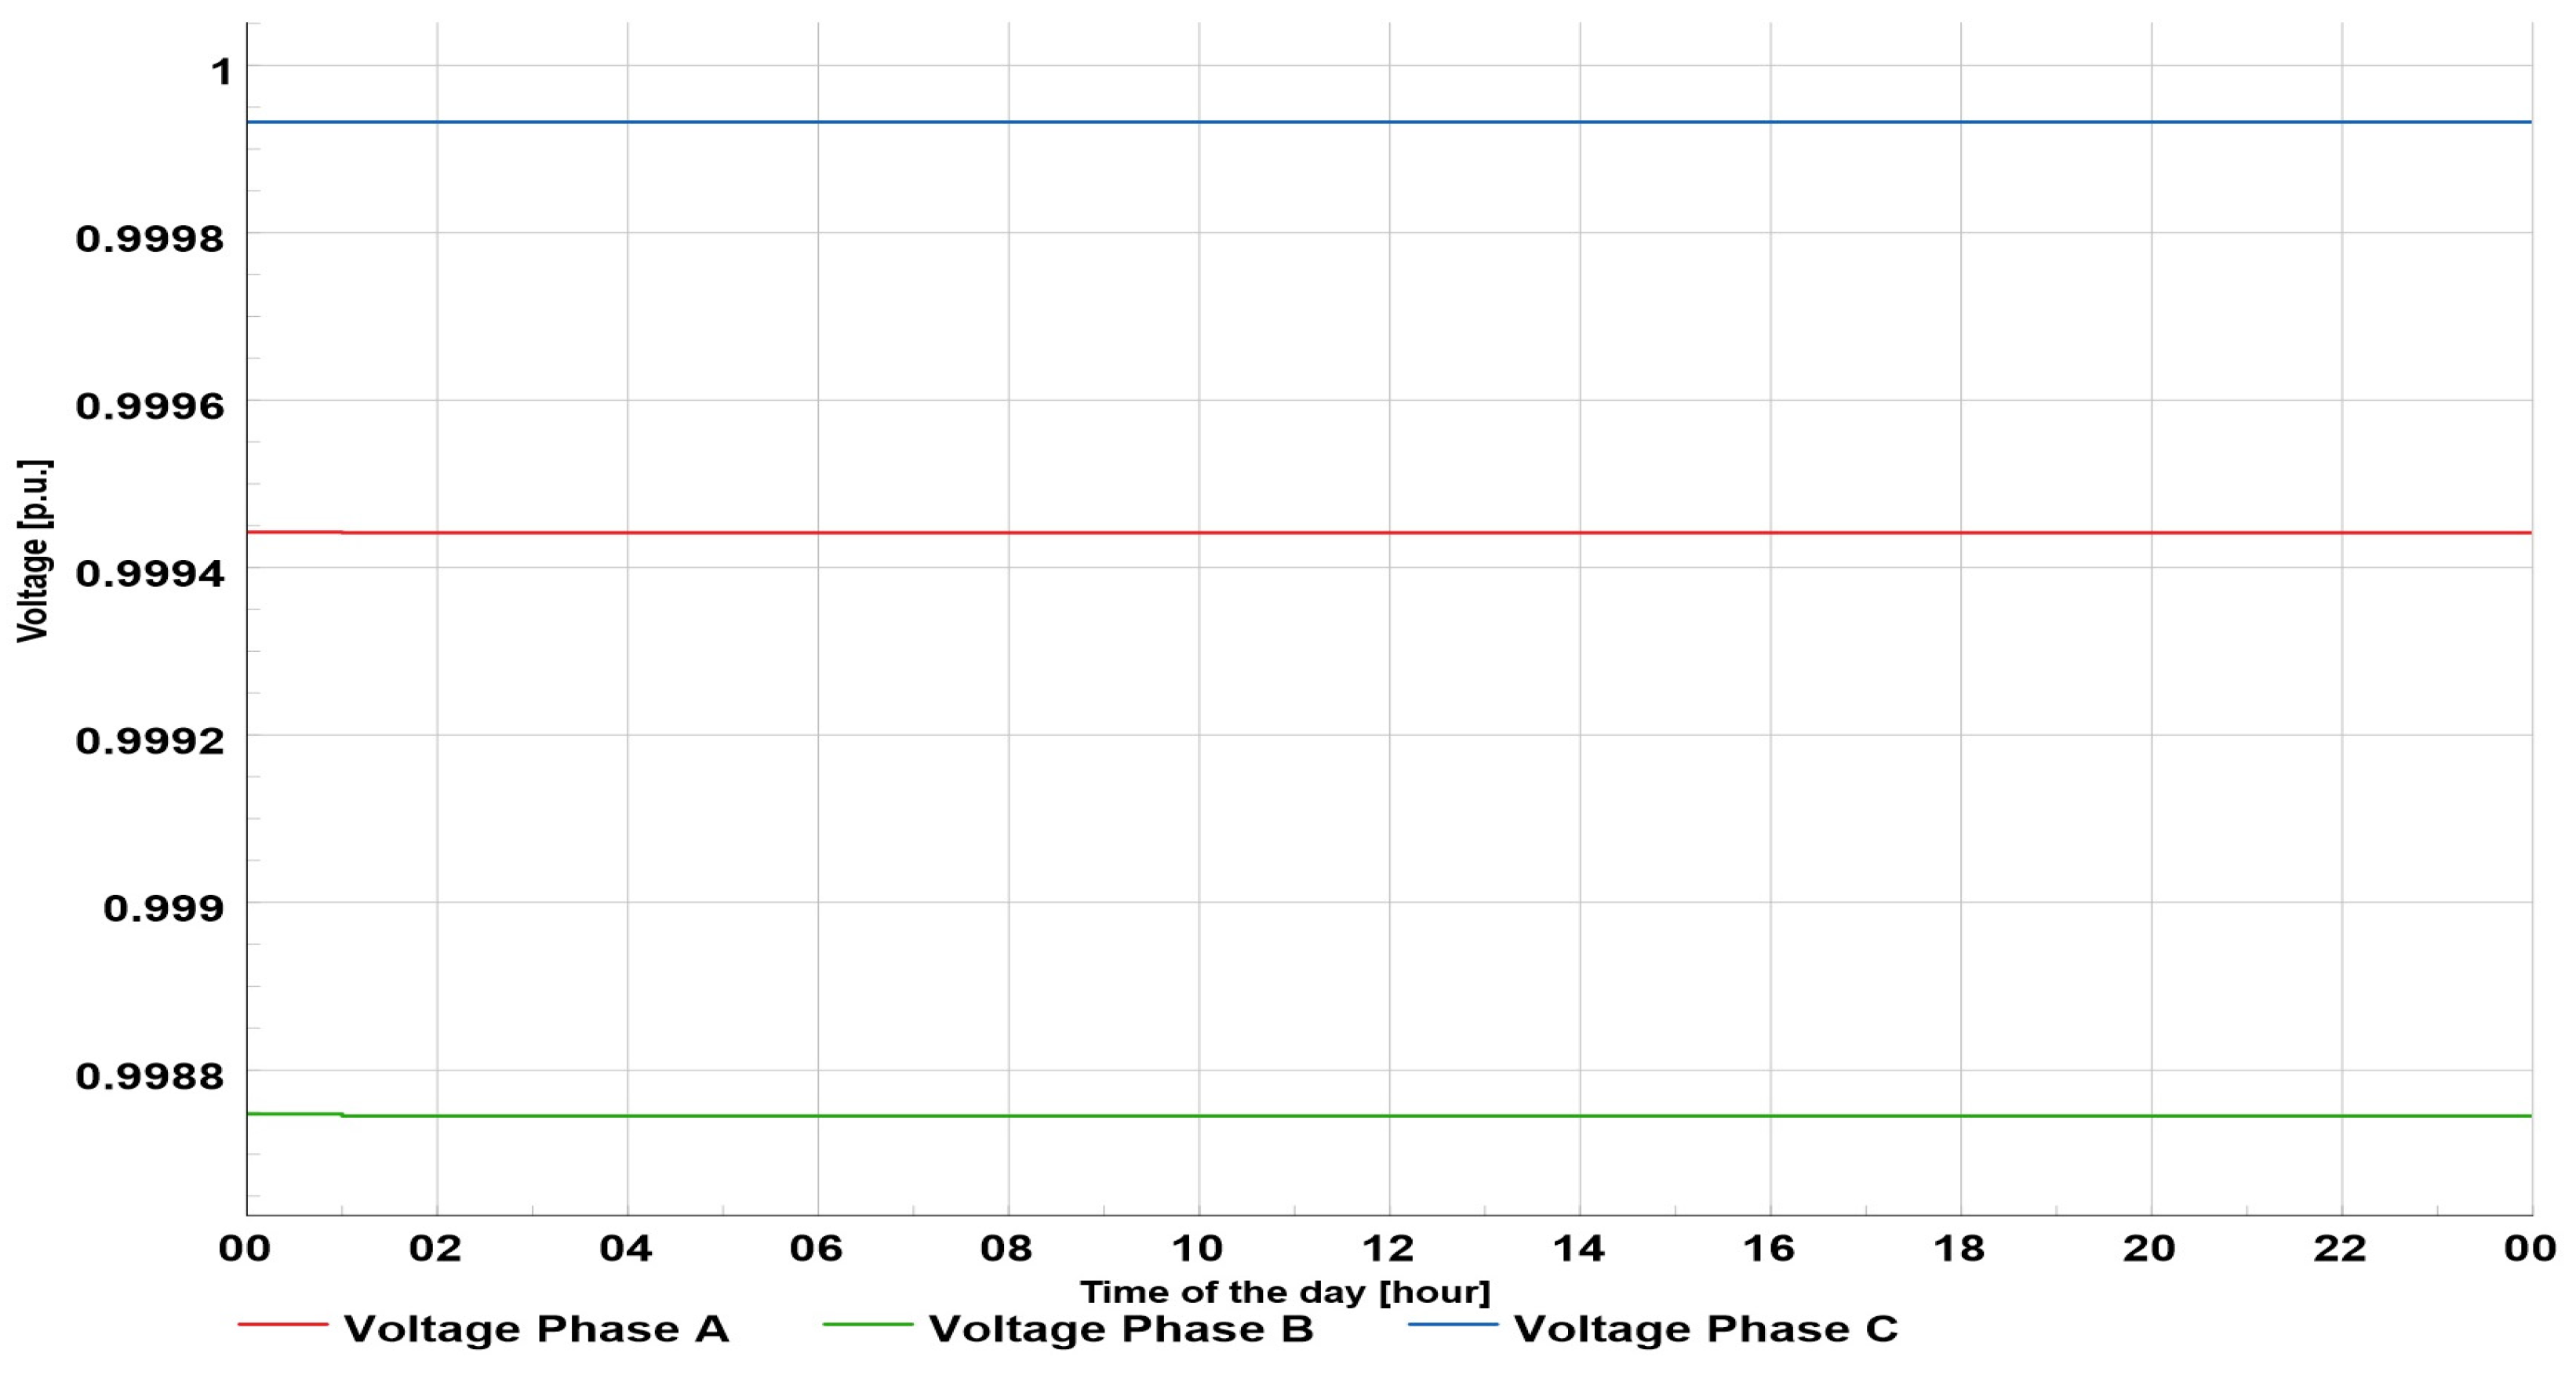
Figure 7 shows the voltage profile for the end consumer located at bus 90. During the whole day, the voltage remained constant and within the specified limits. A voltage unbalance was present but it was within a very narrow range of deviations.
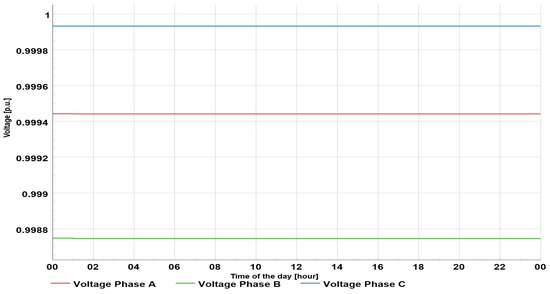
Figure 7.
Voltage profile at bus 90, Scenario 1.
5.2. Scenario 2—50% of Single-Phase EV Chargers
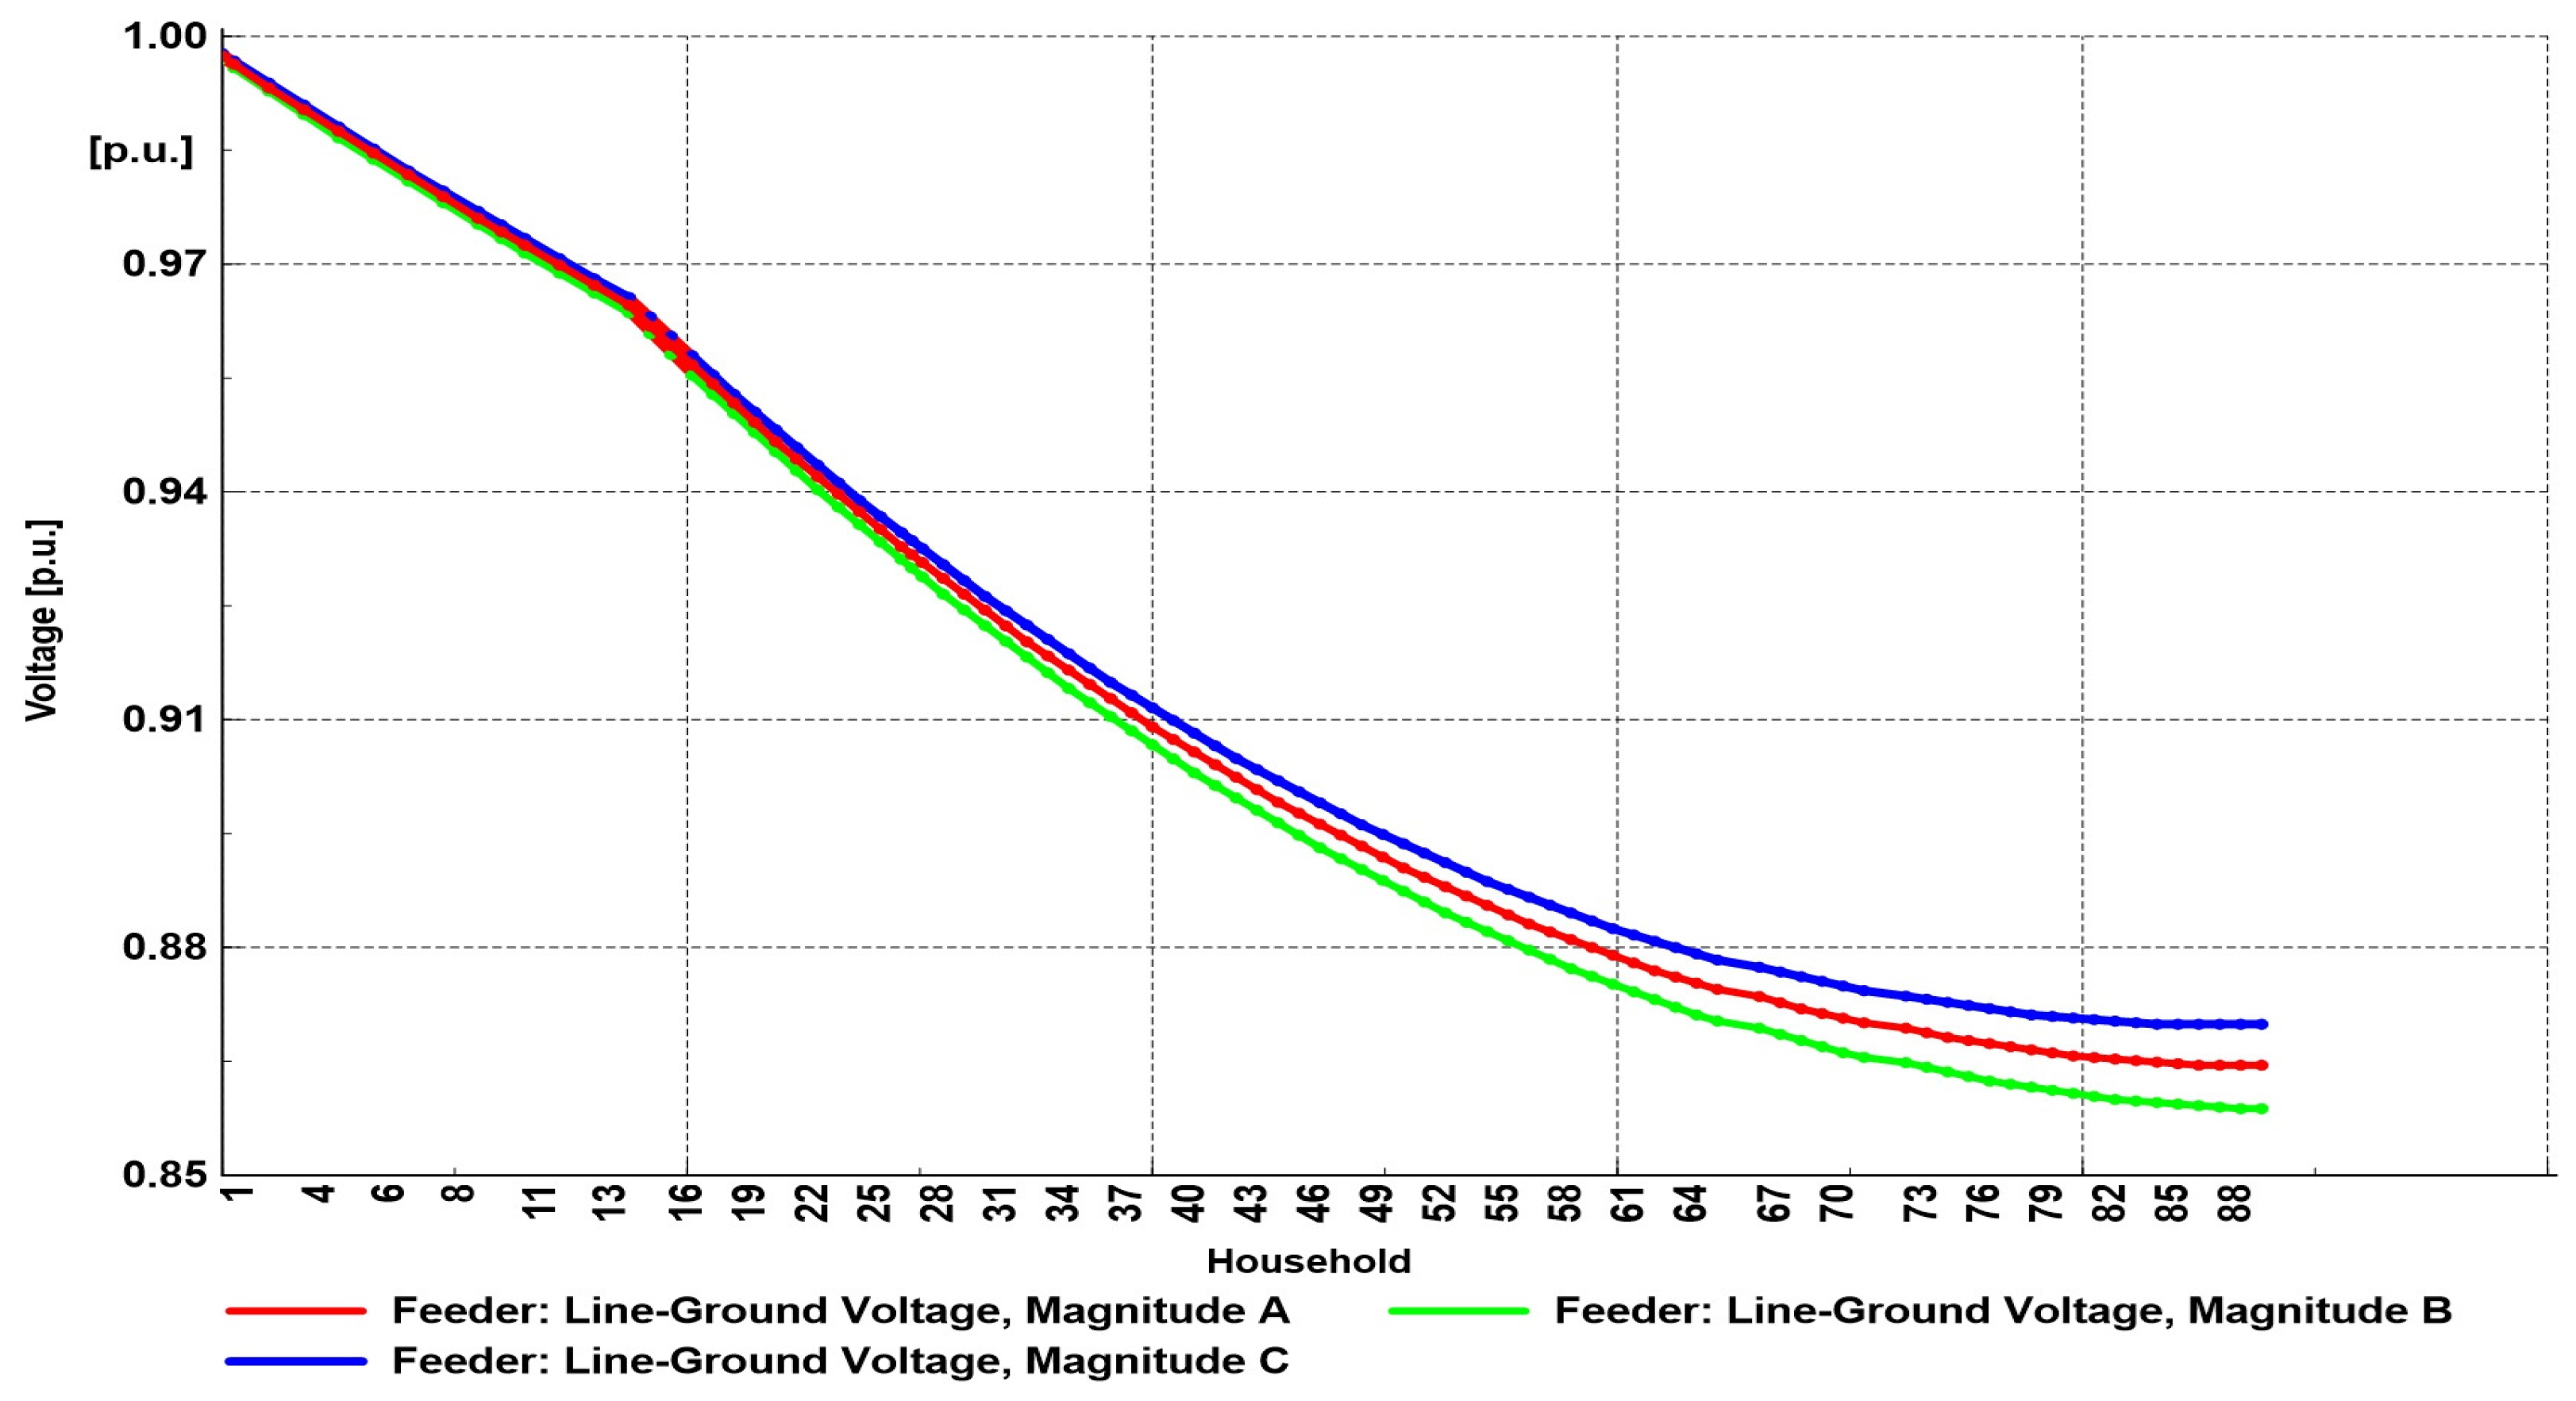
In Scenario 2, single-phase EV chargers with an active power of 3.7 kW were integrated, following the expected increase in the number of EVs. We assumed that every second household would have an electric car and charge it via a single-phase charger, with 44 chargers implemented along the feeder. The chargers were evenly distributed on all three phases, and the resulting voltage profile is shown in Figure 8. As can be seen, towards the end of the feeder, there was an increasing unbalance and a voltage drop. When compared to the base scenario, it was observed that the voltage dropped by almost 0.15 p.u., resulting in voltage that was not within the limit defined by power quality standards. Unbalanced load in the phases could be avoided by proper planning and distribution of the EV chargers, but this was hard to accomplish, since EV charger integration was exclusively determined by the behavior and capabilities of the consumers.
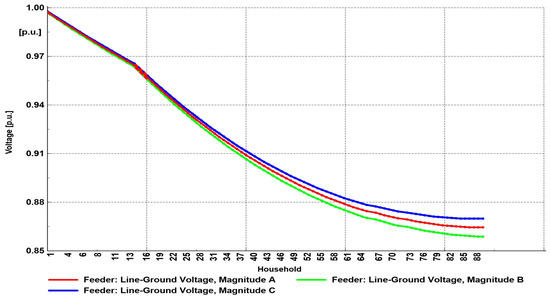
Figure 8.
Voltage profile for Scenario 2.
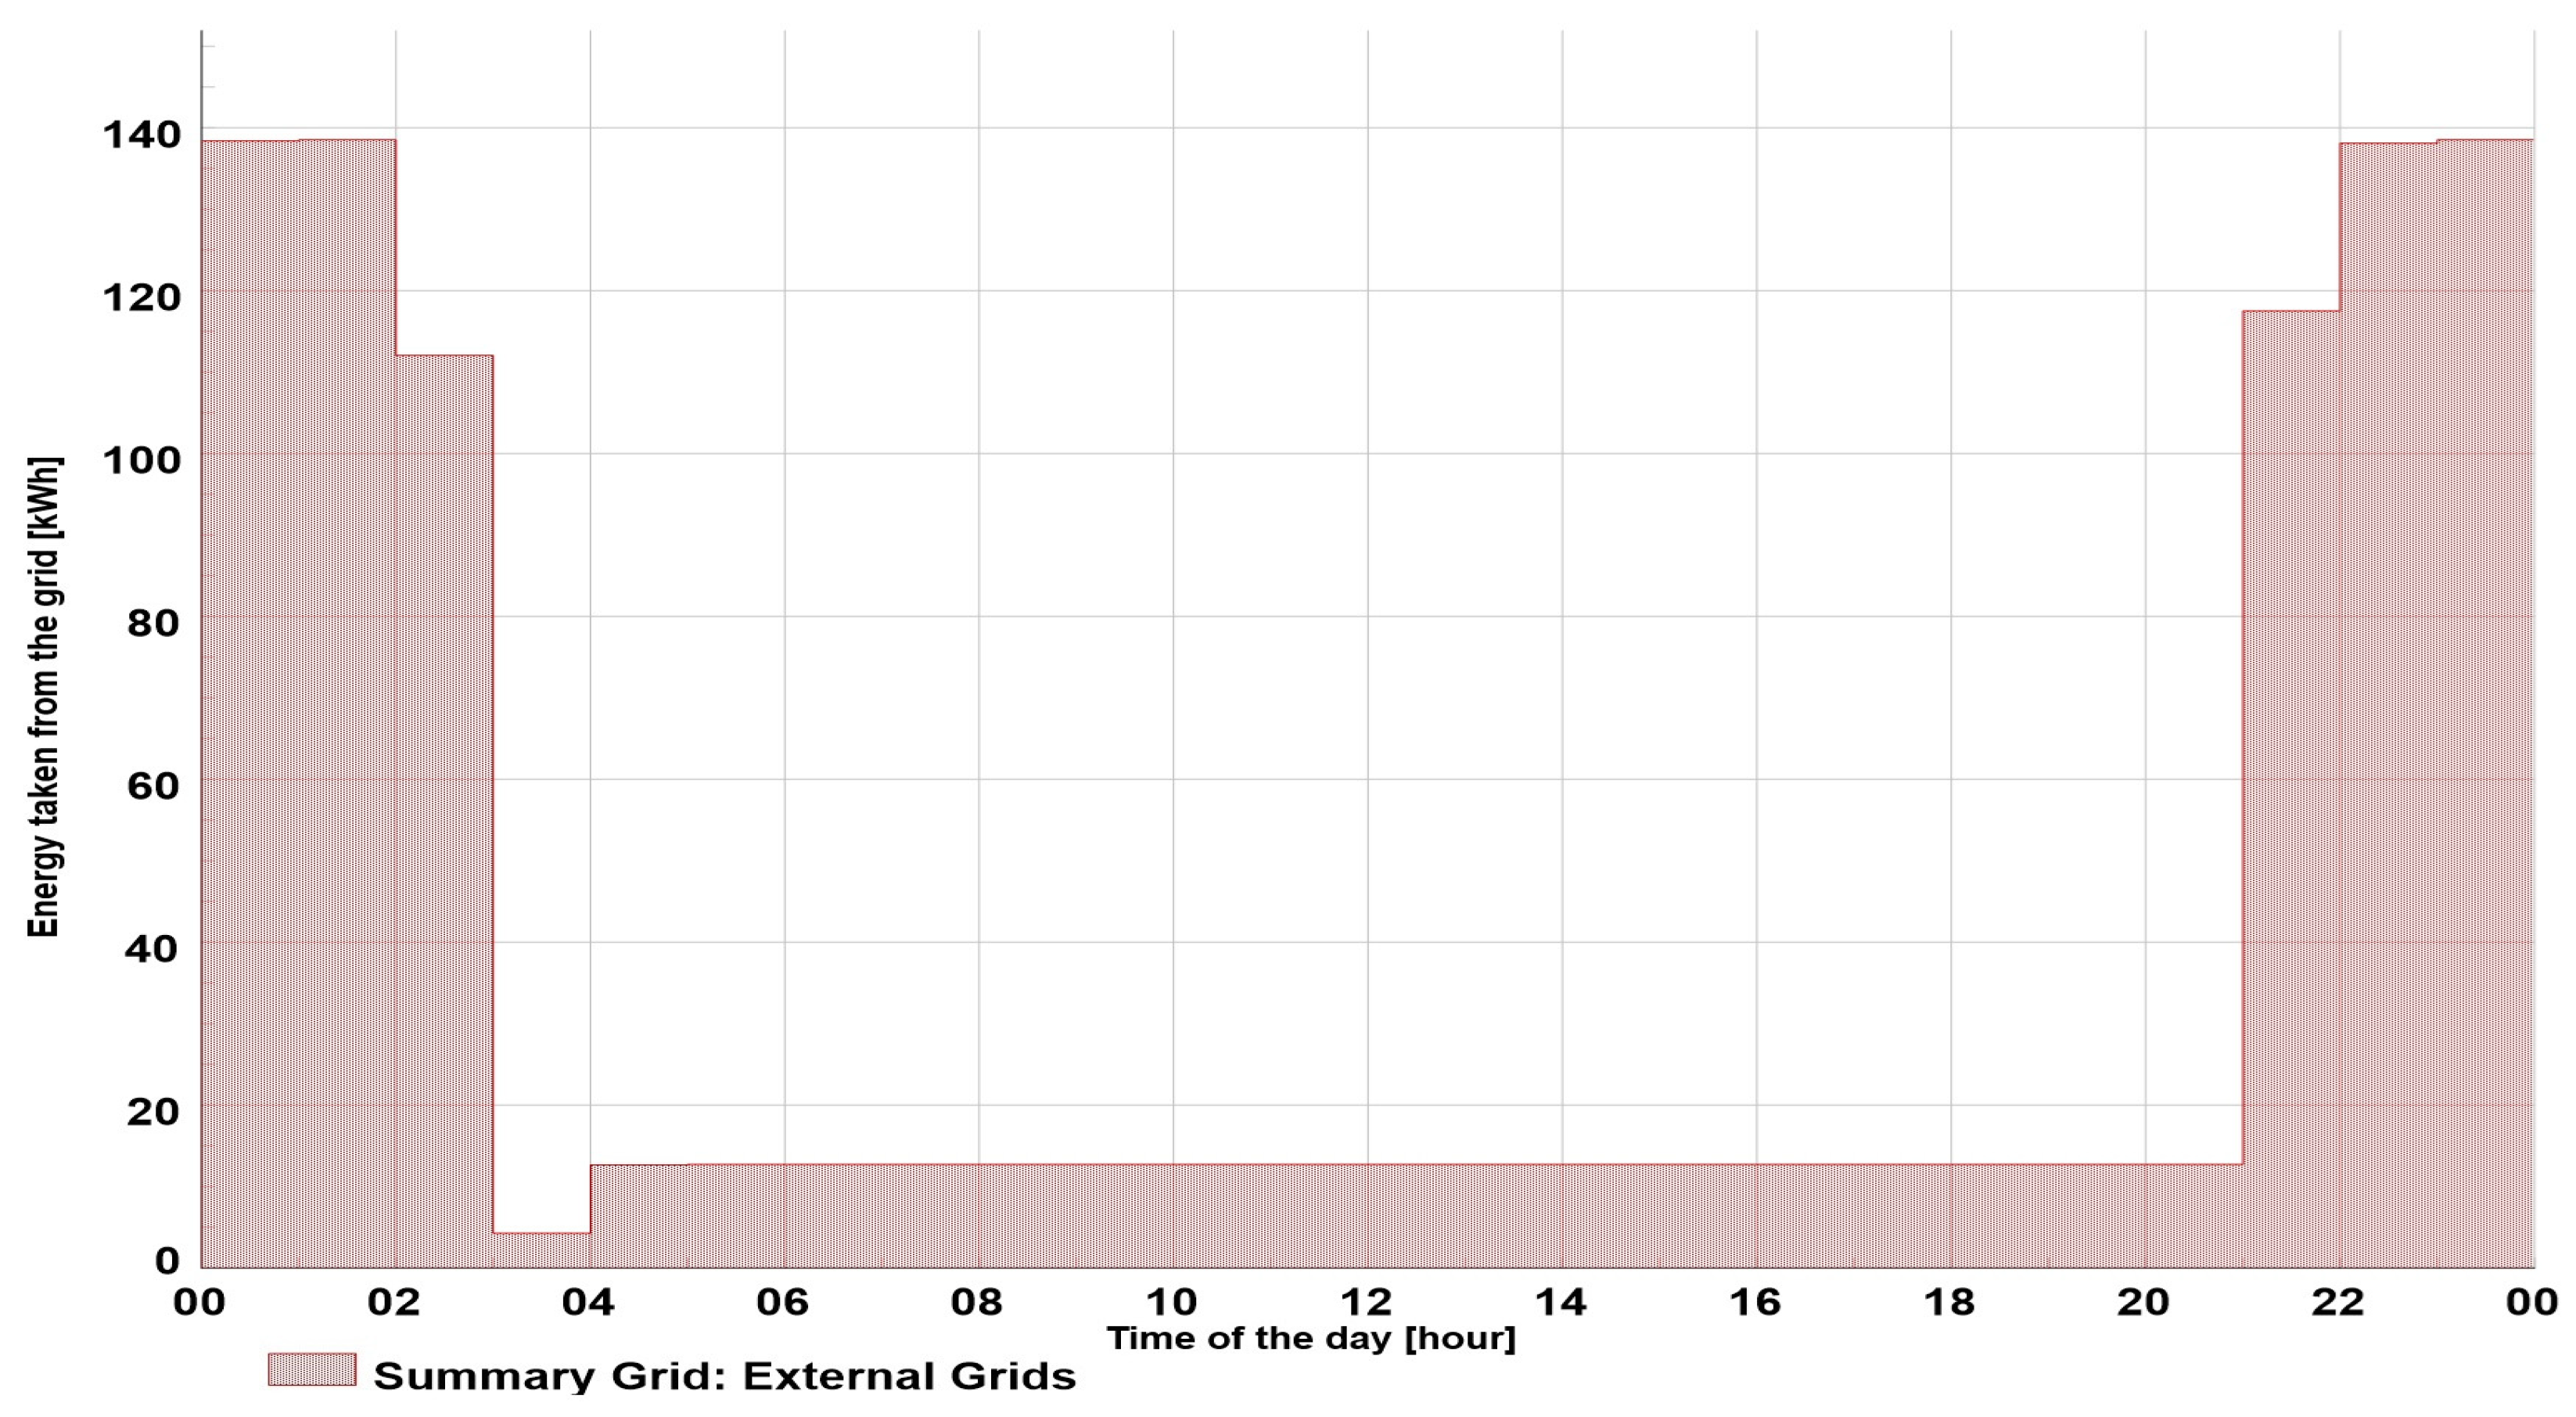
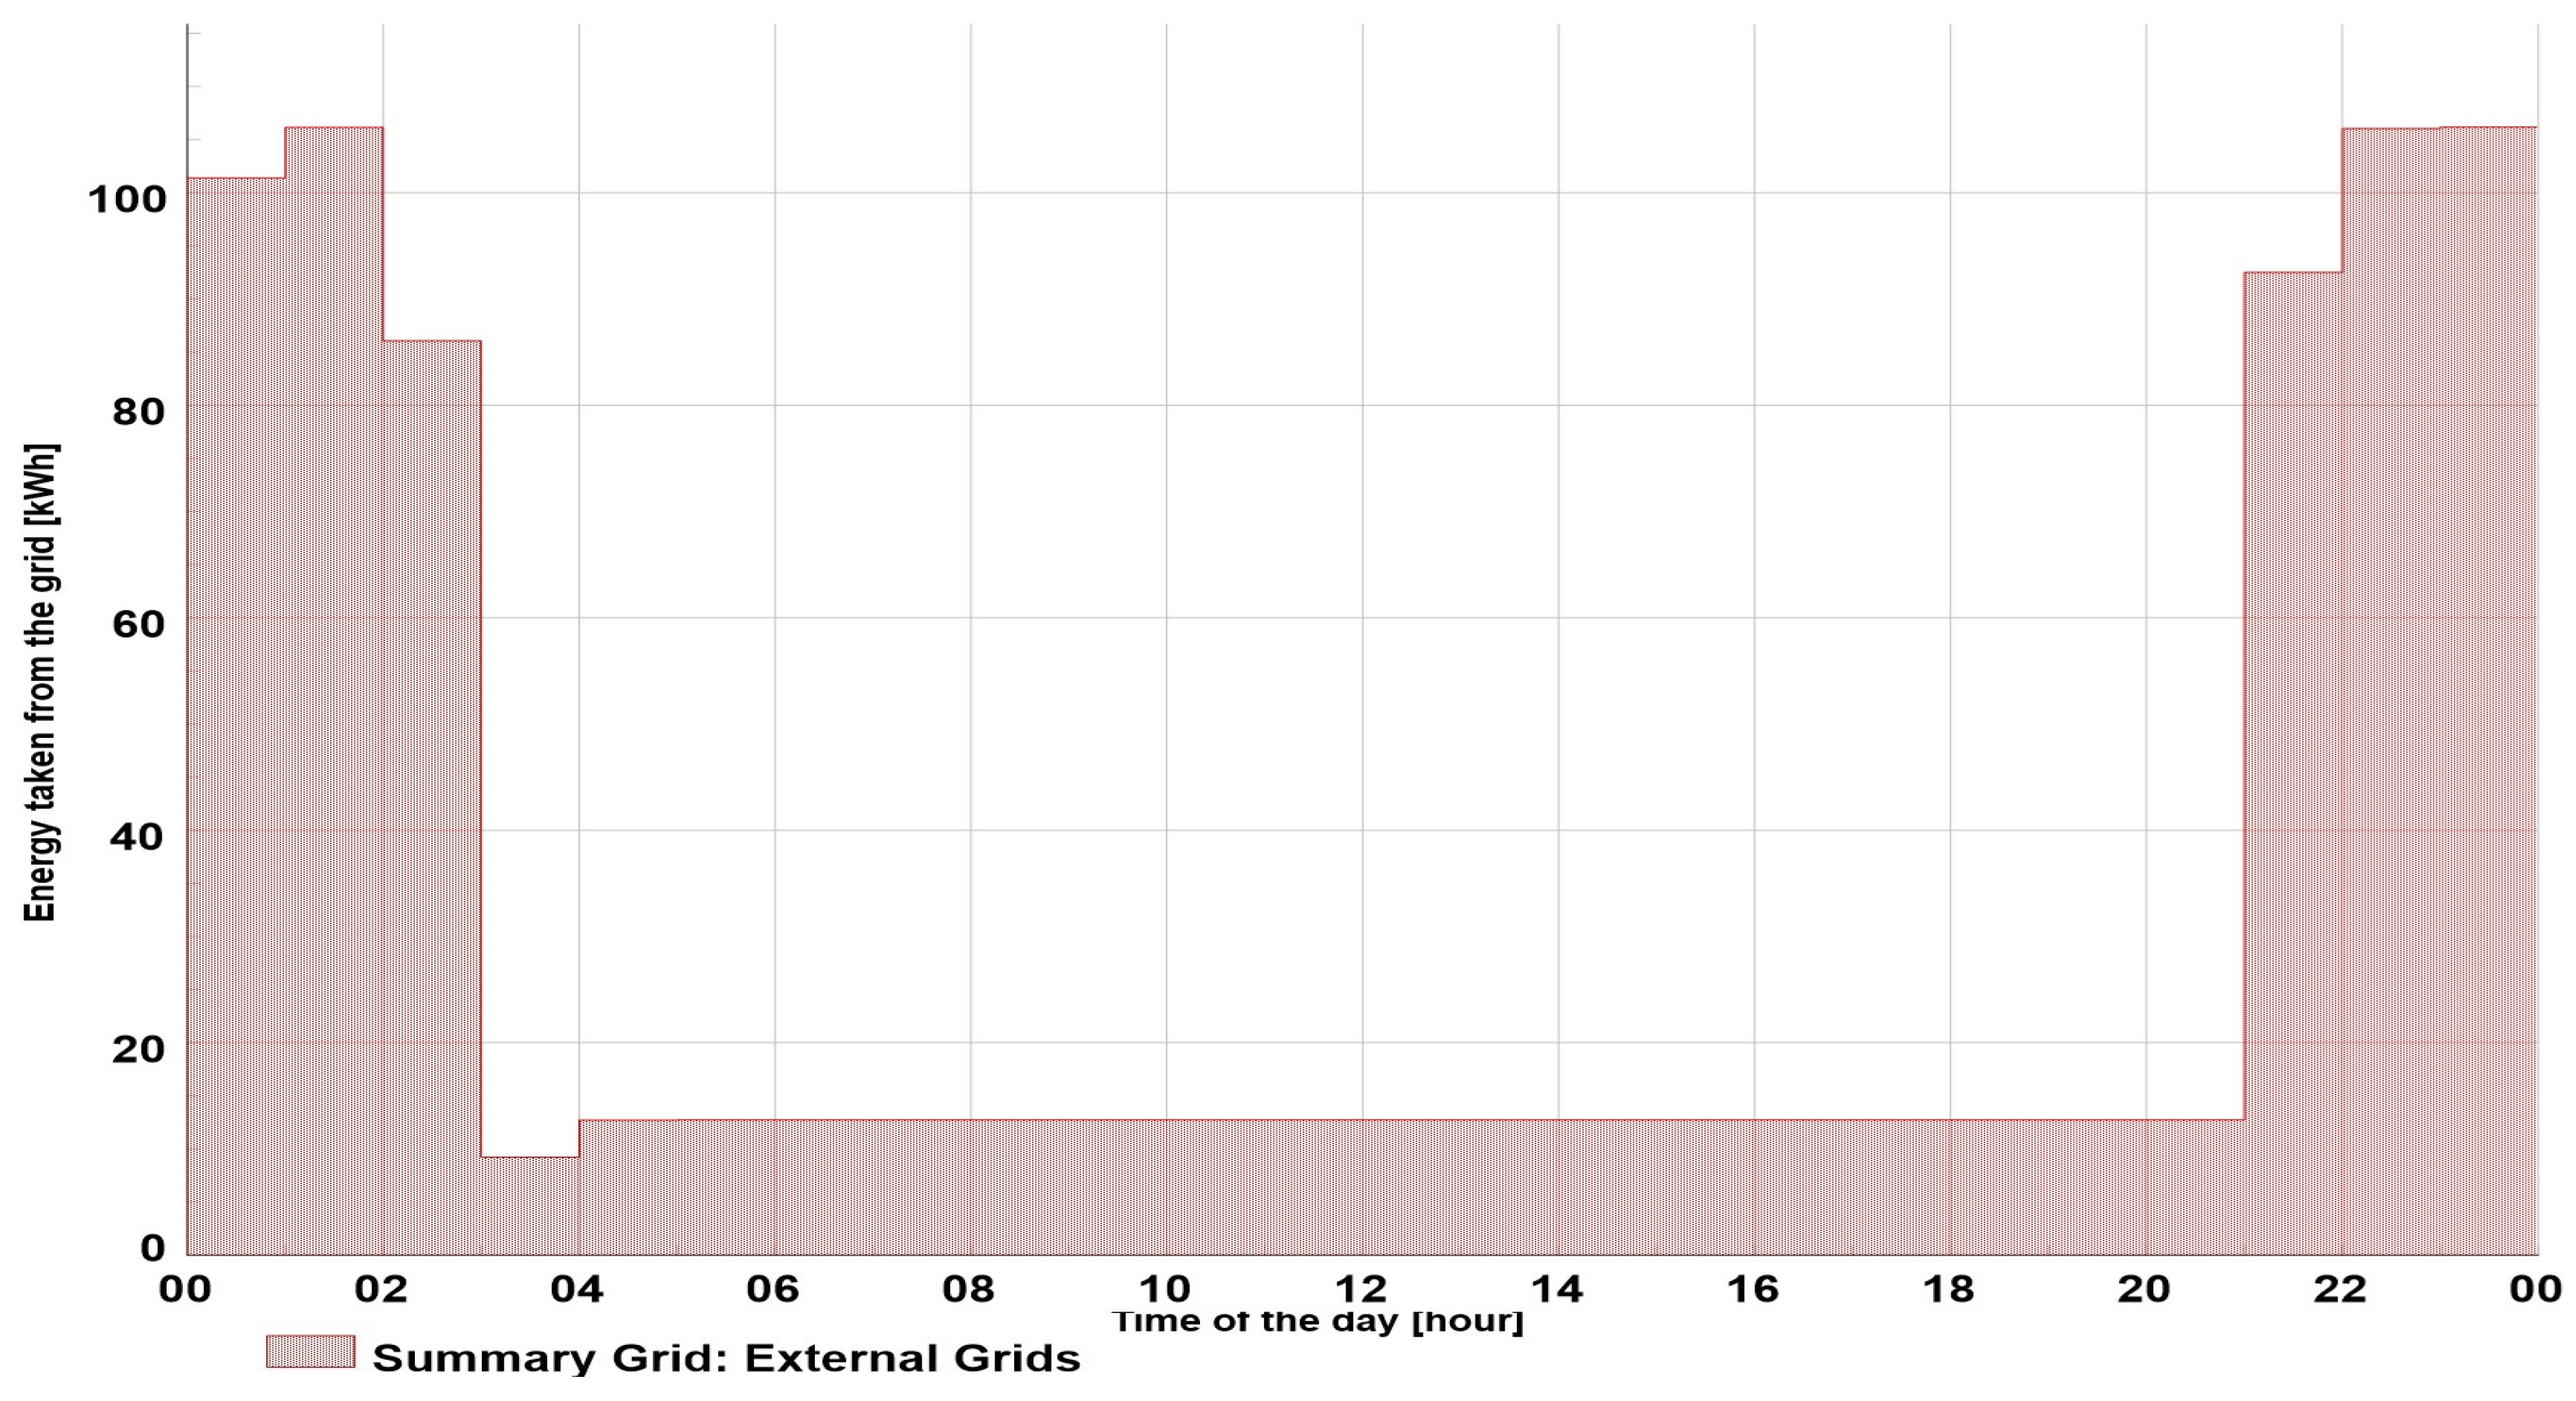
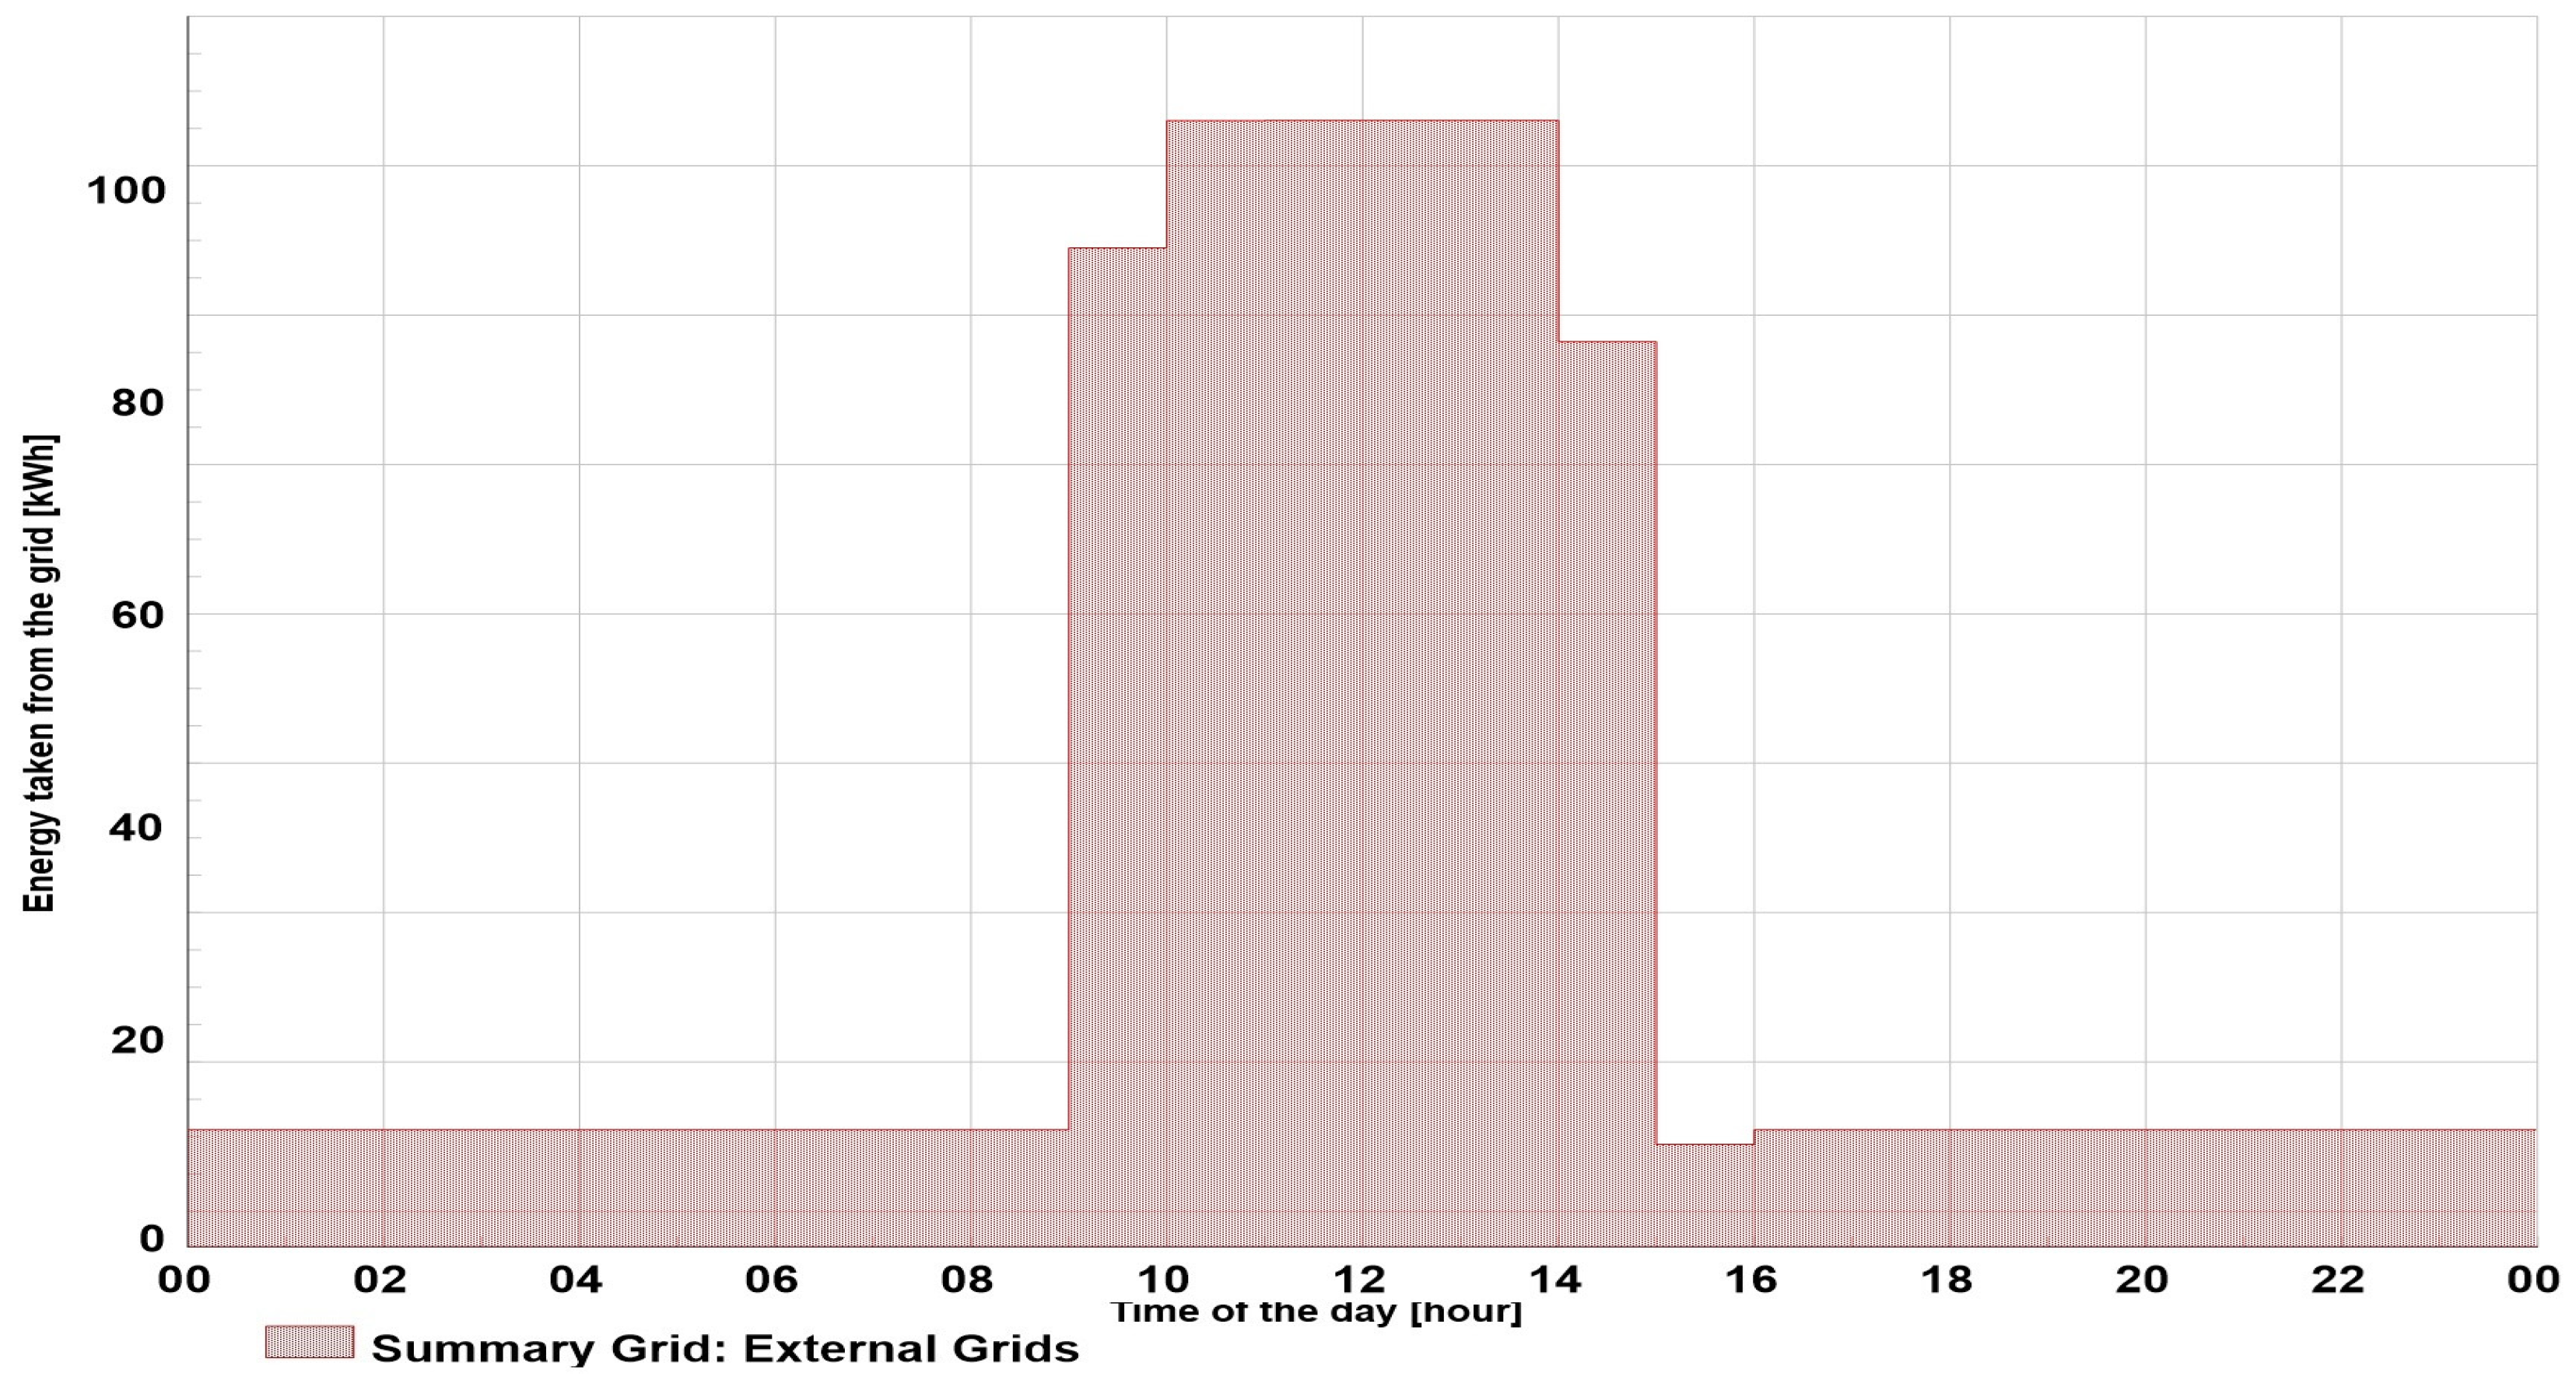
With increased consumption, the total energy taken from the grid also increased, reaching 1003.7 kWh during the 24 h period. The peak power also increased, reaching 138.5 kW during the night period while the EVs were being charged. The total energy taken from the grid is shown in Figure 9. During the day, the total energy was dependent on household consumption and was rather low in comparison with that in the charging periods. A more uniform distribution and lower peak values could be achieved if all consumers would not charge their cars at the same time.
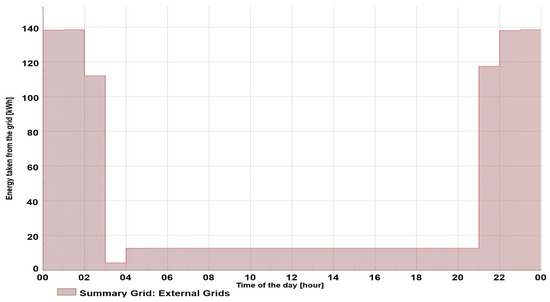
Figure 9.
Energy exchange for Scenario 2.
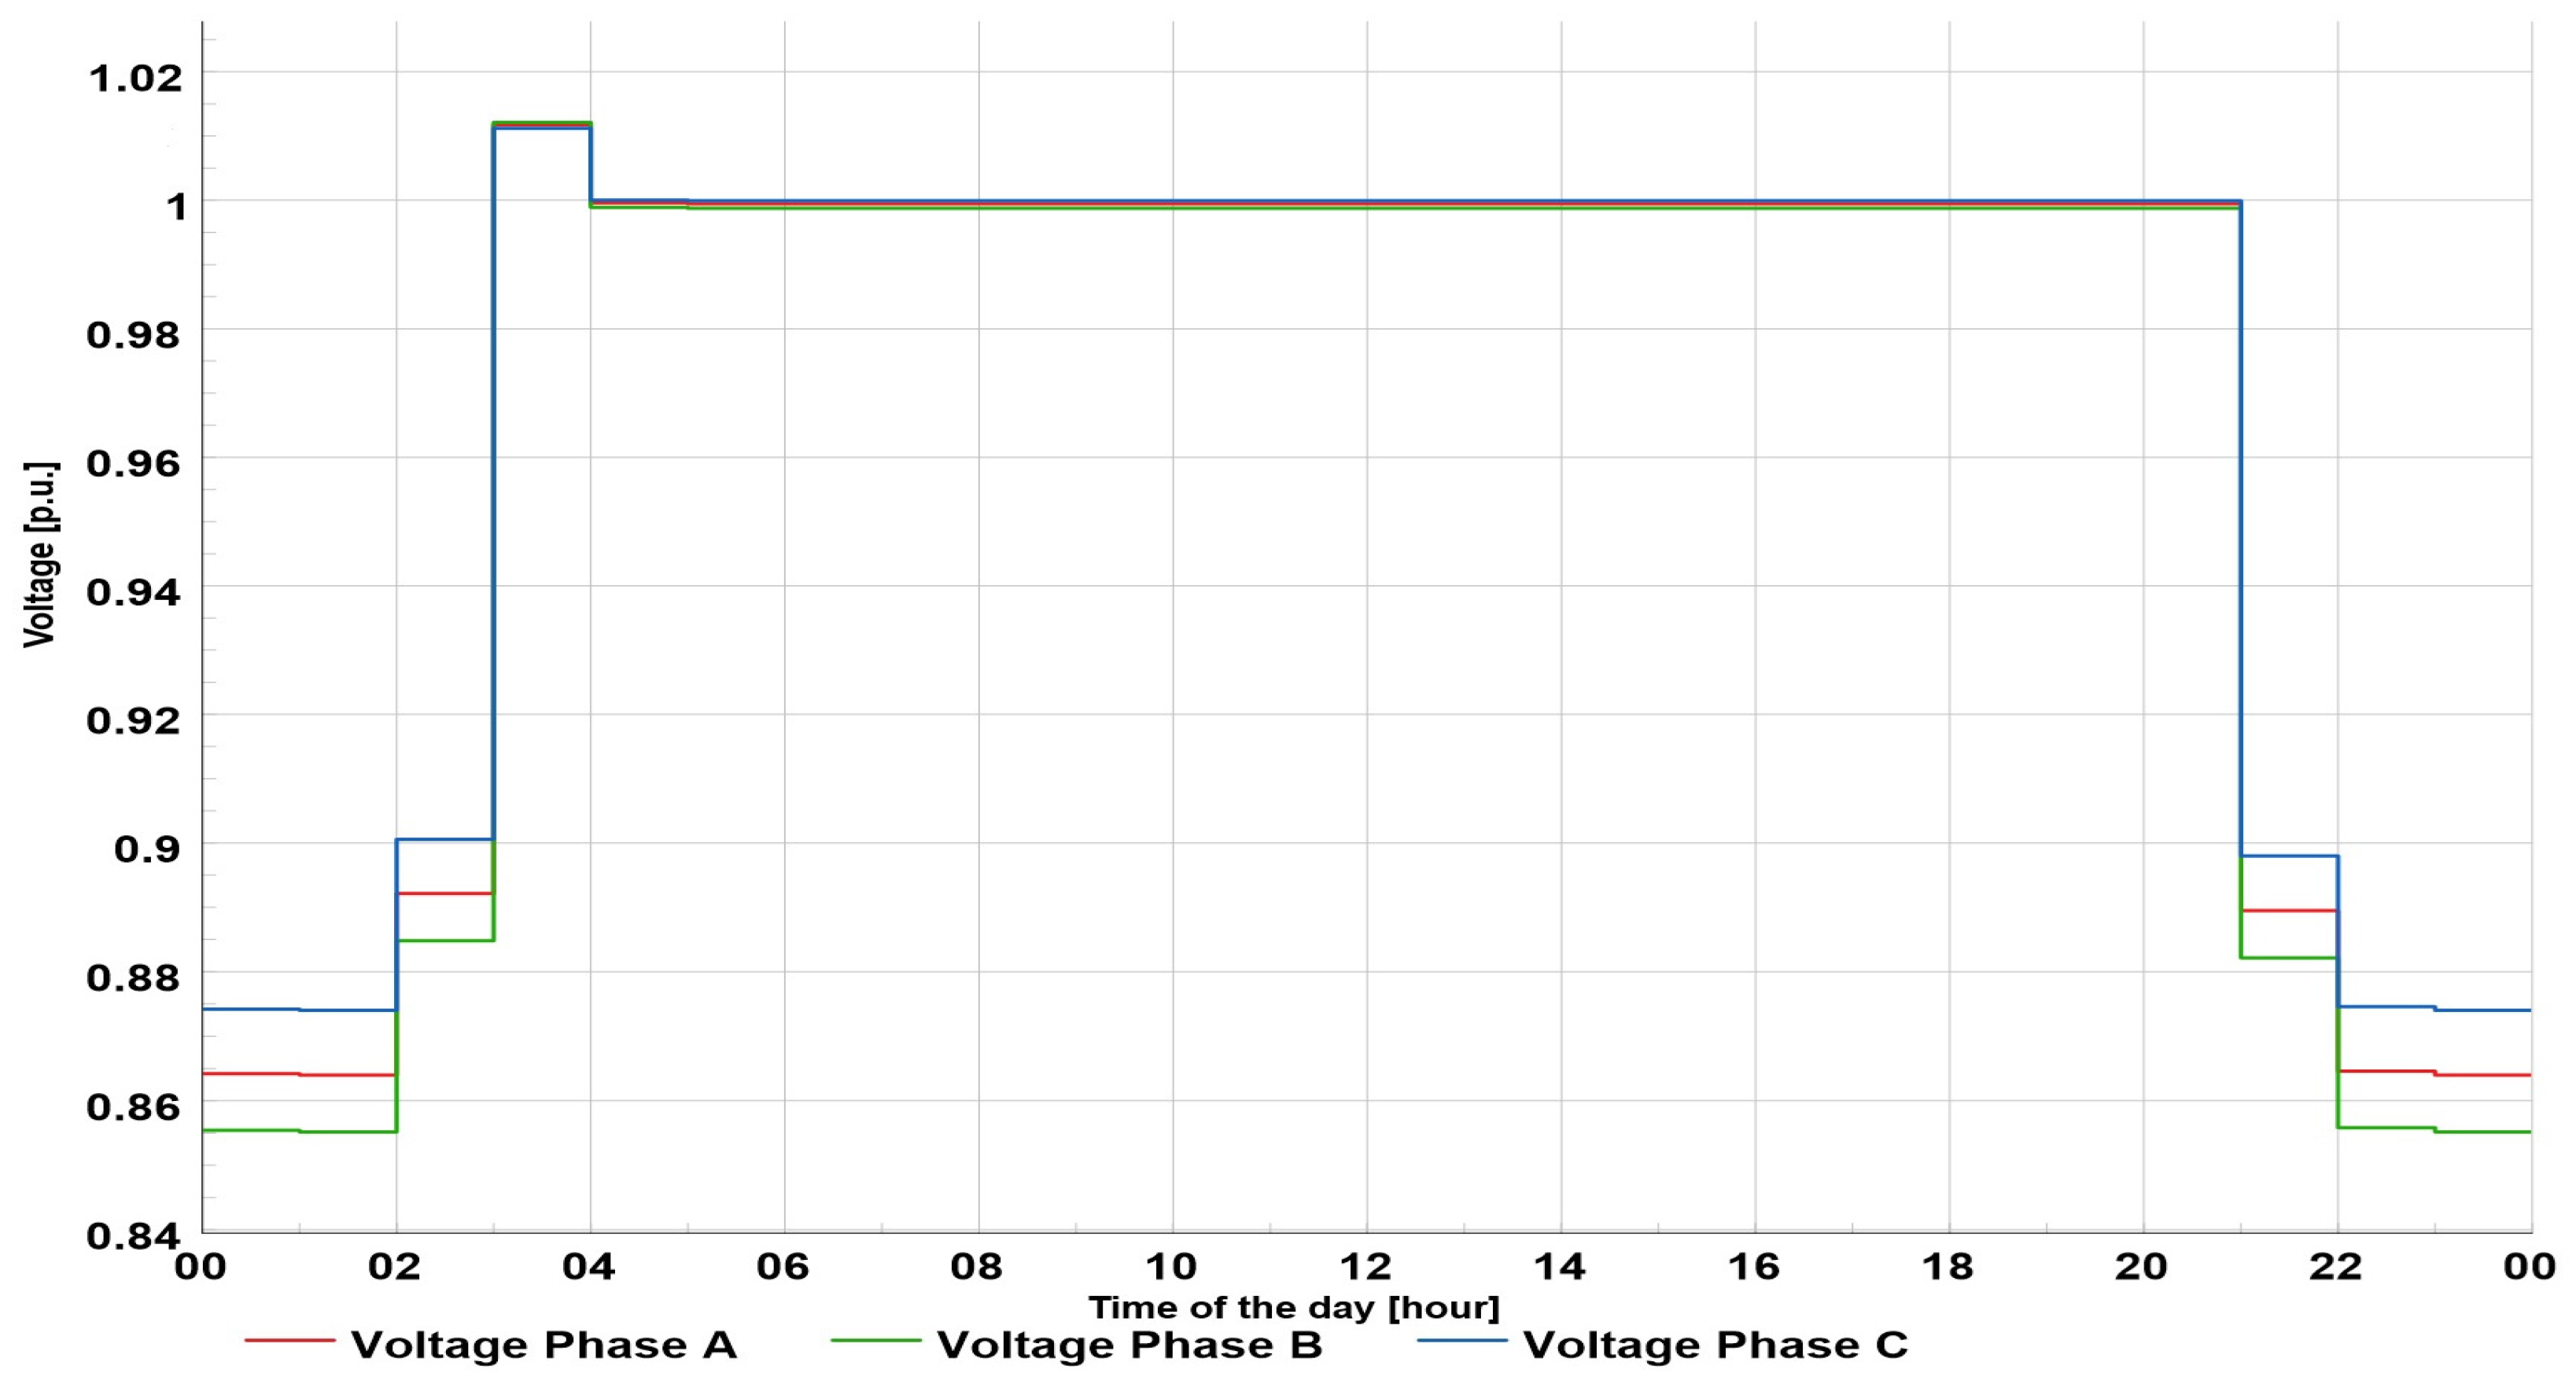
This charging pattern and methods resulted in lower voltages at end consumers, bus 90 (Figure 10). During the day, the voltage was around 1 p.u. for all three phases, since the load was evenly distributed over the phases. The unbalance between phases is negligible. However, when all chargers were connected during the night, the voltage unbalance increased, with a minimum value of 0.855 p. u in phase B, and a maximum value of 0.875 p.u. in phase C.
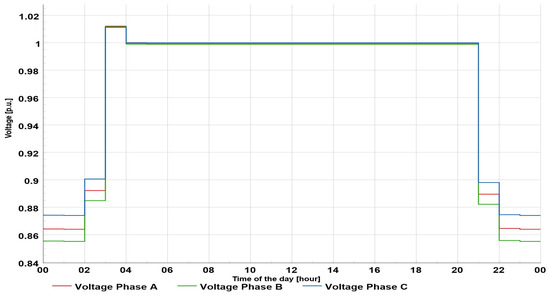
Figure 10.
Voltage profile at bus 90, Scenario 2.
The voltage value below 0.9 p.u. was below the limit set by the EN 50160 standard, and such grid operation would not be permitted. With the existing infrastructure and grid loads, it would not be allowed to connect 50% of chargers to this outlet, as expected according to projections on the increase of electromobility.
5.3. Scenario 3—50% of Three-Phase EV Chargers
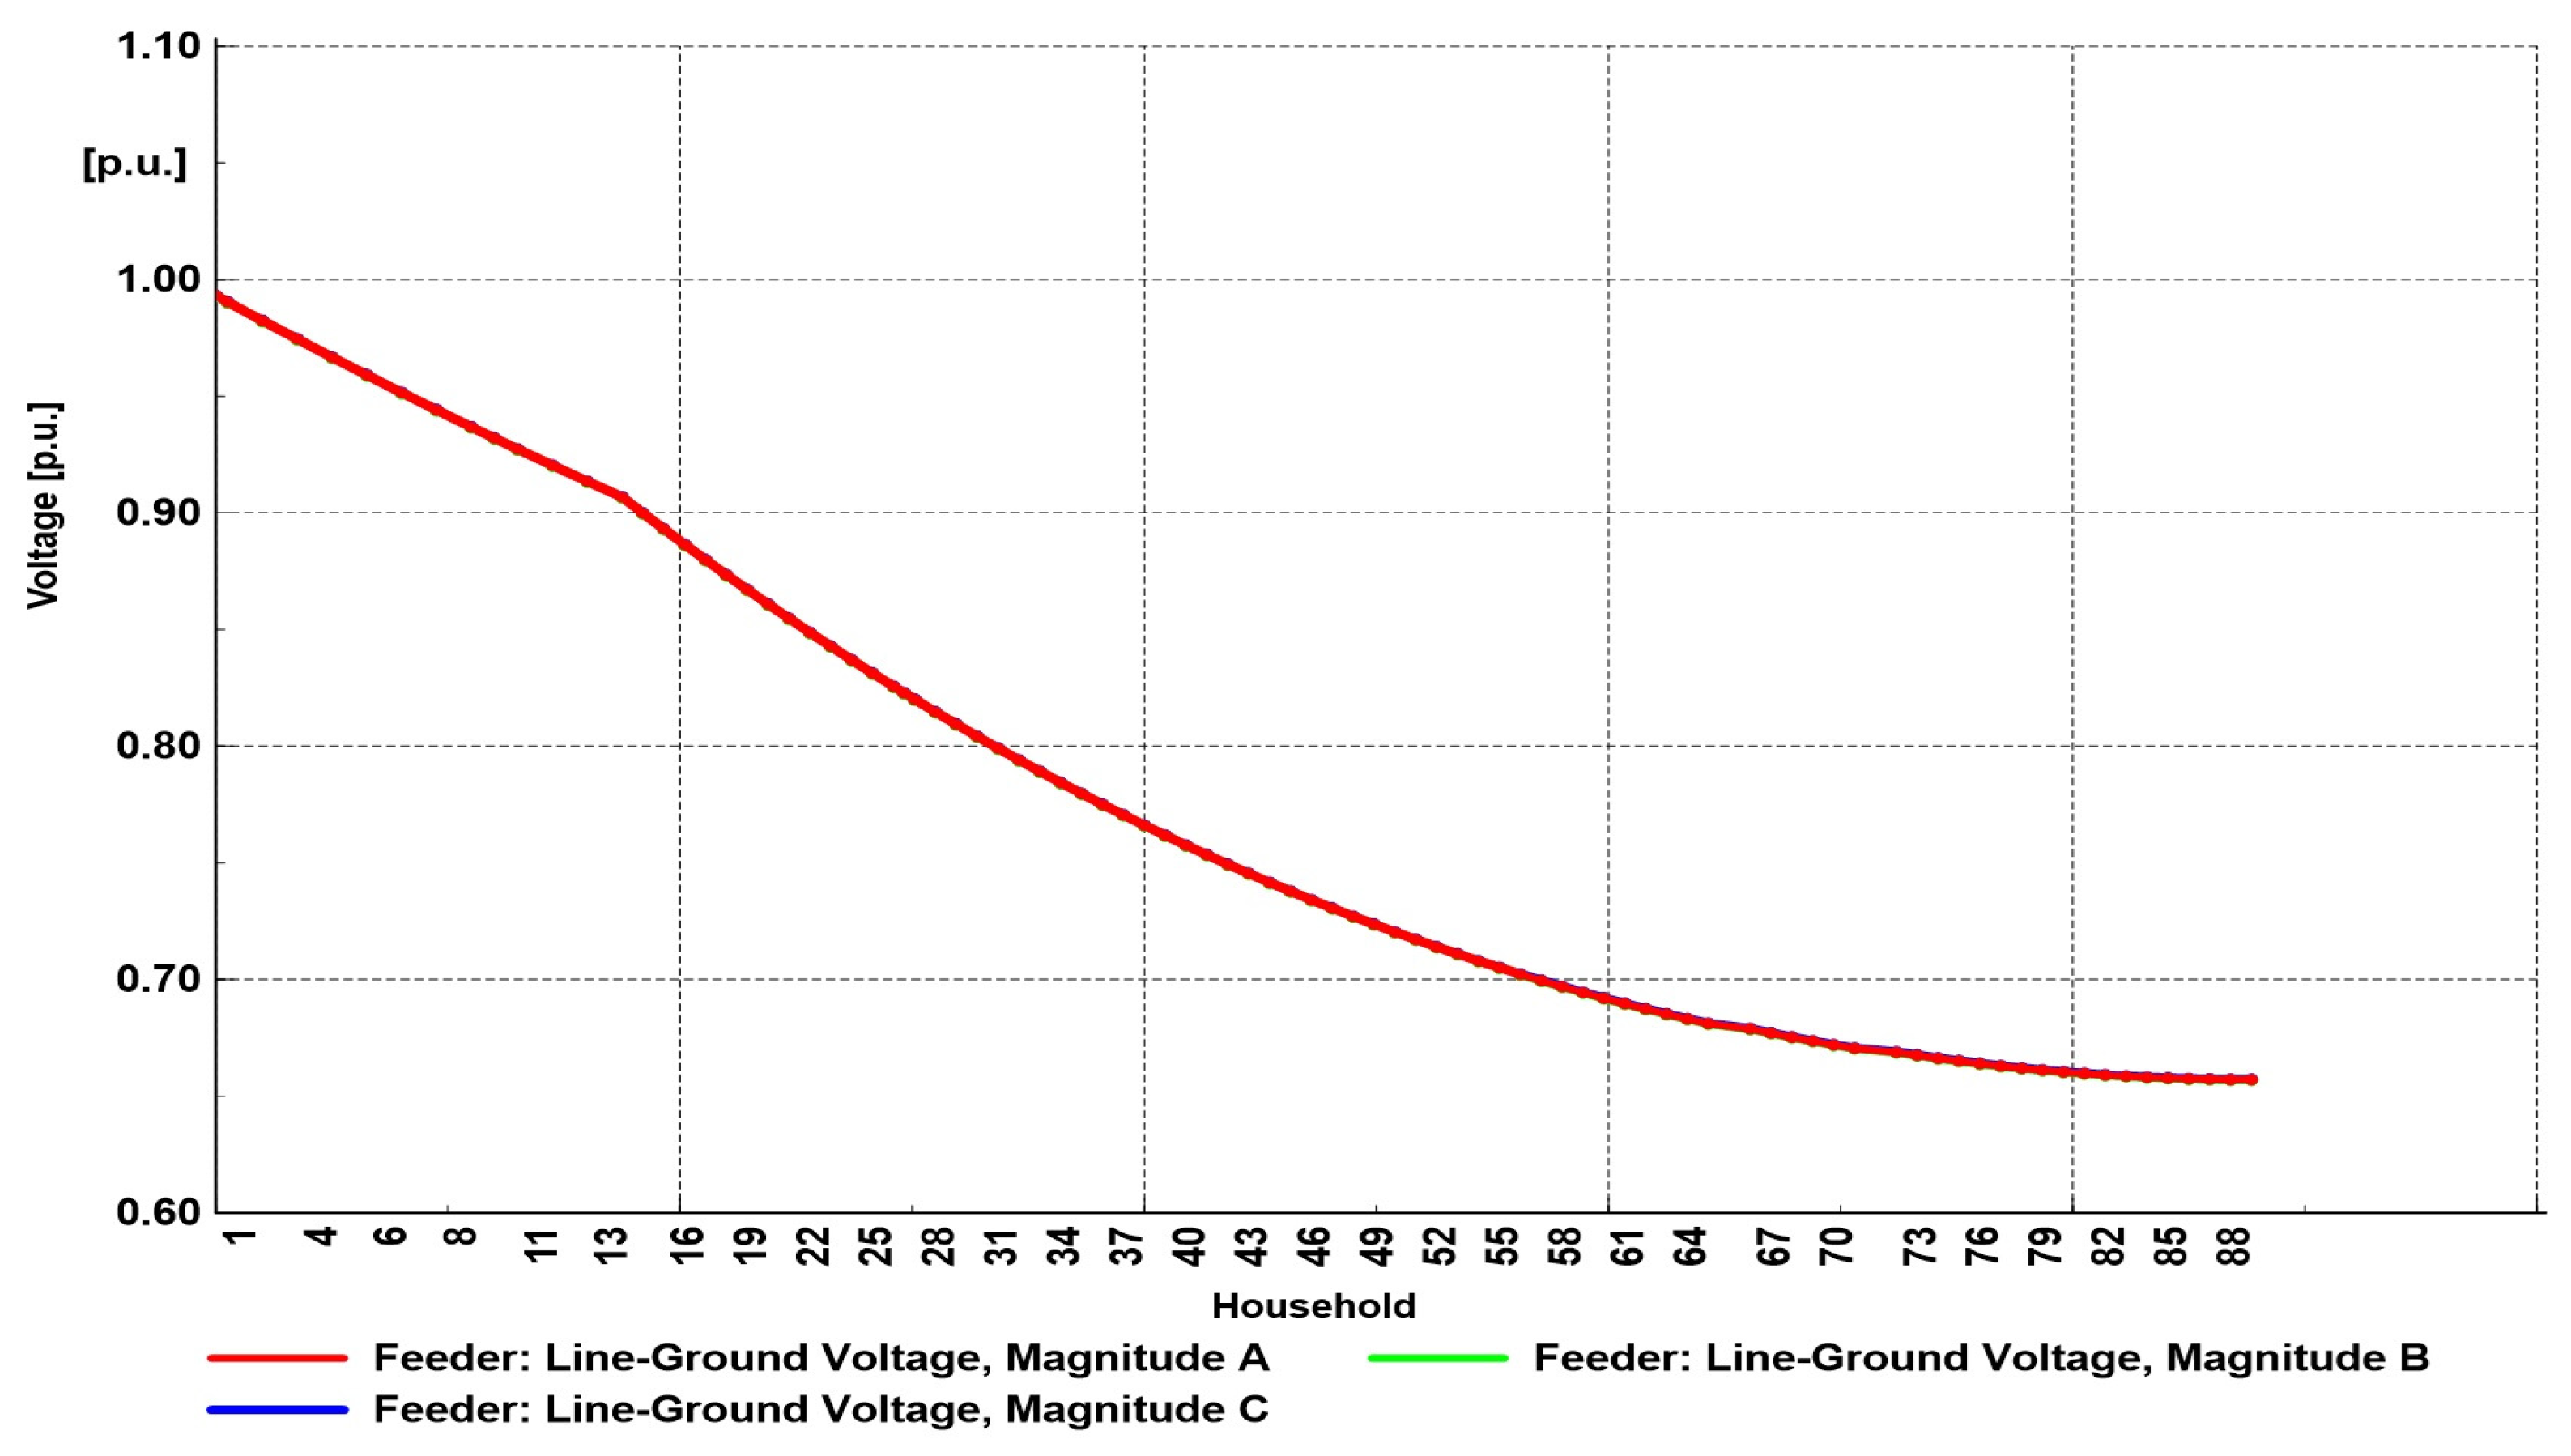
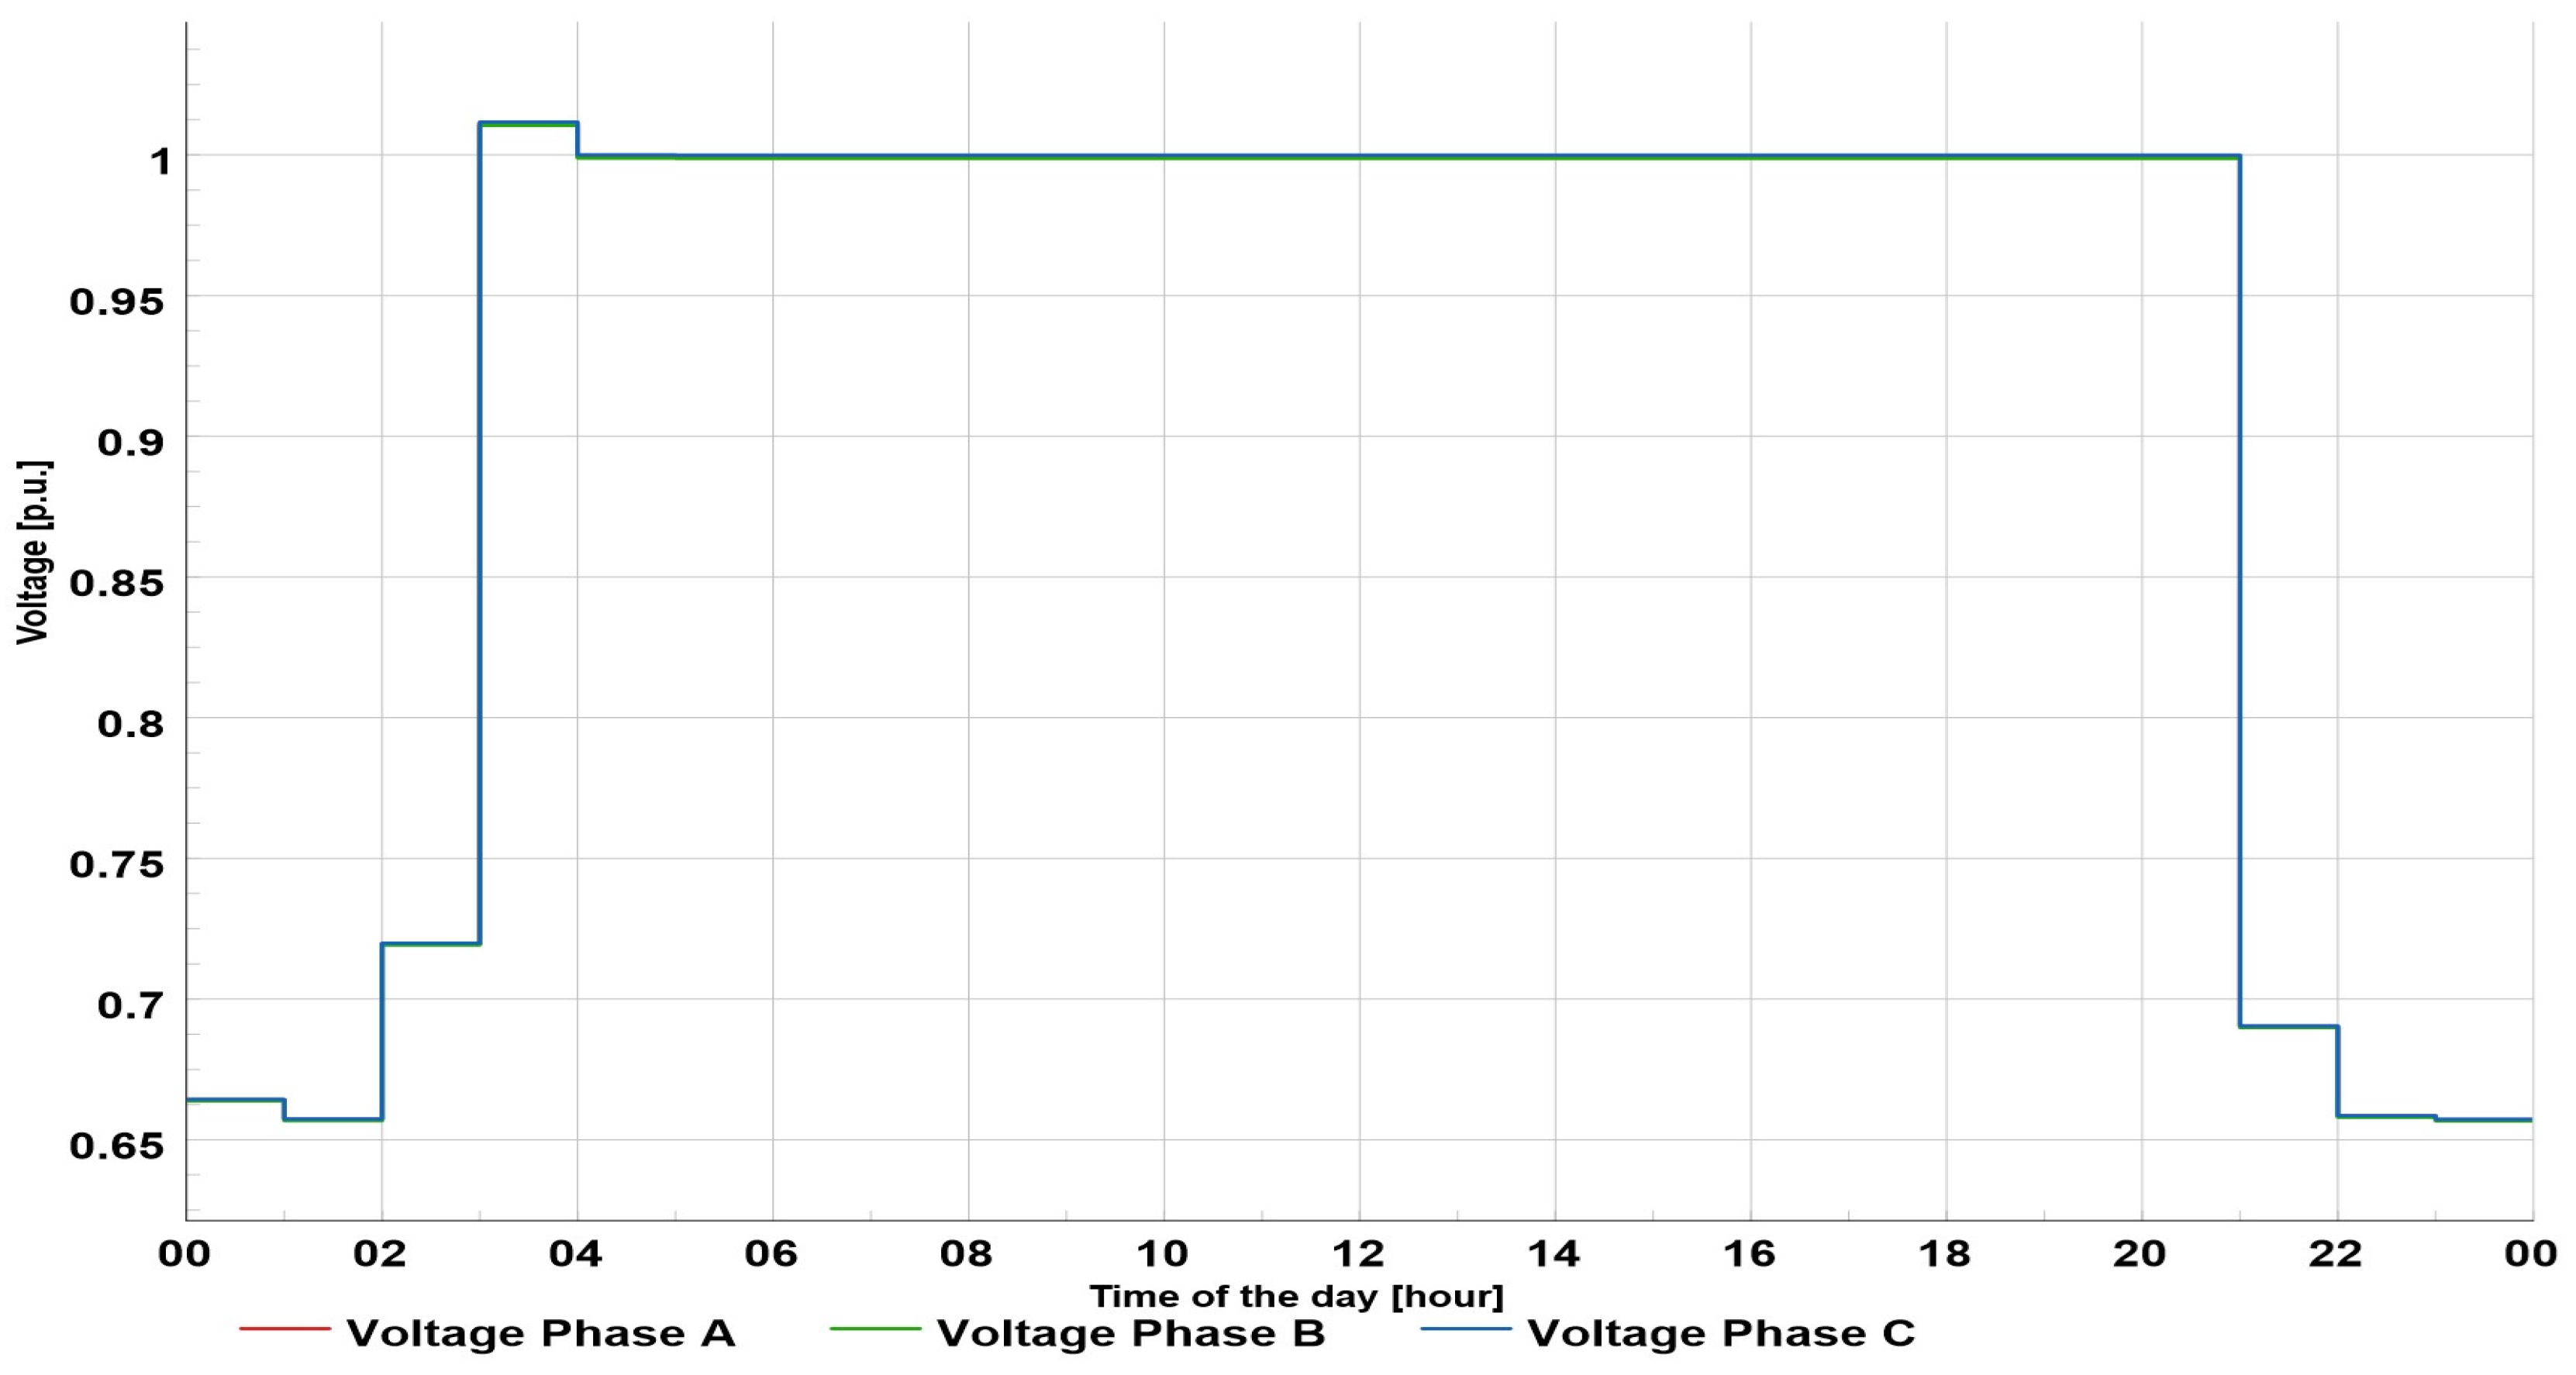
Similar to Scenario 2, in Scenario 3 it was assumed here that the integration of EV chargers would be according to the projections and expectations about the share of EVs. Accordingly, it was assumed that every second household would have a balanced three-phase EV charger with a power of 11 kW. The number of chargers remained the same as in the previous scenario (44 chargers). The voltage profile is shown in Figure 11, and it can be noticed that the voltage at the end user reached a value of 0.65 p.u. Since the chargers were balanced, the voltage along the feeder as also balanced.
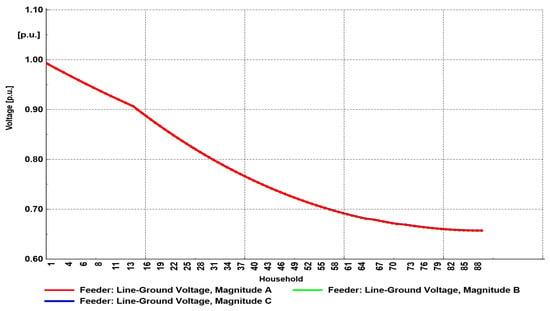
Figure 11.
Voltage profile for Scenario 3.
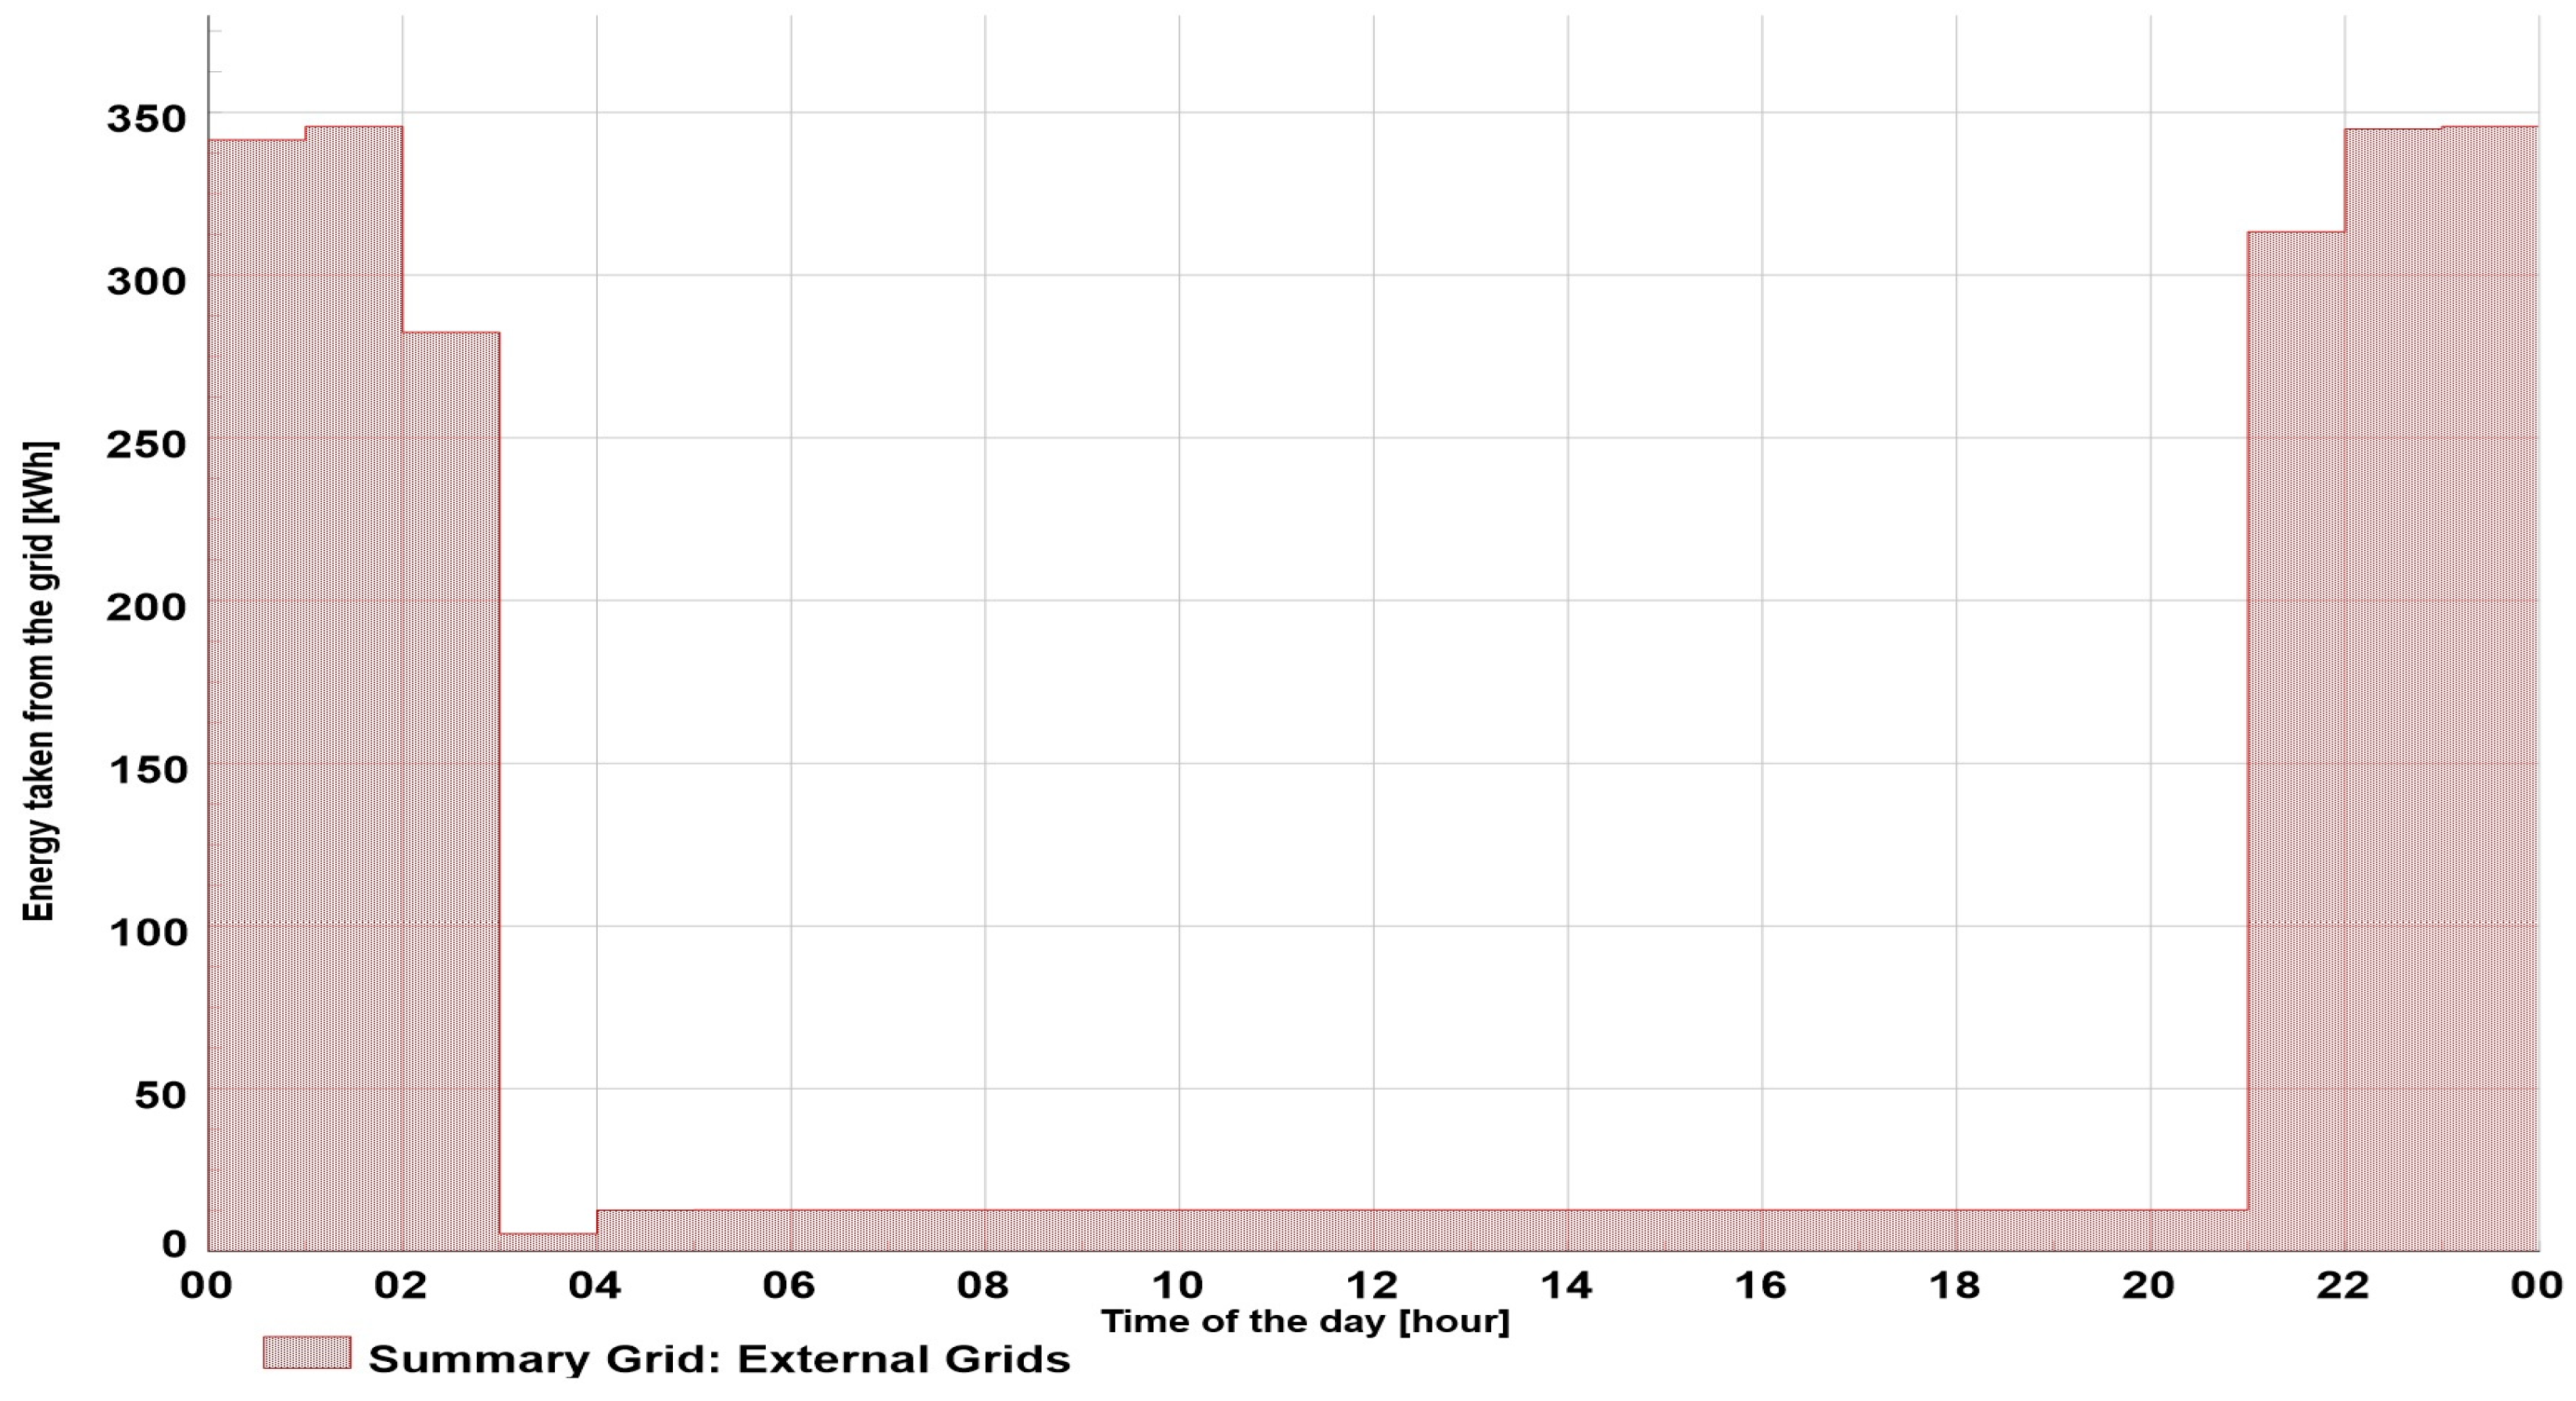
The energy exchange (shown in Figure 12) increased, as the total power in the feeder reached the peak value of 341.6 kW. The total energy taken from the grid reached the value of 2195 kWh for the 24 h period. In comparison with the values for the previous scenarios, this is a huge increase, and the grid would need to be able to deliver this amount of energy. Also, with such increase, the thermal load of the cable would increase its deterioration and aging.
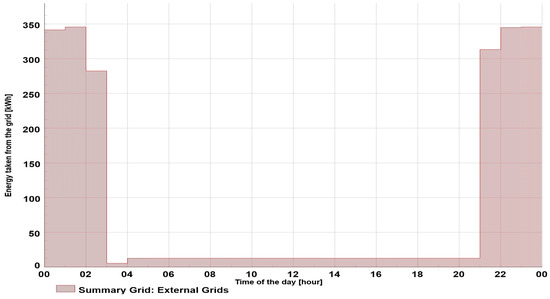
Figure 12.
Energy exchange for Scenario 3.
The voltage at the end consumer is shown in Figure 13. As in the previous scenario, the voltage deviated significantly from the lowest value of 0.66 p.u. during the period when charging was at its highest power. From the previously mentioned considerations, it is clear that the integration of three-phase chargers in such a large number should not be allowed for a given feeder.
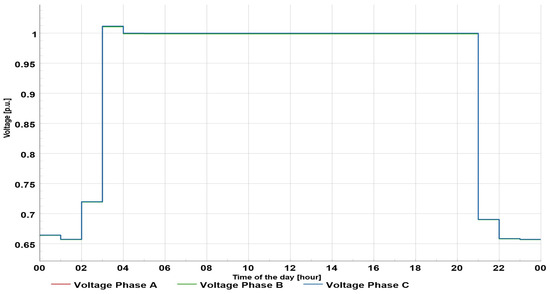
Figure 13.
Voltage profile at bus 90, Scenario 3.
5.4. Scenario 4—Maximum Acceptable Number of Single-Phase EV Chargers
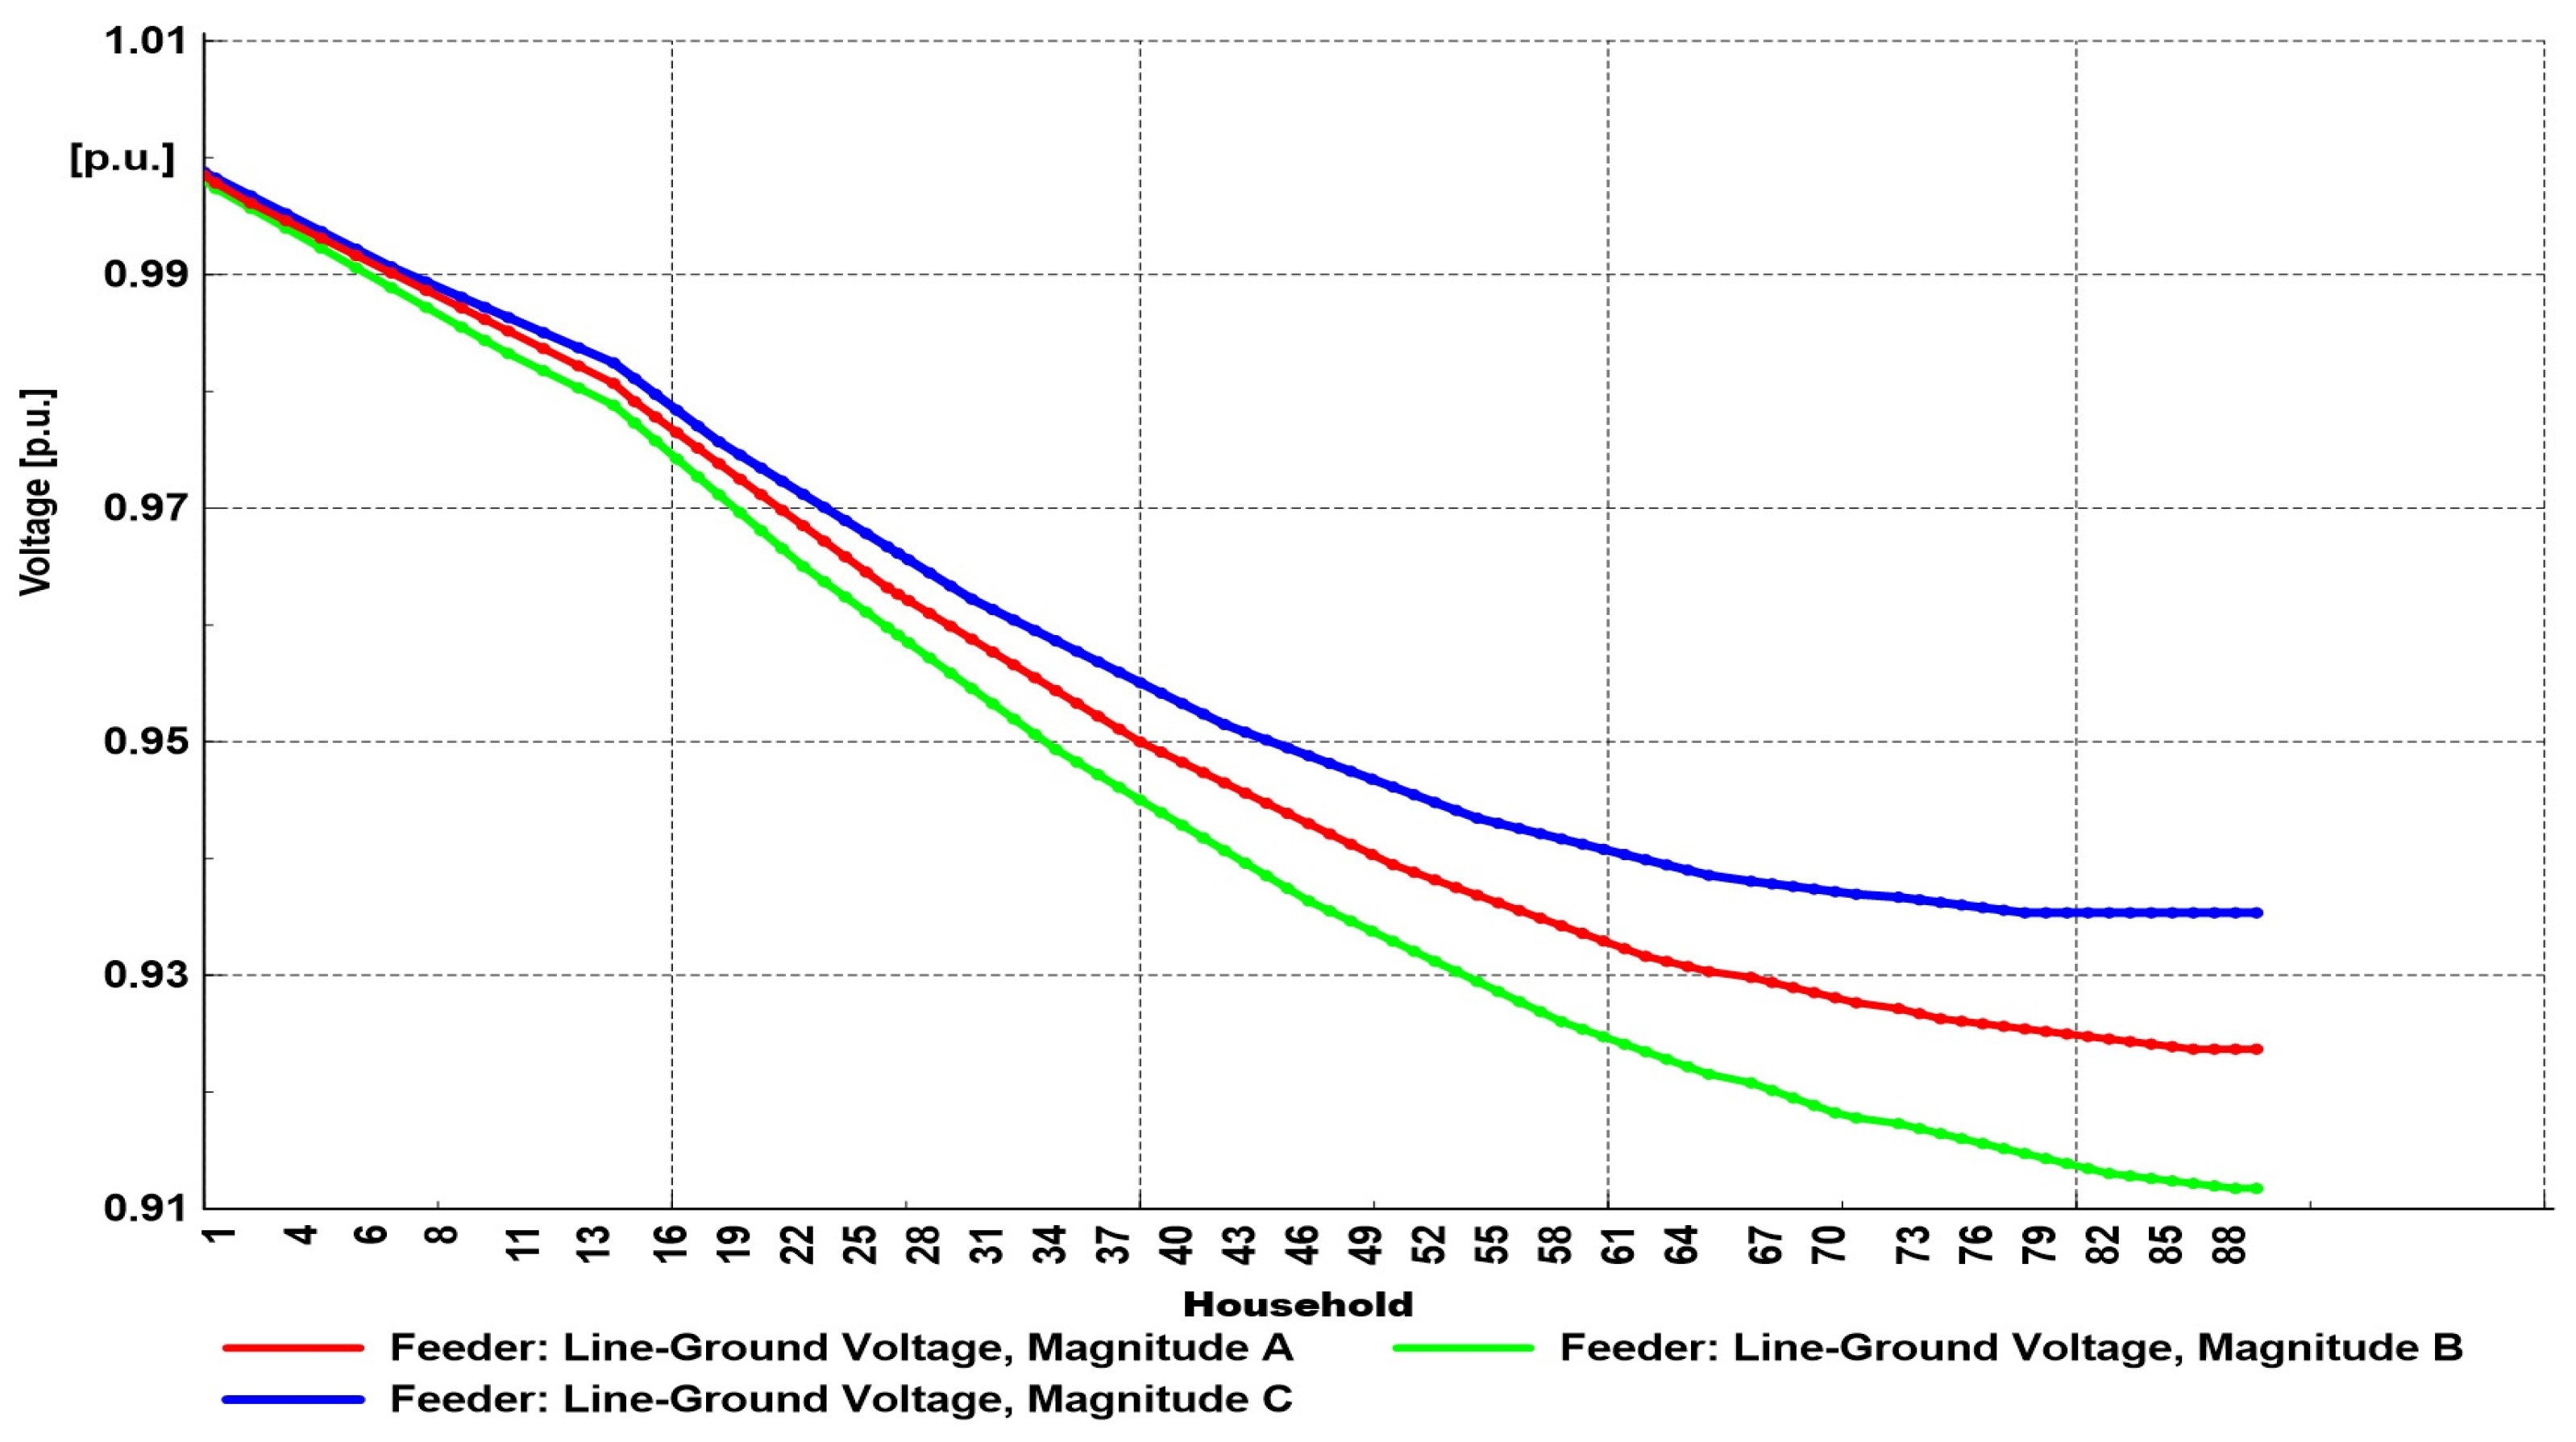
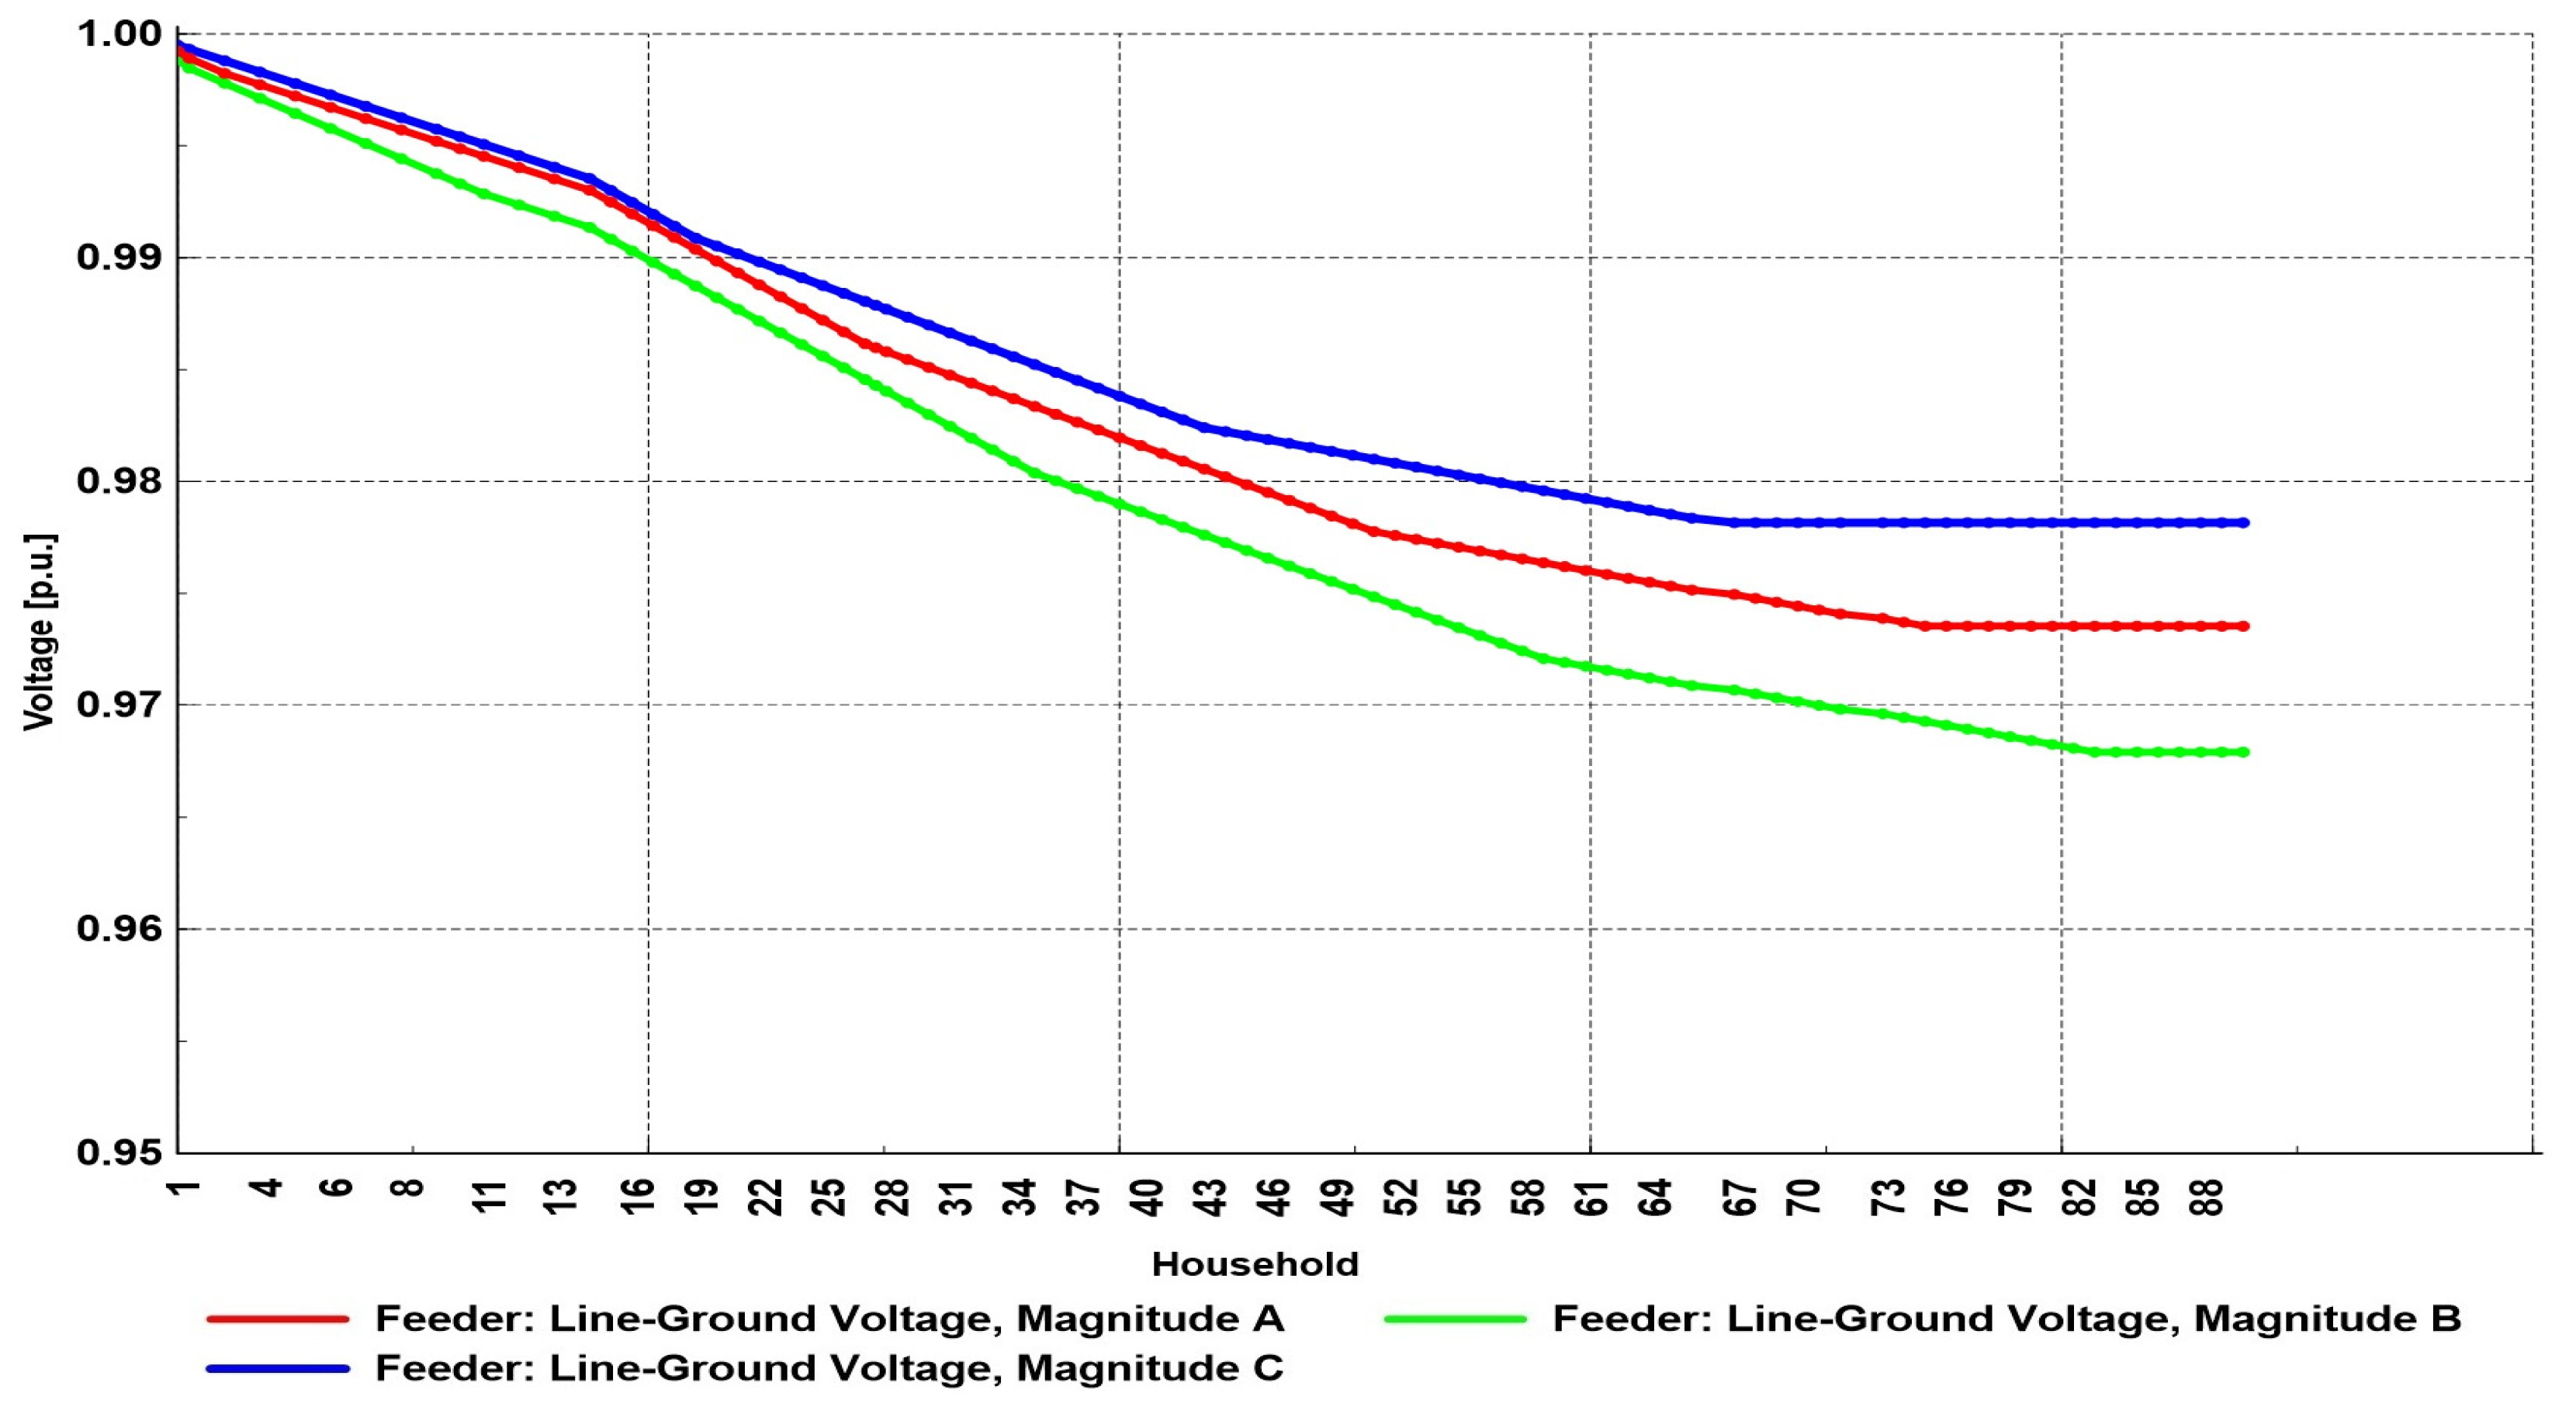
As shown in the previous scenarios, a high integration of EV chargers, whether single-phase or three-phase, would result in a significant increase in the load on the system and thus disrupt the voltage conditions. In order to test the maximum limit to which integration is possible, the number of chargers was gradually reduced until the voltage on the last bus reached the limit of 0.9 p.u. The largest number of single-phase chargers at which the voltage remained within the given limits was 22, with the chargers randomly distributed per feeder, which means that the largest possible integration involved 25% of the households with EV charging capability. The chargers were evenly distributed on all three phases, which does not actually reflect a real situation but can serve as a framework for further analysis. Figure 14 shows the voltage profile when the maximum number of single-phase EV chargers were integrated.
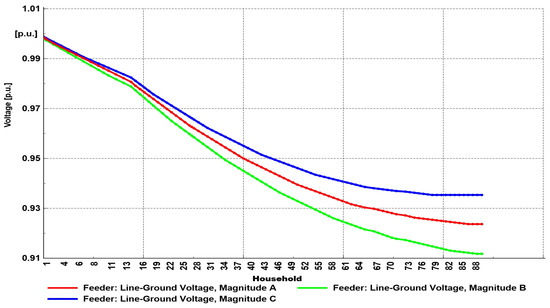
Figure 14.
Voltage profile for Scenario 4.
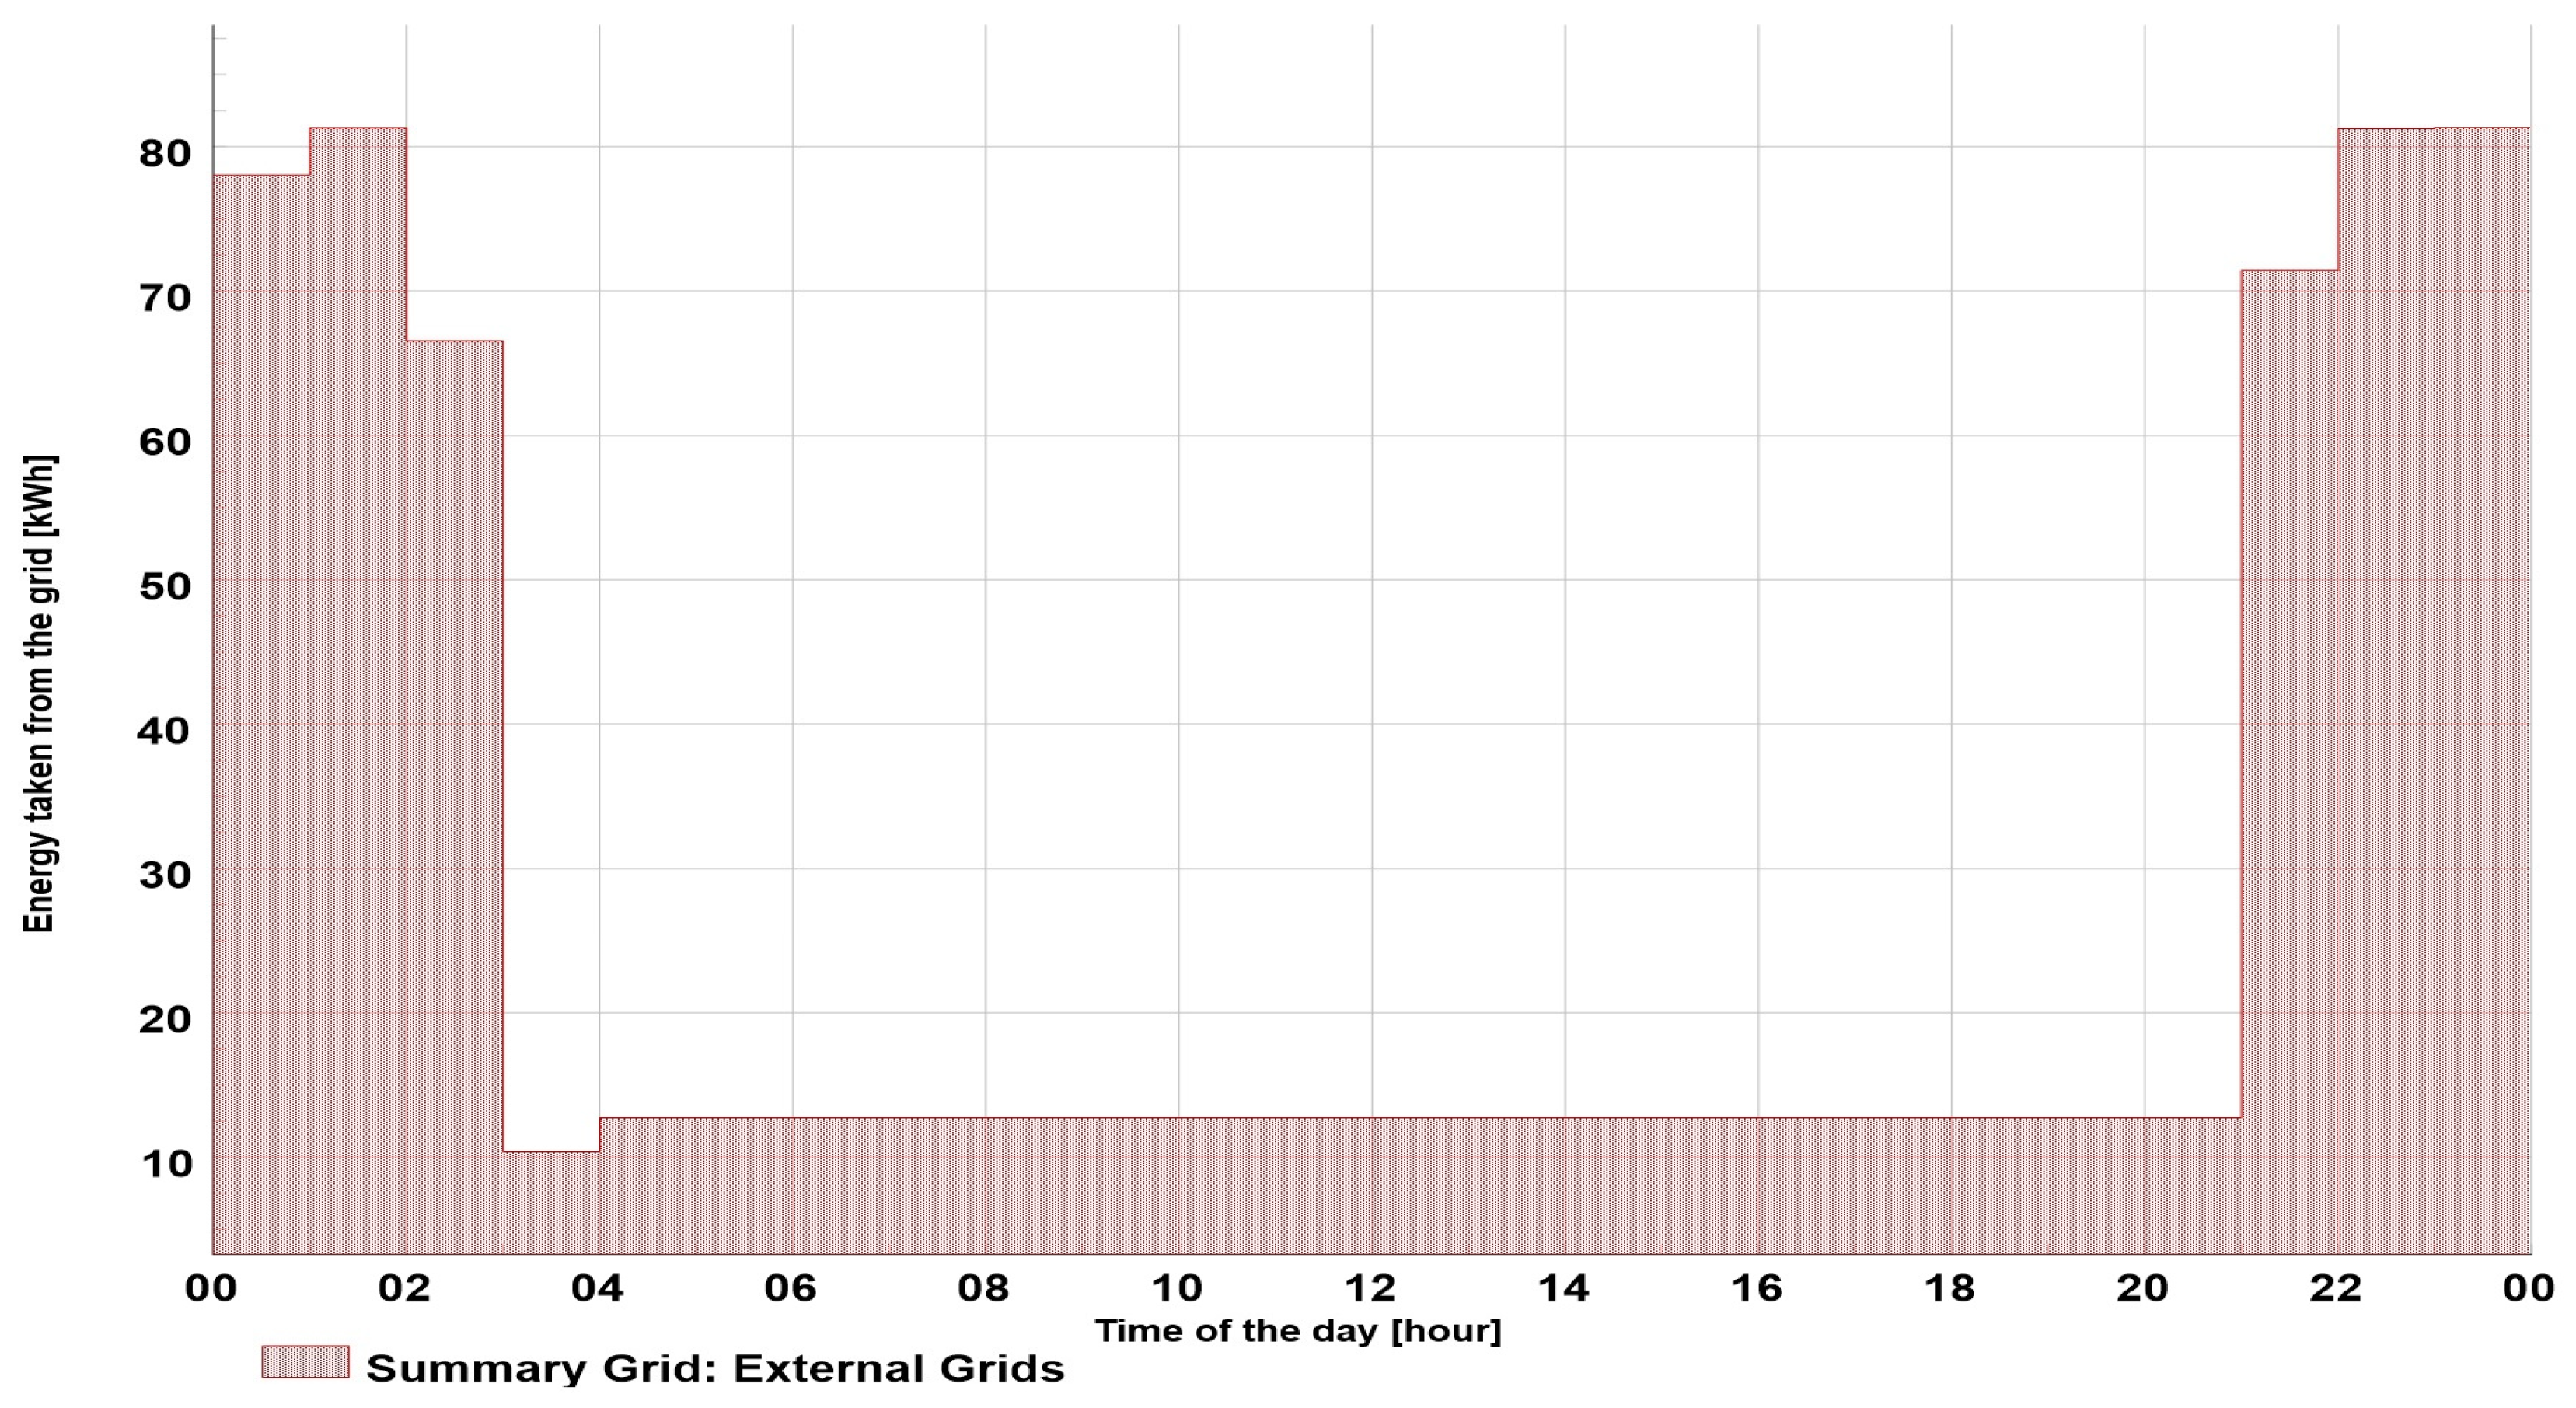
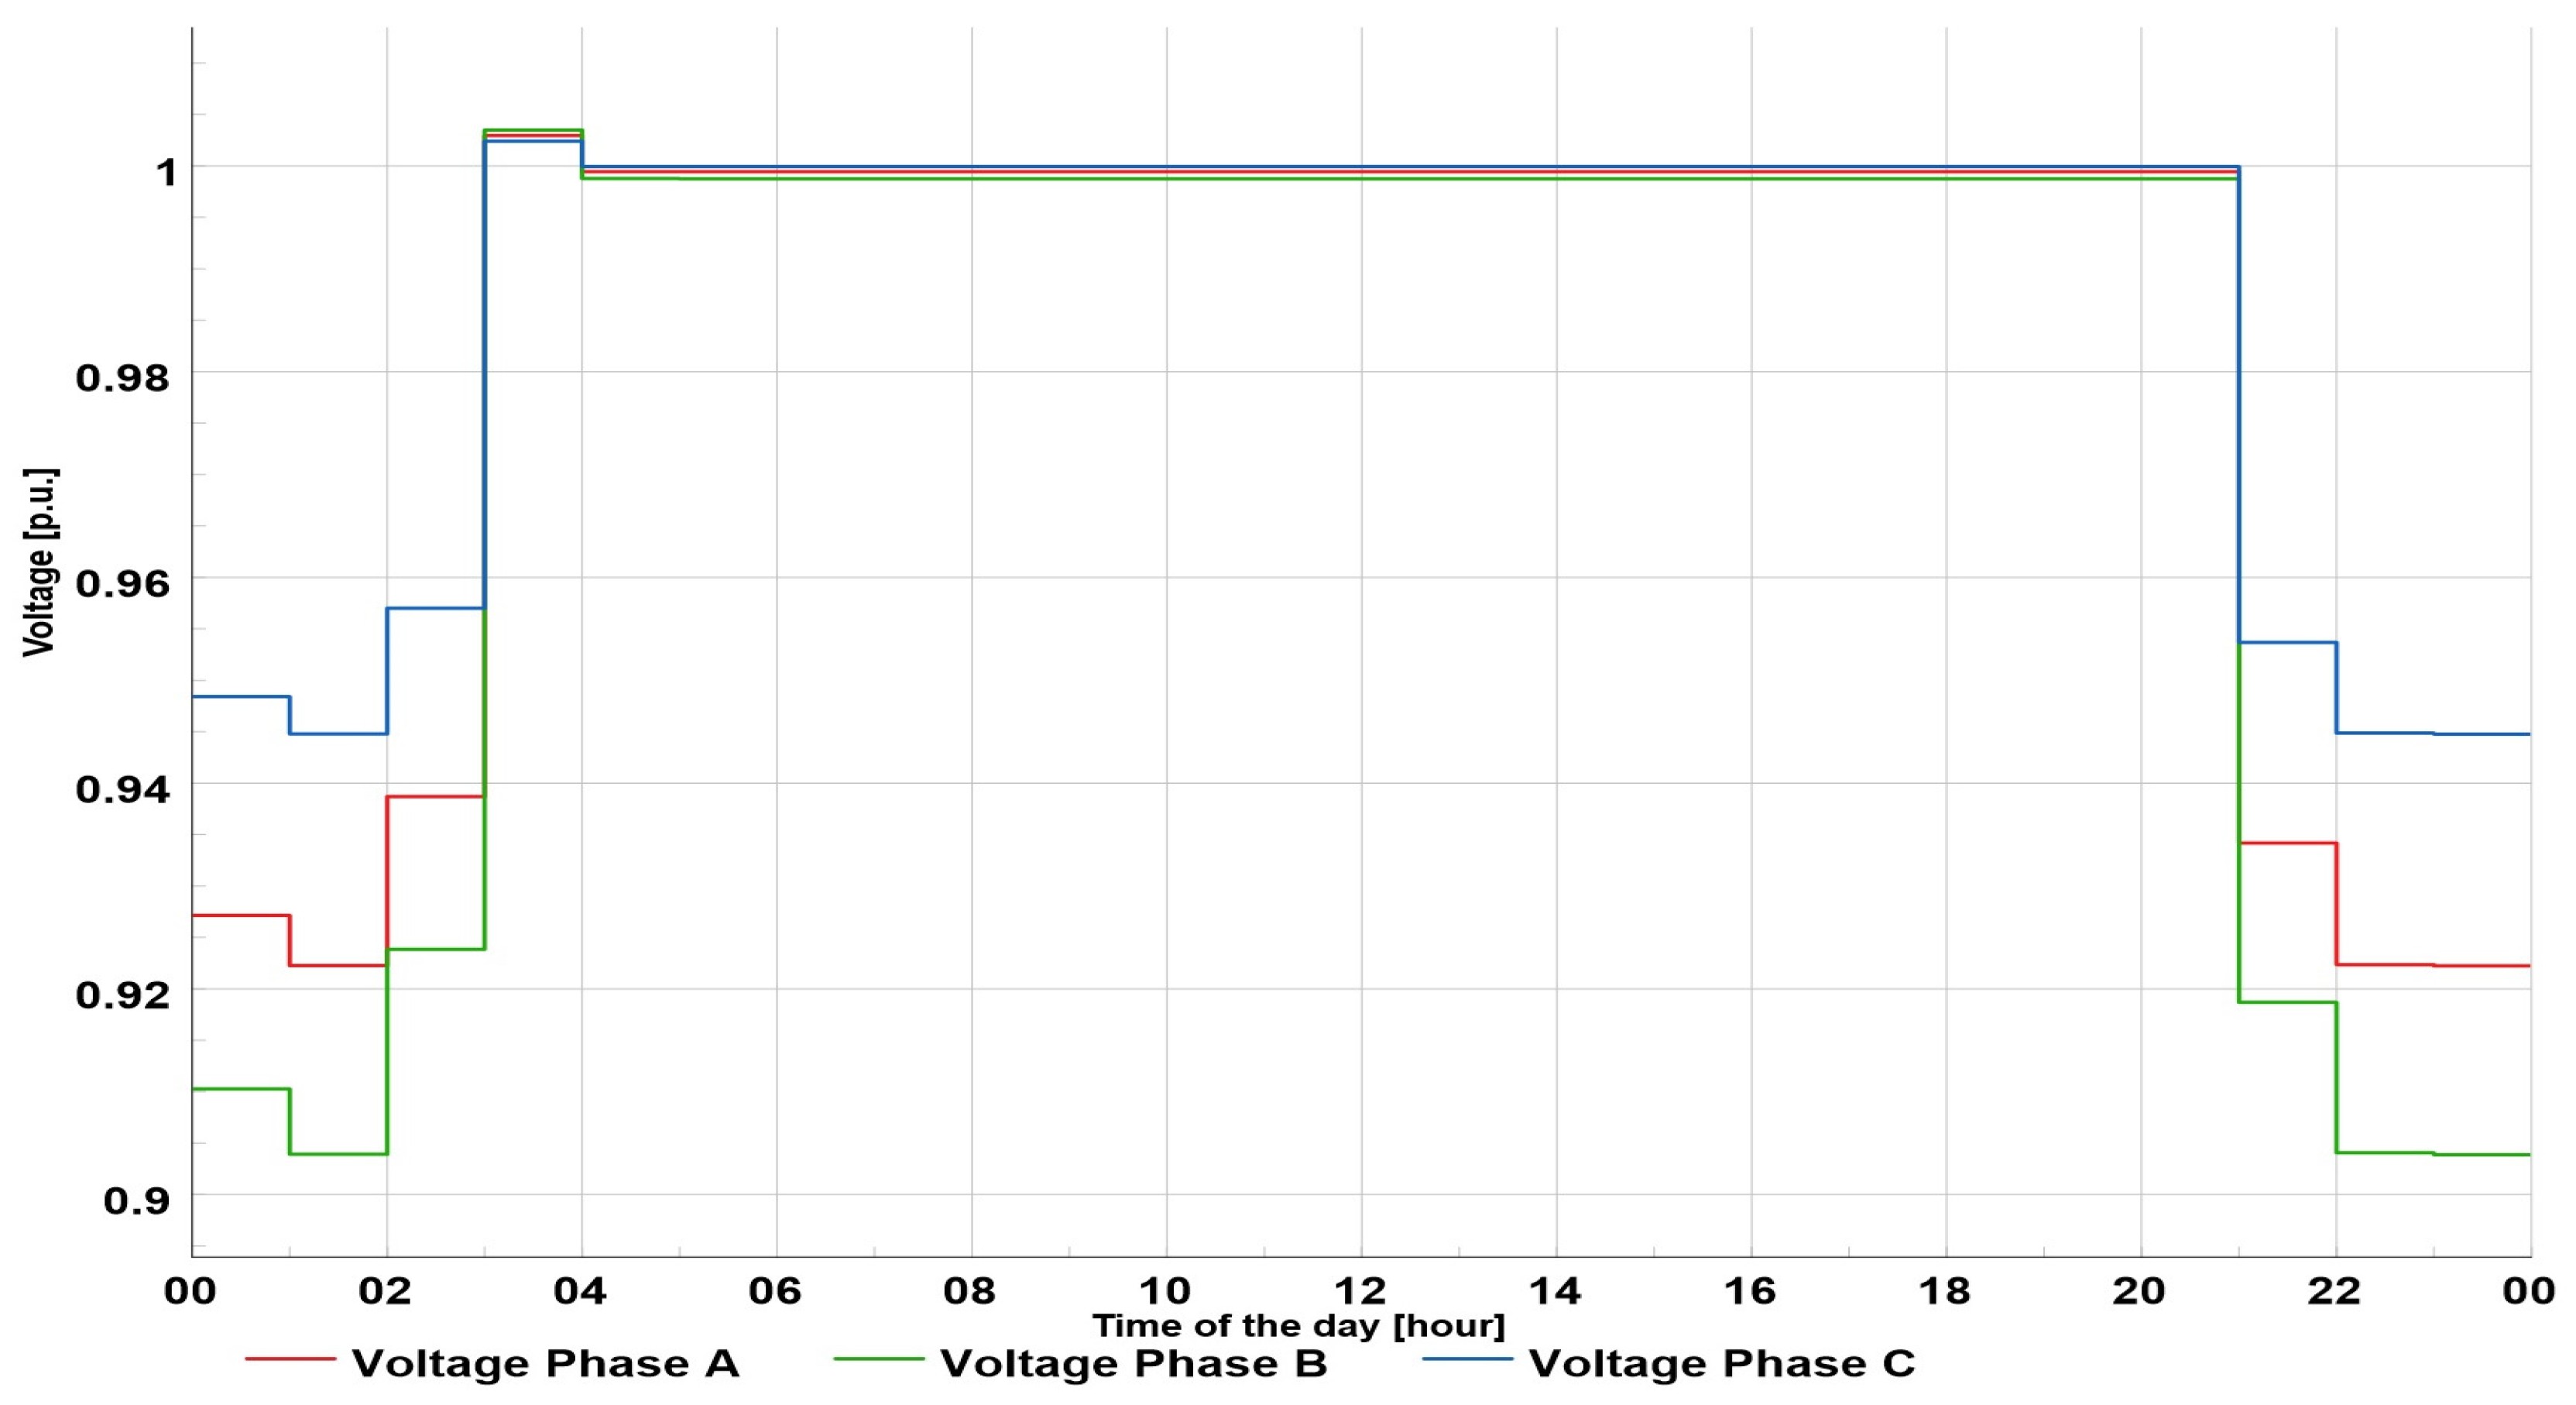
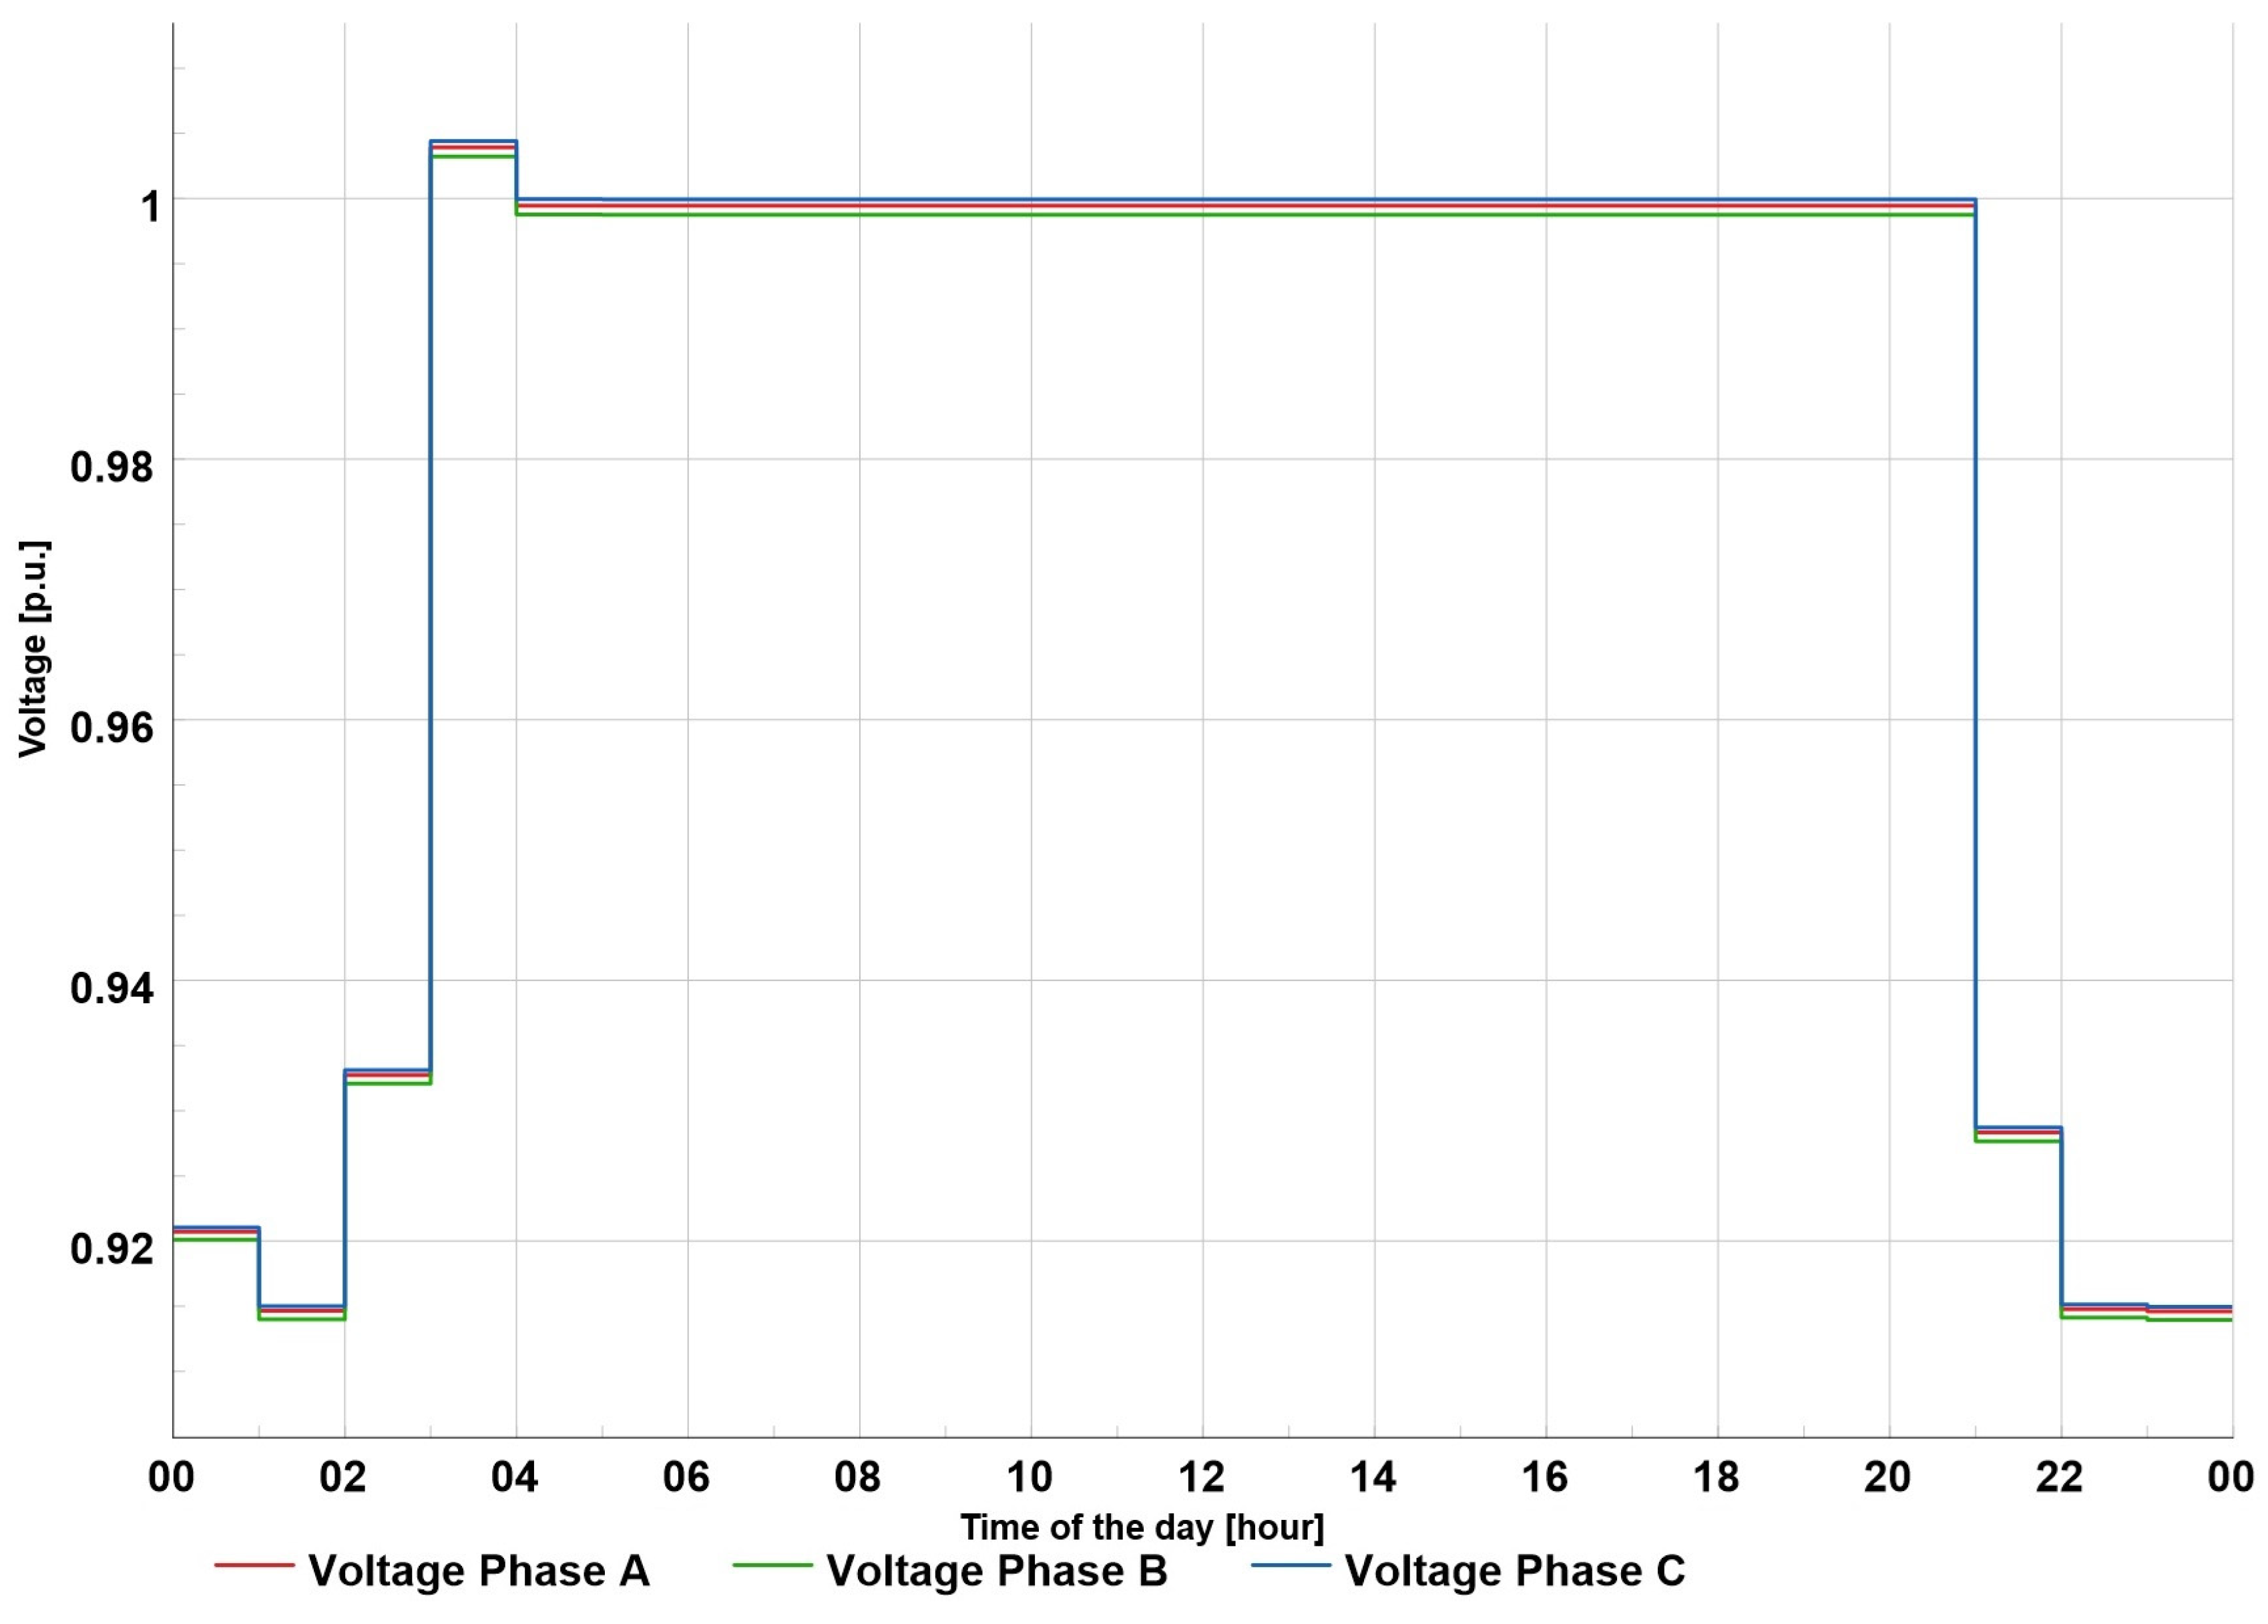
The voltage at the end user was lower than in the base scenario, but when compared with Scenario 2, the voltage drops were much lower. In addition, the voltage unbalance was significantly more pronounced. In Scenario 2 the difference between the lowest phase voltage and the highest phase voltage was 0.1 p.u., while in this case the difference was 0.3 p.u.—the lowest voltage was in phase B and amounted to 0.91 p.u., while with a value of 0.94 p.u., the phase C voltage was the highest. Energy taken from the grid is shown in Figure 15. The charging pattern remained unchanged, but the maximum power was reduced, being around 80 kW. In total, the feeder took 686 kWh from the distribution grid.
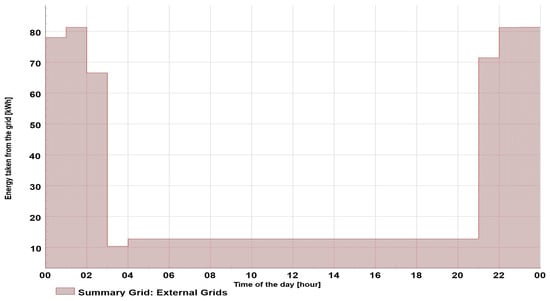
Figure 15.
Energy exchange for Scenario 4.
Considering the voltage profile at the end user located on bus 90 (Figure 16), the voltage unbalance was more pronounced than in Scenario 2. In this scenario, the lowest voltage was in phase B (value of 0.91 p.u.), which is in accordance with the values of the feeder’s voltage profile.
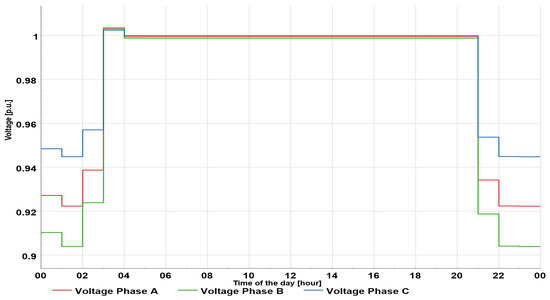
Figure 16.
Voltage profile at bus 90, Scenario 4.
Comparing the basic scenario and Scenario 4, it is clear that the voltage unbalance and energy taken from the grid increased, which was expected, given the higher power consumption. When Scenario 4 is compared with scenario 2, it is clear that by reducing the number of EV chargers, better voltage conditions would be achieved in the system. Further improvement would be achieved by a better distribution of the chargers by phase and by uniform planning and scheduling of the EV charging pattern during a 24 h period. During the day, the voltage was equal to the rated value (1 p.u.), with low unbalance between phases. However, during the night, due to the increased load, the amount of current through the feeder increased, increasing the feeder’s thermal stress and the energy losses.
5.5. Scenario 5—Maximum Acceptable Number of Single-Phase EV Chargers
In Scenario 5, the same assumptions were used as in Scenario 4, regarding the largest number of three-phase chargers with a power of 11 kW that could be integrated on the feeder without a voltage drop below 0.9 p.u. As shown in Scenario 3, integration at the level of 50% of the households with EVs would lead to an excessive voltage drop. Therefore, as in Scenario 4, the number of chargers was reduced, and these were now symmetrical; ultimately, the total number of chargers that could operate simultaneously was 11, corresponding to 12.5% of the households that could have a three-phase EV charger. The voltage profile for this scenario is shown in Figure 17—the voltages were balanced, as the load was defined by the power of the EV chargers.
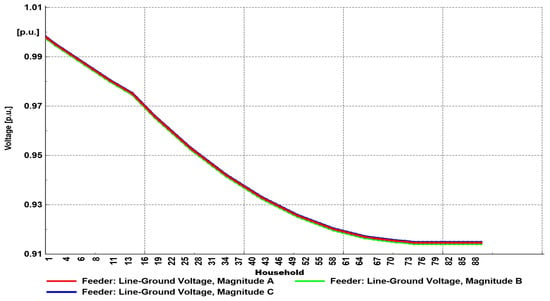
Figure 17.
Voltage profile for Scenario 5.
With 11 chargers the total power taken from the distribution grid would increase compared to the base scenario. However, compared to Scenario 3 the power taken from the grid was lower and amounted to 823.94 kWh, with a peak load of 106.1 kW (Figure 18).
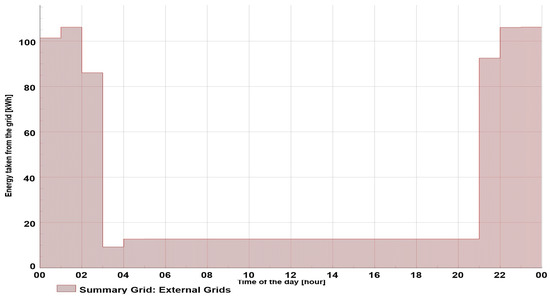
Figure 18.
Energy exchange for Scenario 5.
The reduction in peak load from 341.6 kW in Scenario 3 to 106.1 kW in Scenario 5 represents a significant load reduction in the grid. However, this power was still significant and as can be seen in Figure 19, affected the voltage levels at the last consumer. The lowest voltage occurred during the night when the chargers worked at maximum power, but with a limited number of chargers, this value would not fall below 0.91 p.u.
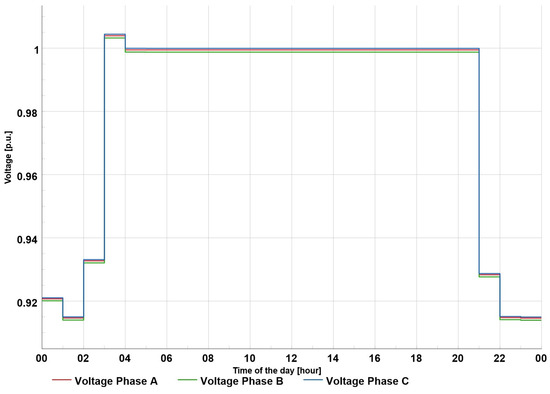
Figure 19.
Voltage profile at bus 90, Scenario 5.
5.6. Sensitivity Analysis
In the previous analyses, it was observed that the implementation of EVs could be simply considered as an increase in the load in the system. A sensitivity analysis was made for the case of random daily charging. In this case, there was no integrated rooftop PV power plant, and therefore the voltage profile did not change significantly due to their influence. By connecting an EV with a single-phase charger, stochastically, it could be seen that the unbalance between the phases increased (Figure 20). The profile was obtained for the 12th hour of the day when charging was at its peak.
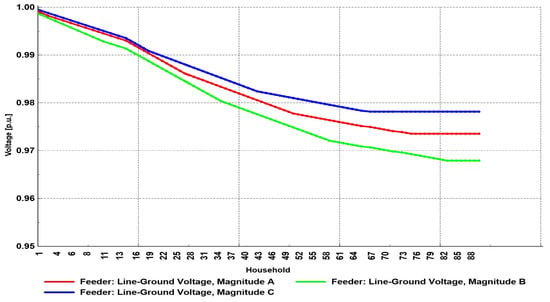
Figure 20.
Voltage profile for daytime charging.
In terms of energy exchange, or energy taken from the network, the situation remained the same, since these were the same consumers, and the household load was approximately the same during the day and night, as can be seen in Figure 21.
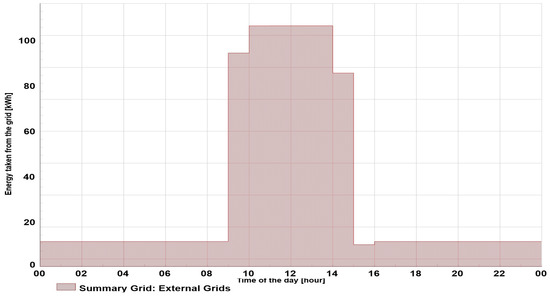
Figure 21.
Energy exchange for daytime charging.
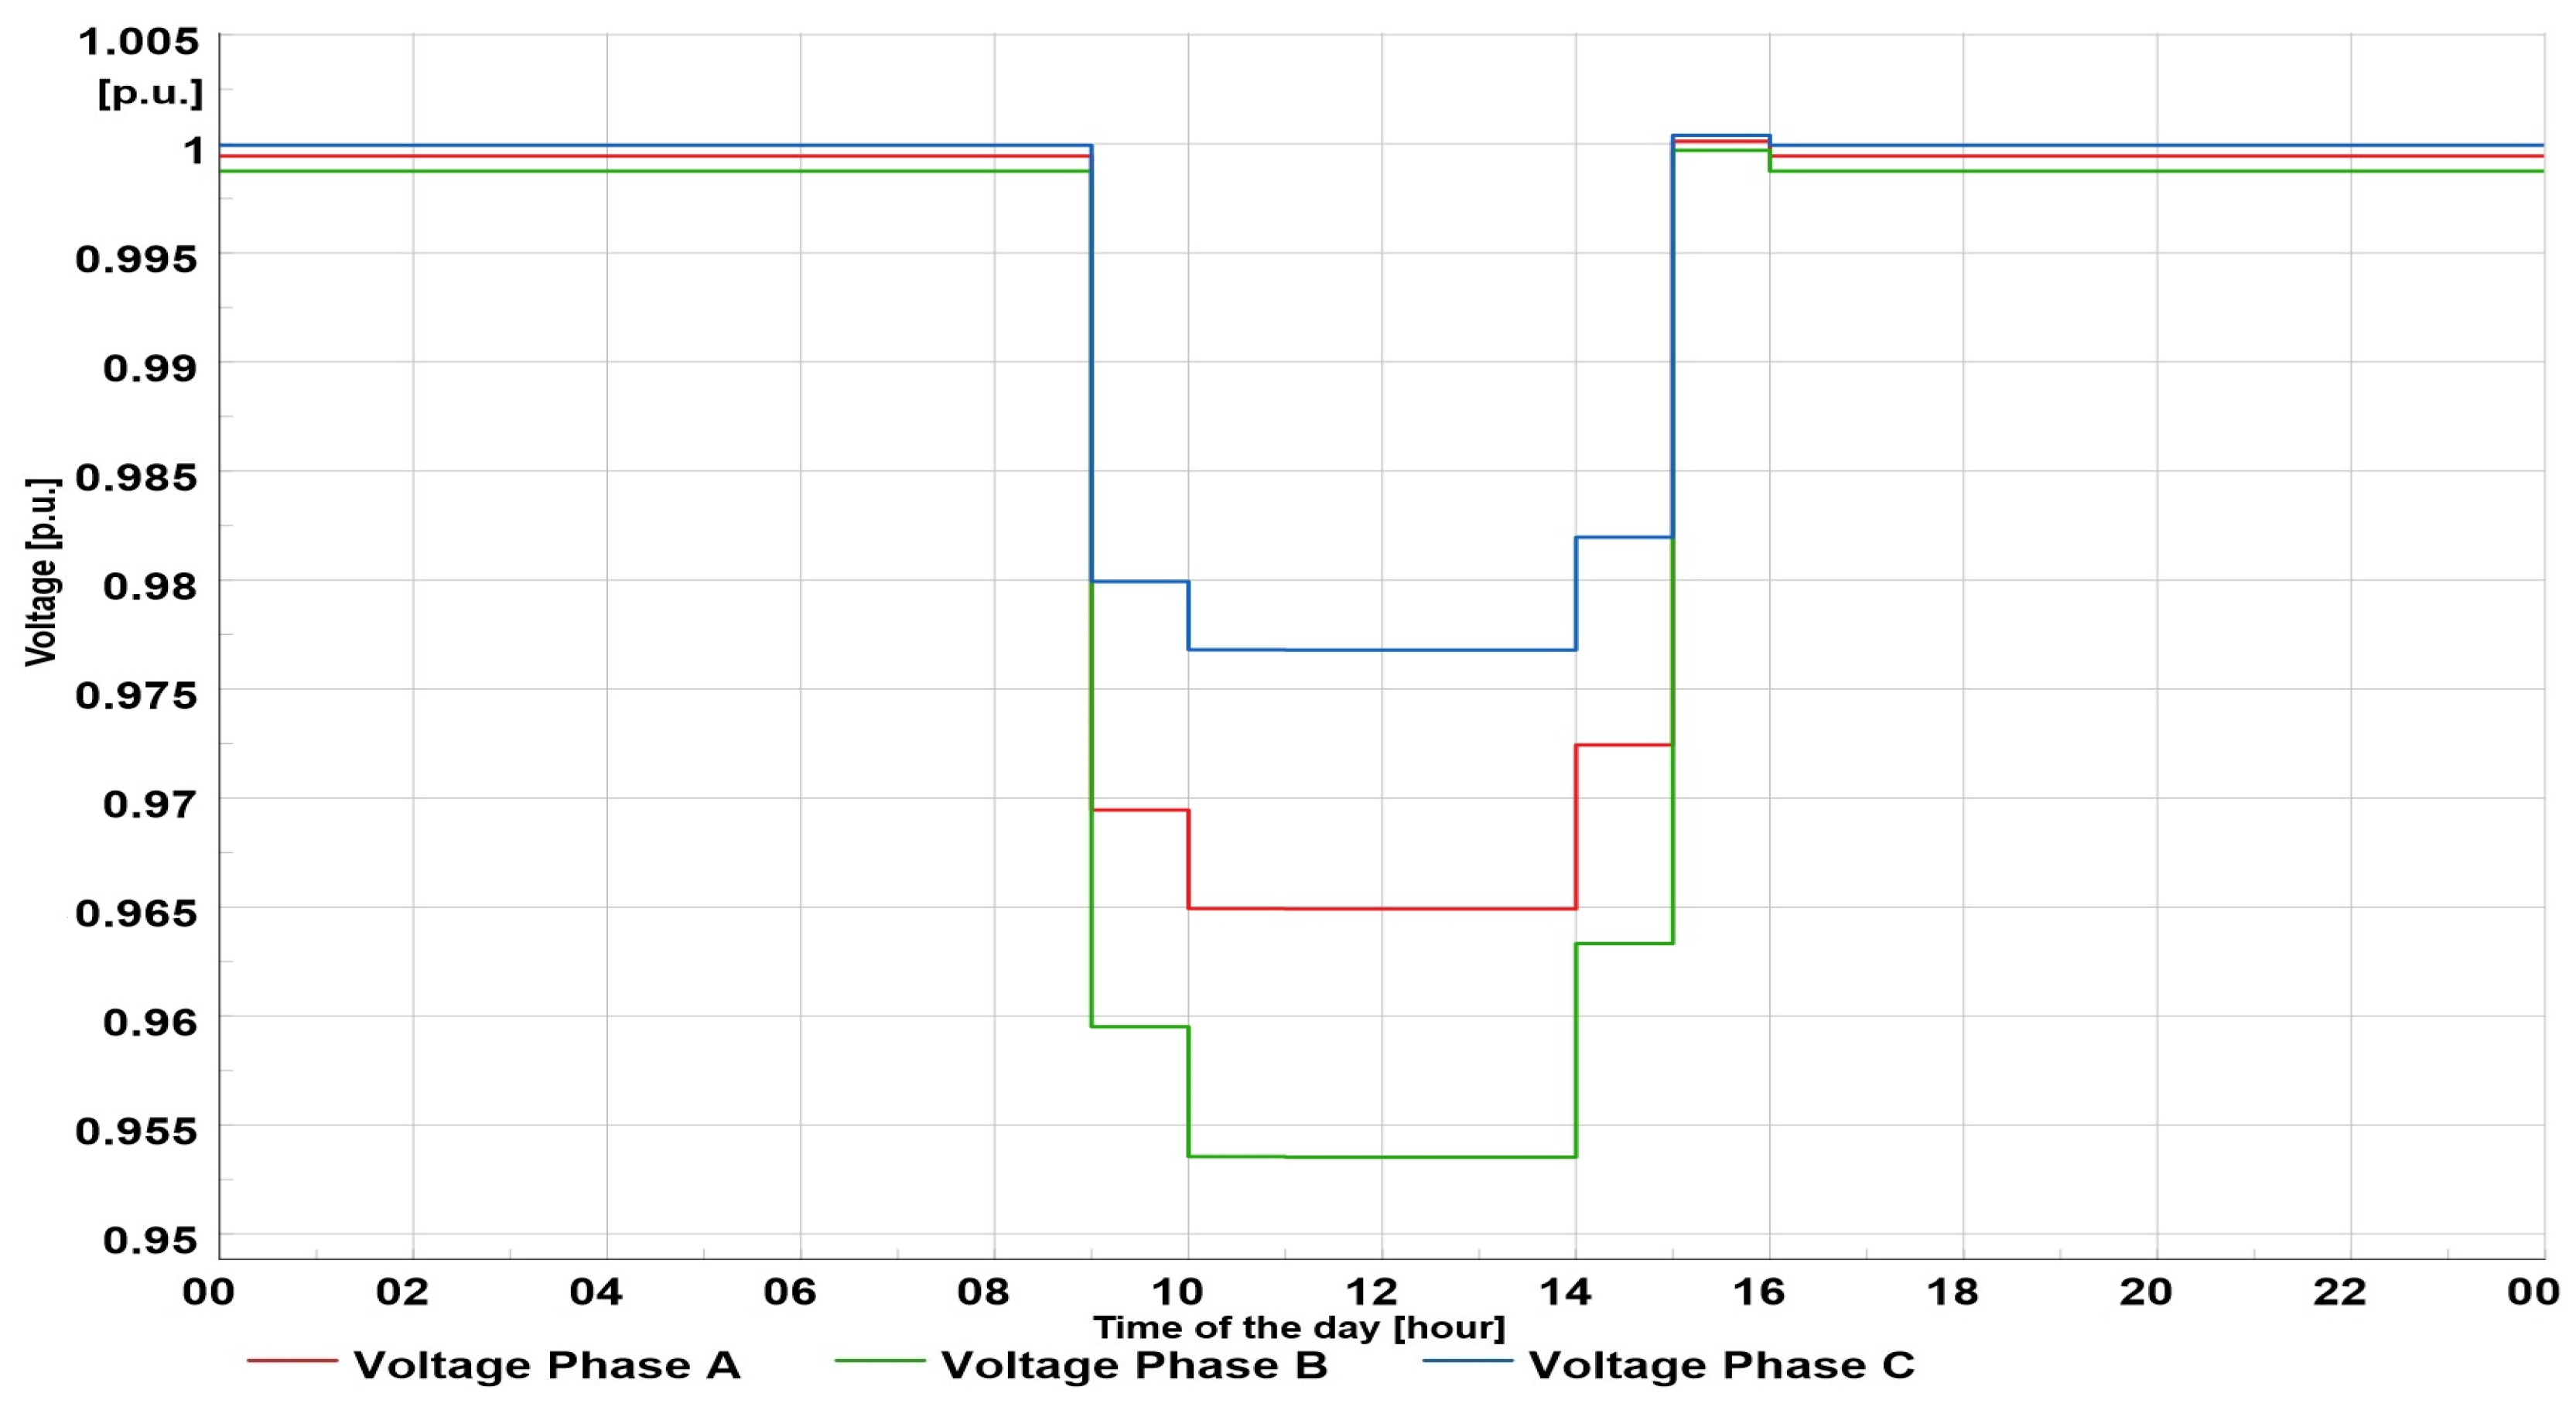
The voltage at the last consumer also changed and was the lowest during the car charging period, from the ninth to the fifteenth hour (Figure 22).
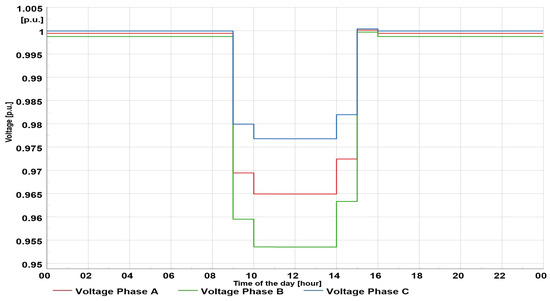
Figure 22.
Voltage profile at bus 90 for daytime charging.
Considering the previous cases, it can be seen that by changing the charging time, the load curve in the system was smoothed. Furthermore, any change, for example, delayed EV charging, would reduce the load in the system.
6. Result Comparison and Discussion
In the previous five scenarios we compared the voltage conditions along the feeder for different levels of EV charger integration and for two different charger types. Table 1 shows the voltage values at the last consumer, with the lowest phase value given for unbalanced consumers.

Table 1.
Voltage at the end of the feeder.
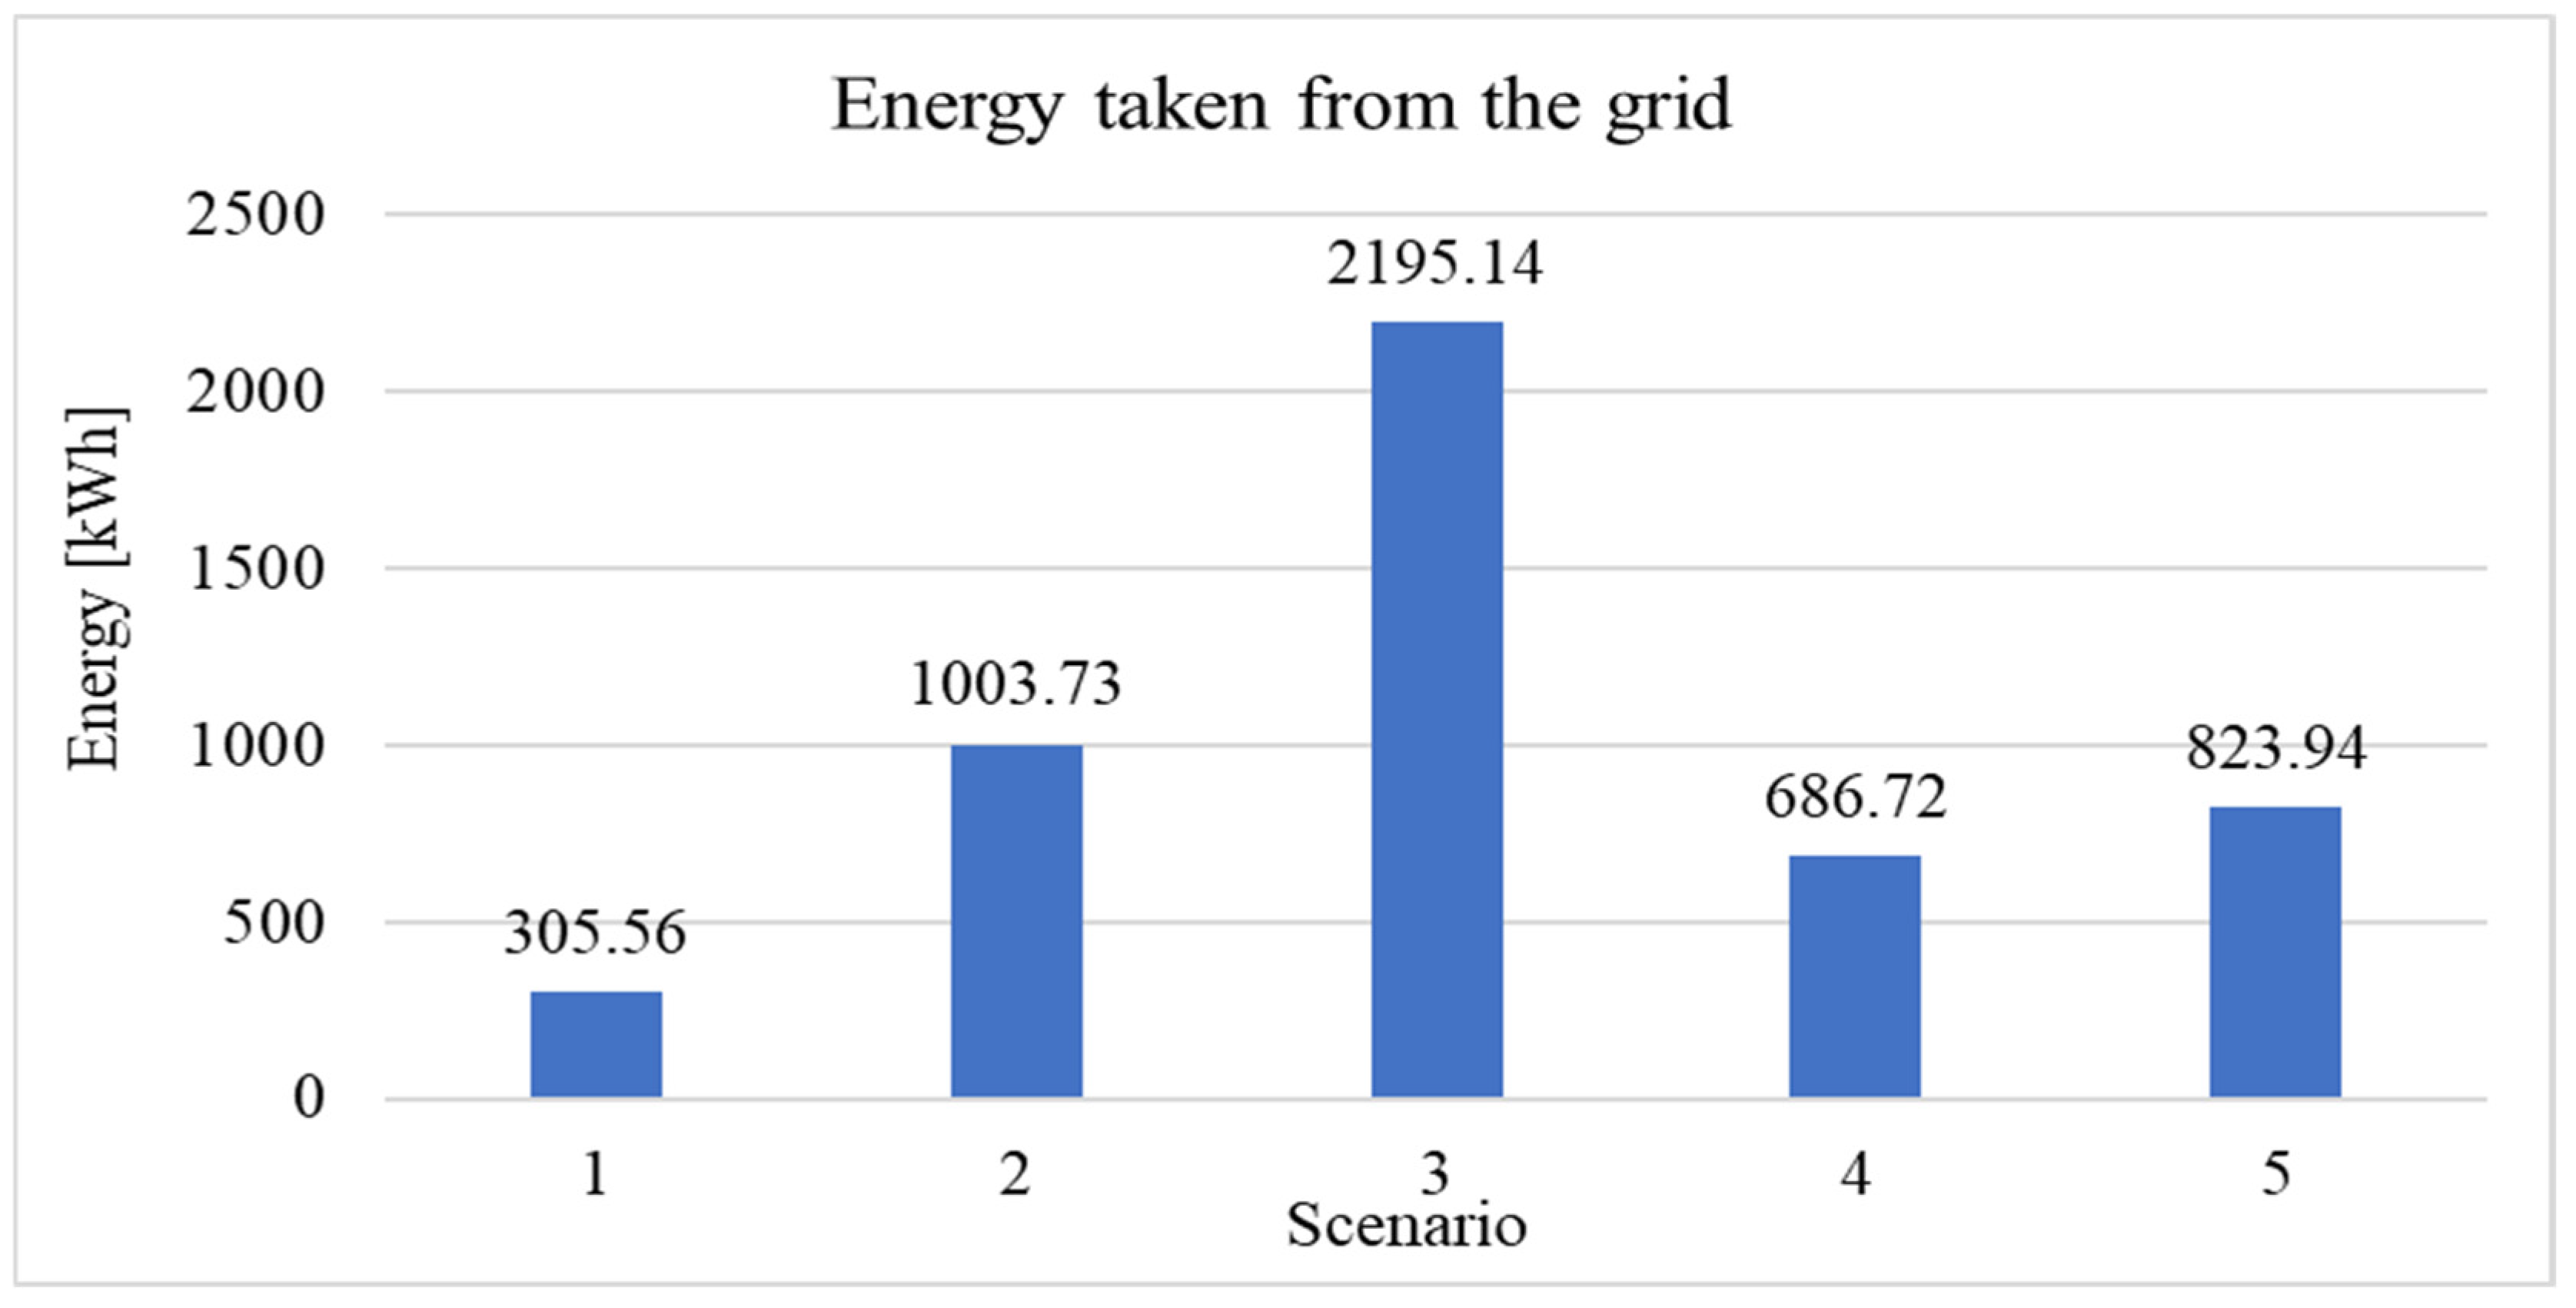
The energy taken from the grid, for each scenario, is shown in Figure 23. The highest energy value was found for Scenario 3 when integrating 44 three-phase EV chargers. When compared to Scenario 1, this was an increase of over 600%. Also, compared to all other scenarios, Scenario 3 with a high integration of three-phase EV chargers should not be allowed under any circumstances, given that the voltage on bus 90 (end user) was significantly impaired.
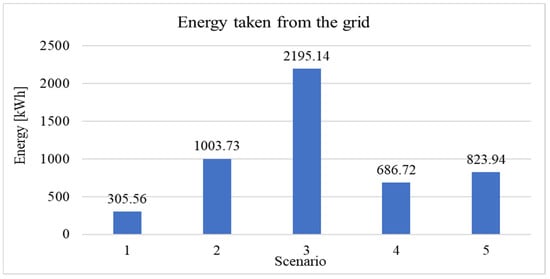
Figure 23.
Energy comparison for all scenarios.
Slightly better voltage conditions were found with the maximum proposed integration of single-phase EV chargers that had lower maximum power and were distributed evenly on all three phases, which had less impact on the voltage conditions in the feeder.
Scenarios 2 and 3 had in common that although the aim was to equip at least 50% of the households with EVs, the infrastructure was not adapted to meet this goal. Furthermore, EV charging was still stochastic and dictated by the price signals. A better distribution of the charging pattern during the day, which would result from changing consumer habits, more appropriate electricity prices that would encourage consumers to change their charging patterns, or the integration of rooftop PV plants would allow for a further increase in the number of chargers that can be connected to the feeder. The high peak power used to charge EVs puts a strain on the cables and the transformer and leads to their faster aging—all these are factors that should be taken into account when increasing electromobility.
In all previous scenarios, the angle differences, harmonics or voltage regulation devices were neglected in all analyses. Given that it was a distribution grid that dealt with specific voltage levels, in this case 0.4 kV, a short distance and a specific R/X ratio, the influence of the angle difference could be justifiably neglected, as the difference was not significant.
Since it was a distribution feeder with a regular two-winding transformer, there was no possibility of voltage regulation. A possible change would be to replace the transformer with a tap changer, which would in that case raise the voltage at the beginning of the feeder and thus improve the voltage conditions in the system, which is not a realistic option in the Croatia nor is its implementation likely in practice. Also, since the loads were defined as ordinary households, the impact of higher harmonics was ignored because according to examples from the literature and according to the authors’ available measurement data, EV charging does not contribute significantly to harmonics, which can also be seen in References [47,48]. For further analysis and future research, the following options could be considered:
- −
- Replacing the regular transformer with a regulating transformer;
- −
- Integrating a rooftop PV power plant at the consumer location, which would affect the voltage conditions and power flows in the network, but also possibly using the generated energy for EV charging or storage. In that case, harmonic analysis should also be considered.
According to the analysis, the increased integration of EVs would lead to higher transformer and line loading. From the perspective of the DSO, this poses new challenges, since no consumer can be banned from purchasing an EV or be restricted from charging it in their own household. Based on the analysis of the actual situation, the need for grid maintenance or upgrades, as well as future grid expansion, can be predicted. Currently, the existing overhead lines are being replaced with a self-supporting cable bundle as part of regular maintenance to improve reliability in rural areas and with buried cables in urban areas. In addition to improving the system reliability, the replacement takes into account the increase in household loads and increased electromobility. Since these are complex and expensive capital investments, the process is challenging and slow, and it will take a significant amount of time until all feeders are completely replaced. Another way in which the DSO can contribute to increasing electromobility is by facilitating the construction of rooftop PV power plants—by facilitating the procedure, providing incentives for construction and incentives for the installation of BESS and promoting and encouraging consumer self-sufficiency. A consumer’s decision to purchase an electric vehicle will be influenced by numerous factors, such as socio-economic factors, the availability of charging stations, the range of distances they cover, the cost of upgrading charging infrastructure or the cost of a new property purchase in the case of already integrated chargers [54].
Although this paper performed a basic analysis with a uniform distribution of EV chargers, it is clear that there is a maximum number of vehicles that can be charged simultaneously on a given feeder. As shown in other works, for example, [37], in which EVs were integrated into an urban grid, or [41], with their integration into the transmission grid, the feeder topology, available load and voltage levels have a significant impact on the number of integrated vehicles. Also, by implementing complex optimization methods, the maximum number of vehicles that can be integrated and a charging plan can be created. If there is the option of controlling the reactive energy or if the vehicles could provide reactive energy, the number of EVs can significantly increase.
The sensitivity analysis showed that even by changing the charging time, for example by charging during the day or by delayed charging, the voltage profile and the daily load curve would be smoothed. This actually paves the way towards finding the optimal charging time and method that, knowing the actual state and limitations of the network as well as the habits of EV owners, would encourage owners to charge vehicles at certain times when it is convenient from the system’s point of view—for example, by offering dynamic pricing.
7. Conclusions
In this paper, a suburban realistic radial feeder with a dominant type of household loads was used as the model for testing different integration rates of electromobility. The consumers were unbalanced, and it was assumed that there was no integrated rooftop PV power plant anywhere on the feeder, which was considered exclusively passive. For a known daily load characteristic, the influence of the integration of EV chargers, single-phase and three-phase, was considered. The level of integration was initially determined by recommendations on the share of electromobility in the amount of 50%. In both cases, for a single-phase charger with a power of 3.7 kW and a three-phase charger with a power of 11 kW, it was shown that such a level of integration was not possible, since the voltages reached the amount of 0.85 p.u. and 0.65 p.u., respectively. Therefore, there was a need to find the largest number of chargers that could be connected to such a feeder without significantly disturbing the voltage limits at the end consumer. By integrating single-phase EV chargers, the peak power was lower, the energy taken from the distribution grid was also lower, and at the same time, a larger number of chargers could be connected. The negative side was that the multiple chargers could be connected to a specific feeder, which could result in increased imbalance. On the other hand, three-phase chargers could reduce the voltage unbalance, but a smaller number of EV chargers could be integrated, with higher peak power. In addition, the stochasticity of consumer behavior needs to be added to the planning of an electromobility analysis. The scenarios were quite roughly defined with their percentages, since the stochasticity and simultaneity factors of charging affect the overall voltage profile and peak load values. The cable and transformer overload was particularly pronounced, since we considered a pure one-way energy transfer, and for further work, the integration of rooftop PV power plants, different patterns and times of EV charging, as well as simultaneity factors of charging should be taken into account.
Author Contributions
Conceptualization, R.K. and T.K.; methodology, R.K. and T.K.; software, R.K.; validation, H.G., R.K. and M.K.; formal analysis, T.K.; investigation, R.K.; resources, H.G. and R.K.; data curation, R.K.; writing—original draft preparation, T.K.; writing—review and editing, H.G.; visualization, M.K.; supervision, M.K.; project administration, M.K.; funding acquisition, R.K. All authors have read and agreed to the published version of the manuscript.
Funding
The APC was funded by the Faculty of Electrical Engineering, Computer Science and Information Technology Osijek.
Data Availability Statement
Test system data are available on request. All other data presented in this study are available on request.
Acknowledgments
This work was supported by the Croatian Science Foundation under the project “Prosumer-rich distribution power network” (project number: UIP-2020-02-5796).
Conflicts of Interest
The authors declare no conflicts of interest.
Abbreviations
The abbreviations used in this study are listed below (in order of appearances)
| Symbol | Description |
| EV | Electric vehicle |
| EU | European Union |
| BEV | Battery electric vehicle |
| PHEV | Plug-in hybrid electric vehicle |
| PV power plant | Photovoltaic power plant |
| DSO | Distribution system operator |
| V2G | Vehicle-to-grid |
| V2H | Vehicle-to-home |
| V2B | Vehicle-to-building |
| RES | Renewable energy sources |
| BESS | Battery energy storage system |
References
- Fetting, C. The European Green Deal. ESDN Rep. Dec. 2020, 2, 53. [Google Scholar]
- Amann, G.; Escobedo Bermúdez, V.R.; Boskov-Kovacs, E.; Gallego Amores, S.; Giannelos, S.; Iliceto, A.; Ilo, A.; Chavarro, J.R.; Samovich, N.; Schmitt, L.; et al. E-Mobility Deployment and Impact on Grids: Impact of EV and Charging Infrastructure on European T&D Grids–Innovation Needs; Publications Office of the European Union: Brussels, Belgium, 2022. [Google Scholar]
- Schneider Electric. (n.d.). Electric Vehicle Trends. Available online: https://www.electrical-installation.org/enwiki/Electric_Vehicle_trends (accessed on 12 March 2025).
- The Croatian Parliament, Building Act, Official Gazette 125/19. 2019. Available online: https://narodne-novine.nn.hr/clanci/sluzbeni/2019_12_125_2489.html, (accessed on 12 March 2025).
- Center for Vehicles of Croatia (CVH). Statistics on the Number of Electric and Hybrid Vehicles (2007–2024). Available online: https://cvh.hr/gradani/tehnicki-pregled/statistika/ (accessed on 13 March 2025).
- Eurostat, Official Website for European Statistics. Available online: https://ec.europa.eu/eurostat/statistics-explained/index.php?title=Transport_equipment_statistics#Road_transport_equipmentNordic_countries_led_the_new_zero-emission_vehicles_.28ZEV.29_registered_in_2023 (accessed on 17 July 2024).
- Mišljenović, N.; Žnidarec, M.; Knežević, G.; Topić, D. Electric Vehicles as Flexible Assets for Households and System Operators: Survey Results. In Proceedings of the 2024 International Conference on Smart Systems and Technologies (SST), Osijek, Croatia, 16–18 October 2024; pp. 1–7. [Google Scholar] [CrossRef]
- Gonzalez Venegas, F.; Petit, M.; Perez, Y. Active integration of electric vehicles into distribution grids: Barriers and frameworks for flexibility services. Renew. Sustain. Energy Rev. 2021, 145, 111060. [Google Scholar] [CrossRef]
- Habib, S.; Khan, M.M.; Hashmi, K.; Ali, M.; Tang, H. A comparative study of electric vehicles concerning charging infrastructure and power levels. In Proceedings of the 2017 International Conference on Frontiers of Information Technology (FIT), Islamabad, Pakistan, 18–20 December 2017; pp. 327–332. [Google Scholar] [CrossRef]
- Habib, S.; Khan, M.M.; Huawei, J.; Hashmi, K.; Faiz, M.T.; Tang, H. A study of implemented international standards and infrastructural system for electric vehicles. In Proceedings of the 2018 IEEE International Conference on Industrial Technology (ICIT), Greenville, SC, USA, 4–8 March 2012; pp. 1783–1788. [Google Scholar] [CrossRef]
- Yilmaz, M.; Krein, P.T. Review of charging power levels and infrastructure for plug-in electric and hybrid vehicles. In Proceedings of the 2012 IEEE International Electric Vehicle Conference, Greenville, SC, USA, 4–8 March 2012; pp. 1–8. [Google Scholar] [CrossRef]
- Zakaria, A.; Chengyan, D.; Zafar, H.; Djokic, S.Z. After diversity maximum demand and daily load profiles of maximum demand for uncontrolled residential EV charging. In Proceedings of the 2023 IEEE PES Innovative Smart Grid Technologies Europe (ISGT EUROPE), Grenoble, France, 23–26 October 2023; pp. 1–5. [Google Scholar] [CrossRef]
- Lojowska, A.; Kurowicka, D.; Papaefthymiou, G.; van der Sluis, L. From transportation patterns to power demand: Stochastic modeling of uncontrolled domestic charging of electric vehicles. In Proceedings of the 2011 IEEE Power and Energy Society General Meeting, Detroit, MI, USA, 24–28 July 2011; pp. 1–7. [Google Scholar] [CrossRef]
- Ayala, H.E.V.; Barriga, N.G. Study of the impact of electric vehicles fleets in HV electric power grids based on an uncontrolled charging strategy. In Proceedings of the 2017 IEEE International Autumn Meeting on Power, Electronics and Computing (ROPEC), Ixtapa, Mexico, 8–10 November 2017; pp. 1–6. [Google Scholar] [CrossRef]
- Yu, Y.; Shekhar, A.; Mouli, G.C.R.; Bauer, P.; Refa, N.; Bernards, R. Impact of uncontrolled charging with mass deployment of electric vehicles on low voltage distribution networks. In Proceedings of the 2020 IEEE Transportation Electrification Conference & Expo (ITEC), Chicago, IL, USA, 23–26 June 2020; pp. 766–772. [Google Scholar] [CrossRef]
- Jäger, G.; Hofer, C.; Füllsack, M. The benefits of randomly delayed charging of electric vehicles. Sustainability 2019, 11, 3722. [Google Scholar] [CrossRef]
- Daziano, R.A. Willingness to delay charging of electric vehicles. Res. Transp. Econ. 2022, 94, 101177. [Google Scholar] [CrossRef]
- Williams, B.; Bishop, D.; Hooper, G.; Chase, J.G. Driving change: Electric vehicle charging behavior and peak loading. Renew. Sustain. Energy Rev. 2024, 189, 113953. [Google Scholar] [CrossRef]
- Pandit, A.K.; Bhalja, B.R.; Seshadrinath, J. EV charging coordination based energy management system for a grid-tied charging station integrated with PV-ESS. In Proceedings of the 2023 IEEE International Conference on Energy Technologies for Future Grids (ETFG), Wollongong, Australia, 3–6 December 2023; pp. 1–6. [Google Scholar] [CrossRef]
- Mastoi, M.S.; Zhuang, S.; Munir, H.M.; Haris, M.; Hassan, M.; Alqarni, M.; Alamri, B. A study of charging-dispatch strategies and vehicle-to-grid technologies for electric vehicles in distribution networks. Energy Rep. 2023, 9, 1777–1806. [Google Scholar] [CrossRef]
- Fasugba, M.A.; Krein, P.T. Gaining vehicle-to-grid benefits with unidirectional electric and plug-in hybrid vehicle chargers. In Proceedings of the 2011 IEEE Vehicle Power and Propulsion Conference, Chicago, IL, USA, 6–9 September 2011; pp. 1–6. [Google Scholar] [CrossRef]
- Rana, M.M.; Alam, S.M.; Rafi, F.A.; Deb, S.B.; Agili, B.; He, M.; Ali, M.H. Comprehensive review on the charging technologies of electric vehicles (EV) and their impact on power grid. IEEE Access 2025, 13, 35124–35156. [Google Scholar] [CrossRef]
- Liu, C.; Chau, K.T.; Wu, D.; Gao, S. Opportunities and challenges of vehicle-to-home, vehicle-to-vehicle, and vehicle-to-grid technologies. Proc. IEEE 2013, 101, 2409–2427. [Google Scholar] [CrossRef]
- Gamallo, C.; Fraile-Ardanuy, J. Stochastic aggregated battery for vehicle to building applications. In Proceedings of the 2012 IEEE International Energy Conference and Exhibition (ENERGYCON), Florence, Italy, 9–12 September 2012; pp. 749–754. [Google Scholar] [CrossRef]
- Ghaderi, A.; Nassiraei, A.A.F. The economics of using electric vehicles for vehicle to building applications considering the effect of battery degradation. In Proceedings of the IECON 2015–41st Annual Conference of the IEEE Industrial Electronics Society, Yokohama, Japan, 9–12 November 2015; pp. 3567–3572. [Google Scholar] [CrossRef]
- Marmaras, C.; Corsaro, M.; Xydas, E.; Cipcigan, L.M.; Pastorelli, M.A. Vehicle-to-building control approach for EV charging. In Proceedings of the 2014 49th International Universities Power Engineering Conference (UPEC), Cluj-Napoca, Romania, 2–5 September 2014; pp. 1–6. [Google Scholar] [CrossRef]
- Arya, T.; Saxena, D.; Misra, P. Optimizing electricity bill, grid performance, and user satisfaction in a comprehensive home energy management system with electric vehicles and home-to-grid capabilities. In Proceedings of the 2023 International Conference on Electrical, Electronics, Communication and Computers (ELEXCOM), Roorkee, India, 26–27 August 2023; pp. 1–6. [Google Scholar] [CrossRef]
- Mohanty, S.; Panda, S.; Parida, S.M.; Rout, P.K.; Sahu, B.K.; Bajaj, M.; Zawbaa, H.M.; Kumar, N.M.; Kamel, S. Demand side management of electric vehicles in smart grids: A survey on strategies, challenges, modeling, and optimization. Energy Rep. 2022, 8, 12466–12490. [Google Scholar] [CrossRef]
- Khemakhem, S.; Rekik, M.; Krichen, L. Double layer home energy supervision strategies based on demand response and plug-in electric vehicle control for flattening power load curves in a smart grid. Energy 2019, 167, 312–324. [Google Scholar] [CrossRef]
- Qian, K.; Zhou, C.; Yuan, Y. Impacts of high penetration level of fully electric vehicles charging loads on the thermal ageing of power transformers. Int. J. Electr. Power Energy Syst. 2015, 65, 102–112. [Google Scholar] [CrossRef]
- Visakh, A.; Selvan, M.P. Seasonal effects of electric vehicle charging on the aging of distribution transformers. In Proceedings of the 2021 13th IEEE PES Asia Pacific Power & Energy Engineering Conference (APPEEC), Thiruvananthapuram, India, 21–23 November 2021; pp. 1–6. [Google Scholar] [CrossRef]
- Pavlićević, A.; Mujović, S. Impact of reactive power from public electric vehicle stations on transformer aging and active energy losses. Energies 2022, 15, 7085. [Google Scholar] [CrossRef]
- Jadhav, M.P.; Kalkhambkar, V.N. Frequency regulation by electric vehicle. In Proceedings of the 2018 International Conference on Current Trends towards Converging Technologies (ICCTCT), Coimbatore, India, 1–3 March 2018; pp. 1–6. [Google Scholar] [CrossRef]
- Dong, X.; Ma, Y.; Yu, X.; Wei, X.; Ren, Y.; Zhang, X. Secondary frequency regulation control strategy with electric vehicles considering user travel uncertainty. Energies 2023, 16, 3794. [Google Scholar] [CrossRef]
- Shrivastava, S.; Khalid, S.; Nishad, D.K. Impact of EV interfacing on peak-shelving and frequency regulation in a microgrid. Sci. Rep. 2024, 14, 31514. [Google Scholar] [CrossRef]
- Xue, Y.; Chen, Q.; Cai, H.; Xia, M.; Gu, H. Conflict mechanism analysis method for electric vehicles participating in multiple types of power grid ancillary services. In Proceedings of the 2023 International Conference on Power System Technology (PowerCon), Jinan, China, 21–22 September 2023; pp. 1–6. [Google Scholar] [CrossRef]
- Zhou, C.; Xiang, Y.; Huang, Y.; Wei, X.; Liu, Y.; Liu, J. Economic analysis of auxiliary service by V2G: City comparison cases. Energy Rep. 2020, 6, 509–514. [Google Scholar] [CrossRef]
- Carrión, M.; Zárate-Miñano, R.; Domínguez, R. Integration of electric vehicles in low-voltage distribution networks considering voltage management. Energies 2020, 13, 4125. [Google Scholar] [CrossRef]
- Chen, J.; Bei, G.; Zhang, Q.; Huang, L.; Liu, K.; Chen, P. Integrated reactive power optimization for distribution systems considering electric vehicle dis-/charging support. Energy Rep. 2023, 9, 1888–1896. [Google Scholar] [CrossRef]
- Yong, J.Y.; Ramachandaramurthy, V.K.; Tan, K.M.; Mithulananthan, N. A review on the state-of-the-art technologies of electric vehicle, its impacts and prospects. Renew. Sustain. Energy Rev. 2015, 49, 365–385. [Google Scholar] [CrossRef]
- Azzopardi, B.; Gabdullin, Y. Impacts of electric vehicles charging in low-voltage distribution networks: A case study in Malta. Energies 2024, 17, 289. [Google Scholar] [CrossRef]
- Rahman, S.; Khan, I.A.; Khan, A.A.; Mallik, A.; Nadeem, M.F. Comprehensive review & impact analysis of integrating projected electric vehicle charging load to the existing low voltage distribution system. Renew. Sustain. Energy Rev. 2022, 153, 111756. [Google Scholar] [CrossRef]
- Zárate-Miñano, R.; Flores Burgos, A.; Carrión, M. Analysis of different modeling approaches for integration studies of plug-in electric vehicles. Int. J. Electr. Power Energy Syst. 2020, 114, 105398. [Google Scholar] [CrossRef]
- Ye, Z.; Li, T.; Low, S. Towards balanced three-phase charging: Phase optimization in adaptive charging networks. Electr. Power Syst. Res. 2022, 212, 108322. [Google Scholar] [CrossRef]
- Farahani, H.F. Improving voltage unbalance of low-voltage distribution networks using plug-in electric vehicles. J. Clean. Prod. 2017, 148, 336–346. [Google Scholar] [CrossRef]
- Mexis, I.; Todeschini, G.; Möller, F.; Meyer, J. Mitigation of voltage unbalance in rural low voltage networks using single-phase BESS inverters. In Proceedings of the CIRED 2021-The 26th International Conference and Exhibition on Electricity Distribution, Online, 20–23 September 2021; pp. 789–794. [Google Scholar] [CrossRef]
- Dávila-Sacoto, M.; González, L.G.; Hernández-Callejo, L.; Duque-Perez, Ó.; Zorita-Lamadrid, Á.L.; Alonso-Gómez, V.; Espinoza, J.L. Harmonic Distortion and Hosting Capacity in Electrical Distribution Systems with High Photovoltaic Penetration: The Impact of Electric Vehicles. Electronics 2023, 12, 2415. [Google Scholar] [CrossRef]
- Ahmed, A.; Iqbal, A.; Khan, I.; Al-Wahedi, A.; Mehrjerdi, H.; Rahman, S. Impact of EV charging station penetration on harmonic distortion level in utility distribution network: A case study of Qatar. In Proceedings of the 2021 IEEE Texas Power and Energy Conference (TPEC), College Station, TX, USA, 2–5 February 2021; pp. 1–6. [Google Scholar] [CrossRef]
- European Committee for Electrotechnical Standardization. Voltage characteristics of electricity supplied by public electricity networks. In CENELEC EN 50160; CENELEC: Brussels, Belgium, 2022. [Google Scholar]
- Anagnostopoulos, P.M.; Papathanassiou, S.A. A power flow method for radial distribution feeders with DER penetration. J. Technol. Innov. Renew. Energy 2019, 8, 1–12. [Google Scholar] [CrossRef]
- Kovačević, T. Utjecaj Elektromobilnosti na Distribucijsku Mrežu (The Impact of Electromobility on the Distribution Network). Master’s Thesis, Josip Juraj Strossmayer University of Osijek, Faculty of Electrical Engineering, Computer Science and Information Technology, Osijek, Croatia, 2023. Available online: https://repozitorij.etfos.hr/en/islandora/object/etfos%3A4407/datastream/PDF/view (accessed on 1 May 2025). (In Croatian).
- Kljajić, R.; Mišljenović, N.; Marić, P. Impact of the Increasing Integration of Photovoltaic Systems and Charging Stations for Electric Vehicles with Vehicle-To-Grid Concept on Voltage Stability of the Distribution Grid. In Proceedings of the IEEE EUROCON 2023–20th International Conference on Smart Technologies, Torino, Italy, 6–8 July 2023; pp. 671–676. [Google Scholar] [CrossRef]
- Kljajić, R.; Marić, P.; Mišljenović, N.; Dubravac, M. An Optimized Strategy for the Integration of Photovoltaic Systems and Electric Vehicles into the Real Distribution Grid. Energies 2024, 17, 5602. [Google Scholar] [CrossRef]
- Hoffmann, J.; Szkudlarek, V.; Ludin, D.; Schreier, N.; Mueller Ei Wellbrock, W. Factors Influencing the Purchase of Battery Electric Vehicles (BEVs): An Explorative Study Based on the Analysis of New Registrations and Expert Interviews in Germany. Teh. Glas. 2025, 19, 359–367. [Google Scholar] [CrossRef]
Disclaimer/Publisher’s Note: The statements, opinions and data contained in all publications are solely those of the individual author(s) and contributor(s) and not of MDPI and/or the editor(s). MDPI and/or the editor(s) disclaim responsibility for any injury to people or property resulting from any ideas, methods, instructions or products referred to in the content. |
© 2025 by the authors. Published by MDPI on behalf of the World Electric Vehicle Association. Licensee MDPI, Basel, Switzerland. This article is an open access article distributed under the terms and conditions of the Creative Commons Attribution (CC BY) license (https://creativecommons.org/licenses/by/4.0/).

